
Crypto World
$5M Is Up for Grabs as ZKP Rolls Out Its Biggest Giveaway, While ASTER and ADA Stay Stuck

Market activity lately shows caution instead of strong follow-through. Large-cap coins are struggling to push higher, with prices moving sideways as traders reassess exposure. Cardano continues to hover near well-known price levels, showing little urgency from buyers or sellers.
At the same time, ASTER crypto is starting to draw attention due to tightening price action and signs of improving strength beneath the surface. In this setting, the discussion around the best crypto to buy now is no longer based only on short-term charts.
This broader view is where Zero Knowledge Proof enters the conversation. While many major coins lack momentum, ZKP is gaining visibility through how participation is structured. A clearly defined presale model and a $5 million giveaway are driving interest. These elements are shaping how traders judge opportunity when price movement across the market slows, and structure becomes more important.
ASTER Builds Pressure as Buyers Hold Key Support
ASTER crypto is showing a clear compression pattern on the daily chart. A falling wedge has formed, defined by lower highs and lower lows moving closer together. Price has respected both trendlines multiple times, suggesting selling pressure is losing strength rather than increasing. Buyers continue to step in during pullbacks, especially in the $0.63 to $0.65 range, where demand has remained steady.
This buying interest has helped ASTER stabilize after a prior decline. The market cap, which previously climbed above $1.7 billion, found support around $1.45 billion. Since then, valuation has started to recover at a measured pace. Trading volume during this phase has stayed balanced, pointing to supply being absorbed instead of short-term speculation driving price swings.

From a technical view, a confirmed move above the upper wedge boundary near $0.66 to $0.67 would shift attention toward higher levels around $1.45 to $1.50. Until that happens, ASTER crypto continues to tighten. This steady buildup keeps it relevant in discussions about the best crypto to buy now when the wider market lacks direction.
Cardano Holds Range as Long-Term Expectations Stay Intact
Cardano shows a different picture. ADA has been consolidating near important support after a broader pullback, trading around the mid-$0.35 area. Short-term charts display a tightening triangle, reflecting a balance between buyers and sellers rather than clear control from either side.
Market observers point to $0.38 as an early level to watch. A move above that area could open space toward $0.48 to $0.50, which would represent roughly a 30% advance if sustained. Until such confirmation appears, the Cardano price prediction 2026 remains tied to structure rather than immediate action.

Beyond price, Cardano continues to post steady network progress. Total transactions have crossed 118 million, highlighting ongoing usage. Tools like the Leios mempool visualizer show continued focus on improving infrastructure. ETF-related filings that include ADA and comments from leadership about future integrations add context. Even so, the price remains confined. As a result, the Cardano price prediction 2026 remains a longer-term discussion until a clear breakout takes place.
ZKP Gains Attention Through Fair Access and Clear Verification
ZKP’s growing presence is not driven by sharp price movement. Instead, it comes from how participation is organized. The most visible element is its $5 million giveaway, divided equally among 10 winners, with each receiving $500,000. This initiative runs alongside the presale and follows the same rules for every participant. There are no early access tiers or preferred entries, keeping focus on equal participation rather than timing advantages. This setup is often referenced when ZKP appears in discussions about the best crypto to buy now during quieter market phases.
Distribution mechanics reinforce that approach. ZKP uses a daily on-chain proportional auction that resets every 24 hours. Allocations are based on each participant’s share of total daily contributions. During Stage 2, up to 190 million ZKP are available per day. Future stages reduce the daily amount across a total of 17 stages. Any ZKP not allocated in a given day is burned permanently. Supply does not roll over, making each stage independent and supply changes clear.
Verification adds another layer. ZKP is designed to confirm activity without revealing sensitive data. Zero-knowledge proofs are used to verify outcomes on-chain while keeping inputs private. This allows results to be checked without exposing how they were produced. The focus stays on proving that work was completed correctly, which aligns with AI-related tasks where accuracy and confidentiality both matter.

Together, the giveaway, auction structure, and verification model form a consistent participation framework. ZKP is positioned around rules, access, and validation rather than short-term momentum. This explains why it continues to surface in conversations about the best crypto to buy now when markets slow, and structure takes priority.
Final Thoughts
Current conditions highlight clear differences across projects. ASTER crypto is tightening toward a possible technical resolution, while Cardano remains locked in consolidation, waiting for confirmation. These patterns continue to shape short-term positioning and the broader Cardano price prediction 2026 outlook.
At the same time, ZKP is being evaluated through a different lens. Instead of relying on immediate price expansion, it emphasizes structured access, transparent distribution, and verifiable activity. As traders reconsider what defines the best crypto to buy now, these factors are playing a larger role alongside chart analysis.

Explore Zero Knowledge Proof:
Website: https://zkp.com/
Buy: https://buy.zkp.com/
Telegram: https://t.me/ZKPofficial
Disclaimer: This is a Press Release provided by a third party who is responsible for the content. Please conduct your own research before taking any action based on the content.


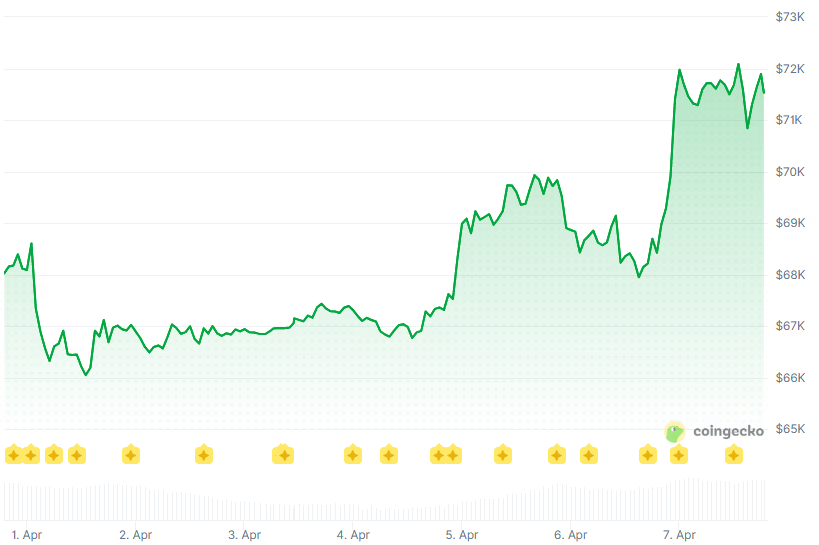
Bitcoin touched a three-week high above $72,700 while $470 million in short positions were liquidated as geopolitical tensions eased.
Crypto markets rallied sharply on Wednesday as a surprise two-week ceasefire between the U.S. and Iran sent Bitcoin to its highest level since mid-March.
Bitcoin is changing hands at $71,638, up 4.3% over the past 24 hours, according to CoinGecko. Ethereum climbed 6% to $2,220, while the total crypto market capitalization rose nearly 4% to $2.51 trillion.

Ceasefire Sparks Short Squeeze
The rally kicked off on Tuesday evening after President Trump announced a conditional two-week ceasefire with Iran, agreeing to suspend military operations for two weeks pending further negotiations. Pakistan’s Prime Minister Shehbaz Sharif brokered the deal, with formal peace talks scheduled to begin Friday in Islamabad.
CoinGlass data showed approximately $654 million in crypto futures positions were liquidated over 24 hours, with bearish short bets accounting for roughly $470 million of the total.
The Crypto Fear and Greed Index recovered to 17, up from a low of 9 earlier in the week, but it remains deep in “extreme fear” territory.
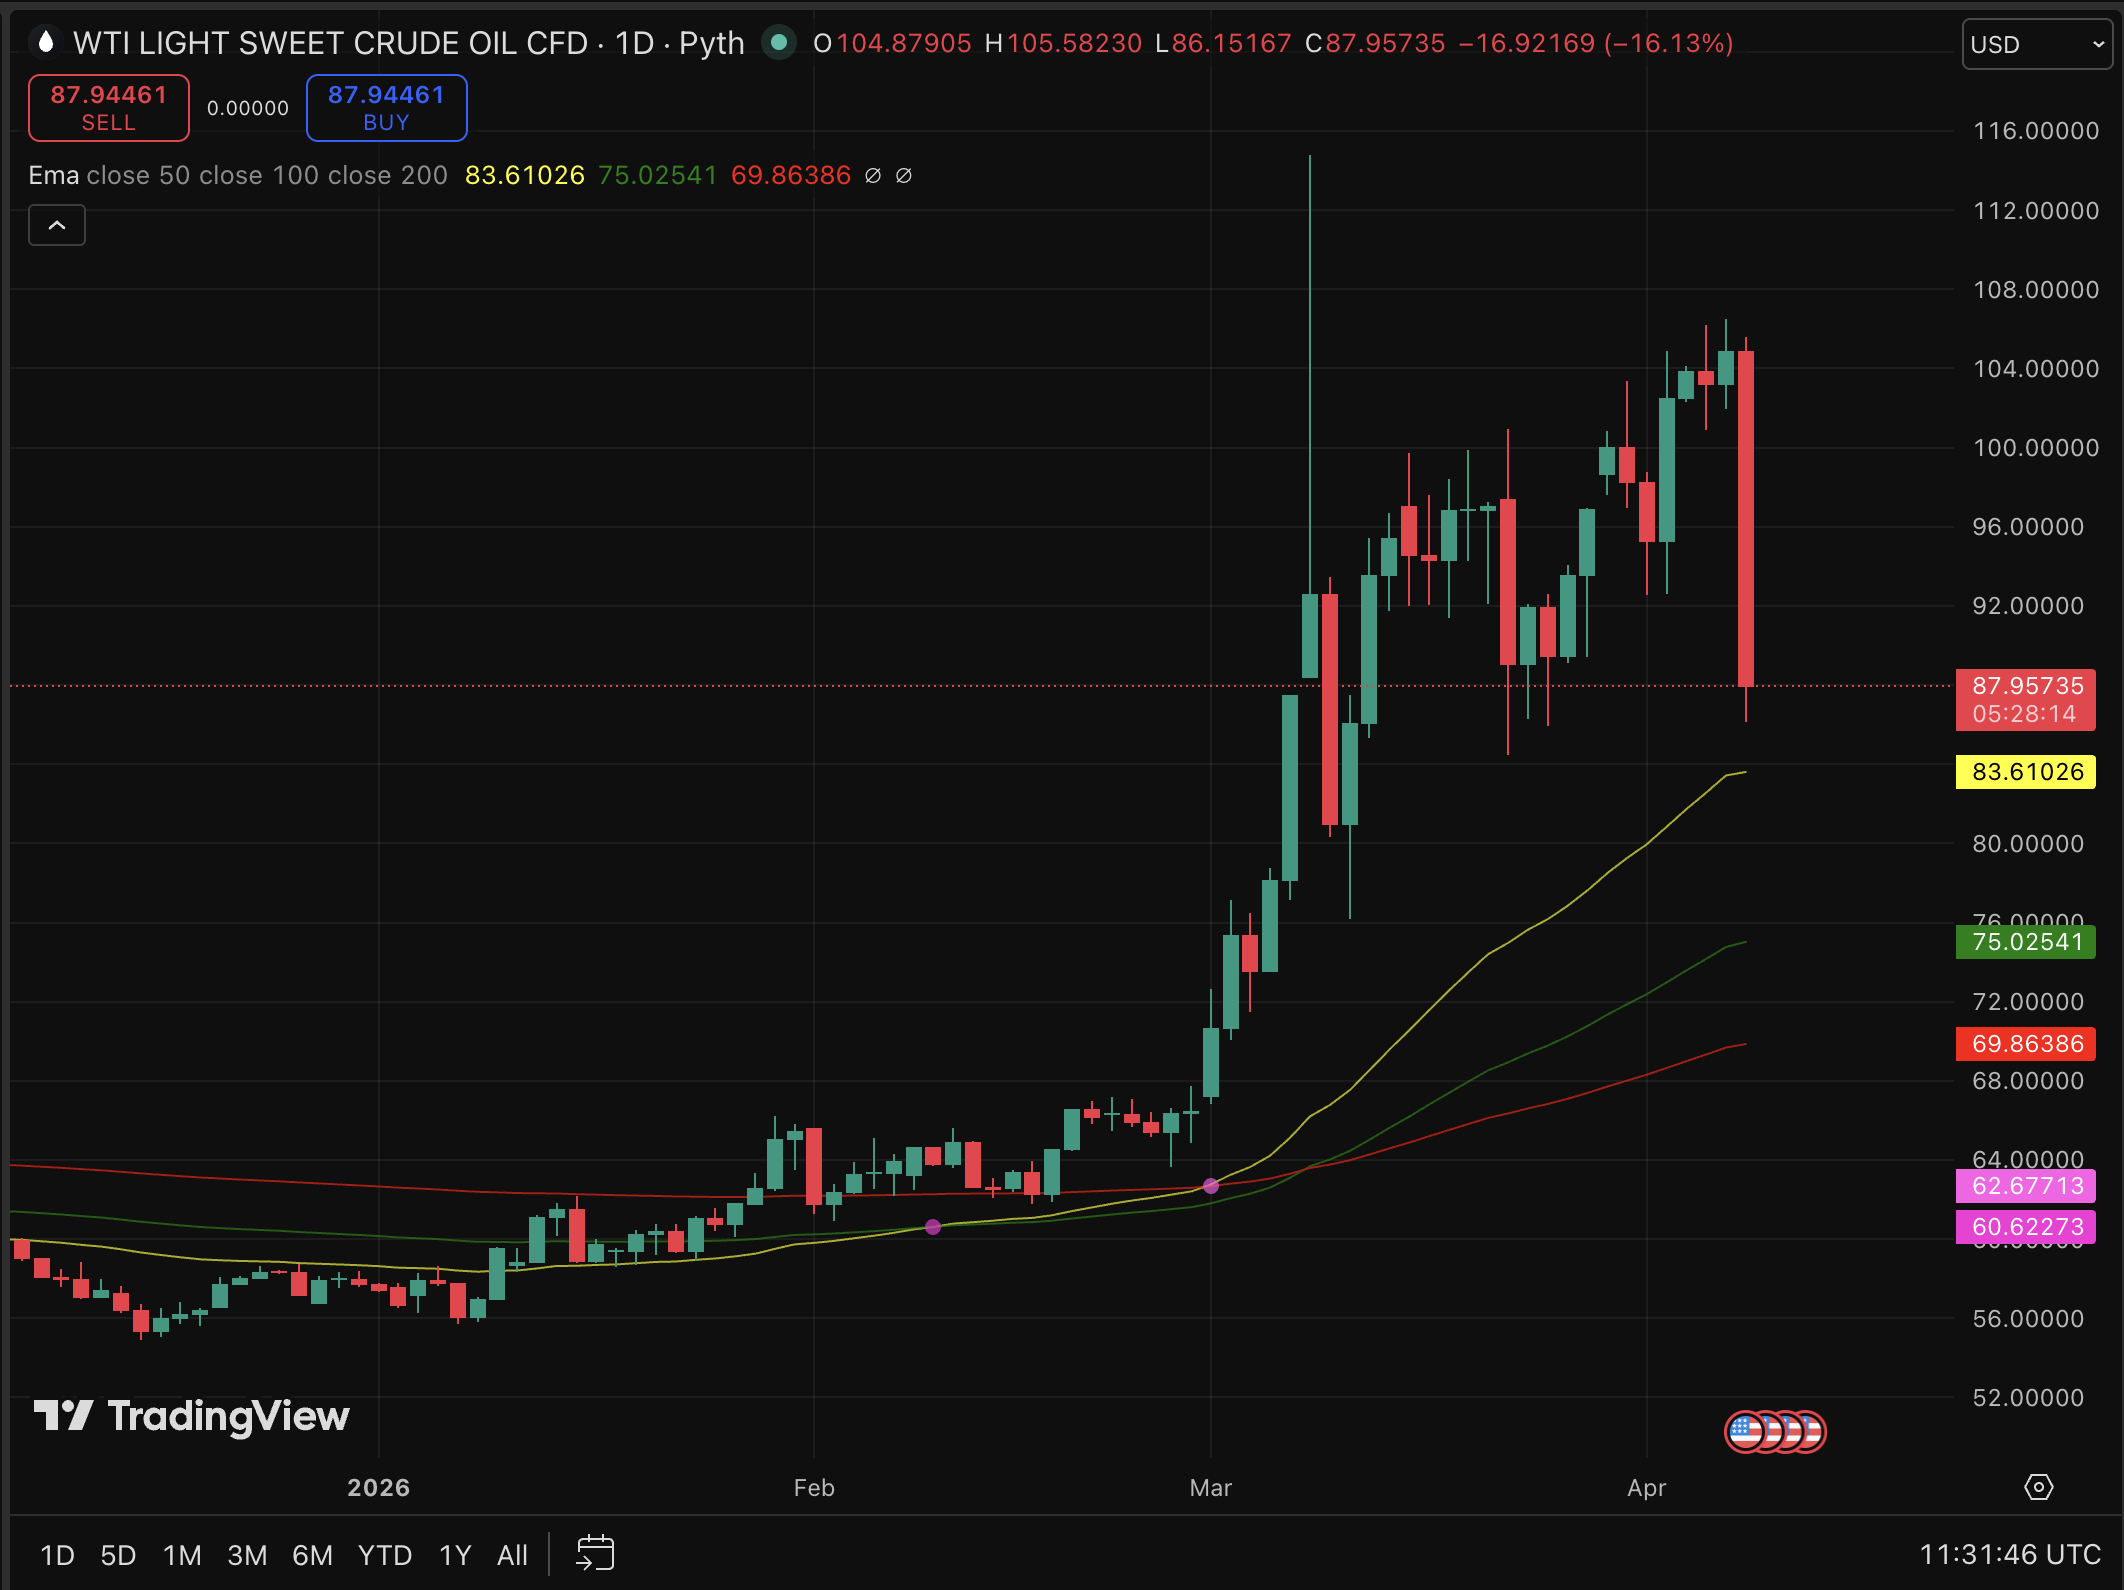
Oil markets moved sharply in the opposite direction. WTI crude dropped to roughly $94 per barrel from Tuesday’s highs above $112, as the ceasefire raised hopes that the Strait of Hormuz would reopen to tanker traffic.
Altcoins Outperform
Altcoins broadly outpaced Bitcoin on the day. Zcash (ZEC) led the charge, surging 23% to $332.
AI-sector tokens also posted strong gains: Render climbed 8% to $2.04, Bittensor’s TAO rose 7% to $332, and NEAR Protocol gained 8% to $1.34. Internet Computer climbed 9% to $2.50.
Among large caps, Avalanche gained 6.5% to $9.19, Sui rose 6% to $0.92, Solana added 5% to $84, and XRP gained 4% to $1.35.
Morgan Stanley Launches Bitcoin ETF
Morgan Stanley’s spot Bitcoin ETF began trading on NYSE Arca on Wednesday under the ticker MSBT, making the bank the first major U.S. institution to issue a spot Bitcoin ETF under its own name.
The fund carries a 0.14% annual fee, undercutting BlackRock’s IBIT at 0.25% and every other spot Bitcoin ETF currently on the market. Coinbase provides BTC custody, while BNY Mellon handles cash custody and administration.
The debut comes on the heels of strong demand for existing ETFs.SoSoValue data showed U.S. spot Bitcoin ETFs pulled in $471 million in net inflows on April 6, the largest single-day intake since late February. Spot Ethereum ETFs attracted $120 million, reversing prior outflows.
Looking Ahead
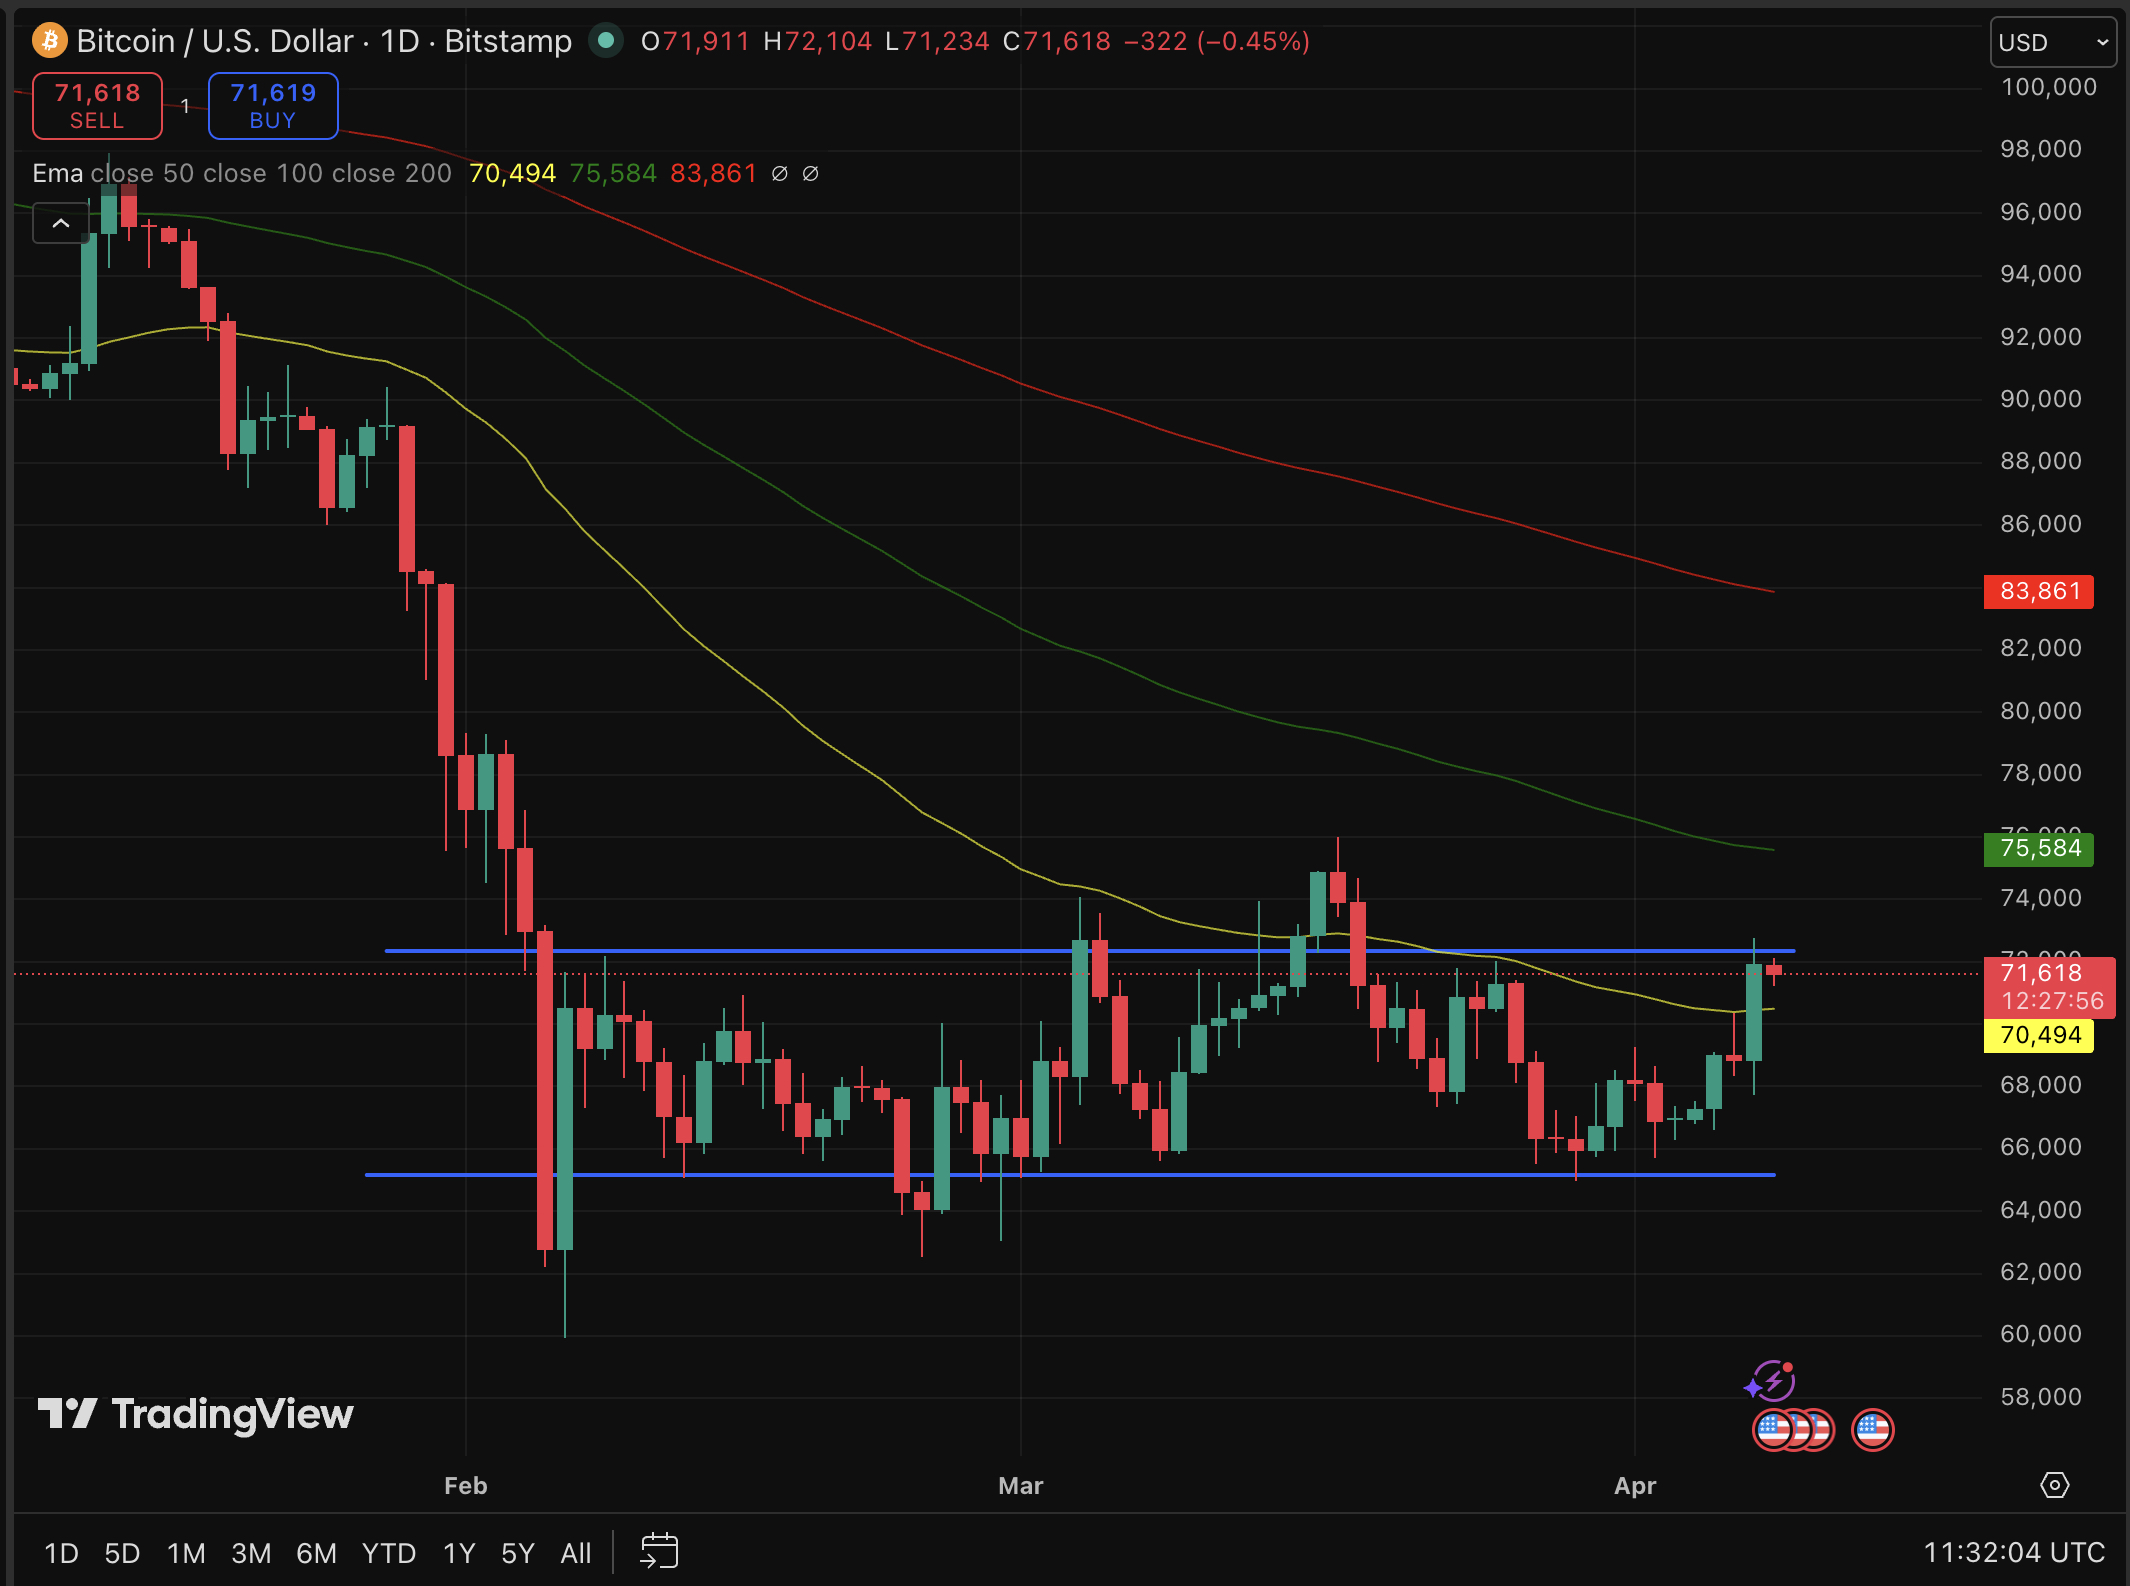
Despite the sharp bounce, Bitcoin remains trapped in a multi-month range, trading between support at $62,000 and resistance at $75,000 since early February, a range defined largely by the geopolitical overhang from the Iran conflict.
Whether the rally continues depends on the ceasefire’s durability. Iran confirmed the two-week pause but cautioned that reopening the Strait of Hormuz faces “technical limitations” and requires coordination with its military. The country’s Supreme National Security Council stressed the agreement does not imply an end to the broader conflict.


Bitcoin has pulled above $70,000 on news of the Iran ceasefire, but the rally is, for now, fairly cautious.
There may be good reasons for that.
One of the more reliable signals for gauging where bitcoin may be headed comes from tracking margin long positions on Bitfinex. These positions, which reflect bullish bets funded with borrowed capital, still remain elevated at 80,057 BTC, around the highest level in more than two years, according to TradingView data.
The data suggests these long positions are not being unwound despite the price being more than 15% higher since bottoming at $60,000 two months ago. This suggests that, in aggregate, market participants may not view the recent rally as sufficient confirmation that risks have fully subsided.
Historically, Bitfinex margin long positions have functioned as a contrarian indicator. They tend to build during periods of market stress and are reduced as prices rise. For example, long positions were sharply reduced near local bottoms during the yen carry trade unwind in August 2024, when bitcoin fell to $49,000, and again in April 2025 amid tariff tensions under President Trump, when bitcoin dropped to $76,000.
Muted U.S. institutional demand
At the same time, the Coinbase Bitcoin Premium Index is fluctuating between a premium and a discount, pointing to a lack of consistent buying pressure from U.S. investors.
The index, which tracks the price difference between bitcoin on Coinbase and the broader global market, is often used as a proxy for institutional demand.
Its indecisive positioning suggests that U.S. flows are not strongly supporting the rally, raising questions about the move’s sustainability.
Muted rally for crypto stocks
Underscoring the caution, crypto-related stocks are all firmly in the green on Wednesday, but the gains are rather modest given how far they’ve been punished previously.
Among the names: Coinbase (COIN) is up 1.5%, Circle (CRCL) 0.6%, Galaxy Digital (GLXY) 0.6% and Strategy (MSTR) 3%.
Broader risk markets are showing no such caution: the Nasdaq is higher by 2.5% and S&P 500 by 2%.

Markets are repricing risk following a ceasefire agreement between the US, Israel, and Iran, and the moves are significant. BTC USD is holding just below $72,000 price level, while gold presses the $4,800 resistance level. One number that matters most is crude oil. It is down over 16% this week and is reshaping macro expectations across every major asset class.
The reopening of the Strait of Hormuz triggered the repricing. Dubai’s Financial Market index spiked as much as 10% at the open, global equities gained over 3%, and the US dollar weakened more than 1%, all within the same session.
The risk premium built into gold and BTC during peak tension is unwinding fast, but unevenly. The pause is real.
Discover: The best pre-launch token sales
Can BTC USD Price Break $75,000 as Geopolitical Risk Unwinds?
Bitcoin is trading below $72,000, capped at a level that has functioned as both psychological resistance and a technical ceiling since the latest escalation cycle began. Volume context is thin, and consolidation patterns on the BTC USD chart suggest the market is waiting for confirmation rather than positioning aggressively in either direction.
— BSCN (@BSCNews) April 7, 2026
 BULLISH: BITCOIN RECLAIMS $70K!
The market seems to be pricing in a ceasefire/extension tonight as oil prices drop and $BTC, $GOLD, and equities rise. pic.twitter.com/SA7VxdR1jz
The $75,000 level is the line to break. Above it, momentum indicators could flip bullish quickly, given how compressed this range has become. Below $68,000, a level that has absorbed selling pressure repeatedly, the broader recovery thesis weakens materially.
Technical analysis on BTC/USD points to structural factors supporting recovery, alongside one clear risk: another leg lower remains possible before any sustained breakout.
For us, we want CPI to print soft Friday, the ceasefire narrative to hold, and Bitcoin to clear $75,000 with volume.
Gold testing $4,800 resistance simultaneously complicates the read. Bitcoin’s decoupling from traditional safe-haven dynamics in war-driven macro environments remains incomplete, which means gold’s next move likely provides the cleaner signal for BTC directional bias in the sessions ahead.
Discover: The best crypto to diversify your portfolio with
Bitcoin Hyper: BTC Eco Play With Early-Mover Upside
Bitcoin below $72,000 with a ceiling firmly in place is a frustrating setup for spot holders; the upside exists, but so does the wait. That gap between conviction and near-term price action is exactly where early-stage infrastructure plays attract serious attention.
Bitcoin Hyper ($HYPER) is positioning as the first-ever Bitcoin Layer 2 with Solana Virtual Machine (SVM) integration, a direct attack on Bitcoin’s three core limitations: slow transactions, high fees, and the absence of programmable smart contracts.
The presale has raised more than $32 million at a current price of $0.0136, with staking live and drawing significant participation. The SVM integration is the differentiator: delivering sub-Solana latency on Bitcoin’s security layer is something only a few Layer 2 projects have attempted, let alone shipped.
For traders watching Bitcoin consolidate below resistance while seeking asymmetric exposure to the broader ecosystem, the infrastructure layer is worth examining.
Research Bitcoin Hyper before the next presale stage moves the entry price.
The post BTC USD and Gold Price Outlook: The War Pause, De-escalation, and Prediction appeared first on Cryptonews.
Welcome to our institutional newsletter, Crypto Long & Short. This week:
- Bob Williams on how stricter crypto regulations in Asia are putting more personal responsibility on senior leaders, making strong governance and D&O insurance essential.
- The FBI’s Haidy Grigsby on how crypto scams are increasingly targeting experienced investors by building trust and tricking them into making larger deposits until their money is gone.
- Top headlines institutions should pay attention to by Francisco Rodrigues.
- Hyperliquid’s TradFi bet is now 40% of its own volume in Chart of the Week.
Expert Insights
Asia’s digital asset crackdown: accountability gets personal
By Bob Williams, FinTech, digital assets, & blockchain advisory leader (Asia/Pacific), Lockton Companies
A new wave of digital asset regulations across Asia is increasing pressure on trading platforms and asset managers to strengthen governance — and to reassess their Directors’ and Officers’ (D&O) liability insurance arrangements.
In recent months, three leading digital asset hubs — Hong Kong, Singapore and South Korea — have announced plans to refine their respective regulatory frameworks. As regulatory expectations rise and senior management’s personal accountability becomes clearer, platform operators must stay informed of these developments and evaluate whether their existing risk transfer strategies remain fit for purpose.
Hong Kong: expanding accountability beyond governance
In August 2025, Hong Kong’s Securities and Futures Commission (SFC) issued a circular to licensed virtual asset trading platform operators clarifying senior management’s responsibilities regarding the custody of clients’ virtual assets. The circular reinforces expectations around governance, internal controls and effective oversight, signaling a continual shift toward personal accountability for directors and senior management.
An emerging consideration from the SFC’s consultation process is whether virtual asset management service providers should be permitted to rely on non‑SFC‑regulated or offshore custodians. From an insurance perspective, the availability of coverage for virtual asset risks is closely tied to the robustness of custody arrangements, including security controls, operational resilience and asset protection standards. To date, insurance capacity has largely been supported by the prescriptive requirements imposed on SFC‑regulated custodians and platforms.
If alternative custody models are permitted, ensuring that non‑regulated or offshore custodians are held to equivalent standards, including appropriate insurance coverage will be critical. Without alignment, firms that have invested heavily to meet Hong Kong’s regulatory and insurance expectations may face a competitive disadvantage, while the objective of enhancing investor protection and market integrity could be undermined.
Singapore: reinforcing senior management competency
In 2025, Singapore introduced licensing requirements for digital token service providers serving only overseas customers, bringing a broader range of firms within the Monetary Authority of Singapore’s regulatory perimeter.
Under the licensing guidelines, the competency and fitness of key individuals are core admission criteria. Senior management is expected to demonstrate a clear understanding of the regulatory framework and to exercise effective oversight and control over business activities and staff.
As regulatory expectations rise, so too does the personal exposure of directors and officers. In this context, D&O insurance remains a critical component of a firm’s overall risk management framework, helping to protect personal assets in the event of claims or regulatory actions arising from alleged governance or oversight failures.
South Korea: gearing up for Digital Asset Basic Act
South Korea is pursuing a more expansive regulatory overhaul through the proposed Digital Asset Basic Act, introduced to the National Assembly in June 2025. The bill seeks to formalize the digital asset market by regulating issuance, trading practices and distributions, while introducing new governance structures around asset listing and delisting decisions.
These imminent changes would significantly increase compliance obligations for trading platforms and related service providers. In this environment, D&O insurance plays an important role in protecting directors and officers from the financial consequences of legal actions, investigations or claims arising from alleged regulatory breaches.
Navigating regulatory complexity with D&O insurance
Across Hong Kong, Singapore and South Korea, regulators are refining already sophisticated frameworks to address the evolving risks of digital assets. These developments reflect a broader global trend toward intensified regulatory scrutiny and heightened expectations of senior management accountability.
For firms operating in the region, this means proactively reviewing governance structures, custody arrangements and insurance programs to ensure leadership is appropriately protected against emerging liabilities. D&O insurance is no longer a secondary consideration — it is a core element of responsible risk management in an increasingly regulated digital asset landscape.
Informed Perspectives
Crypto scams are not just targeting the uninformed
By Haidy Grigsby, special agent, cybercrime and digital evidence unit, Tennessee Bureau of Investigation
A common assumption is that crypto scams prey on the uninformed. While this is often true in financial fraud, crypto-related frauds are increasingly catching experienced investors, retired professionals and former market participants off guard with increasing frequency.
In my work at the FBI, I recently met with a retired trader who fit that profile exactly. He met a young woman online who claimed to know someone involved in crypto trading. He was told he had been selected as a consultant because of his experience. His case illustrates a strategy that we now see often.
Initial contact often begins with a wrong-number text, LinkedIn message or social media outreach. What starts as professional often turns personal or romantic, a tactic known as “pig butchering.” Scammers flatter expertise, create exclusivity and get the target to move the conversation to encrypted apps. In this case, “she” said WhatsApp was easier for her.
Exploiting familiarity with legitimate infrastructure, victims are instructed to open accounts on real exchanges, then use self-custody wallets to access external sites through built-in Web3 browsers. Because they click within a trusted app, they often don’t realize that they have left it.
These fraudulent markets mimic real ones with a twist: unlike real markets, these platforms allow one daily trade at a set time, ostensibly to capture optimal volatility. Victims choose long or short, allocate funds and confirm a brief trade lasting seconds or minutes. The scammer will often claim to contribute their own funds, reinforcing trust and the illusion of shared risk.
Balances grow and profits appear real. In truth, no trading occurs — the website is controlled by the operation, and the returns aresimply numbers entered by the scammer on their end.
To build credibility, victims are encouraged to withdraw a small amount after a “winning” trade. The withdrawal appears processed successfully, but is funded with cryptocurrency stolen from other victims and is meant to encourage larger future deposits. “I took profits. It had to be real,” the retired trader told me in frustration.
The websites change domains and branding frequently, with victims being told the company is merging, upgrading or rebranding. In reality these changes occur because of law enforcement takedowns, and victims are simply redirected to “new trading platforms.”
When victims attempt larger withdrawals, the narrative shifts: regulatory holds, tax prepayments, liquidity verification thresholds or tier upgrades. Each explanation is paired with urgent demands for more funds.
Convincing victims of the truth remains one of the greatest challenges. When I spoke with the retired trader, it was difficult to convince him I was law enforcement and that he had been dealing with a criminal organization, not one individual. No one wants to believe the person they built trust with and gave substantial sums of money to never existed. This retired trader was left to face his family, admit he had been defrauded and ask for help with basic living expenses. By the time he accepted reality, his retirement savings were already gone: assets had been transferred overseas, laundered and liquidated.

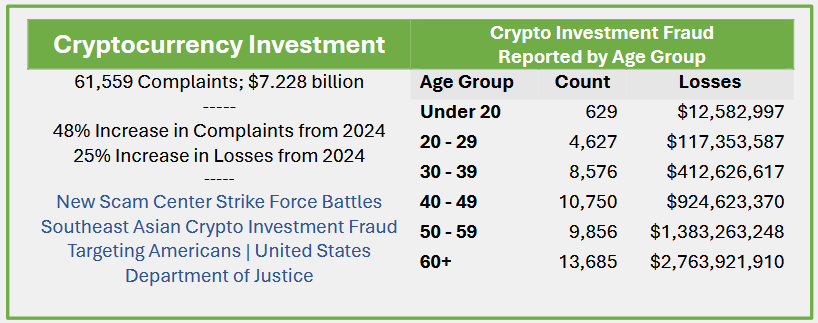
Source: FBI Internet Crime Complaint Center (IC3), 2025 Internet Crime Report, p. 53, https://www.ic3.gov/AnnualReport/Reports/2025_IC3Report.pdf
The FBI’s 2024 data show losses rising with age, likely reflecting the fact that older individuals have more accumulated wealth than those in their 20s.
Victims gather evidence: phone numbers, accounts, photos and websites — most of it turns out to be stolen, fake or AI-generated. Despite the difficulties in apprehending the perpetrators of these sophisticated schemes, law enforcement continues to pursue these cases. Anyone affected should cease all communication and report the incident to local law enforcement, IC3.gov and Chainabuse.com.
Headlines of the Week
– By Francisco Rodrigues
This week’s headlines show institutional adoption has kept on growing in the cryptocurrency space, yet old dangers remain. Protocol exploits, state-sponsored attacks, and technology disruption remain active threats.
Chart of the Week
Hyperliquid’s TradFi bet is now 40% of its own volume
Hyperliquid’s HIP-3 has scaled from ~$115 million in its first week (Oct 2025) to a peak of $17.8 billion/week, now consistently representing 35–40% of total protocol volume. Despite launching as a crypto-adjacent product, HIP-3 is overwhelmingly a TradFi venue, with Commodities alone driving ~60% of volume and pure crypto categories accounting for just ~12%. The aggregate (core + HIP 3) volume continues to decline since the early March 2026 peak with the HYPE price now following the same trend.

Listen. Read. Watch. Engage.
- Listen: Jennifer Sanasie is joined by Bloomberg Intelligence Senior Analyst James Seyffart to break down what Morgan Stanley’s bitcoin ETF could mean for institutional flows, fee competition, and the next phase of crypto adoption.
- Read: In Crypto for Advisors, Paul Frost-Smith, CEO of Komainu, covers how institutional crypto is converging with traditional finance, but speed can introduce risk if legal and compliance layers aren’t aligned. Then, in “Ask an Expert,” Sam Boboev from the “Fintech Wrap Up,” details the key coordination risks institutions must solve for.
- Watch: Jennifer Sanasie hosts Public Keys from the NYSE. Christopher Perkins discusses the recent acquisition by Franklin Templeton and the new “Franklin Crypto,” Superstate CEO Robert Leshner and Invesco’s Kathleen Wrynn break down their partnership, and NYSE Senior Market Strategist Michael Reinking, CFA unpacks the macro environment.
- Engage: Have you bought tickets to Consensus Miami yet? More speakers have been added to the agenda! Surrounding Consensus is an institutional summit, an advisor-focused “Wealth Management Day,” 100+ ancillary events and much, much more.
Looking for more? Receive the latest crypto news from coindesk.com and market updates from coindesk.com/institutions.
Note: The views expressed in this column are those of the author and do not necessarily reflect those of CoinDesk, Inc., CoinDesk Indices or its owners and affiliates.
Federal Reserve Chair Jerome Powell speaks during a press conference following the Federal Open Markets Committee meeting at the Federal Reserve on March 18, 2026 in Washington, DC.
Anna Moneymaker | Getty Images
Federal Reserve officials at their March meeting still expected to lower interest rates this year, even with a high level of uncertainty from the Iran war and tariffs, according to minutes released Wednesday.
Most of the participants said the war could result in the need for easier monetary policy if rising gas prices hit the labor market and consumer wallets.
Policymakers said they would need to remain “nimble” as they weighed the impact the war had on inflation, which continued to hold above the Fed’s target, and hiring, which has been mostly flat over the past year.
“Many participants judged that, in time, it would likely become appropriate to lower the target range for the federal funds rate if inflation were to decline in line with their expectations,” the minutes said.
The consensus anticipated one cut this year, unchanged from the last update in December.
The summary then noted caution over “a further softening in labor market conditions, which could warrant additional rate cuts, as substantially higher oil prices could reduce households’ purchasing power, tighten financial conditions, and reduce growth abroad.”
Ultimately, the rate-setting Federal Open Market Committee voted 11-1 to keep the benchmark overnight borrowing rate targeted in a range between 3.5%-3.75%.
Possible hike?
The consensus was to keep rates steady as they observed conditions unfold, with officials also expressing concern that the Middle East hostilities could result in sustained inflation that could require rate hikes.
“Most participants commented that it was too early to know how developments in the Middle East would affect the U.S. economy and judged it prudent to continue to monitor the situation and assess the implications for the appropriate stance of monetary policy,” the minutes said.
The March 17-18 meeting came just a weeks after the U.S. and Israel launched an attack on Iran that triggered a surge in energy costs and renewed fears of a spike in inflation. A ceasefire announced Tuesday evening led to a sharp drop in oil, though the durability of the agreement is still highly in question.
In assessing conditions so far, meeting participants said they still expected inflation to continue moving toward the Fed’s 2% target, despite the tumult the war caused. They noted that tariffs remain a threat, though most see the impact of the duties as temporary when it comes to computing inflation.
Chair Jerome Powell said in a recent public appearance that raising rates now to stave off an inflation spike could have negative longer-term effects given the lagged impact of Fed rate moves.
At the same time, officials expressed concern about the labor market, which has been creating enough jobs to keep the unemployment rate steady. However, job growth has come almost exclusively from health care-related sectors, raising concerns about stability and potential for growth.
“The vast majority of participants judged that risks to the employment side of the mandate were skewed to the downside,” the minutes said. “In particular, many participants cautioned that, in the current situation of low rates of net job creation, labor market conditions appeared vulnerable to adverse shocks.”
Markets largely expect the Fed to remain on hold through the rest of the year. However, the ceasefire led traders to raise the odds for a potential cut.
Broadly speaking, the economy has showed signs of slowing, causing some on Wall Street to raise their expectations for a recession.
Gross domestic product rose at just a 0.7% pace in the fourth quarter of 2025 and is on track for just a 1.3% growth rate in the first quarter of 2026.


Network News
BERNSTEIN SAYS QUANTUM THREAT TO BITCOIN IS REAL BUT MANAGEABLE: Wall Street broker Bernstein said the rise of quantum computing poses a credible but manageable threat to Bitcoin and the broader crypto ecosystem, as recent breakthroughs compress timelines for potential attacks on modern cryptography. Advances such as Google Quantum AI’s reported reduction in qubit requirements suggest the risk is no longer a distant, decade-long concern, the broker noted. Still, the firm cautioned that scaling quantum systems to the level needed to break widely used encryption remains a complex, multi-step challenge. “Quantum should be seen as a medium to long term system upgrade cycle rather than a risk,” analysts led by Gautam Chhugani said in the Wednesday report. Quantum computing uses the principles of quantum mechanics rather than classical physics. Instead of binary bits, it relies on qubits that can exist in multiple states at once, a property known as superposition, allowing many possibilities to be processed simultaneously. Combined with entanglement, this enables quantum systems to solve certain problems, such as breaking encryption, far more efficiently than classical computers. Quantum computers could eventually weaken cryptographic systems like elliptic curve encryption, which underpin crypto wallets, by solving problems beyond the reach of classical machines. However, the report said the threat spans industries from finance to defense and should be viewed as a manageable, long-term risk rather than an existential one for Bitcoin. — Will Canny Read more.
EXPLOITS TO ESPIONAGE: DRIFT HACK REVEALS MORE COMPLEX OPERATIONS: When Drift disclosed the details behind its $270 million exploit, the most unsettling part wasn’t the scale of the loss — it was how it happened. According to the team behind the protocol, the attack wasn’t a smart contract bug or a clever piece of code manipulation. It was a six-month campaign involving fake identities, in-person meetings across multiple countries and carefully cultivated trust. The attackers, allegedly from North Korea, didn’t just find a vulnerability in the system. They became part of it. This new threat is now forcing a broader reckoning across decentralized finance. For years, the industry has treated security as a technical problem, something that could be solved with audits, formal verification and better code. But the Drift incident suggests something far more complex: that the real vulnerabilities may lie outside the codebase altogether. Alexander Urbelis, chief information security officer (CISO) at ENS Labs, argues the framing itself is already outdated. “We need to stop calling these ‘hacks’ and start calling them what they are: intelligence operations,” Urbelis told CoinDesk. “The people who showed up at conferences, who met Drift contributors in person across multiple countries, who deposited a million dollars of their own money to build credibility: that’s tradecraft. It’s the kind of thing you’d expect from a case officer, not a hacker.” If that characterization holds, then Drift represents a new playbook: one where attackers behave less like opportunistic hackers and more like patient operators embedding themselves socially before making a move onchain. — Margaux Nijkerk Read more.
SOLANA FOUNDATION NEW AD ‘DONT WASTE TIME ON CRYPTO’: The Solana Foundation is taking a deliberately contrarian approach to crypto marketing in San Francisco, rolling out a billboard campaign that reads: “Don’t waste time with crypto.” At first glance, the message may seem a bit confusing as a crypto foundation is saying not to waste time with crypto. But according to the Solana Foundation, it is a bullish bet on the future of crypto that intersects with agentic AI. Essentially, what this means is that rather than wasting your time executing transactions with crypto, which might be cumbersome and time-consuming, let your AI agents do the hard work. The ad directs passersby to the x402 account on X, a nod to a growing push within the Solana ecosystem to position blockchain not as a consumer-facing product, but as invisible infrastructure for the next phase of the internet. — Margaux Nijkerk Read more.
NEW ALCHEMY AI TOOL: Alchemy, a cryptocurrency infrastructure provider used by many blockchains and firms in the space, has released a new tool, AgentPay , that lets different AI payment systems, from companies like Coinbase, Stripe, Visa, Mastercard, and Circle, work together. The new tool addresses the problem that agentic payment systems currently coming online aren’t “interoperable,” or in other words, don’t talk to one another, meaning a merchant that wants AI agents as customers has to build a separate integration for every protocol. “That’s not sustainable, and it’s only going to get more fragmented as more systems launch,” said Alchemy CTO Guillaume Poncin in an email. “AgentPay fixes that. A merchant registers their existing API with us, we give them a new endpoint, and any agent on any supported protocol can pay them through it.” Alchemy is widely seen as the “AWS of Web3,” as it provides the infrastructure, developer tools, and node services needed to build blockchain applications. AgentPay promises one integration for every protocol, citing the likes of x402, MPP, A2P or L402. “We sit in the middle as the translation layer, where AgentPay routes instructions, and Alchemy never touches the funds,” Poncin said. — Ian Allison Read more.
In Other News
- Adam Back has denied claims that he is Satoshi Nakamoto after a New York Times story argued that the British cryptographer is the strongest candidate yet for Bitcoin’s pseudonymous creator. In a post on X after the article was published, Back said his long record in cryptography, privacy tools and electronic cash research explains why reporters keep finding links between his work and Bitcoin’s design. “I’m not satoshi,” Back wrote. He said he had been “early in laser focus on the positive societal implications of cryptography, online privacy and electronic cash,” and that his work from about 1992 onward, including discussions on the cypherpunks mailing list, led to Hashcash and other ideas later echoed in Bitcoin. Back, said NYT reporter John Carreyrou, had found “many interesting bitcoin analogs in early attempts to create a decentralized ecash,” adding that early researchers explored concepts such as peer-to-peer systems, proof-of-work, and routing models that looked like prototypes for Bitcoin. — Helene Braun Read more.
- Wall Street investment bank JPMorgan (JPM) said the pace of capital flowing into digital assets slowed markedly in the first quarter of 2026, with total inflows estimated at around $11 billion. That implies an annualized run rate of roughly $44 billion, about one-third of the pace seen in 2025, according to the report published last week. “Investor flows, either retail or institutional, have been small or even negative YTD with the bulk of the digital asset flow in Q1’26 stemming from Strategy’s (MSTR) bitcoin purchases and concentrated crypto VC funding,” wrote analysts led by Nikolaos Panigirtzoglou. Crypto markets had a volatile and broadly negative first quarter, with prices and market value retreating sharply amid a risk-off backdrop. Total crypto market capitalization fell roughly 20% over the period, while bitcoin dropped around 23% and ether (ETH) declined more than 30%, marking one of the weakest first-quarter performances in years. The selloff was driven by macroeconomic and geopolitical pressures, triggering liquidations and a broad pullback in risk assets, with altcoins hit even harder. — Will Canny Read more.
Regulatory and Policy
- Polymarket removed a betting market tied to the rescue of U.S. service members in Iran, after intense backlash and criticism from lawmakers this weekend. The market allowed users to wager on when the U.S. would confirm the rescue of two airmen after an F-15E fighter jet was shot down over Iran. The crew members have since been rescued. Rep. Seth Moulton, a Democrat from Massachusetts, criticized the listing in a post on X, calling it “disgusting” and arguing it reduced a military rescue effort to a financial trade. Moulton has taken a hard line on prediction markets, recently banning his staff from using platforms such as Polymarket and Kalshi over concerns that financial incentives could influence policy decisions. A Polymarket spokesperson said the listing did not meet its integrity standards and the contract was removed shortly after it appeared. The company added that it is reviewing how the market passed internal safeguards. — Francesco Rodrigues Read more.
- The U.S. Federal Deposit Insurance Corp. formally proposed its approach to stablecoin issuers as one of the federal financial regulators required to write and oversee rules under last year’s Guiding and Establishing National Innovation for U.S. Stablecoins (GENIUS) Act. The FDIC’s proposal —meant to align closely with what its sister banking agency, the Office of the Comptroller of the Currency, proposed in February — will be open for a 60-day public comment period on the lengthy list of 144 questions posed Tuesday by the agency. The FDIC’s job is to police U.S. depository institutions, and under the GENIUS Act, its role is to regulate such institutions issuing stablecoins from their subsidiaries. To that end, it posed capital, liquidity and custody standards for those firms, though the details won’t be set in stone until the rule is finalized — not likely to occur until the agency spends further months reviewing input and writing the final language. This is the second GENIUS Act proposal from the banking agency after its December pitch on the issuer application process. As expected under the law, stablecoins won’t enjoy the deposit insurance that the banks maintain on traditional banking accounts, according to the proposal. — Jesse Hamilton Read more.
Calendar
- Apr.15-16, 2026: Paris Blockchain Week, Paris
- May 5-7, 2026: Consensus, Miami
- Sept. 29-Oct.1, 2026: Korea Blockchain Week, Seoul
- Oct. 7-8, 2026: Token2049, Singapore
- Nov. 3-6, 2026: Devcon, Mumbai
- Nov. 15-17, 2026: Solana Breakpoint, London
Crypto World
BTC’s next bull run to be driven by banking and digital credit, says Strategy’s Michael Saylor

Michael Saylor, executive chairman of Strategy (MSTR), believes bitcoin likely bottomed in early February at $60,000.
Speaking at a recent Mizuho event, Saylor reiterated his long-held view that bottoms aren’t necessarily about valuations but are driven by seller exhaustion, analysts Dan Dolev and Alexander Jenkins wrote.
Trend reversals, he added, are driven more by capital structure and liquidity than by investor sentiment.
Saylor now sees limited selling pressure amid growing demand from ETF inflows, which are absorbing daily supply, and companies shifting treasury assets into bitcoin.
Bitcoin and Strategy’s next drivers
As for the catalyst for the next bull market, Saylor believes it will be the formation of banking credit and digital credit on top of bitcoin. This will have bitcoin supporting more lending and credit activity beyond simple buy-and-hold demand.
Digital credit already exists, said Saylor, in the form of Strategy’s STRC preferred stock, whose beefy 11.5% yield remains well below the company’s expectation of BTC’s long-term appreciation. Strategy is “stretching” bitcoin “from a nonyielding asset into a capital markets engine,” he said.
On the recently hotly-debated topic of quantum computing, Saylor said the risks are overblown. The threat, he argued, is theoretical, likely decades away, and even then solvable.
Mizuho retained its outperform rating on Stategy and $320 price target, suggesting about 150% upside from the current $127.
Circle Payments Network (CPN) Managed Payments let financial institutions operate in fiat, while using crypto rails behind the scenes via Circle.
Circle today launched Circle Payments Network (CPN) Managed Payments, a stablecoin settlement solution designed to simplify stablecoin transactions for traditional financial institutions, according to a press release from the firm.
The new managed solution is aimed at mainstream TradFi firms, including payment service providers, fintechs, banks, and global enterprises, per the release. The product’s core pitch is simplicity: participating firms interact solely in fiat, while Circle handles the the crypto rails in the background, namely USDC minting and burning, payment orchestration, compliance, and blockchain infrastructure.
Use cases include cross-border settlement, merchant stablecoin acceptance, high-volume payouts, and FX cost reduction, according to the releae. At launch, partners include Thunes and Worldline, alongside payments company Veem.
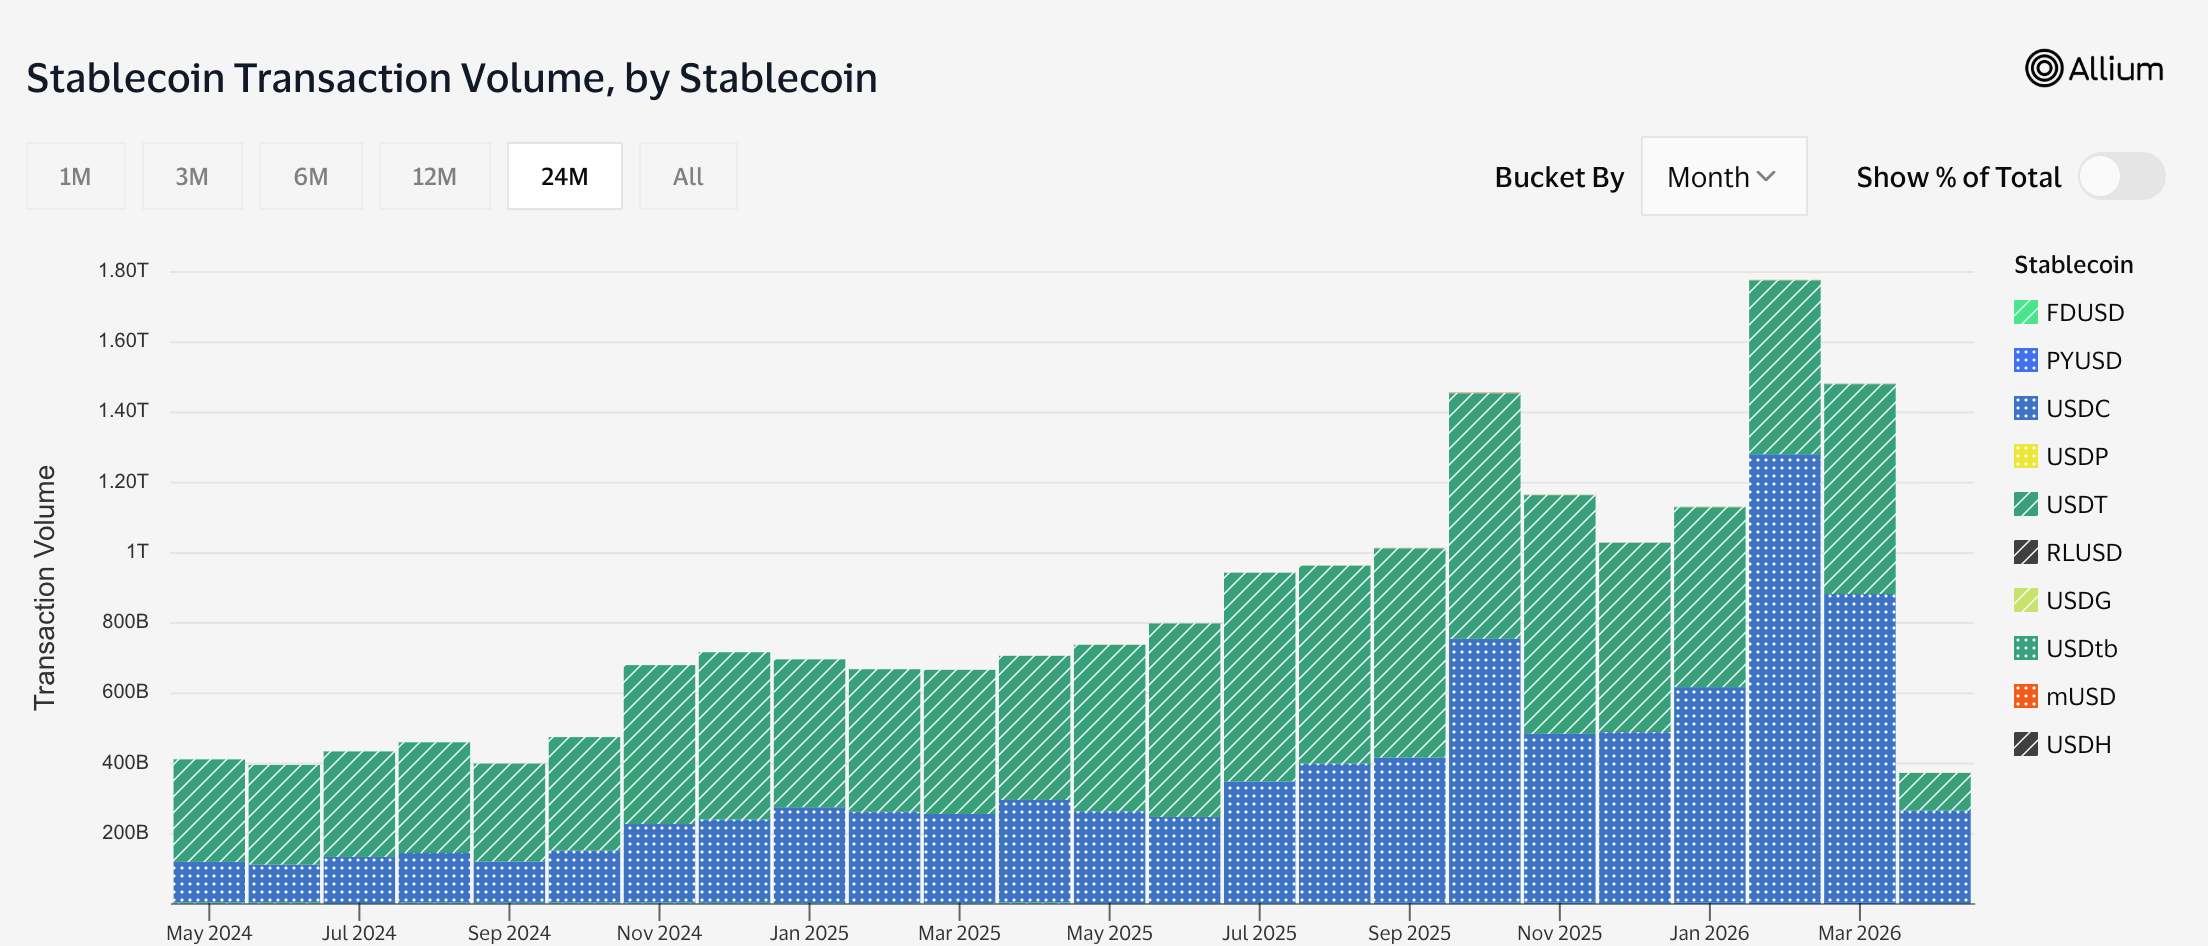
In recent months, UDSC has overtaken Tether’s USDT, the largest stablecoin by market cap, in terms of monthly transaction volume, per data from Visa and Allium.

The launch comes as stablecoins cement their role as mainstream financial infrastructure. Total stablecoin supply surged 50% in 2025 as enterprise adoption accelerated, with the GENIUS Act creating the first federal U.S. regulatory framework for the sector.
Major institutions have moved quickly: Visa launched USDC settlement on Solana in December, and the same month, Intuit struck a multi-year deal with Circle to embed stablecoin capabilities across TurboTax, QuickBooks, and Credit Karma.
Meanwhile, last month, Mastercard acquired stablecoin infrastructure firm BVNK with aims to bridge on-chain and fiat rails within the network.
This article was written with the assistance of AI workflows. All our stories are curated, edited and fact-checked by a human.
Institutional money is rotating back in, and XRP is leading the rallies. XRP recorded $119.6 million in weekly fund inflows for the period ending last week, its strongest weekly haul since mid-December 2025, which occurred when XRP price prediction was running at rock bottom.
That single figure puts XRP ahead of every other digital asset for the week, including Bitcoin. The broader crypto market pulled in $224 million total, reversing a stretch of notable outflows and signaling a clear sentiment shift among institutional allocators.
Regulatory clarity and XRP’s entrenched position in cross-border payment infrastructure appear to be the twin catalysts. With macro conditions still turbulent, the price setup deserves a closer look.
Discover: The best crypto to diversify your portfolio with
XRP Price Prediction: $2.00 Before Year-End?
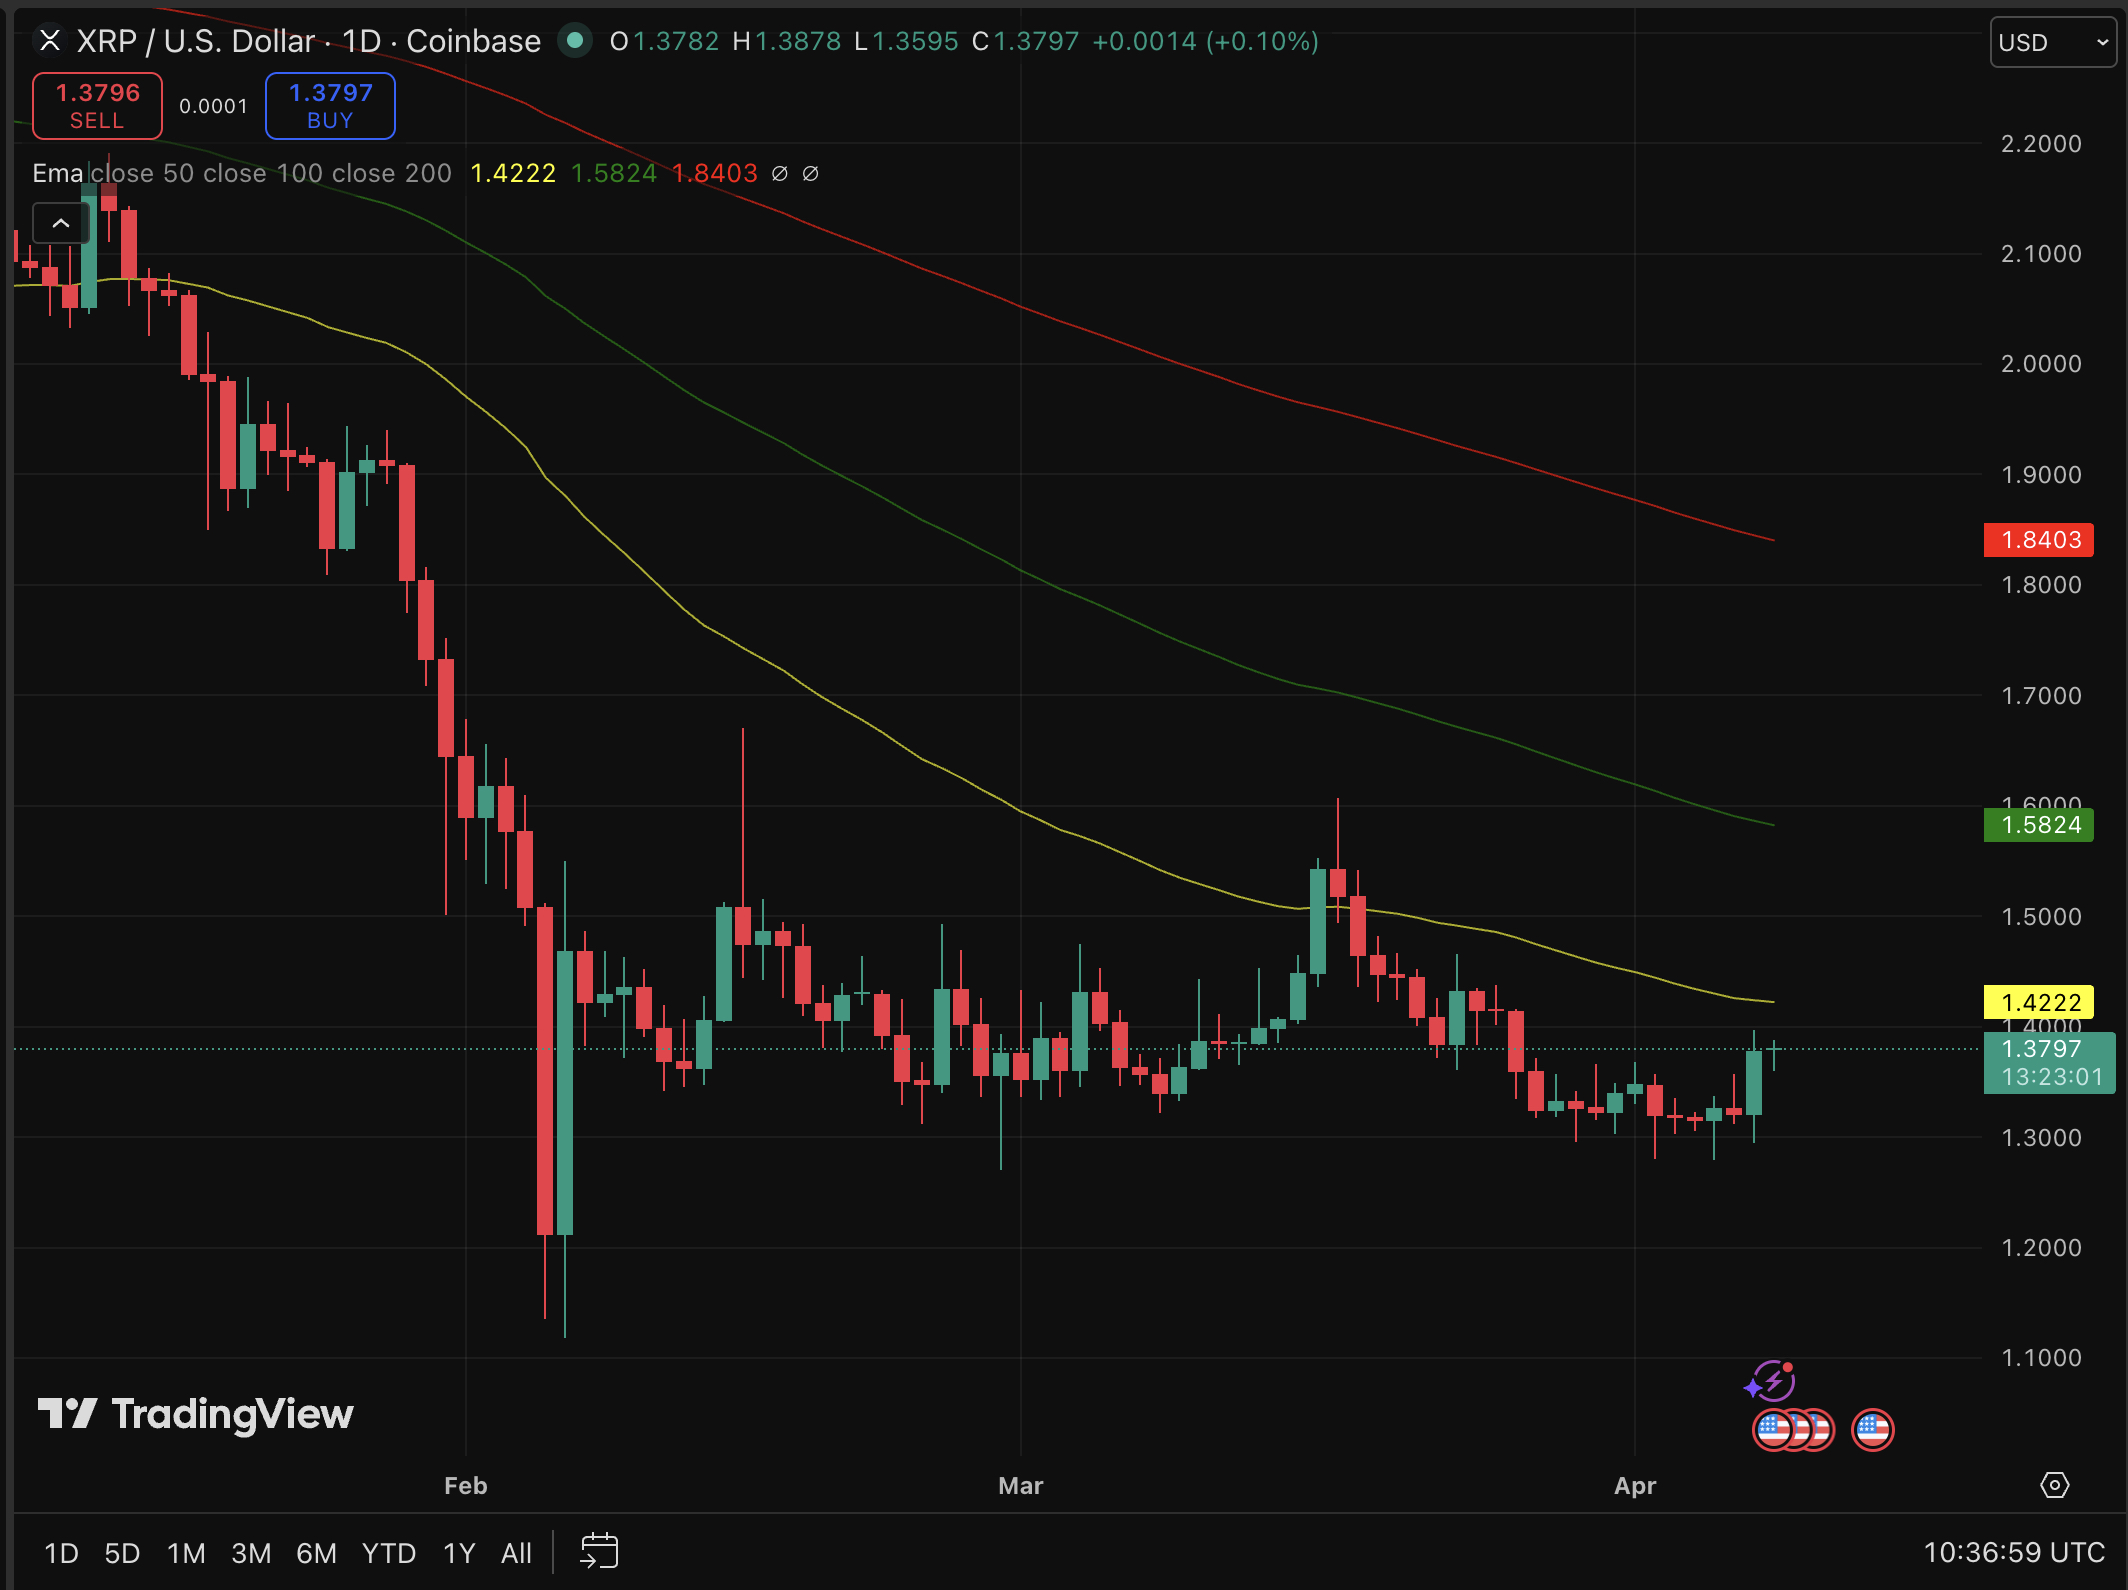
XRP’s 4.6–5.0% daily gain lands it at the $1.37–$1.38 range, but the technical picture remains cautious. The asset is holding above its short-term 10-day and 20-day exponential moving averages, a tentative green flag.
The problem? It still trades below the 50-, 100-, and 200-day EMAs, keeping the broader trend firmly in bearish territory. The 14-day RSI sits at 39.43, neutral but leaning toward oversold, which historically creates room for further upside before momentum stalls.

Support levels are stacked at $1.31, $1.29, and $1.27, with resistance clustered at $1.4, the exact range XRP is currently testing. A clean breakout above $1.38 with volume would open the door toward $1.50 and potentially $1.70 on a momentum extension.
The inflow data is bullish. The chart structure is still mending. Those two realities coexist, and neither cancels the other out.
Discover: The best pre-launch token sales
Bitcoin Hyper Targets Early Mover Upside as XRP Tests Key Resistance
XRP’s 50% projected upside is compelling, but at a $84B+ market cap, the runway to 10x returns requires a very specific set of conditions to align perfectly. Traders hunting asymmetric early-stage exposure are looking elsewhere without abandoning the Bitcoin ecosystem entirely.
Bitcoin Hyper ($HYPER) is positioned as the first Bitcoin Layer 2 with Solana Virtual Machine (SVM) integration, a combination that delivers sub-second transaction finality while inheriting Bitcoin’s security layer. The project targets Bitcoin’s three structural weaknesses directly: slow transactions, high fees, and the near-total absence of programmability.
The presale has raised $32 million at a current token price of $0.0136, with staking rewards already live for early participants. The Decentralized Canonical Bridge enables direct BTC transfers into the ecosystem, removing friction that has historically limited Bitcoin DeFi adoption.
The post XRP Price Prediction: Ripple Leads Crypto Inflows as Market Recovers appeared first on Cryptonews.


South Korea’s ruling Democratic Party proposed a “Digital Asset Basic Act” Wednesday that would establish a legal framework for digital assets, including issuance, trading, custody and supervision.
“Digital assets are emerging as a core medium connecting the real economy and financial markets,” the proposal states. It defines value-linked digital assets, including those tied to fiat currencies or real-world assets, as a category requiring issuer authorization, refund reserves and redemption obligations.
The new proposal comes amid stalled Digital Asset Basic Act negotiations since early this year when regulators clashed over who should be allowed to issue won-pegged stablecoins. The Bank of Korea insisted banks with 51% ownership should be the only ones authorized to issue stablecoins, while the Financial Services Commission warned this could hinder innovation.
The bill also said it aims to “establish a foundation for Korea to lead the global digital financial order.” Under the proposal, entities seeking to issue such assets must obtain approval and meet requirements including capital thresholds, operational capacity and reserve plans.
The legislation would introduce licensing, registration and reporting requirements for digital asset businesses, including trading, brokerage, custody and advisory services.
It would also establish rules on disclosures, internal controls and market conduct, including prohibitions on unfair trading practices such as market manipulation and use of non-public information.
The proposal calls for the creation of a digital asset committee to review and coordinate policy, as well as national basic and implementation plans for the sector.
It also noted that South Korea’s current system remains focused on investor protection and lacks a comprehensive framework covering issuance, disclosure and market structure.
The proposal follows the announcement of new rules Wednesday by the country’s Financial Services Commission and Financial Supervisory Service ordering all domestic cryptocurrency exchanges to adopt a single, strict system for delaying withdrawals. The aim is to block a surge in voice phishing scams that rely on speed.
Crypto Markets Surge as US-Iran Ceasefire Triggers Short Squeeze
Conor Benn responds to reports Regis Prograis is ‘badly injured’ for their fight

Hyundai’s New Boulder Concept Feels Like The Future Of SUVs


-

 NewsBeat6 days ago
Steven Gerrard disagrees with Gary Neville over ‘shock’ Chelsea and Arsenal claim | Football
-

 Business6 days ago
No Jackpot Winner and $194 Million Prize Rolls Over
-

 Fashion5 days ago
Weekend Open Thread: Spanx – Corporette.com
-

 Crypto World7 days ago
Gold Price Prediction: Worst Month in 17 Years fo Save Haven Rock
-

 Business4 days ago
Expert Picks for Every Need
-

 Business3 days ago
Three Gulf funds agree to back Paramount’s $81 billion takeover of Warner, WSJ reports
-

 Sports4 days ago
India men’s 4x400m and mixed 4x100m relay teams register big progress | Other Sports News
-

 Business7 days ago
Login and Checkout Issues Spark Merchant Frustration
-

 Tech22 hours ago
How Long Can You Drive With Expired Registration? What Florida Law Says
-
Business3 days ago
No Jackpot Winner, Prize to Climb to $231 Million
-

 Tech6 days ago
Commonwealth Fusion Systems leans on magnets for near-term revenue
-

 Fashion2 days ago
Massimo Dutti Offers Inspiration for Your Summer Mood Board
-

 Crypto World7 days ago
Ripple rolls out enterprise crypto treasury platform for corporates
-

 Fashion1 day ago
Let’s Discuss: DEI in 2026
-
Politics5 days ago
Wings Over Scotland | The quality of mercy
-
 Sports7 days ago
Steal Gary Woodland’s subtle power move for longer drives
-

 Business4 days ago
Akebia Therapeutics, Inc. (AKBA) Discusses Pipeline Progress and Strategic Focus on Kidney Disease Treatments at R&D Day – Slideshow
-
Sports7 days ago
Tom Pelissero Drives the Final Nail in the Coffin
-
 Tech7 days ago
Battery Tester Outperforms Cheaper Options
-

 Tech7 days ago
Following Artemis II’s Journey Around The Moon
You must be logged in to post a comment Login