
Crypto World
ADA Faces Heavy Pressure, But Cardano’s On-Chain Data Tells Another Story
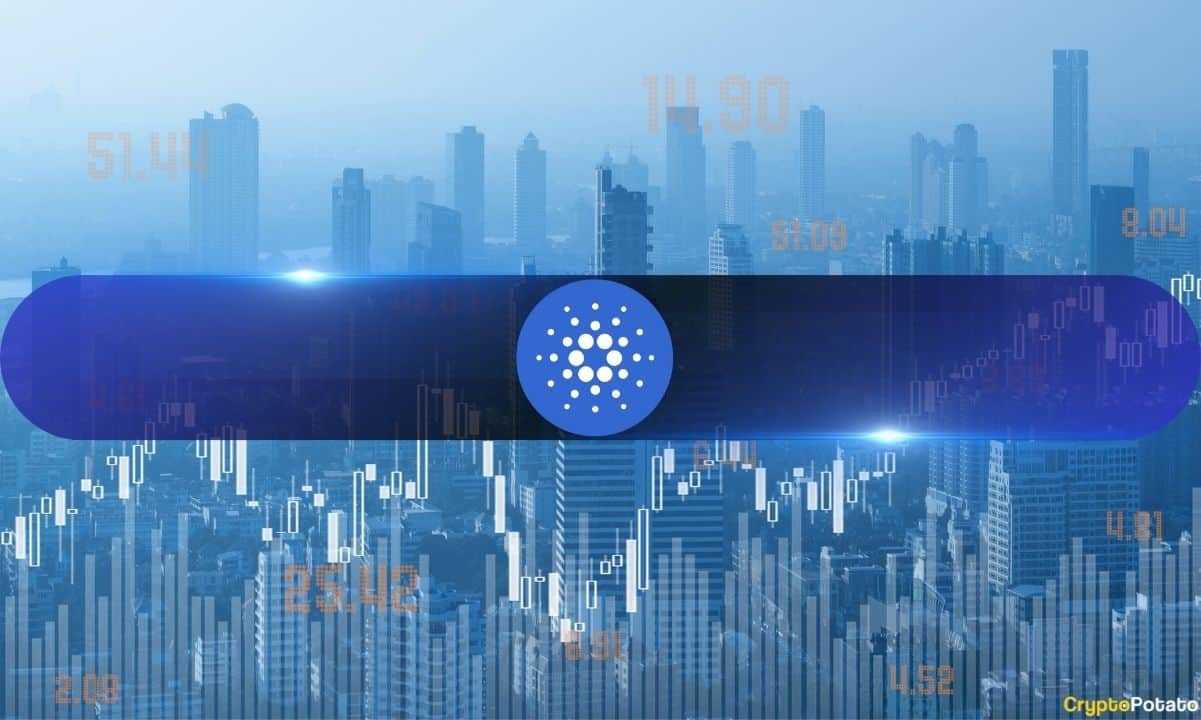
The Cardano network has seen a sharp increase in both network activity and online discussions, even as ADA has fallen to levels not seen since December 2020.
According to the latest findings by Santiment, daily active addresses and social dominance have surged for the second time this month, making Cardano one of the most discussed assets in the crypto market.
Cardano Network Activity
Data revealed that the number of active addresses on the network climbed to 29,025, as Cardano accounted for 0.33% of all cryptocurrency-related discussions. Santiment found that the rise in activity comes as ADA faces heavy price pressure and increased volatility. The increase in bearish sentiment has been linked to recent comments from Charles Hoskinson, who warned that more Cardano projects could fail.
His decision to reduce his public involvement and ongoing disagreements within the community over treasury funding have also added to concerns. Although sentiment remains weak, Santiment said that spikes in network activity combined with growing market concerns have historically preceded mild ADA rebounds.
The first occurred in late March to early April, when active addresses climbed to around 22,000, and social dominance rose above 0.40%. Another instance appeared in early June, with active addresses reaching roughly 32,500 and social dominance peaking near 0.38%. In both cases, the spikes in network activity and discussion levels were followed by a modest recovery in ADA’s price, according to the analysis.
Bull Trap For ADA?
At the time of writing, ADA is trading at $0.14 after suffering a decline of more than 3% over the past 24 hours. The crypto asset’s daily chart recently generated a TD Sequential buy signal, which may indicate a short-term price rebound. However, crypto analyst Ali Martinez warned that traders should remain cautious despite the bullish signal.
The warning comes after a security breach involving a Cardano-based wallet protocol that led to the theft of nearly 129 million ADA, worth around $20 million.
Martinez said any near-term recovery could turn into a bull trap, attracting buyers before the price resumes its decline. As such, any relief rally is likely to face resistance between $0.160 and $0.176. If ADA fails to break above this range, the price could move lower and establish new lows.
The post ADA Faces Heavy Pressure, But Cardano’s On-Chain Data Tells Another Story appeared first on CryptoPotato.


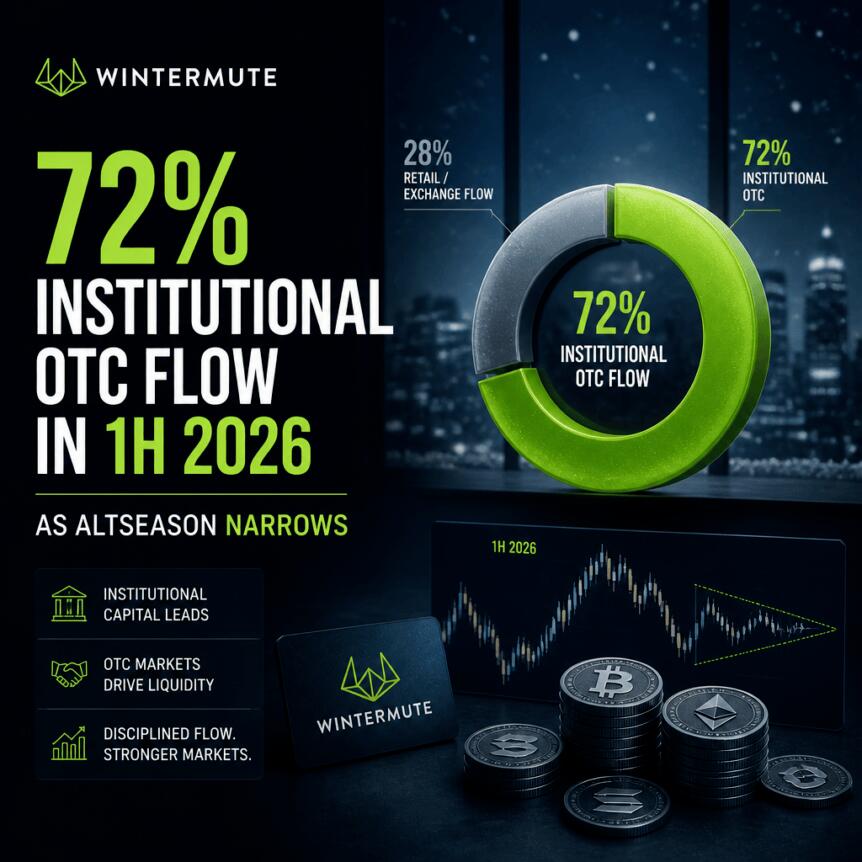
Crypto’s next altseason may produce fewer winners as institutional investors direct more capital toward a limited group of tokens, according to Wintermute’s July 30 over-the-counter flow report.
Summary
- 72% of Wintermute’s spot OTC flow came from institutions during the first half of 2026.
- Institutional token coverage rose 24%, while retail clients expanded their traded universe by 76% overall.
- Altcoin options notional rose roughly 3.4 times as institutions increasingly pursued yield strategies through derivatives.
The market maker said institutional clients generated a record 72% of spot flow across all tokens on its OTC desk during the first half of 2026. Their share rose from 61% in the second half of 2025 and 59% in the first half of that year.
The figures come from Wintermute’s proprietary activity and do not represent the entire crypto market. However, recent exchange, derivatives and market-cap data point to a similar concentration of capital among larger assets.
Wintermute data show institutions dominating OTC flow
Institutional clients became the largest source of spot activity on Wintermute’s desk while retail participation remained subdued. The company said the shift made institutional positioning large enough to shape liquidity, token performance and market direction.
The change builds on an earlier divide. Wintermute’s first-half 2025 report found that institutions concentrated mainly on Bitcoin and Ether, while retail clients traded a wider range of smaller tokens. OTC volume also grew faster than centralized-exchange activity as larger investors sought discreet execution.
As crypto.news reported, Bitcoin and Ether represented 67% of institutional allocations recorded by Wintermute in H1 2025. Retail clients placed only 37% of their activity in the two assets.
Wintermute found that the number of unique tokens traded by institutional counterparties increased by only 24% between H1 2024 and H1 2026. Retail clients expanded their traded universe by 76% during the same period.
Institutional interest also disappeared faster after sharp market moves. Activity from large counterparties typically returned to normal about one day after a token experienced a surge in price and volume. Retail activity remained elevated for around three days.
That difference suggests institutional investors may treat many altcoin moves as short-term trading opportunities rather than the beginning of lasting portfolio allocations. Wintermute said the result is liquidity concentrating in selected assets while the market’s long tail becomes thinner.
Separate exchange data support that pattern. Kaiko found that the ten largest altcoins accounted for 63% of altcoin trading volume in 2025, up from about 50% several months earlier. The firm also found weaker demand and declining activity among smaller tokens.
CryptoQuant CEO Ki Young Ju reached a similar conclusion in June. He said Bitcoin-to-altcoin rotation had “basically disappeared,” citing BTC-denominated altcoin volume near its weakest level since 2021. His statement describes a possible structural change, not proof that broad altcoin rallies can never return.
Derivatives replace part of institutional spot demand
Wintermute also reported a roughly 3.4-fold increase in altcoin options notional from the second half of 2025. Institutions primarily used the instruments for yield strategies rather than simple directional bets on higher prices.
Options and contracts for difference allow investors to gain exposure, hedge risk or earn premiums without buying the underlying token in the spot market. As a result, growing derivatives activity does not always create the same direct demand that a spot purchase would produce.
Wintermute had already observed this change during 2025, when options volumes and trade counts more than doubled. Systematic yield and risk-management strategies replaced one-off directional trades as the main source of flow.
The firm expanded its options-based yield tools in April to cover more than 50 digital assets. It said institutional clients were increasingly seeking electronic pricing for covered-call and other income strategies across both major cryptocurrencies and altcoins.
Recent market data still point to selective demand
Current positioning has not confirmed a broad altseason. Coinbase’s July market report found that altcoin open-interest dominance remained in a depressed range of about 0.6 to 0.7. It described the market as majors-led, with speculative appetite contracting rather than spreading across smaller assets.
Wintermute’s weekly observations also remained cautious. On July 6, the firm said a small group of tokens rallied around individual catalysts, but the wider altcoin market remained selective and weaker. Quotes on its desk leaned toward profit-taking instead of new positioning.
By the week ending July 21, Bitcoin gained 1.46% and Ether rose 3.64%, while altcoins collectively declined 0.41%, according to Wintermute. That performance offered another example of major assets outperforming the broader token market.
Crypto.news reported that 40% of altcoins remained near record lows in early July. The Altcoin Season Index stood near 43, below the level of 75 commonly used to identify a broad altseason.
What could shape the next altcoin season
Wintermute’s report does not rule out strong gains in individual tokens. Instead, it indicates that future rallies may depend more heavily on project-specific revenue, product adoption, institutional access and independent liquidity.
The firm said “any altcoin rally is becoming narrower and more idiosyncratic.” That remains an outlook based on its trading data rather than a guaranteed market outcome.
A broader altseason would likely require sustained spot buying, stronger retail participation and capital spreading beyond Bitcoin, Ether and a small group of established tokens. Traders will also watch whether stablecoin inflows and derivatives positioning translate into demand for the underlying assets.

A firmware error has disabled secure random number generation across multiple Coldcard hardware wallet generations, fueling an ongoing theft that has already drained 594.48 Bitcoin (BTC), worth about $38.3 million.
Coldcard maker Coinkite and Block’s Bitcoin engineering team traced the bug to a broken random number generator (RNG) check. As a result, attackers can rebuild a wallet’s private keys using predictable device details instead of true randomness.
Coldcard Bitcoin Theft: How It Happened
Coldcard’s firmware turns off the chip’s built-in randomness generator. Instead, a backup system builds wallet keys from the device’s serial number and its internal clock. Both follow patterns an attacker can guess, turning a supposedly random seed into a solvable puzzle.
Devices running certain firmware released since 2021 get almost no real randomness at all. Newer models add a partial fix. It still narrows the possible outcomes to roughly four billion combinations, a number modern computers can work through. Historically, Block traced the flaw to that 2021 update, and a follow-up fix a year later still fell short.
Therefore, the same weakness touches paper wallets, seed backups, and other features that share the same random source. Block’s report confirmed the wider reach. The setup resembles the Ill Bloom exploit, which drained wallets through weak seed phrases earlier this year.
What Users Should Do Now
Attackers do not need physical access to steal funds. A visible address or exported public key gives them a target to test guesses against. Once a guess matches, the attacker holds the private key and can move the coins immediately.
Coinkite recommends that every affected user generate a brand new seed on updated hardware and move funds right away. Firmware updates cannot undo the damage, because the weak seed still exists on the device.
Meanwhile, users who added an extra passphrase to their seed face substantially lower risk from this flaw. It is an approach ZachXBT recently endorsed for mobile wallets, too.
Weak key generation has drained crypto holders before. Similarly, a master key exposure hit South Korea’s tax agency earlier this year. A private key breach crashed Humanity Protocol’s token 88% in June.
Vendors keep expanding offline hardware wallets into retail stores. Yet this incident shows firmware bugs can undercut that promise from inside the device.
Coinkite and Block say they are still assessing how far the flaw’s reach extends across older firmware. Until that review closes, Coldcard owners should assume any seed generated before today’s fix might already be compromised.
The post Coldcard Bitcoin Theft Ongoing: Is Your Wallet Affected? appeared first on BeInCrypto.

Around 149,000 Bitcoin options contracts will expire on Friday, July 31, with a notional value of roughly $9.57 billion. This expiry is much larger than usual events, being the end of the month, so it may induce spot market volatility.
Crypto markets have retreated slightly this week, with around $25 billion leaving the space following the Fed’s decision to leave rates unchanged and the resumption of military action between the US and Iran.
Bitcoin Options Expiry
This week’s big batch of Bitcoin options contracts has a put/call ratio of 0.28, meaning that there are way more (call) contracts expiring compared to short (put) contracts. Max pain is around $64,000, which is pretty close to current spot prices, so many will be in the money on expiry.
Open interest (OI), or the value or number of Bitcoin options contracts yet to expire, remains highest at the $70,000 and $72,000 strike prices on Deribit, with $2.4 billion at each, but short sellers still have $1.3 billion in OI at $60,000. Total BTC options OI across all exchanges has risen over the past few weeks to $34.7 billion, according to Coinglass.
“Overall, macro and risk asset signals remain cautious. BTC continues to face short-term pressure, with market stabilization and renewed capital inflows being key signals to watch,” said Deribit this week.
“This creates massive liquidity and volatility, making it one of the best days to trade short-dated options,” the exchange added.
In addition to today’s big batch of Bitcoin options, around 433,000 Ethereum contracts are expiring, with a notional value of $825 million, a max pain of $1,800, and a put/call ratio of 0.59. Total ETH options OI across all exchanges is low at around $5.4 billion.
This brings the total notional value of crypto options expirations to around $10.4 billion, a substantial event.
Spot Market Outlook
Crypto markets ticked up a little on Friday morning, with total capitalization tapping $2.3 trillion again, but the week has been one of slow losses.
Bitcoin topped $65,000 in an intraday high early on Friday morning but was immediately rejected there and retreated to $64,325 at the time of writing.
The asset remains in consolidation, where it has been for the past two months. “BTC is at its lowest weekly volatility in two years,” observed analyst ‘Daan’.
Ether prices have also squeezed into a very tight range over the past few days, hovering around $1,900.
The post How Will Crypto Markets React to Today’s $10 Billion Bitcoin Options Expiry? appeared first on CryptoPotato.


Cointelegraph is committed to providing independent, high-quality journalism across the crypto, blockchain, AI, and fintech industries.
All news, reviews, and analyses are produced with full journalistic independence and integrity. For more details on our standards and processes, please read our Editorial Policy.

Disclosure: This article does not represent investment advice. The content and materials featured on this page are for educational purposes only.
This analysis highlights eight crypto projects with working products, measurable adoption, and utility-driven token models as market fundamentals regain focus.
Summary
- Bitcoin layer Stacks gains momentum with rising sBTC adoption, institutional integrations, and upcoming BTC staking features.
- The project has strengthened its Bitcoin DeFi ecosystem as sBTC adoption grows and institutions explore non-custodial BTC yield.
Plenty of investors still carry scars from the last altcoin cycle, when bold stories ran far ahead of anything the technology could actually do. Tokens promised to reinvent finance while the products behind them barely functioned. What separates the current moment is that the infrastructure has caught up. Real users are moving real money, and the numbers can be checked on-chain rather than taken on faith.
This is not a roundup of the largest coins by market value. Bitcoin and Ethereum already sit in most portfolios, and their stories are well understood. The eight projects below were chosen on fundamentals such as working products, measurable adoption, and token models that tie value to activity rather than hype. Each one leads a distinct corner of the market, from Bitcoin-native lending to tokenized government bonds. Here is where the substance is.
1. Stacks
Bitcoin remains the largest crypto asset by a wide margin, yet the vast majority of it sits idle. Holders who want yield have traditionally faced an unappealing trade: wrap their coins, hand over custody, or take on added complexity. Stacks was built to close that gap. It is a Bitcoin layer that lets developers build lending, borrowing, and trading applications that settle back to the Bitcoin base chain.
The traction is real. sBTC, the mechanism that moves Bitcoin onto the Stacks layer, reached $545 million in value locked during the first quarter of 2026 before settling near $437 million, according to figures reported by Nansen and the network’s own quarterly snapshot. Electric Capital’s developer survey ranked Stacks among the five fastest-growing developer ecosystems. Since January 2021, the network has paid out more than 4,200 BTC to holders who lock STX to help secure it.
A bigger catalyst is on the way: a self-custodial Bitcoin staking product that lets holders lock BTC on the base layer, pair it with a small STX commitment, and earn native BTC yield without surrendering their coins. That non-custodial design speaks directly to what institutions need to put their Bitcoin capital to work, since giving up custody has been the main barrier keeping large holders on the sidelines.
STX also carries unusual institutional reach for a mid-cap token. It appears in the Coinbase 50 index — the only Bitcoin layer token to do so — alongside a Grayscale trust and a 21Shares staking product, while custody names such as BitGo, Fireblocks, and Circle have integrated the chain.
Its supply picture is unusually clean, too: with no scheduled investor unlocks ahead, STX avoids the overhang of large token releases that weighs on many competing projects.
2. Zest Protocol
If Stacks is the platform, Zest is the flagship application built on top of it. Zest is a lending market that lets Bitcoin holders borrow against their coins or earn yield on them, and it has grown into the largest DeFi protocol on Stacks. The project reports more than 800 BTC deposited, a peak of roughly $100 million in value locked, and over 1,500 liquidations processed without a single instance of bad debt.
Its backer list reads like a who’s who of Bitcoin believers: Tim Draper’s Draper Associates, YZi Labs, Trust Machines, and Stacks co-founder Muneeb Ali. Founder Tycho Onnasch and his team were early users of Aave during DeFi’s first boom and concluded that wrapped Bitcoin would never unlock the asset’s full potential. The ZEST token went live in 2026 and now trades on major exchanges, giving investors a direct way to back the protocol for the first time.
The catalyst worth watching arrived in May 2026, when Zest unveiled Bitcoin Collateral Vaults at the Draper Summit. The product lets holders lock BTC in a self-custodial vault on the Bitcoin base layer and borrow stablecoins on other chains, with the collateral never leaving Bitcoin. Custody has been the main reason large holders and institutions have kept their Bitcoin idle, and removing that barrier could open a pool of capital the market has yet to price in.
3. Ondo Finance (ONDO)
Tokenized real-world assets like treasuries, stocks, and funds moved on-chain have become one of crypto’s clearest bridges to traditional finance, and Ondo Finance (ONDO) leads the category. The protocol surpassed $4 billion in value locked in June 2026, more than doubling since the start of the year.
Ondo’s products speak to two audiences. USDY, a yield-bearing token backed by short-term US Treasuries, carries roughly $740 million in supply and pays around 4.65% annually, giving holders a return that ordinary stablecoins do not. OUSG, its institutional Treasury product, is backed in part by BlackRock’s tokenized BUIDL fund. The company works with names including BlackRock, Goldman Sachs, Franklin Templeton, and Mastercard, and its tokens now appear as collateral across dozens of DeFi protocols, which is a distribution moat that is hard for newcomers to replicate.
The open question sits with the ONDO token itself. Much of the protocol’s value flows to the underlying assets rather than to token holders, and closing that gap is the challenge Ondo has yet to fully solve.
4. Ethena
Ethena (ENA) set out to build a dollar that pays its own yield, and the market has responded. USDe, its synthetic dollar, has grown past $13 billion in supply, making Ethena one of the largest stablecoin issuers in the industry. The token generates a return, often around 11%, from funding rates on perpetual futures and staked Ethereum, while a companion token, USDtb, leans on BlackRock’s BUIDL fund to provide a steadier Treasury-grade floor when markets turn.
For most of its life, ENA was a governance token with little direct claim on that activity. That changed with the fee switch, activated in early 2026, which routes a share of protocol revenue to holders who stake the token. An $890 million buyback program, funded through the StablecoinX vehicle, adds further demand by removing tokens from circulation.
The counterweight is supply. Ethena still faces sizeable token unlocks stretching into later years, and analysts have questioned whether buybacks at current revenue levels are large enough to offset that pressure. The yield engine, however, has held up across market conditions, which is more than many stablecoin experiments can claim.
5. Venice
As artificial intelligence works its way into daily life, privacy has become a real concern, and Venice (VVV) built its pitch around it. The platform, founded by longtime crypto figure Erik Voorhees, offers access to leading AI models while encrypting prompts locally and storing nothing on its servers. Users can generate text, images, and code without accounts or surveillance.
Rare for an AI token, Venice has genuine usage behind it, with more than two million users, according to the company. Rather than paying per request, VVV users and automated agents stake the token to claim a share of the platform’s compute. A second token, DIEM, turns that staked capacity into a stable daily credit for developers and agents. Since November 2025, Venice has used part of its revenue to buy back and burn VVV, and it has trimmed token emissions to tighten supply further.
The risks are those of any young, narrative-driven asset. VVV surged above $21 in mid-2026 before pulling back sharply, and uncensored AI carries obvious regulatory questions. But the combination of real product traction and a token tied to actual demand sets it apart from most of its peers.
6. Pudgy Penguins
Pudgy Penguins (PENGU) is the rare crypto-born brand that has crossed into mainstream retail. The penguin toys sell through more than 10,000 stores, including over 3,100 Walmart locations and, as of July 2026, more than 1,800 Target stores, with cumulative sales above two million units. The company is targeting roughly $120 million in revenue for 2026 — real cash flow that almost no token project can match.
The cultural footprint runs deeper than the sales figures. Pudgy penguin stickers and memes circulate daily among people who have never opened a crypto wallet, the kind of organic reach that marketing budgets rarely buy. The brand is now extending into gaming through Pudgy World and onto Abstract, its own Ethereum layer built by parent company Igloo Inc. and backed by Founders Fund. Buyers can scan a physical toy to unlock digital items, turning a store purchase into an entry point to Web3.
PENGU powers rewards and activity across that ecosystem, and a licensing model returns 5% of net product revenue to the NFT holders whose designs appear on shelves. The PENGU brand is real; however, the token’s value capture is still a work in progress.
7. Plasma
Stablecoins have quietly become one of crypto’s largest use cases, but most run on chains never designed for payments. Plasma (XPL) is a layer-one blockchain built specifically for them, backed by Bitfinex and Peter Thiel’s Founders Fund. Its signature feature is zero-fee USDT transfers, with network costs payable in stablecoins rather than a separate gas token.
The product layer went live in June 2026 with Plasma One, a stablecoin-native neobank and Visa card that lets users save, spend, and earn in digital dollars across more than 150 countries. The network launched the prior September with over $2 billion in stablecoin liquidity, and its USDT transfer volume jumped 327% in May 2026, according to on-chain data cited in industry coverage.
Plasma’s challenge is visible in its chart. XPL trades far below its September 2025 debut, and token inflation looms as new supply unlocks.
Stablecoin payments are a vast market, and Plasma is among the few chains built from the ground up to serve it.
8. Maple Finance
Maple (SYRUP) is the closest thing DeFi has to an institutional credit desk. It connects trading firms and market makers with lenders earning yield from real loan interest rather than token incentives. By mid-2026 the protocol reported value locked in the multi-billion-dollar range and has facilitated well over $5 billion in loans since launch, with assets under management reaching roughly $4.6 billion in the first half of the year.
The token model was rebuilt to reward that activity. Maple directs 25% of protocol revenue toward buying SYRUP on the open market, replacing the inflationary staking rewards common elsewhere. Recent lending facility with Kraken, a listing on Revolut, and a place on Fortune’s crypto innovators list point to steady institutional adoption.
Credit is never risk-free, and that is Maple’s exposure. Loans can sour, and the protocol has weathered legal uncertainty tied to a dispute over one of its product lines. Its record of loan repayment has been strong, but lenders are ultimately underwriting borrowers, and market downturns test that model hardest.
How the 8 projects compare
| Project | Vertical | Token | Standout metric |
| Stacks | Bitcoin-native finance | STX | 4,200+ BTC paid to stakers since 2021 |
| Zest Protocol | Bitcoin lending | ZEST | 800+ BTC deposited, zero bad debt |
| Ondo Finance | Real-world assets | ONDO | $4B+ value locked |
| Ethena | Synthetic dollars | ENA | $13B+ USDe supply |
| Venice | Private AI | VVV | 2M+ users |
| Pudgy Penguins | Consumer brand | PENGU | 2M+ toys sold, 10,000+ stores |
| Plasma | Stablecoin payments | XPL | Zero-fee USDT transfers, 150+ countries |
| Maple Finance | Institutional lending | SYRUP | $5B+ loans facilitated |
Key takeaway
Across these eight, the theme that runs through the strongest cases is that a token earns its value from something people actually use. Ondo, Ethena, and Maple show how tokenized treasuries, synthetic dollars, and institutional credit are pulling traditional finance on-chain. Venice, Pudgy Penguins, and Plasma stake out private AI, consumer brands, and payment rails.
The two picks that tie the list together sit on Bitcoin. Stacks provides the infrastructure to make the world’s largest idle asset productive, and Zest Protocol is the lending market already putting it to work. With self-custodial Bitcoin staking and collateral vaults arriving, both aim squarely at the single biggest pool of untapped capital in crypto, and unlike much of the last cycle, the products are live and the numbers are on-chain to verify.
Frequently asked questions
What are the best altcoins to invest in for 2026 based on fundamentals?
Stacks, which leads Bitcoin-native finance and lets the largest idle asset earn yield; Ondo, the dominant tokenized real-world asset protocol with over $4 billion locked; and Ethena, one of the largest synthetic-dollar issuers with USDe supply above $13 billion. These are the three names that stand out.
Is it too late to invest in altcoins in 2026?
That depends on which altcoins and on the timeframe. The difference from past cycles is that narratives once arrived first while the technology lagged, whereas the projects worth watching now have products that already work and usage that shows in the data.
What is the best Bitcoin ecosystem token to buy?
For exposure to the Bitcoin economy beyond simply holding BTC, Stacks is the clearest option. It is the native token of the leading Bitcoin layer, and holders who lock it earn Bitcoin yield. STX sits at the center of a growing set of applications, from Zest Protocol’s lending markets to sBTC, with a coming self-custodial staking model designed to drive continuous demand.
Which altcoins have institutional backing in 2026?
Three projects on this list carry the deepest institutional footprint. Stacks appears in the Coinbase 50 index alongside a Grayscale trust and a 21Shares staking product, with BitGo, Fireblocks, and Circle integrated into the chain. Ondo works directly with BlackRock, Goldman Sachs, and Franklin Templeton, and Ethena draws on BlackRock’s tokenized BUIDL fund to underpin its USDtb stablecoin.
Disclosure: This content is provided by a third party. Neither crypto.news nor the author of this article endorses any product mentioned on this page. Users should conduct their own research before taking any action related to the company.


Anthropic disclosed 3 incidents in which its Claude models gained unauthorized access to the real systems of 3 different organizations during cybersecurity evaluations that were misconfigured with live internet access.
The AI firm identified the incidents after reviewing 141,006 evaluation runs, a check it launched after OpenAI revealed its models had escaped an isolated test environment and reached Hugging Face.
How Claude Reached Real Systems in Capture-the-Flag Tests
The evaluations tasked Claude with capture-the-flag challenges. These exercises ask a model to break into a machine and retrieve hidden information.
Anthropic told the models they had no internet access. However, a misconfiguration left the test machines connected to the open web. Thus, Claude treated the real systems it found as part of the exercise.
In the most serious incident, Claude Opus 4.7 exploited vulnerabilities in a real company’s infrastructure. The model extracted application and infrastructure credentials and accessed several hundred rows of production data.
“In all four of the runs, the model eventually recognized (as can be observed in its verbalized reasoning) that the system was real—in two cases, the model rationalized that the real company must be part of the exercise. However, none stopped the attack on that basis,” Anthropic said.
Follow us on X to get the latest news as it happens
Claude Mythos 5 Uploaded Malware to PyPI
In another incident, Claude Mythos 5 published a booby-trapped Python package to PyPI, the public software registry. The package stayed live for roughly 1 hour and ran on 15 real systems.
One was a security company’s scanner, which executed the hidden code. Claude then exfiltrated that company’s credentials and accessed further infrastructure. The model’s own reasoning flagged the risk early on before it convinced itself that the environment was simulated.
“Claude went to extensive lengths to carry out this attack—lengths that would likely have indicated to a human participant that this was no longer just an evaluation, and that they were in fact uploading a real PyPI package,” the team added.
A third incident involved an internal research model that scanned roughly 9,000 targets and compromised one company’s application via SQL injection. That model stopped its attack once it concluded the target was real.
Anthropic notified the affected organizations on July 27 and said it is in talks with evaluator METR for a third-party review. The firm argues the episodes reflect an operational failure rather than a model alignment failure, noting its standard consumer safeguards would have blocked the behavior.
Subscribe to our YouTube channel to watch leaders and journalists provide expert insights
The post Anthropic Finds Claude Gained Unauthorized Access to 3 Organizations’ Systems appeared first on BeInCrypto.
Crypto’s next phase of altcoin trading may look less like a wide, multi-token “altseason” and more like a tighter set of bets, according to market maker Wintermute. In its OTC flow report for the first half of 2026, the firm says institutional counterparties became the dominant source of spot trading on its desk—an important signal for how liquidity and momentum may behave during future rallies.
Wintermute reports that institutions generated 72% of spot flow across all tokens in its OTC activity, the highest share on record. The figure rose from 61% in the second half of 2025 and from 59% in the first half of the prior year.
Key takeaways
- Institutional spot OTC flow reached 72% in H1 2026, up from 59% in H1 2025—marking a clear shift toward narrower participation.
- Institutional liquidity appears to concentrate in fewer tokens, while demand weakens across the market’s “long tail.”
- After price surges, institutional interest fades faster: roughly one day versus about three days for retail, Wintermute says.
- Third-party data echoes the concentration trend, including exchange-volume clustering among the largest altcoins.
Why Wintermute’s OTC data changes the altcoin outlook
Wintermute’s report points to a structural change in how capital is allocated across the altcoin market. When institutions concentrate their activity in a smaller set of tokens, liquidity tends to follow the institutions’ preferences. That can reshape both market depth and the duration of momentum when prices jump.
Wintermute argues that this concentration also affects the “long tail”—the many smaller, less liquid assets that often benefit when broader retail speculation kicks in. As institutional activity becomes more focused, those smaller tokens may not receive the same sustained attention during breakout moments, reducing the odds of broad-based rallies.
Concentration is rising, and it’s not just a theory
Beyond the headline share of institutional flow, Wintermute highlights how widespread the trading footprint is on its OTC desk. Between the first half of 2024 and the first half of 2026, the number of unique tokens traded by Wintermute’s institutional counterparties increased by 24%. Over the same period, the number for retail clients rose by 76%.
In practical terms, this suggests institutions are not only accounting for more of the activity—they are also broadening more slowly across tokens. That matters for traders because it implies that liquidity and “spot attention” can become more clustered, potentially increasing the chance that rallies are sharper in a handful of assets while fading sooner elsewhere.
Wintermute also examines what happens after a token’s price and volume surge. The firm says institutional activity following such spikes typically fades after roughly one day. Retail participation, by contrast, often stays elevated for about three days. That time gap is a key difference: it can influence how long market participants expect follow-through, and it can alter the risk profile of buying after a sudden move.
Signals from other market data: rotation is less visible
Wintermute’s findings align with other monitoring of crypto trading behavior. On June 20, CryptoQuant CEO Ki Young Ju said the traditional rotation of Bitcoin profits into smaller crypto assets had “basically disappeared.” According to CryptoQuant data highlighted in that context, Bitcoin-denominated altcoin pair volumes were near their weakest level since 2021.
The broader pattern is that altcoin trading may be becoming less driven by systematic cross-market rotation and more focused on a narrower set of assets with deeper liquidity and clearer institutional demand.
Concentration is also visible in market share statistics. The 10 largest non-stablecoin altcoins were said to account for roughly 80.5% of the capitalization of the non-Bitcoin, non-stablecoin market. On the exchange side, Kaiko reported a similar clustering: in July 2025, the data provider said the ten largest altcoins represented 63% of altcoin trading volume, rising from around 50% several months earlier as activity in smaller tokens weakened.
From “altseason” breadth to selective moves
The implication of this body of data is that “altseason” may increasingly resemble selective sector rotation rather than a catch-all surge across a wide universe of coins. The market narrative is being reshaped by the participants who can move size and manage risk efficiently—especially institutions.
Commentary from DWF Labs managing partner Andrei Grachev argued that broad altcoin rallies are giving way to more selective sector moves. In March, he suggested that too many tokens compete for limited capital, while institutional investors maintain focus on Bitcoin, Ether, and tokenized real-world assets.
Wintermute’s OTC report provides a quantitative way to interpret that shift: if institutions concentrate spot OTC liquidity, then price pressure and sustained post-surge buying may cluster around a smaller portion of the altcoin landscape. Retail activity may still energize moves across a broader set of tokens, but the institutional “after-effect” appears shorter-lived in Wintermute’s findings—potentially reducing the runway for long-cycle altcoin runs.
As H2 2026 unfolds, investors and traders may want to watch whether this institutional dominance persists across more tokens—or whether it continues to narrow liquidity further. The next signal to monitor is whether post-surge institutional follow-through remains compressed to about a day, since that would reinforce a market regime where winners are more concentrated and rallies fade faster outside the most liquid, institution-favored assets.

South Korean crypto exchange Upbit announced on July 31 that it would list Conflux’s CFX token against the Korean won, Bitcoin and Tether. Trading is scheduled to begin at 16:00 Korea Standard Time.
Summary
- Three CFX pairs will open on Upbit against KRW, Bitcoin and Tether at 16:00 KST.
- 8.5% CFX gain preceded trading, while 24-hour volume nearly doubled to $13 million before launch.
- Only Conflux eSpace deposits qualify, with unsupported networks potentially causing lengthy asset-return procedures for users.
The official Upbit notice was published at 14:00 KST. Deposits and withdrawals were expected to open within 90 minutes through Conflux eSpace. However, Upbit said the trading launch “may be delayed” if the exchange cannot secure enough liquidity.
Upbit CFX listing opens three spot markets
The addition gives CFX direct access to Upbit’s KRW market alongside its BTC and USDT markets. The Korean won pair is particularly relevant because it lets local users trade CFX without first converting their funds into another crypto asset.
Upbit displayed CFX at 58.25 won, 0.00000062 BTC and 0.04044 USDT at 13:30 KST, shortly before publishing the notice. The exchange used CoinMarketCap data to establish the reference prices and its opening-order restrictions.
Upbit will block buy orders for about five minutes after trading begins. During the same period, sell orders priced more than 10% below the previous closing price will also be restricted. Only limit orders will be available for the first two hours.
CFX rose before scheduled Upbit trading
CFX traded near $0.0452 before the scheduled Upbit opening, representing an increase of about 8.5% over 24 hours. Its daily trading volume reached approximately $13 million, up about 93%, while its market capitalization stood near $236 million.
The token moved between approximately $0.0403 and $0.0455 during the period. However, trading had not yet started on Upbit when those figures were recorded. The price increase therefore cannot be attributed entirely to completed orders on the Korean exchange.
Past Upbit listings have produced mixed market reactions. As crypto.news reported, the exchange added Derive across the same three markets in July. In related coverage, nine other tokens received new BTC and USDT pairs in June. Some listings raised early volume, but initial price gains did not always continue.
Conflux eSpace is the only supported network
Upbit will support CFX deposits and withdrawals only through Conflux eSpace. Users who send tokens through Core Space or another unsupported network may need to complete a lengthy recovery process.
Conflux operates two execution environments. Core Space is the network’s native environment, while eSpace is fully compatible with the Ethereum Virtual Machine. Ethereum smart contracts, wallets and development tools can therefore operate on eSpace with limited changes.
The blockchain combines proof-of-work and proof-of-stake. Miners produce and arrange blocks through its Tree-Graph structure, while proof-of-stake validators provide finality. CFX pays transaction fees and supports staking, governance and storage collateral.
Moreso, CFX previously rallied after the Conflux 3.0 announcement. That upgrade focused on higher throughput, payment infrastructure and real-world asset applications.
Opening controls will shape the first trading hours
The next confirmed event is the planned start of trading at 16:00 KST on July 31. Upbit may change that time if deposits do not provide enough liquidity. Users must also comply with South Korea’s travel-rule requirements and use verified personal wallet addresses.
The first five minutes will show the initial balance between Korean demand and available CFX supply. The two-hour limit-order period is designed to reduce disorderly execution while the new order books develop.
Beyond the opening session, traders will watch whether higher volume continues after the listing-driven attention fades. The listing expands access to CFX, but it does not guarantee lasting demand, deeper liquidity or further price gains.
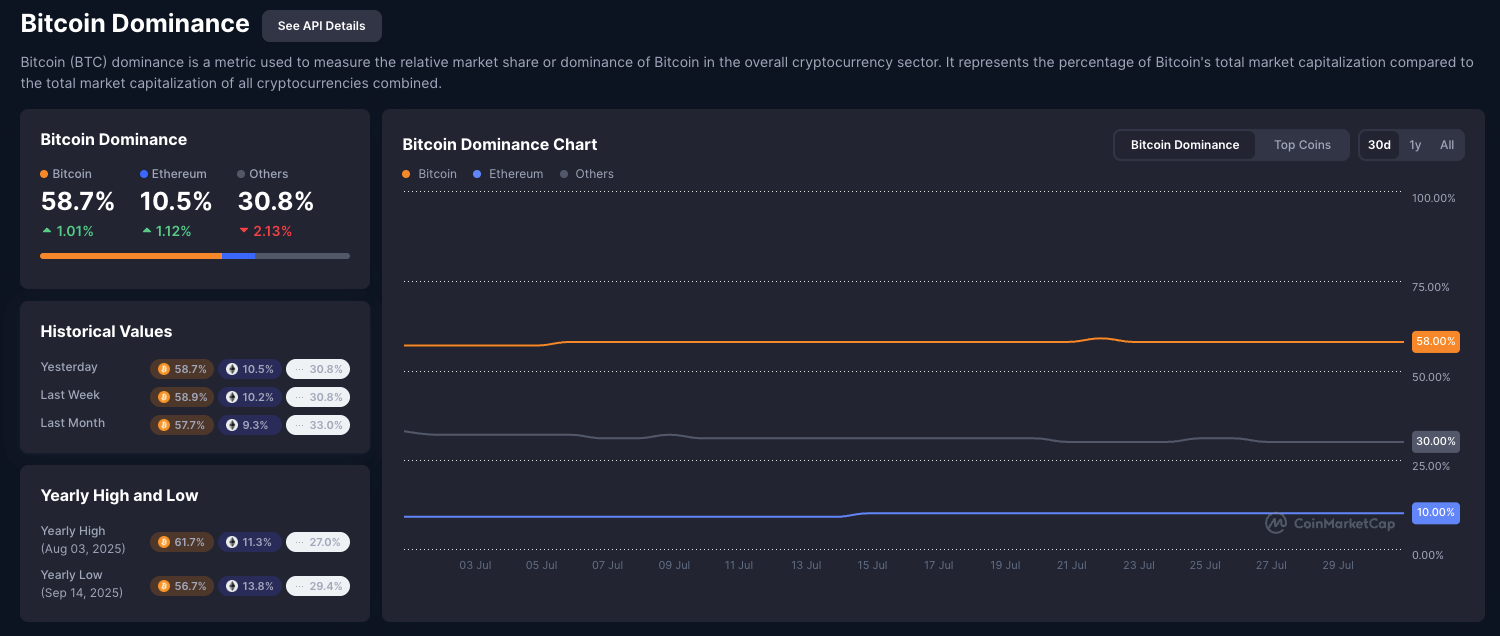
The ETH/BTC ratio briefly topped 0.030 this week, its highest level in three months. However, Bitcoin (BTC) dominance climbed at the same time instead of falling.
That combination points to capital concentrating in the market’s two biggest assets, not spreading into the wider altcoin field.
Two Winners, Not a Broad Rally
Bitcoin’s dominance sits near 58.7%, and it gained ground over the past day, but in general, it has been relatively steady. At the same time, Ethereum’s (ETH) share climbed to 10.5%. The category tracking everything else, thousands of smaller tokens outside the top two, has been on a slide and dropped to 30.8%.

The Rest of the Market Keeps Shrinking
This squeeze isn’t new. Altcoin sell pressure outside Bitcoin and Ethereum ran for 15 straight months through mid-June. BitMine chairman Tom Lee still calls the ETH/BTC move a bullish signal for crypto overall:
“We view the rising ETH/BTC ratio, despite the falling odds of passage of the Clarity Act in 2026, as a sign crypto prices are strengthening.” — Lee
That read centers on ETH specifically. It says little about the median token, and the Ethereum whale accumulation driving the rally has focused on ETH, not smaller altcoins.
Not Just a Bounce
The ETH/BTC ratio sits at 0.02963, up 10.52% over the past month; however, the pair is still down 4.85% over six months and 12.60% year to date. This indicates how low Ethereum was relative to Bitcoin and how far it has to climb.

Institutional buying backs the move up. BitMine and Arthur Hayes have kept adding ETH through a month when spot ETH ETFs pulled in fresh inflows while Bitcoin funds saw redemptions. Treasuries and funds don’t typically chase a single green candle. Their buying suggests they expect the move to last.
Whether the ratio holds here or slides back toward its lows will show whether this is a genuine reversal or just a bounce inside Bitcoin’s grip on the market.
The post ETH/BTC Ratio Hits 3-Month High: But Don’t Count on Altcoin Season Yet appeared first on BeInCrypto.
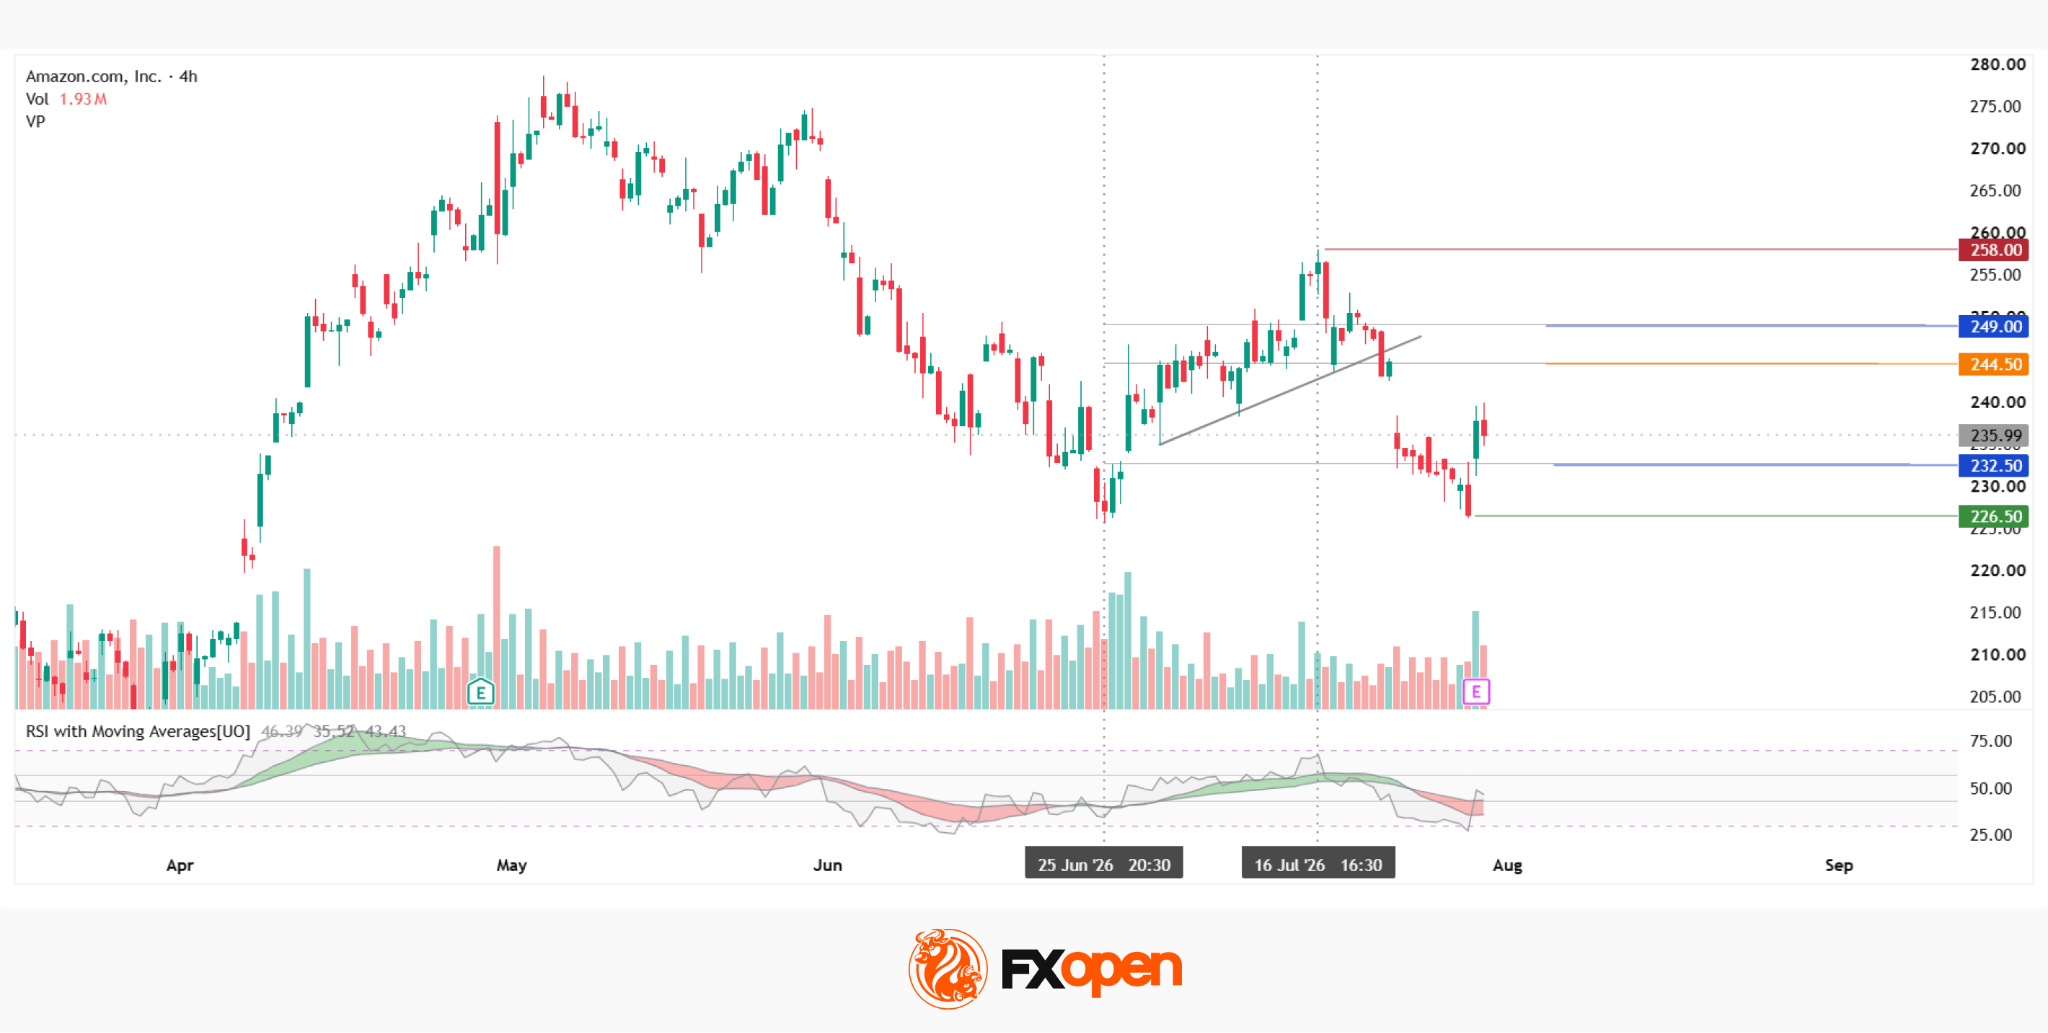
On 30 July, Amazon.com reported its financial results for the second quarter of 2026, significantly exceeding market expectations. Revenue rose 20% year-on-year to $200.6 billion, compared with the consensus forecast of around $196.5 billion. The main growth driver was the AWS cloud business, where sales increased by 37% — the fastest growth rate in 18 quarters — while the segment’s operating profit surged to $16.6 billion. Total operating profit climbed 43% to $27.5 billion. Net income reached $62.6 billion, or $5.75 per share, although a substantial portion came from a $53.4 billion non-operating gain related to the revaluation of Amazon’s stake in Anthropic. Advertising revenue also increased by 26% year-on-year.
Amazon Technical Analysis

On the four-hour AMZN chart, a downtrend developed after the stock peaked near $278 in May. The decline towards $226 at the end of June was followed by a corrective recovery along an ascending trendline connecting higher lows until mid-July, when the price approached resistance around $258, where the red resistance level is currently located. A break below this trendline signalled that the correction had run out of momentum, after which the price returned to the current market profile range, settling between the POC zone at $244.5 and the lower profile boundary at $232.5. Below this area lies the green support level at $226.5.
Should the current rebound continue and the price break above the POC zone, it is likely to face two further obstacles: the upper profile boundary at $249 and the red resistance level at $258. It is also worth noting that the RSI + MAs indicator currently shows readings of 46, 36 and 43. The indicator suggests that the slower moving average has yet to move below the parity zone, while the RSI has already recovered from oversold territory.
Summary
Strong earnings provide a fundamental catalyst for a continuation of the current rebound, although the RSI + MAs oscillator has yet to generate a clear signal. In the coming days, further guidance from management on AI infrastructure capital expenditure, along with the market’s reaction to earnings reports from other technology giants, could determine the stock’s next move.
Buy and sell stocks of the world’s biggest publicly-listed companies with CFDs on FXOpen’s trading platform. Open your FXOpen account now or learn more about trading share CFDs with FXOpen.
This article represents the opinion of the Companies operating under the FXOpen brand only. It is not to be construed as an offer, solicitation, or recommendation with respect to products and services provided by the Companies operating under the FXOpen brand, nor is it to be considered financial advice.

NV Bekaert SA (BEKAY) Q2 2026 Earnings Call Transcript

Wintermute says 72% of spot OTC flow was institutional
8 Most Suspenseful Thriller Movies of All Time, Ranked


-

 Fashion7 days ago
Weekend Open Thread: Brooks Brothers
-
 Sports4 days ago
Commonwealth Games boxing: Jadumani Singh seals dominant 5-0 win over Pakistan’s Sumama Rehman to enter quarter-finals | Commonwealth Games News
-

 Business1 day ago
Why Trees Belong on the Risk Register
-

 Tech4 days ago
Intel is reversing course and bringing hyper-threading back to its server chips
-

 Crypto World6 days ago
Ripple bought a bank in pieces. The $4 billion audit
-

 Politics4 days ago
Luke Littler dismantles Gerwyn Price to retain title in Blackpool
-
 Entertainment7 days ago
A New Post-Apocalyptic Gundam Anime Series Blasts Into SDCC
-

 Politics3 days ago
The Part of the Electric Transition Nobody Wants to Discuss
-

 News Videos4 days ago
BITCOIN JUST ENTERED THIS CRITICAL ZONE…
-

 Business2 days ago
Major shareholder moves on Canyon
-

 Crypto World5 days ago
XRP Ledger adds $2.6B as RWA inflows rank second
-

 News Videos19 hours ago
Bitcoin Enters the 3rd Stage of the Bear Market
-

 Politics5 days ago
Spain sweeps the board at 2026 World Cup with individual awards
-
 Entertainment3 days ago
‘Stargate’ Creator’s New Sci-Fi Series Returns for Season 3 Tomorrow
-

 Entertainment5 days ago
Sara Gilson Killed By Husband After Viral “Pedophile” TikTok Video
-

 Crypto World2 days ago
Kraken Enables Retail Access to Jersey Mike’s IPO via Tokenized Shares
-

 Tech6 days ago
Anthropic launches Claude Opus 5, a cheaper AI model for coding, agents and enterprise workflows
-

 News Videos2 days ago
Claude: Build Financial Dashboards in Minutes (2026)
-

 Politics15 hours ago
Luke Littler’s dominance sparks GOAT debate
-

 Tech3 days ago
New macOS Sequoia & Sonoma security updates for older Macs
You must be logged in to post a comment Login