
Crypto World
AI Memory Rout Wipes 9% Off Nvidia Stock: Chart Says More Pain Ahead
Nvidia (NVDA) stock closed above $165 on March 30, down over 9% since March 25. It now sits directly on the neckline of a head-and-shoulders pattern that projects an 11% measured breakdown if it fails.
The decline has brought Nvidia stock to its most critical technical test since early 2026. Now, the daily chart, institutional flow data, and options positioning are all pointing in different directions.
AI Memory Sell-Off Pushes Nvidia to the Neckline
The catalyst behind the 9% NVDA price decline traces back to March 24. This is when Google announced TurboQuant, a memory compression algorithm that reduces AI model memory requirements by 6x without sacrificing performance.
The announcement triggered a sharp sell-off across AI memory manufacturers. Micron dropped roughly 20%, and SanDisk fell approximately 18% in the days that followed.
Reports that OpenAI is scaling back data center spending compounded the pressure. OpenAI’s October 2025 deal to secure 40% of global DRAM supply had been a key pillar of the memory shortage thesis. Any pullback from that commitment weakens the demand outlook for high-bandwidth memory, which feeds directly into Nvidia’s GPU production pipeline.
The combination dragged the NVDA stock price to $165 by March 30.
The daily chart shows the damage in structural terms. The AI memory rout nearly pushed the NVDA stock beyond the head-and-shoulders neckline. If the neckline breaks, the NVDA stock price might end up correcting by another 11%, per target projections. The sloping-down neckline makes a clean breakdown harder to trigger because the price must keep falling to reach it, but NVDA is now inches away.
The Chaikin Money Flow (CMF) indicator, a proxy for institutional buying and selling pressure, adds nuance. CMF attempted to cross above zero between March 10 and 16. This signalled a brief return of institutional buying interest, but failed and has since declined to -0.24.
Yet, between February 5 and March 30, as the stock prices trended lower, the CMF still managed to hold higher.
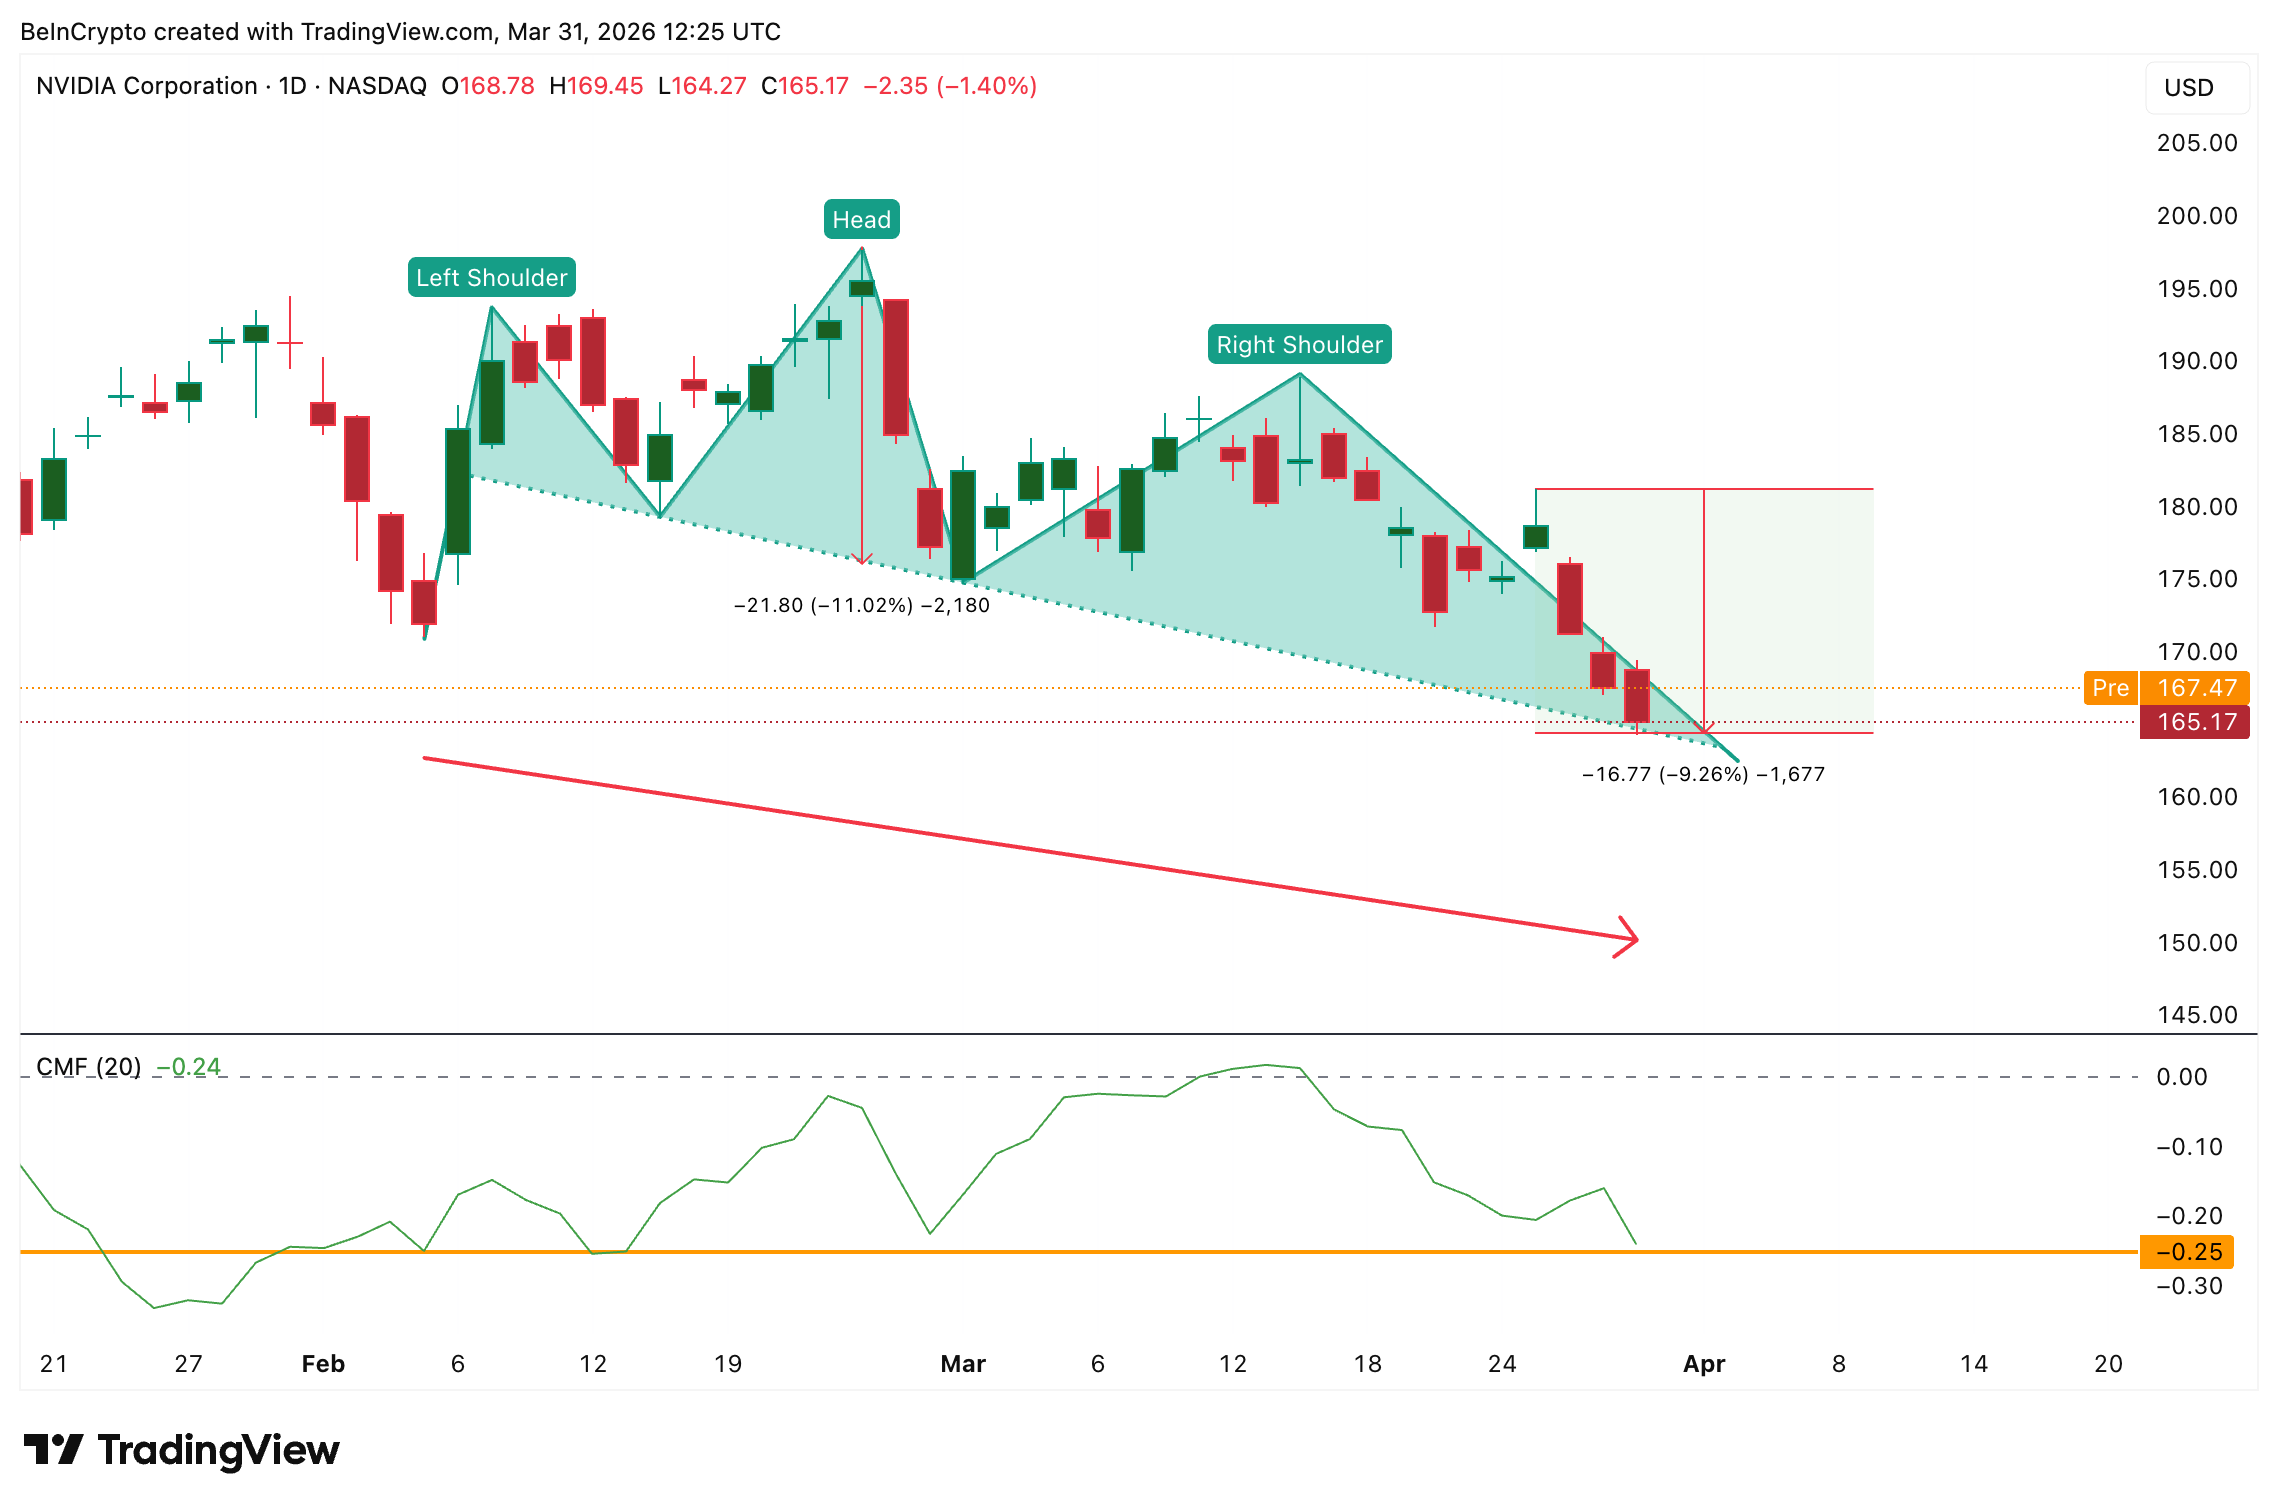
That reading sits just above the -0.25. If CMF breaks below -0.25, it would confirm institutional sellers are driving the move, and the neckline breakdown becomes significantly more likely.
Put-Call Ratio Shows Options Traders Buying Into the Dip
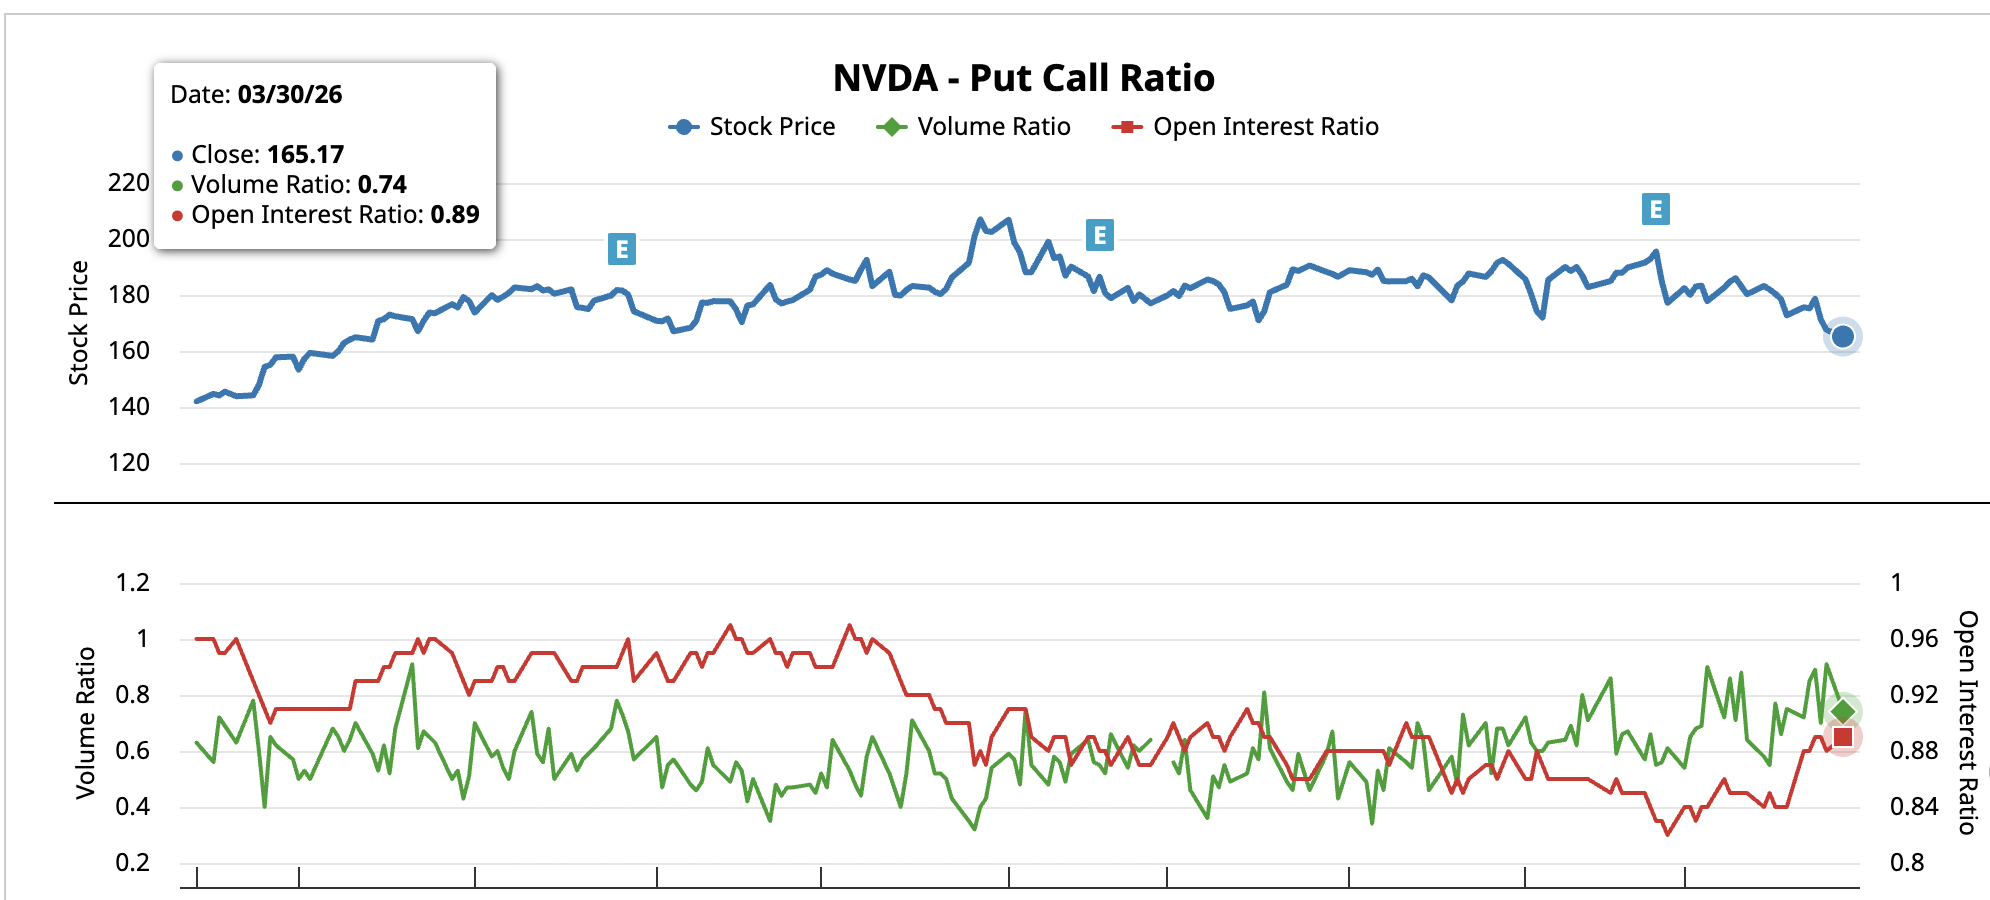
While the price chart and money flow data point to weakness, the Nvidia put-call ratio tells a contrarian story. On March 25, when the sell-off started, the put-call volume ratio stood at 0.89, nearly balanced between bearish puts and bullish calls.
By March 30, the volume ratio had dropped 16.8% to 0.74, meaning call volume (bullish bets) expanded significantly relative to put volume as prices fell. The broader market might be looking at the bullish targets for NVDA, as proposed by Wall Street Analysts.
UBS analyst Timothy Arcuri reiterated a Buy rating on Nvidia shares with a $245 price target on March 20, implying 48% upside. That call, issued five days before the AI memory rout began, prices in continued demand driven by Rubin GPU shipments and treats the memory supply disruption as a short-term headwind rather than a structural shift.

A volume ratio below 0.80 on a stock that just dropped over 9% in five sessions is unusual. It signals that options traders are using the decline to build bullish positions rather than hedging for further downside.
Want more insights like this? Sign up for Editor Harsh Notariya’s Daily Crypto Newsletter here.
The open interest ratio, which reflects longer-duration positioning, held at 0.89, meaning the existing put-heavy book from earlier in the sell-off remains intact. New activity skews bullish, but the older short base has not been unwound.
That divergence between falling price and rising call activity aligns with UBS’s institutional view and creates a setup where a confirmed bounce off the neckline could trigger a short squeeze in the options market. However, if the neckline breaks, call buyers would face rapid losses, and the unwinding could accelerate the move toward the deeper price targets.
Key Nvidia Stock Price Levels to Watch
The Nvidia stock price now trades below all four major exponential moving averages (EMAs). Exponential moving averages (EMAs) are trend indicators that weight recent prices more heavily to identify directional momentum.
The 20-day EMA sits at $177, the 50-day and 100-day EMAs at $181, and the 200-day at $174. The bearish crossover between the 50-day and 100-day EMA completed during the final week of March, adding a long-term headwind. That headwind seems to have played its part in leading the NVDA price correction.
The key technical levels place the 0.618 level at $174, which closely aligns with the 200-day EMA. That $173-$174 zone becomes the critical reclaim target. A move back above $165 neutralizes the immediate neckline threat, while a reclaim of $174 would place the price above the 200-day EMA and open the path toward $183 and $188. Beyond $188, the UBS analyst’s price target could start looking practical.
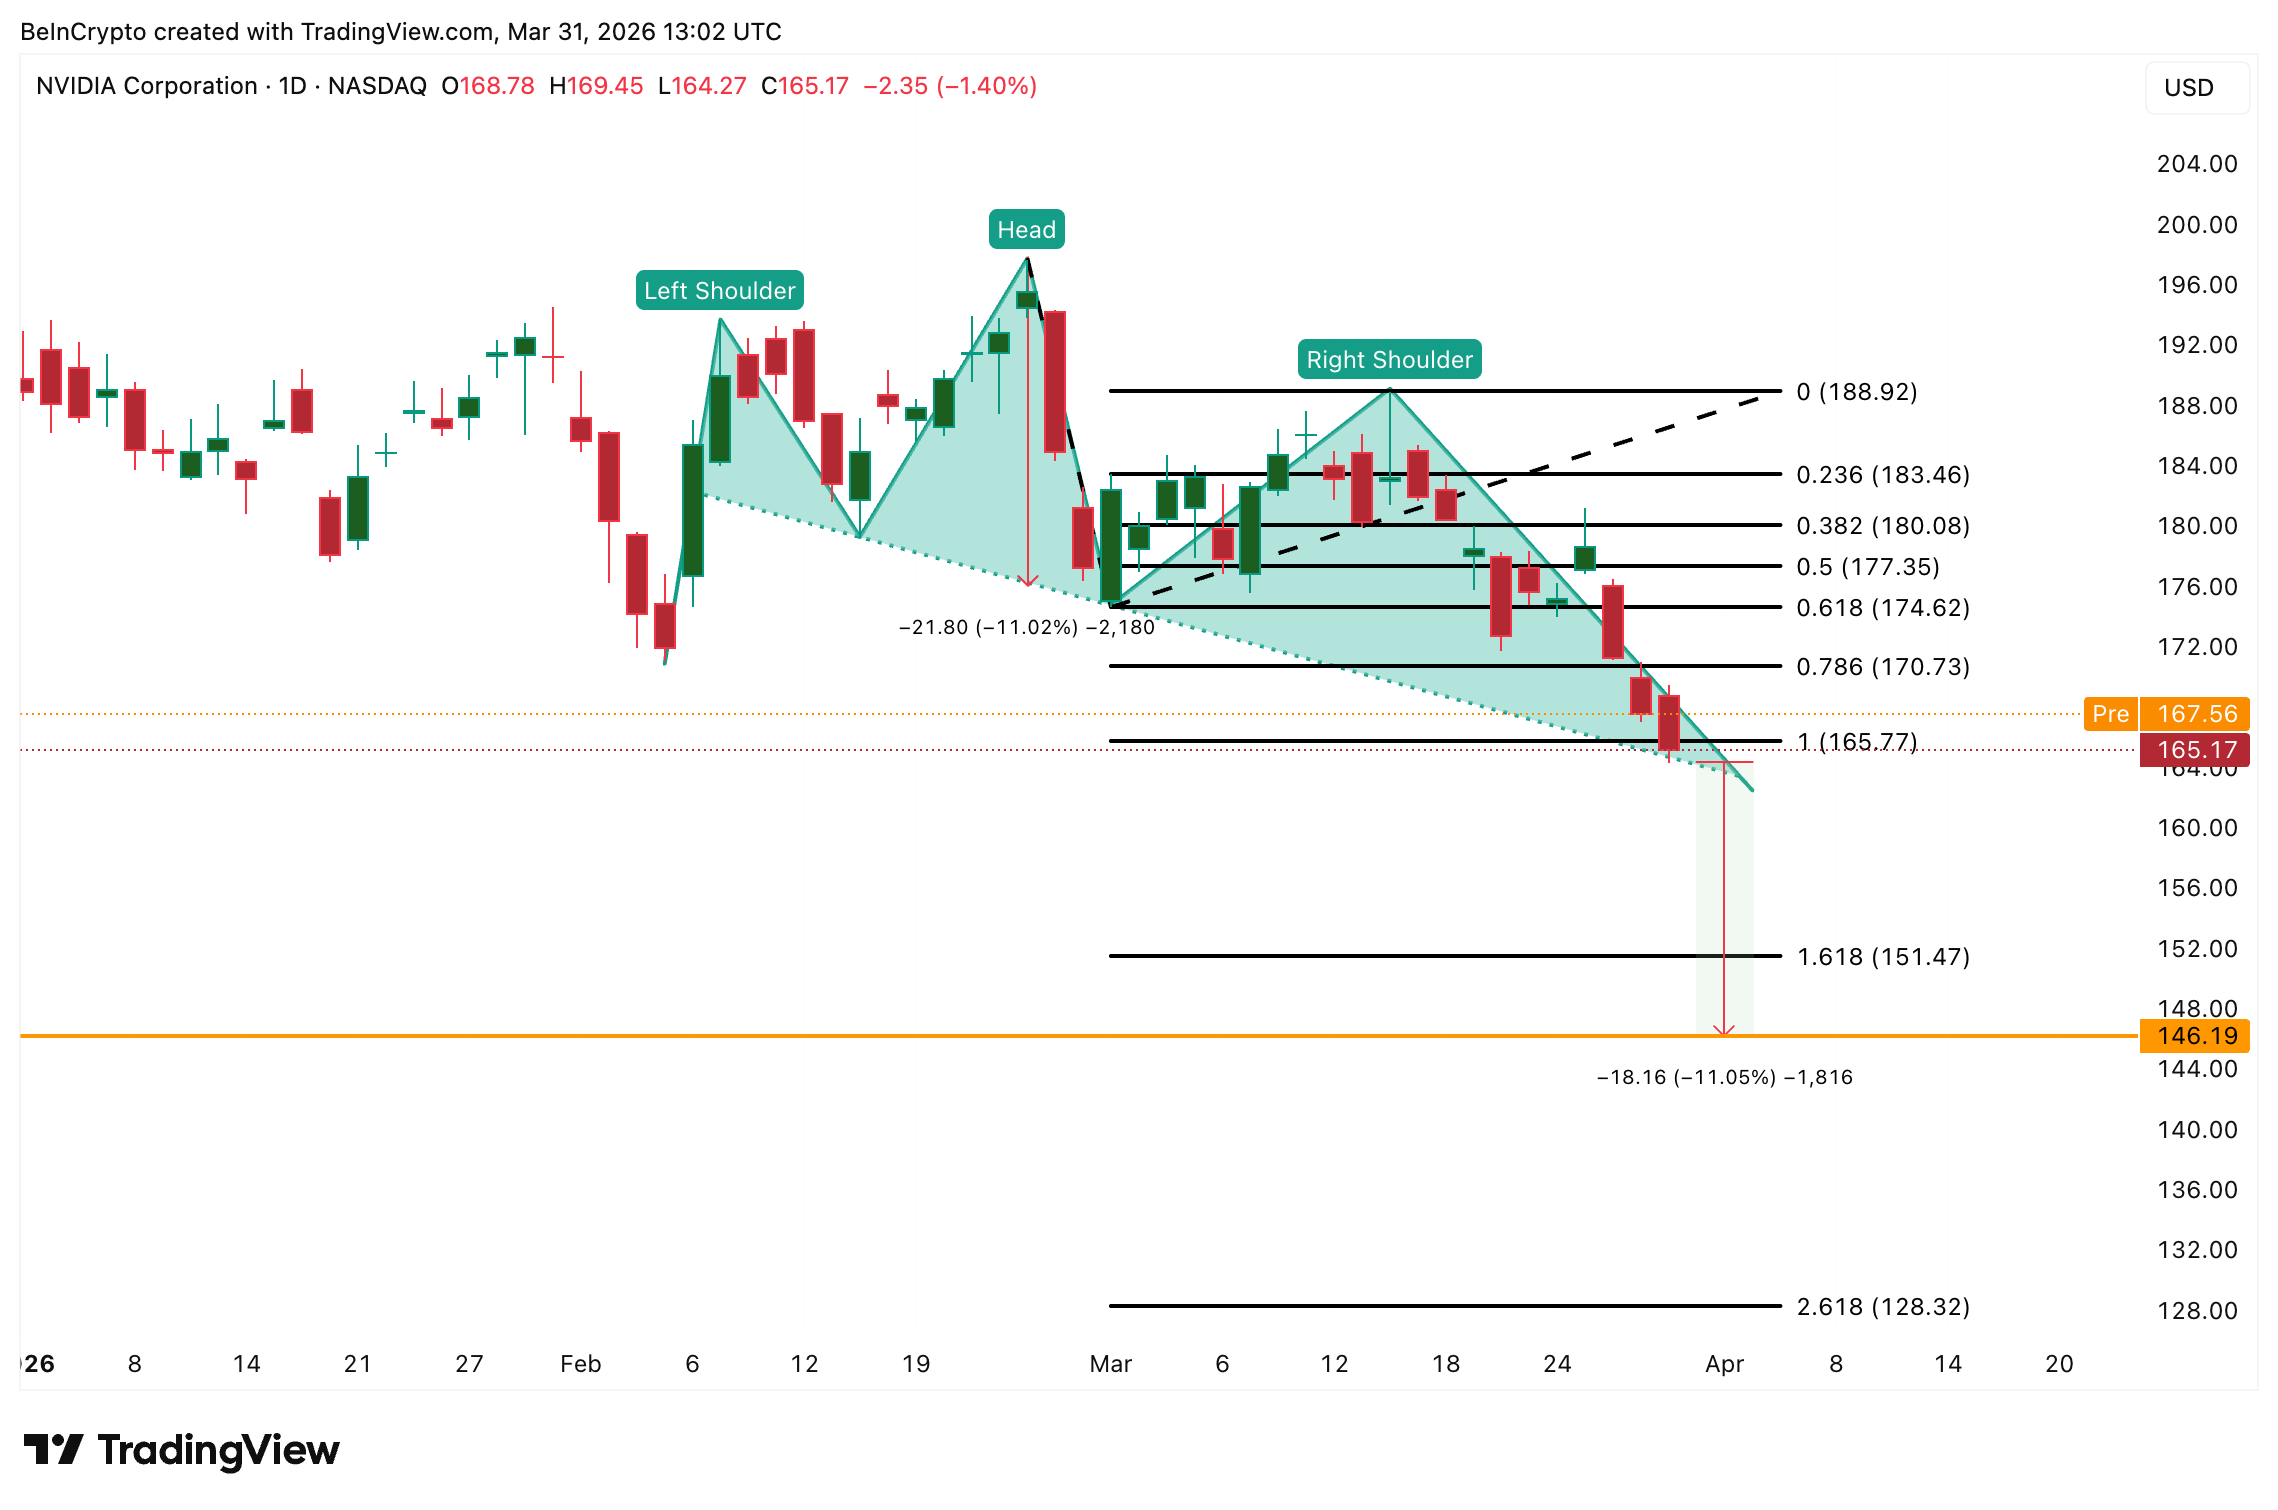
A daily close above $174 targets $183 and weakens the breakdown thesis. A failure to reclaim $165 in the subsequent trading sessions confirms the head-and-shoulders and exposes an 11% measured move toward $146.
The post AI Memory Rout Wipes 9% Off Nvidia Stock: Chart Says More Pain Ahead appeared first on BeInCrypto.


Bitcoin trades in a tight mid‑$60k range beneath stacked moving‑average resistance, with extreme fear and weak momentum keeping any breakout on a short leash.
Summary
- Bitcoin trades in a tight $66,037–$68,130 range, capped by layered moving average resistance.
- All major EMAs and SMAs sit above spot, with the 200‑day EMA near $85,095 reinforcing downside pressure.
- Momentum gauges remain neutral to weak, as sentiment hovers in “extreme fear” territory across crypto markets.
Bitcoin (BTC) hovered around $66,597 on March 31, 2026, as the largest cryptocurrency by market value remained trapped in a narrow range and “technically constrained” beneath a wall of moving averages. The coin traded between $66,037 and $68,130 over 24 hours, leaving its $1.33 trillion market capitalization and roughly $48.8 billion in daily volume more indicative of indecision than conviction.
That backdrop contrasts with recent sessions where, according to Bloomberg, Bitcoin briefly climbed as much as 2.6% intraday to about $68,335 before paring gains below $68,000 alongside broader risk assets.
On the daily chart, BTC has rolled over from a lower high in the mid‑$70,000s into the mid‑$60,000 band, a shift that Bitcoin.com’s technical desk characterizes as a transition from a prior bullish structure into a “neutral‑to‑bearish posture.” Key resistance is clustered between $68,000 and $69,000, then $71,000–$73,000, while support rests at $65,000–$66,000, with a clean break below $64,000 likely signaling a broader structural breakdown. A similar pattern has played out in recent weeks, with International Business Times noting that Bitcoin “traded around $68,500… showing signs of consolidation” after rejecting near $71,000 and slipping back toward the mid‑$60,000s.
Intraday, lower‑timeframe charts show compression rather than trend. Four‑hour price action has shifted from a downtrend into sideways consolidation after setting a higher low around $65,000, but repeated failures just below the $68,000–$69,000 band underscore persistent seller presence. On the one‑hour chart, lower highs remain intact and a modest bounce off the $66,000 region “has failed to generate follow‑through,” highlighting fragile microstructure and a slight bearish tilt.
Oscillators corroborate that drift. The relative strength index sits near 42, the commodity channel index prints around −104, and the moving average convergence divergence line is negative by roughly 947 points, collectively signaling subdued momentum and an absence of a strong trend rather than outright capitulation. That aligns with broader market analytics, where research firm Intellectia points out that Bitcoin’s recent swings have come with 30‑day volatility above 3%, indicating a “choppy” environment where thinner liquidity amplifies modest flows.
The clearest signal comes from moving averages: every major exponential and simple moving average currently sits above spot price. Short‑term gauges such as the 10‑day EMA around $67,832 and the 10‑day SMA near $68,138 are capping rebounds, while the 50‑day EMA (~$71,005), 100‑day EMA (~$76,713) and 200‑day EMA (~$85,095) mark a stacked band of overhead resistance consistent with a broader bearish structure. Earlier this year, a similar dynamic prompted a “death cross” warning as the 50‑day and 200‑day weighted moving averages flipped lower, a pattern flagged in a prior crypto.news story on Bitcoin ETF‑driven selling.
Sentiment mirrors the technical strain. The Crypto Fear & Greed Index has spent much of the quarter in “extreme fear,” with readings as low as 18, according to on‑chain flow analysis by AInvest and data provider Alternative.me cited by CryptoRank. In that context, the near‑term path for BTC appears binary: Bitcoin.com’s technical team argues that “a sustained break and hold above the $68,000 to $69,000 resistance cluster” on rising volume would be needed to flip the narrative toward recovery, while a rejection followed by a decisive move under $65,000–$64,800 would likely confirm continuation toward the low‑$60,000 support zone.
In a previous crypto.news story on how moving averages can both signal and accelerate downside when price trades below all key bands, analysts warned that reclaiming at least one major EMA is often the first confirmation that distribution has run its course. For now, Bitcoin remains stuck beneath that threshold, with the burden of proof firmly on the bulls.


Bitcoin rose alongside U.S. stocks after Iran’s President Masoud Pezeshkian reportedly said the country would be prepared to end the conflict if it receives security guarantees.
The crypto asset was trading at $67,762, up nearly 2% over the past 24 hours. The Nasdaq about doubled its gain on the news, now higher by 3.1%. WTI crude oil, meanwhile, tumbled from just shy of $105 per barrel to $102.
Pezeshkian’s unconfirmed remarks are raising the prospect of a diplomatic off-ramp, easing fears of a wider conflict that could disrupt oil flows, fuel inflation and continue to rattle global markets.

- Bitcoin price tested resistance around $68,000 amid gains for US stocks.
- The uptick came amid investor reaction to President Trump’s comments on the Iran war.
- Analysts say Trump’s posts this week could be weightier than macroeconomic data releases.
Bitcoin (BTC) hovered near highs of $68,000 on Monday as traders braced for potential market-moving signals this week.
The benchmark cryptocurrency rose as US stocks jumped amid news that President Trump is looking to end the Iran operation.
As the broader market enters what many see as a “wait-and-see mode,” analysts warn that beyond key macroeconomic data releases, US President Donald Trump’s commentary and events in Iran could be crucial to the next moves in BTC and the broader crypto market.
Bitcoin retests $68k amid Trump’s war comments
Bitcoin surged to the $68,000 resistance on Monday, March 30, 2026, mirroring a broad stock market rally sparked by President Donald Trump’s optimistic comments on winding down U.S. military operations in Iran.
The Dow Jones Industrial Average climbed by more than 300 points, while the S&P 500 and Nasdaq Composite advanced 0.5% and 0.2%, respectively.
Investors interpreted Trump’s Truth Social post as a de-escalation signal amid the ongoing conflict.
“The United States of America is in serious discussions with a new, and more reasonable regime to end our military operations in Iran,” Trump posted, adding that “great progress has been made.”
Trump, however, typical of his posts, tempered optimism.
He warned that if the US does not hit a deal with Tehran and absent an immediate reopening of the Strait of Hormuz, the US would end its “lovely ‘stay’ in Iran by blowing up and completely obliterating” the electricity grid, oil wells, and Kharg Island.
Bitcoin price outlook
BTC had gained amid the optimism, testing resistance around $68,080. However, prices hovered near $67,770 as the initial surge slowed.
Analysts at derivatives platform Greeks.live have highlighted that Bitcoin’s short-term implied volatility has dipped below 50%.
BTC has consolidated around current prices, with analysts saying the market has entered a “wait-and-see” phase.
More significantly, the analysts opine that what Trump says next on the Iran conflict could be a key volatility trigger.
“The market has entered a wait-and-see mode,” the analysts stated. “This Friday’s unemployment rate and nonfarm payroll data are particularly important, and while there is a significant amount of macroeconomic data this week, none of it carries as much weight as President Trump’s tweets.”
This emphasis stems from Trump’s outsized influence on sentiment, with the ongoing Iran war and threats to the Strait of Hormuz, a major factor.
Hormuz is a critical chokepoint for 20% of global oil supply, and escalations related to a blockade have recently spiked energy prices and stoked inflation fears.
With US forces bolstering their presence in the region, any of Trump’s posts on Truth Social could drive rapid repositioning.
From a technical perspective, BTC faces key resistance at $68,500, but a fresh break below $65,000 could allow bears to target $62,000.


- Bitcoin price tests $65,000 support amid oversold conditions and weak momentum.
- Rising US real yields and oil prices weigh on short-term buying pressure.
- Traders should watch the $68,400 resistance and $65,100 support for the next moves.
Bitcoin (BTC) is showing signs of short-term fatigue as it navigates a tricky market environment.
After failing to break above resistance near $68,400, BTC has retreated toward critical support between $65,600 and $65,100.
The cryptocurrency is now hovering in a delicate range, where technical oversold signals clash with potent macroeconomic pressures.
Technical analysis
The seven-day RSI currently sits at 32.37, suggesting that Bitcoin is nearly oversold.

This level often indicates a potential bounce, but the market has yet to show sustained buying strength. Short-term momentum is fragile, with price action struggling to maintain levels above $66,000.
Even though buyers have defended the $65,600 band so far, a break below $65,100 could signal a deeper correction.
Resistance remains firmly in place at $68,400, and attempts to push past it have been met with immediate selling. Traders should closely watch the $68,000–$68,500 zone, as it represents the ceiling for any short-term recovery attempts.
In this range-bound setup, the market is consolidating rather than trending decisively.
The macro headwinds shaping Bitcoin price movements
Bitcoin’s short-term struggles are compounded by external pressures.
Rising real yields, especially on 10-year TIPS in the United States, have increased the appeal of government bonds over risk assets like BTC.
As a result, investors seeking yield are diverting capital toward these safer instruments, leaving Bitcoin with weaker demand.
At the same time, WTI crude oil prices have surged past $103 per barrel and Brent crude oil prices have hit $114, adding another layer of market uncertainty.
Energy-driven inflationary concerns make the broader financial environment more cautious, further dampening appetite for speculative assets.
Adding to the pressure, a $2.2 billion payout by the FTX Recovery Trust to FTX creditors is scheduled for March 31, 2026.
Recipients may choose to liquidate portions of their holdings, which could add temporary selling pressure and keep BTC range-bound.
Even large buyers, often referred to as whales, are active but appear to be accumulating cautiously below $70,000.
This cautious accumulation suggests that institutional players are positioning for the long term but are unwilling to push aggressively at current levels.
What traders should expect this week?
Short-term momentum is still weak, so any bounce is likely to be contained unless macro conditions improve.
Overall, Bitcoin is at a crossroads, balancing oversold technical conditions against persistent bear pressures from rates, oil prices, and potential selling catalysts.
Traders should monitor the $65,100 level closely, as a decisive hold here would support consolidation between $65,100 and $68,000.
A break below this band could open the door to a further decline toward $63,000 or lower.
On the upside, sustained moves above $68,400–$68,500 would be required to challenge resistance near $70,000.

Trump’s push for an extra $200 billion Iran war budget on top of record defense spending is forcing crypto markets to reprice geopolitical risk, debt, and the dollar in real time. Trump’s reported push to have Arab states help bankroll…
Crypto World
Bitcoin enters the public bond market as Moody’s gives a first-of-its-kind crypto deal a rating


The New Hampshire Business Finance Authority is set to issue what appears to be the first rated bitcoin-backed bond of its kind, marking a step toward integrating crypto into traditional public finance.
The bonds received a provisional Ba2 rating from Moody’s Ratings, two notches below investment grade. They will be issued through the Business Finance Authority of the State of New Hampshire and are backed by bitcoin held as collateral, according to a press release.
“The Rated Bonds will be collateralized by a loan… backed by Bitcoin, a digital currency,” Moody’s said in its report.
The structure relies on bitcoin rather than cash flow from a business. Bondholders are repaid through the liquidation of BTC held in custody by BitGo, which will be sold if needed to meet interest and principal payments. The deal includes safeguards common in structured credit, including 1.6x overcollateralization and triggers that force liquidation if the loan-to-value ratio deteriorates.
Moody’s said its rating reflects “risks associated with the transaction’s collateral, structure and operation,” including bitcoin’s volatility. The agency used a 72% advance rate and short liquidation windows to model potential downside scenarios.
The bonds are limited recourse, meaning no public funds are at risk. “No public funds of the State of New Hampshire… may be used to pay amounts under the Rated Bonds,” Moody’s said.
That distinction matters. While the deal uses a state authority, it does not carry state credit backing. Instead, it resembles conduit or project finance, where the issuer serves as a pass-through.
Still, the structure places bitcoin into a part of the financial system where it has rarely appeared: rated debt issued through public channels.
The Ba2 rating places the bonds in speculative-grade territory, but also signals that credit agencies are developing frameworks to assess crypto-backed instruments.
The deal arrives as institutions continue to test ways to use bitcoin beyond trading or treasury holdings. The Labor Department on Monday proposed a rule following an executive order from President Donald Trump that directed regulators to expand access to digital assets in retirement portfolios, marking another step in that direction.
A whitepaper published yesterday by Google Quantum AI shows that a fast-clock quantum computer (with similar architecture to their existing Willow chip) could derive a private key from an exposed public key in approximately nine minutes. Bitcoin settles a block every 10 minutes.
That is, on average, a one-minute margin between the system working and an adversary hijacking live transactions directly from the mempool before they confirm. That multi-trillion dollar minute means that not just Satoshi’s coins, but the entire supply of Bitcoin now and forever is at risk.
For years, the industry’s position on quantum has been some version of “we’ll deal with it when it’s real.” Even for those who took this threat seriously, most believed that the first real threat to Bitcoin was at least a decade away, and would come in the form of “long-range” attacks on dormant assets. This paper, the latest in a string of accelerating breakthroughs make that position untenable.
This research presents a seismic shift that violently accelerates the timeline. The implications for the digital asset ecosystem are acute. If we do not coordinate an urgent upgrade effort immediately, digital assets as we know them may not be viable.
The pace of change is accelerating
Historically, estimates suggested we would need tens of millions of physical qubits running a trillion error-corrected operations to threaten Bitcoin. But critically, those estimates were based not on the elliptic-curve cryptography Bitcoin uses, but on an older algorithm known as RSA-2048.
Google’s whitepaper shatters those prior resource estimates with an architecture for breaking the 256-bit Elliptic Curve Discrete Logarithm Problem (ECDLP) used in Bitcoin specifically.
This paper brings the physical requirement down to fewer than half a million qubits and reduces the number of operations by multiple orders of magnitude. It achieves this using just 1,200 logical qubits at an error rate of 0.1%, a threshold that appears achievable in the near-term. Google has reportedly moved up its own quantum timelines to 2029.
More importantly, the architecture it used (superconducting) featured fast physical clock speeds. That means it isn’t just “lost” or dormant coins that are at risk; every single active Bitcoin transaction could be vulnerable to a quantum attacker snatching it directly from the mempool.
But the Google paper is not an isolated event. It is one of two converging breakthroughs.
Researchers from Oratomic announced a parallel breakthrough using neutral-atom hardware. Leveraging high-rate quantum low-density parity check (qLDPC) codes, they demonstrated that Shor’s algorithm can be executed at cryptographically relevant scales using approximately 10,000 to 22,000 reconfigurable atomic qubits. What once required millions of qubits has been compressed by orders of magnitude in just a few short years on two separate technological tracks, simultaneously.

Multiple tech trees with one target
How is it possible that quantum made little progress for so long, but we are now witnessing the timeline collapse so quickly? Simply put, small iterative improvements in physical fidelity, error correction, control architectures, and algorithm design are creating a feedback loop that compounds progress.
Faster machines enable better error-correction research, lowering the resource bar for the next generation of machines and accelerating timelines at non-linear speeds.
Perhaps the most dangerous misconception is that quantum progress relies on a single “miracle” breakthrough in one specific type of physics. The quantum threat is not a single moonshot that might stall. Superconducting, photonic, neutral-atom and ion-trap architectures represent entirely different engineering roadmaps, physics and funding pipelines. Only one needs to succeed for quantum computing to become cryptographically relevant.
It’s true that none of these systems has been fully proven at scale yet. But they are increasingly being proven, with serious names and serious capital behind them. Are we really willing to roll the dice with trillions of dollars on the line?
The clock is ticking on migration
The instinct to defer until a cryptographically relevant quantum computer is publicly confirmed fundamentally misunderstands how decentralized networks upgrade. Migrating a decentralized network like Bitcoin is not like flipping a switch on an enterprise server. Trillions of dollars of assets are at risk, and all networks need to perform an unprecedented upgrade to introduce new cryptography at the most foundational level.
Unfortunately, solving one problem creates new challenges. Post-Quantum Cryptography (PQC) requires significantly larger digital signatures, thereby increasing bandwidth, storage and compute requirements. Implementing this requires a hard fork, and reaching the necessary community consensus will be an arduous, politically fraught process.
Even after a consensus is reached, the sheer logistics of moving the assets are staggering. At bitcoin’s current transaction rate, migrating the network to post-quantum addresses would take several months – assuming the network processed nothing else and every block was full.
If we wait until Q-Day (when a quantum computer relevant to cryptography is publicly confirmed) to begin this process, it will be too late. Digital signatures will have already lost their authority, and any attempt to fix the problem retroactively will spark intense financial volatility. In a worst-case scenario, there may be competing forks, shattered institutional trust and a crisis of provenance for trillions of dollars in assets.
Urgency, not panic
This is not a call for panic. It is a call for realism. Executives and institutions that now hold a massive portion of the circulating bitcoin supply, stablecoin issuers and major protocol teams need to acknowledge that the risk profile has fundamentally changed. The quantum threat is no longer a theoretical exercise for academics; it is an engineering reality moving at breakneck speed.
We must act now. The world needs proactive migration strategies, tools to register post-quantum ownership, and an industry-wide mandate to upgrade before the first silent theft occurs. The quantum adversary is coming, and they will not declare themselves. But we can prepare. We must coordinate this upgrade today to ensure the foundation of digital trust survives into the quantum era.
On Monday, two research pieces about quantum cryptography dramatically slashed the hardware requirements for cracking private keys to vast sums of digital assets, including over a million bitcoin (BTC) owned by Satoshi Nakamoto. By some estimates, the deadline to fork Bitcoin to post-quantum cryptography has accelerated by two orders of magnitude.
In other words, both research teams described multiplicative, not additive, advancements to quantum computing. Although the two teams approached different layers of the quantum stack, their improvements compound.
To summarize in brief, the number of physical qubits required to crack the elliptic curve signatures protecting the private keys of exposed BTC public keys has collapsed from roughly 9 million to as few as 10,000.
Google Quantum AI’s whitepaper, co-authored with Stanford researcher Dan Boneh and Ethereum Foundation’s Justin Drake, showed that fewer than 1,200 logical qubits and 90 million Toffoli gates using Shor’s algorithm might be able to solve the Bitcoin protocol’s 256-bit Elliptic Curve Discrete Logarithm Problem (ECDLP). On a superconducting quantum computer, that translates to fewer than 500,000 physical qubits, executing in minutes. Google called the result a 20-fold reduction over prior estimates.
Hours later, Oratomic, founded by Caltech and Harvard faculty, released its own breakthrough. Using new error-correcting tactics on ‘neutral atom’ quantum hardware, this team showed Shor’s algorithm running at private key-breaking speed with as few as 10,000 physical qubits. A faster variant using 26,000 qubits could crack a BTC private key using only its public key within roughly 10 days.
Read more: BIP proposes destroying bitcoins to save the ecosystem from quantum attack
The multiplicative insight
Even though both research papers describe theoretical key-cracking abilities in the future, the superconducting breakthrough multiplies the effects of the neutral-atom breakthrough. As a result, timeline estimates for when such hardware will actually exist have advanced by several years.
Whereas many Bitcoin security experts estimated the risks of an attack on Satoshi’s BTC well into the 2030s or 2040s, these new techniques could bring that threat into the next five years.
Generally speaking, the total physical qubit count for a quantum attack equals the logical qubits the algorithm requires, multiplied by the physical qubits needed per logical qubit for error correction. Error correction is a critical step in quantum computing, as outputs are often unpredictable at such tiny states of matter.
Anyway, Google’s research paper certainly seems to have laid out a timeline to compress the first number, logical qubits. Its circuit optimizations cut logical qubits for Bitcoin’s ECDLP-256 from roughly 2,330 (a 2017 baseline) to under 1,200.
Oratomic compressed the second factor, error correction. Standard surface codes demand roughly 400 physical qubits per logical qubit. Oratomic’s lifted-product codes achieved encoding rates near 30%, yielding a ratio closer to 10:1, some 160 times more efficient than surface codes at equal error performance.
The prior state of the art, a 2023 paper by Daniel Litinski, estimated roughly 9 million physical qubits.
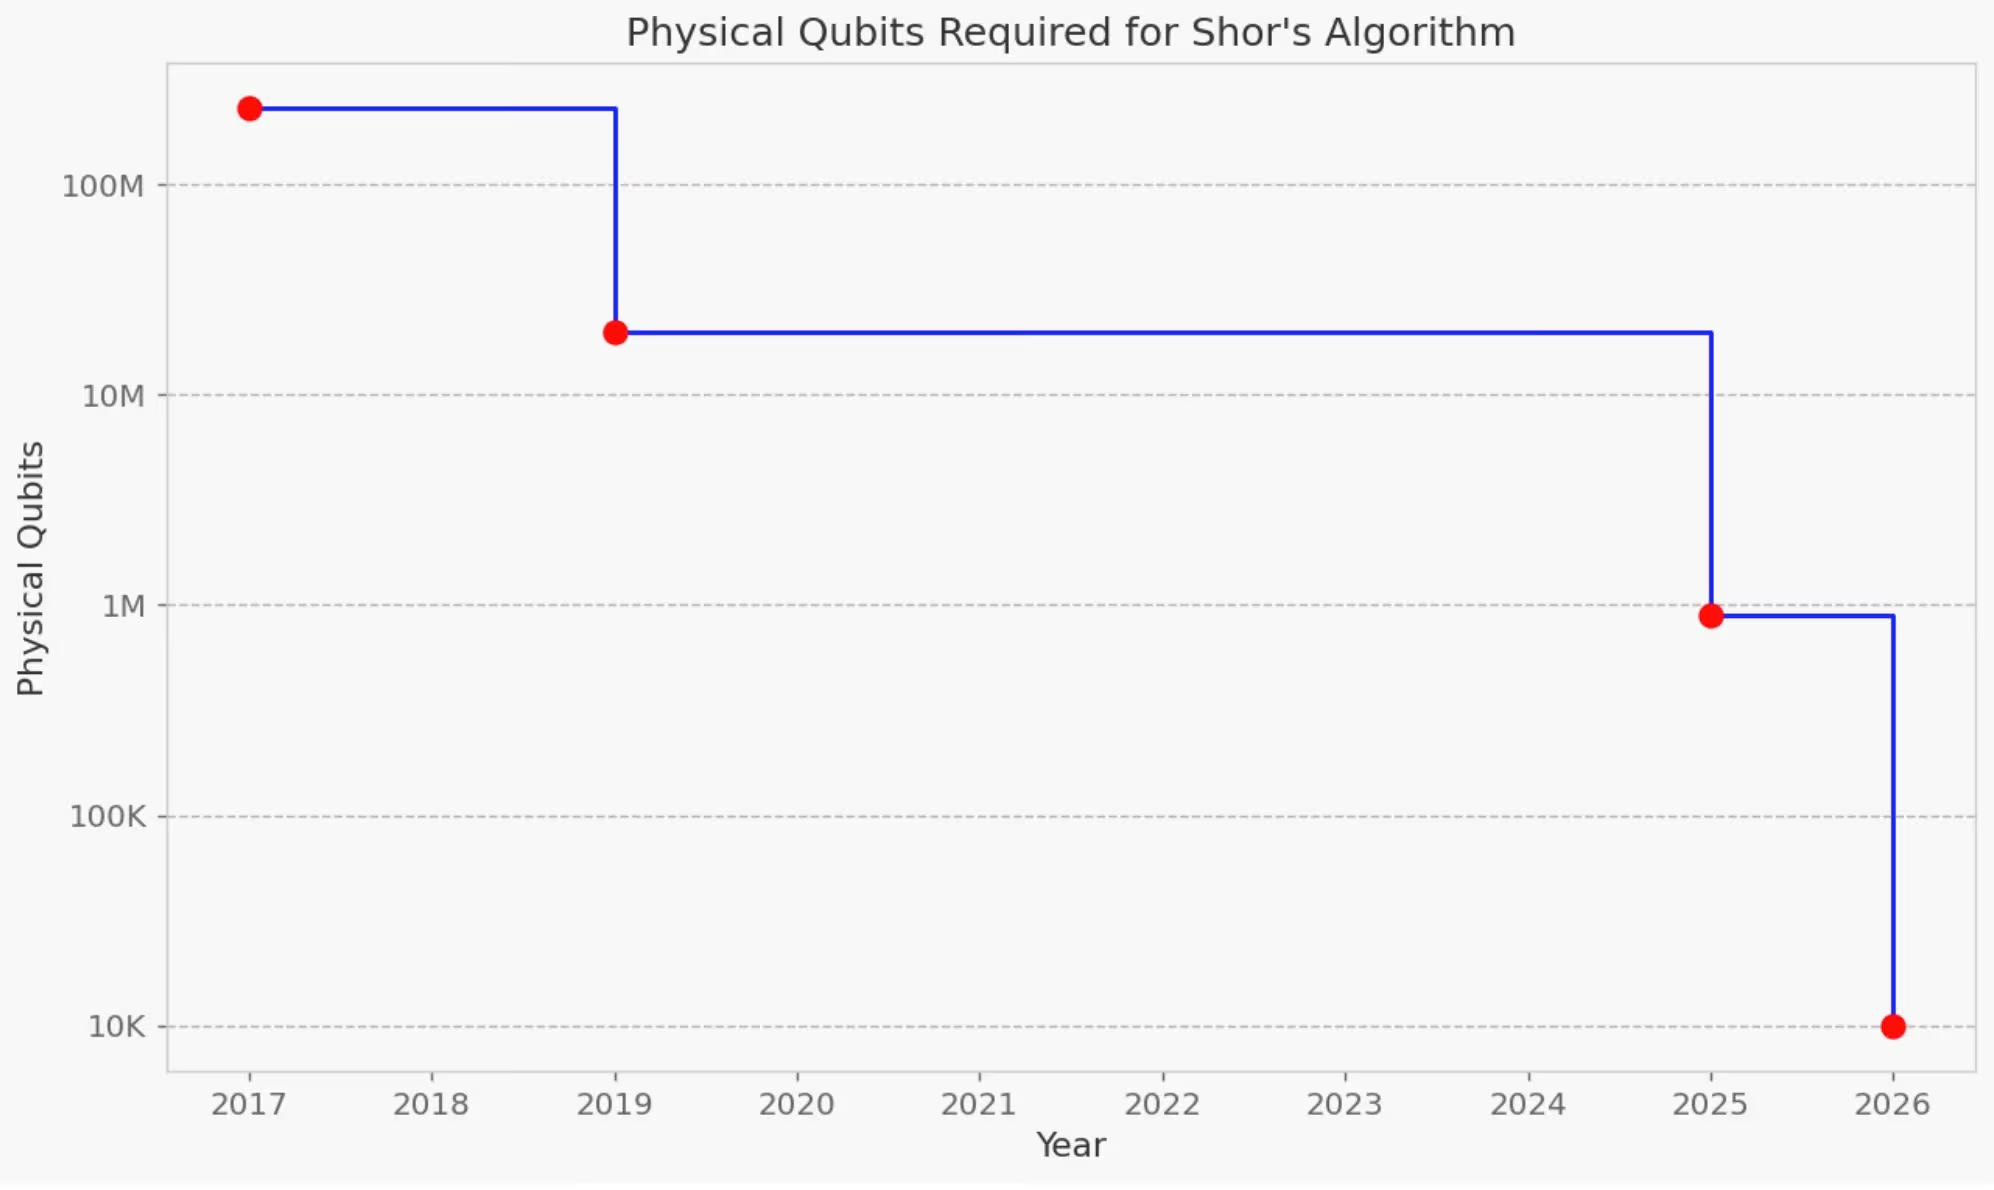
A crypto research outfit summarized the trajectory of breakthroughs in reducing the number of quantum operations to break ECC-256 by roughly five orders of magnitude since 2012.
- 1 billion physical qubits in 2012
- 20 million in 2019
- Under 1 million in 2025
- Under 25,000 in 2026
Bitcoin’s developers are still working on quantum
Pro-Ethereum researcher Drake wrote that his confidence in a cryptographic break before the year 2032 has increased significantly. He estimated at least a 10% chance a quantum computer recovers a secp256k1 ECDSA private key from an exposed BTC public key by that date.
Millions of BTC worth hundreds of billions of dollars sit in quantum-vulnerable addresses. Estimates of quantum-vulnerable BTC include 1.7 million in ancient pay-to-public-key outputs, including Satoshi-era mining rewards.
Bitcoin Improvement Proposal (BIP) 360, a formal proposal for post-quantum Bitcoin signatures, has struggled to gain traction among Bitcoin’s most influential developers.
Other work on a hard fork of Bitcoin node software also continues.
Aggressive timelines and assumptions
Of course, the papers carry legitimate caveats. Google refused to publish its actual quantum circuits, instead validating them through a zero-knowledge proof. Drake acknowledged that the Oratomic result, relying on exotic qLDPC codes not yet demonstrated at scale, deserves some skepticism.
All nine Oratomic authors are shareholders in the company that could benefit from a fundraise on the tails of the media coverage.
Moreover, the two papers use different hardware platforms. Google assumes superconducting qubits, while Oratomic uses neutral atoms on distinct hardware. Combining their headline numbers into one physical product oversimplifies the difficulties of chemical engineering.
None of this changes the trend in quantum threats to Bitcoin, which are accelerating by the month. Google’s own 2029 migration timeline for internal cryptographic authentication suggests the company takes its own research seriously.
The US National Security Agency (NSA) wants national security systems on quantum-safe algorithms by 2030. The National Institute of Standards and Technology (NIST) similarly wants all US agencies off quantum-vulnerable cryptography by 2035.
Got a tip? Send us an email securely via Protos Leaks. For more informed news, follow us on X, Bluesky, and Google News, or subscribe to our YouTube channel.

WisdomTree does not see pending U.S. crypto legislation as a prerequisite for innovation, even as policymakers debate new rules for digital assets.
“I don’t [think] it would inhibit anything that we’re trying to do,” said Will Peck, the firm’s head of digital assets, referring to the proposed Clarity Act. “We don’t view it as a gatekeeper.”
The Clarity Act, which is pending approval from Congress, aims to establish clearer jurisdiction between the Securities and Exchange Commission (SEC) and the Commodity Futures Trading Commission (CFTC), while setting rules for how digital assets are classified and regulated. Supporters say it could reduce uncertainty that has slowed institutional adoption.
Peck’s believes much of the framework already exists. “The SEC has all the tools… to foster good tokenized security markets, good tokenized fund markets,” he said.
That perspective reflects WisdomTree’s approach. The asset manager has been building in crypto and tokenization for years, earlier than many traditional peers. It offers a spot bitcoin exchange-traded fund (ETF) in the U.S. and a broader suite of crypto exchange-traded products in Europe, where competition has been less intense and innovation started earlier.
More recently, the firm has focused on tokenized real-world assets. WisdomTree operates one of the larger tokenized money market funds, a product category that has grown as investors look for yield on-chain. Peck said the fund has already found “good product market fit.”
The company also secured a form of SEC relief that allows the fund to trade continuously. “This holy grail of… instant settlement is actually happening now with this product,” Peck said.
In practice, that means institutional investors can move between U.S. dollars, stablecoins like USDC and the fund itself at any time, rather than waiting for end-of-day processing. The model points to how traditional financial products could evolve on blockchain rails.
WisdomTree’s broader goal is to bring more regulated investment products on-chain. Peck said the firm wants to expand beyond money market funds into other tokenized instruments, including exchange-traded funds and yield-generating products. Over time, that could allow investors to access familiar assets directly from digital wallets, without relying on traditional brokerage accounts.
The firm is also betting that demand will persist regardless of market cycles. “It has not affected us at all,” Peck said of recent crypto price volatility, describing activity as “all systems go.”
While Peck said the Clarity Act would be “constructive for the industry,” he suggested it is not the main driver of progress. Instead, firms like WisdomTree are moving ahead using existing regulatory pathways.
Bitcoin’s first-quarter slump capped an unusual run: nearly six months of underperformance against U.S. equities, a stretch that has no precedent.
“That’s never happened,” said Mark Connors, founder of Risk Dimensions, pointing to data showing bitcoin lagging stocks consistently since early October. The trend has raised fresh questions about whether the asset is behaving more like a risk trade than a hedge.
Bitcoin fell roughly 22% in the first quarter of 2026, following a 25% decline during the final three months of 2025. Over a similar period, the S&P 500 declined far less, leaving a wide performance gap. Connors said the duration of that gap, not just the size, stands out. Previous pullbacks have been sharper but shorter.
The weakness came amid broader market struggles. U.S. equities logged their worst quarter in four years, with the Nasdaq down more than 10% from recent highs. The combined decline across stocks and crypto erased much of the rally that followed the 2024 election.
Policy progress has been uneven. A new SEC chair has helped clear a path for more crypto ETFs, and lawmakers have advanced measures such as the GENIUS Act. Trump also signed an executive order in August that would make it easier for 401(k) plans to include alternative assets such as cryptocurrencies, private equity and real estate, which the Labor Department proposed a rule in response to on Monday.
March Shows Signs of Stability
Despite the weak quarter, bitcoin held up better in March than many expected.
The early March escalation between the U.S. and Iran sent shockwaves through global markets, driving oil prices and the U.S. dollar higher as investors reacted to supply risks and rising costs.
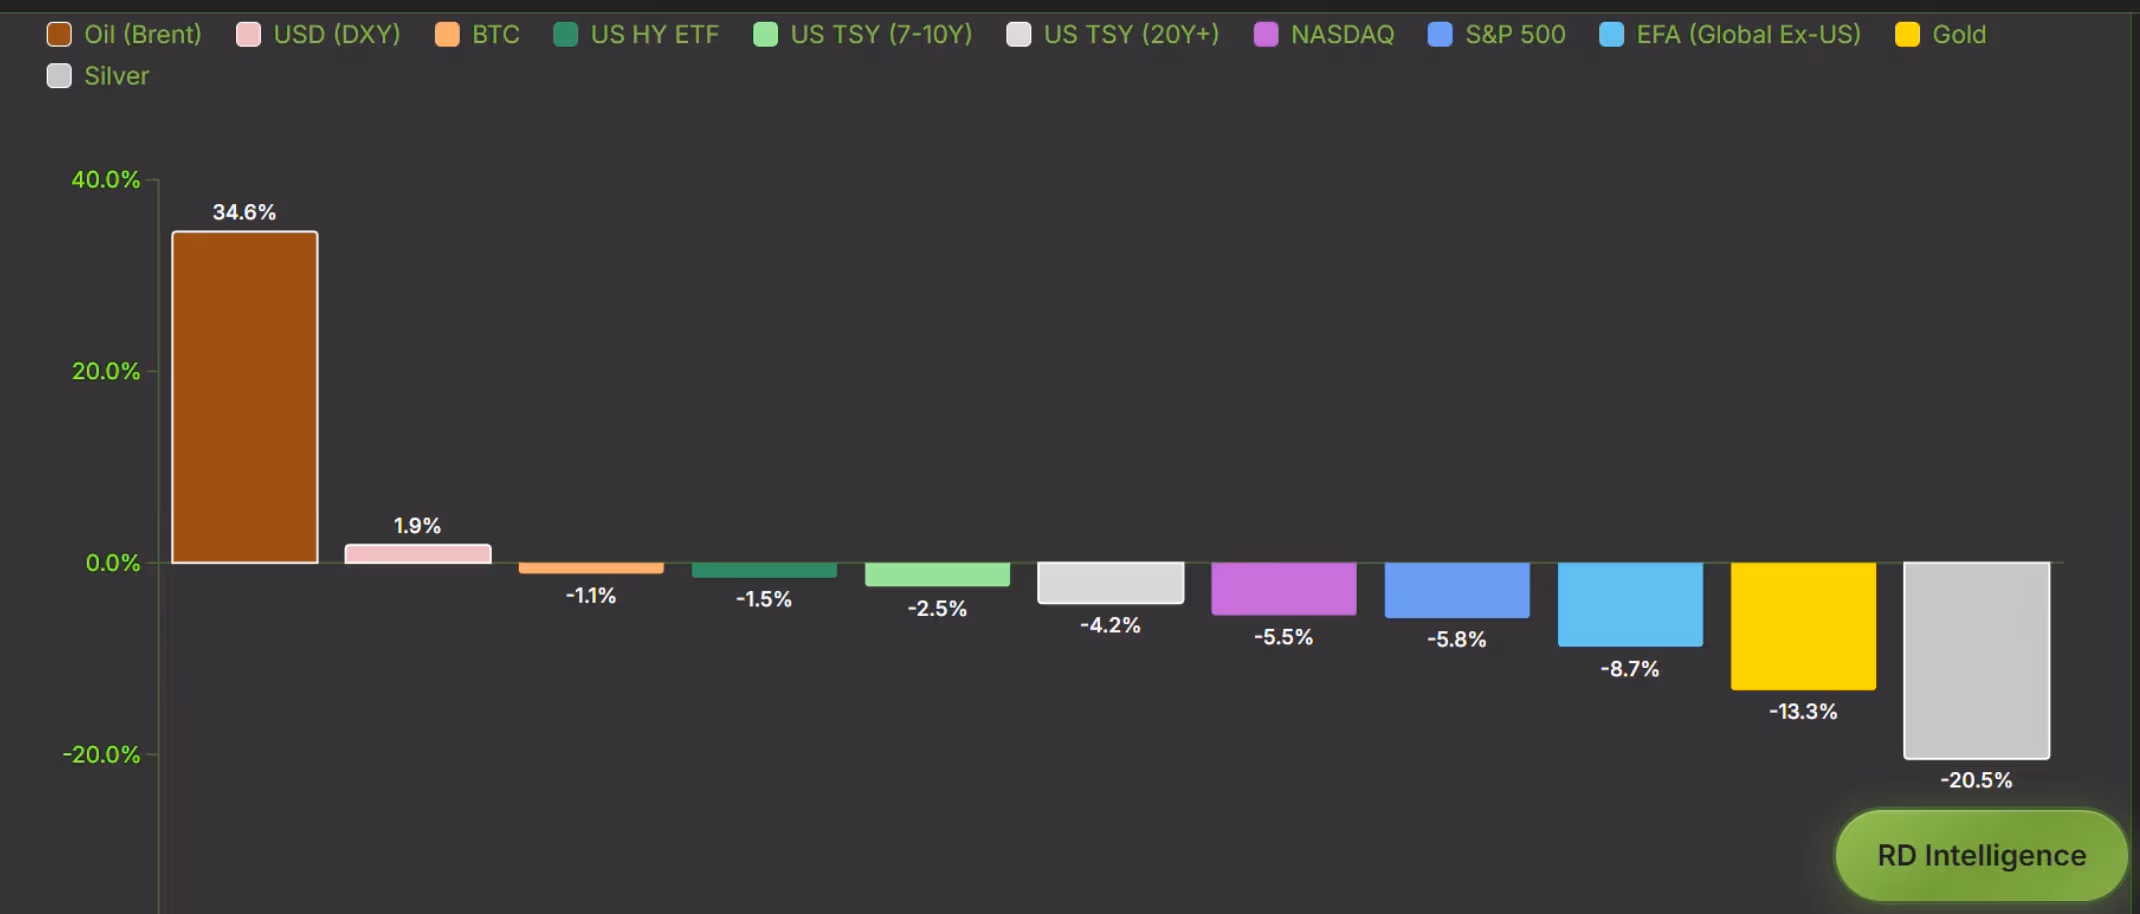
The volatility triggered sharp moves across asset classes. Gold, often treated as a safe haven, saw extreme swings as margin calls and urgent liquidity needs forced selling by both institutional investors and sovereign entities. The scale of the move ranked among the most severe short-term dislocations in decades.
Bitcoin, however, did not experience the same level of forced unwinding. The crypto rose about 1% in March, while gold fell 11% over the same period. “It really hung in there,” Connors said.

He attributes that stability in part to earlier liquidations that cleared out leveraged positions. Bitcoin’s ability to move quickly across borders may also limit forced selling compared with physical assets.
Outlook: A “Coiled Spring”?
Looking ahead, Connors pointed to bitcoin’s extended stretch of underperformance relative to equities as a factor that could shape what comes next. Rolling 63-day data shows the asset has lagged the S&P 500 since October — the longest such period on record — an imbalance that has historically preceded reversals.
If that pattern holds, bitcoin could be entering a phase where relative weakness gives way to renewed demand, particularly as macro pressures tied to debt and currency expansion continue to build in the background.
The timing, however, may depend less on market structure and more on geopolitics. The trajectory of the Iran conflict and its impact on energy markets, liquidity and global risk appetite could determine how quickly sentiment shifts.
“It’s either two months or two years,” Connors said.
Mercedes-Benz to pour $4B into Alabama plant as Trump tariffs reshape US auto strategy
Bitcoin stalls below key resistance as technical signals skew bearish

Jessi Pierce’s Husband Attends Emotional Public Visitation


-
 NewsBeat7 days ago
Manchester United reach agreement with Casemiro over contract clause amid transfer speculation
-

 News Videos6 days ago
Parliament publishes latest register of MPs’ financial interests
-
 Tech5 days ago
Intercom’s new post-trained Fin Apex 1.0 beats GPT-5.4 and Claude Sonnet 4.6 at customer service resolutions
-

 NewsBeat4 days ago
The Story hosts event on Durham’s historic registers
-

 Sports4 days ago
Sweet Sixteen Game Thread: Tide vs Michigan
-

 Business5 days ago
Instagram, YouTube Found Responsible for Teen’s Mental Health Struggle in Historic Ruling
-
 NewsBeat6 days ago
Tesco is selling new Cadbury Dairy Milk bar and people can’t wait to try it
-
 Entertainment3 days ago
Lana Del Rey Celebrates Her Husband’s 51st Birthday In New Post
-
Entertainment1 day ago
Fans slam 'heartbreaking' Barbie Dream Fest convention debacle with 'cardboard cutout' experience
-
Crypto World13 hours ago
Dems press CFTC, ethics board on prediction-market insider trades
-

 Sports9 hours ago
Tallest college basketball player ever, standing at 7-foot-9, entering transfer portal
-

 Sports7 days ago
Fantasy Baseball Week 1 Preview: Top sleeper hitters for both five- and 12-day period led by Munetaka Murakami
-

 Tech7 days ago
US FCC Prohibits Approval Of New Foreign-Made Consumer Routers
-
Sports7 days ago
One Team in Particular Is Monitoring Kirk Cousins
-
 Fashion6 days ago
How to Style Spring Like WeWoreWhat: Easy Outfit Ideas for 2026
-

 Entertainment6 days ago
HBO’s Harry Potter Series Will Definitely Fail For One Big Reason, And It’s Not J.K. Rowling Or Snape
-
 NewsBeat7 days ago
DWP to close two benefits for all new and existing claimants before April
-

 Sports7 days ago
Football: France arrive in Boston to face Brazil and Colombia in friendlies – Sports
-

 Fashion5 days ago
En Vogue in Brown Leather and Tailored Neutrals by Atelier Savoir, Styled by J Bolin
-
 Crypto World7 days ago
Why Mastercard Is Buying Stablecoin Infrastructure Instead of a Token
You must be logged in to post a comment Login