
Crypto World
AI Spending is Slowing Down. How Will the S&P 500 React?

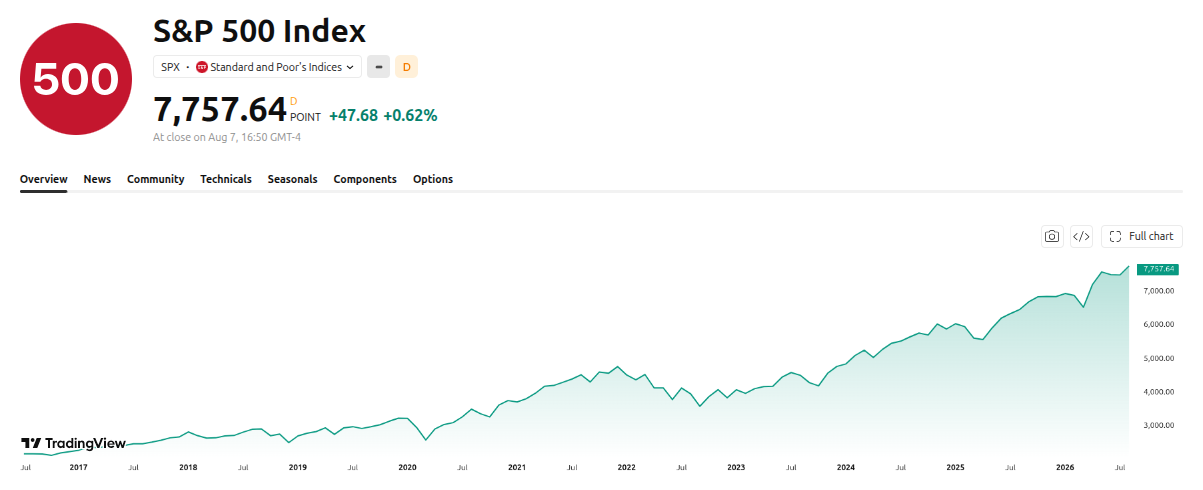
Wall Street keeps setting records, yet a growing chorus of institutional voices now names artificial intelligence (AI) itself as the biggest threat facing global markets.
The S&P 500 sits at the center of that argument, and its concentration explains why.

Why Fund Managers Now Fear AI Most
A tail risk is a low-probability event with severe consequences, the kind fund managers watch even when markets look calm. AI just claimed the top spot on that list.
Bank of America’s July Global Fund Manager Survey found 45% of respondents naming an AI bubble as the biggest tail risk, up from 28% the previous month.
Follow us on X to get the latest news as it happens.

That figure displaced second-wave inflation from its first-place position. The same survey identified long positions in global semiconductors as the world’s most crowded trade.
Respondents also flagged a specific trigger. Hyperscaler spending on AI infrastructure is ranked as the most likely source of a credit event.
Analyst Mac10 sharpened the warning on August 8. He argued that forward earnings growth is accelerating at a record pace only because companies are pouring unprecedented cash into artificial intelligence.
His concern centers on accounting mechanics. That spending often appears as a one-time boost on profit statements rather than sustainable operating performance.
Institutional bodies echo those doubts. The Bank for International Settlements warned earlier this year that Big Tech’s spending spree risks becoming a prolonged investment bust. The numbers behind that alert are substantial. The five largest hyperscalers are expected to deploy more than $1 trillion across 2025 and 2026.
Household exposure raises the stakes further. Ordinary investors now hold more stocks relative to their wealth than in past cycles, so any sharp drop would hit harder than the dot-com crash.
What the S&P 500 Actually Reveals
The structural problem explains why the index matters. J.P. Morgan Global Research estimates that the top 20 stocks now account for roughly 50.8% of total market capitalization.
That concentration has no modern precedent. Half a century has passed since the index depended so heavily on so few companies. The practical implication is uncomfortable. Buying the market increasingly means buying the AI trade, regardless of how the remaining 480 companies perform.

Capital commitments keep expanding regardless. Goldman Sachs estimates annualized AI-related spending could exceed $800 billion by the end of 2026.
Morgan Stanley projects even larger flows. Its research points toward nearly $3 trillion of AI infrastructure investment by 2028, with over 80% still ahead.
Summer has already delivered a stress test. The Nasdaq fell almost 10% from its June peak by late July before staging a near-9% rebound in early August to a new all-time high, according to TradingView data.
Momentum names showed particular fragility. Sandisk and Western Digital, up roughly 396% and 145% year-to-date, both displayed sell-the-news vulnerability during earnings season.

The bull case rests on delivered results, however. Goldman Sachs found 64% of reporting S&P 500 companies beat consensus earnings by at least a standard deviation.
BlackRock rejects the bubble framing outright. Today’s leaders generate real profits, maintain strong balance sheets, and largely fund investments from their own cash flow.
Extraordinary earnings are buying time for the AI trade. Whether returns eventually justify trillions in capital expenditure remains the question holding up the entire index.
The Situational Awareness Collapse: A Warning Shot for the AI Trade
If markets needed a case study of AI concentration risk, July delivered one. Situational Awareness, the hedge fund founded by former OpenAI researcher Leopold Aschenbrenner, grew to as much as $45 billion before steep losses on AI infrastructure stocks like SK Hynix forced it to sell its entire public portfolio to Ken Griffin’s Citadel.
The timing was brutal: on July 24, Aschenbrenner had sent investors a letter reporting a 439% net return for the first half of 2026 — even suggesting it was a good time to add funds.
Six days later, Citadel absorbed a stake once estimated at $16 billion in one of the largest rushed equity transactions in Wall Street history. A cascade of margin calls shrank the fund’s assets from $45 billion to roughly $10 billion in a matter of weeks.
Yet the story did not end there. Just days after the near-collapse, Aschenbrenner returned to the market with a $400 million investment in a privately held company — bringing his combined commitment to that unnamed target to $500 million, alongside the fund’s retained private stakes.
The episode does not prove the AI trade is over, but it exposes how concentration, leverage, and thin liquidity can destroy a portfolio before a long-term thesis has time to play out — the same fragility now embedded, at index scale, in the S&P 500 itself.
Subscribe to our YouTube channel to watch leaders and journalists provide expert insights.
The post AI Spending is Slowing Down. How Will the S&P 500 React? appeared first on BeInCrypto.

Top Wall Street analysts at Bank of America, JPMorgan and Oppenheimer have identified three AI stocks they believe remain well-positioned for further gains following strong quarterly earnings.
Their bullish outlooks reflect expectations that AI investment will remain strong despite ongoing concerns about valuations and the sustainability of spending.
3 AI Stocks TipRanks’ Top Analysts Are Most Bullish On in August 2026
The picks, Palantir Technologies, Amazon and Lam Research, span different parts of the AI ecosystem, from enterprise software to cloud computing and semiconductor manufacturing.
Palantir’s Commercial AI Business Continues to Accelerate
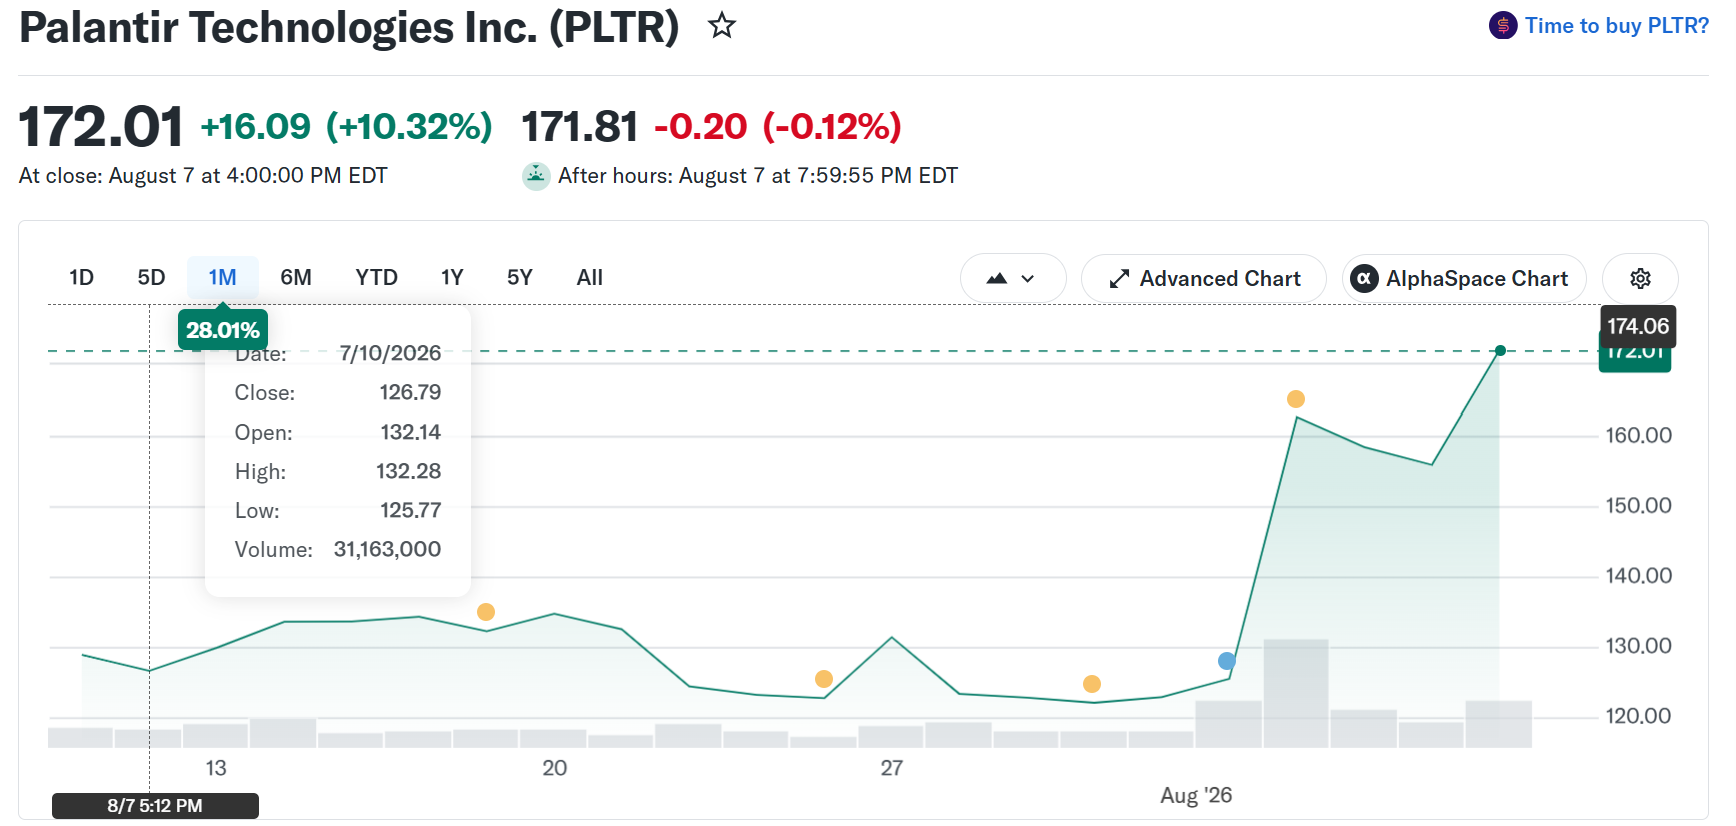
Bank of America analyst Mariana Perez Mora reiterated a Buy rating on Palantir with a $255 price target after the company’s second-quarter results exceeded expectations.
US commercial revenue surged 149% year over year, increasing its share of total revenue to nearly 40%, up from roughly 30% a year ago. The company also expanded its US commercial customer base 35% to 653, while trailing 12-month revenue per customer climbed 76% to $3.5 million.
Following the results, Palantir raised full-year guidance and now expects at least 134% US commercial revenue growth. Mora also increased her 2026–2028 revenue and earnings forecasts, citing stronger contract value and deeper customer relationships.
She views Palantir’s commercial business as the company’s primary growth engine, driven by customers seeking measurable returns from AI deployments. Shares closed near $172 on August 7.

Mora’s $255 target therefore implies a 48% climb above current levels.
Amazon’s AI Momentum Boosts AWS Outlook
JPMorgan analyst Doug Anmuth raised Amazon’s price target to $365 from $330 while maintaining a Buy rating and naming the stock a Best Idea.
Amazon Web Services delivered 37% revenue growth during the second quarter, its fastest expansion in 18 quarters. Meanwhile, while companywide forex-neutral revenue increased 20%, the strongest pace in five years.
AWS backlog climbed to $496 billion, up nearly 2.5x year over year and 36% sequentially. Anmuth attributed the momentum to growing AI workloads, continued demand for core cloud services and Amazon’s custom AI chips.
He modestly lifted his 2026 and 2027 forecasts, arguing that Amazon’s AI investments continue to generate attractive returns.

A move to $365 would imply a 33% move above $274, where shares closed on Friday.
Lam Research Could Benefit From the Next AI Chip Expansion
Oppenheimer analyst Edward Yang maintained a Buy rating on Lam Research with a $400 price target after the semiconductor equipment maker beat fiscal fourth-quarter expectations.
Yang highlighted stronger customer support revenue and a doubling of NAND revenue while noting management raised its 2026 wafer fabrication equipment spending outlook to the low-$150 billion range.
He also expects 2027 to be an unusually strong year as chipmakers work through supply constraints while building eight to ten new fabrication plants. Based on that outlook, Yang increased his 2027 and 2028 revenue and earnings estimates by 7% to 9%. Shares traded near $311.

He sees Lam Research as a direct beneficiary of AI-driven demand for advanced memory, logic and packaging technologies. .
AI Spending Remains the Common Theme
Although they operate in different markets, all three companies are benefiting from the same trend: rising AI investment:
- Palantir is monetizing enterprise AI software.
- Amazon is capturing growing cloud demand through AWS, and
- Lam Research supplies the manufacturing equipment needed to produce increasingly complex AI chips.
The analysts behind the calls, Mariana Perez Mora, Doug Anmuth and Edward Yang, each hold five-star ratings on TipRanks based on historical performance.
While elevated valuations remain a risk, the analysts argue that continued AI adoption, expanding cloud workloads and higher semiconductor capital spending could provide additional upside if current growth trends persist.
The post BofA, JPMorgan, Oppenheimer Name Their 3 Favorite AI Stocks, One Has a $255 Target appeared first on BeInCrypto.
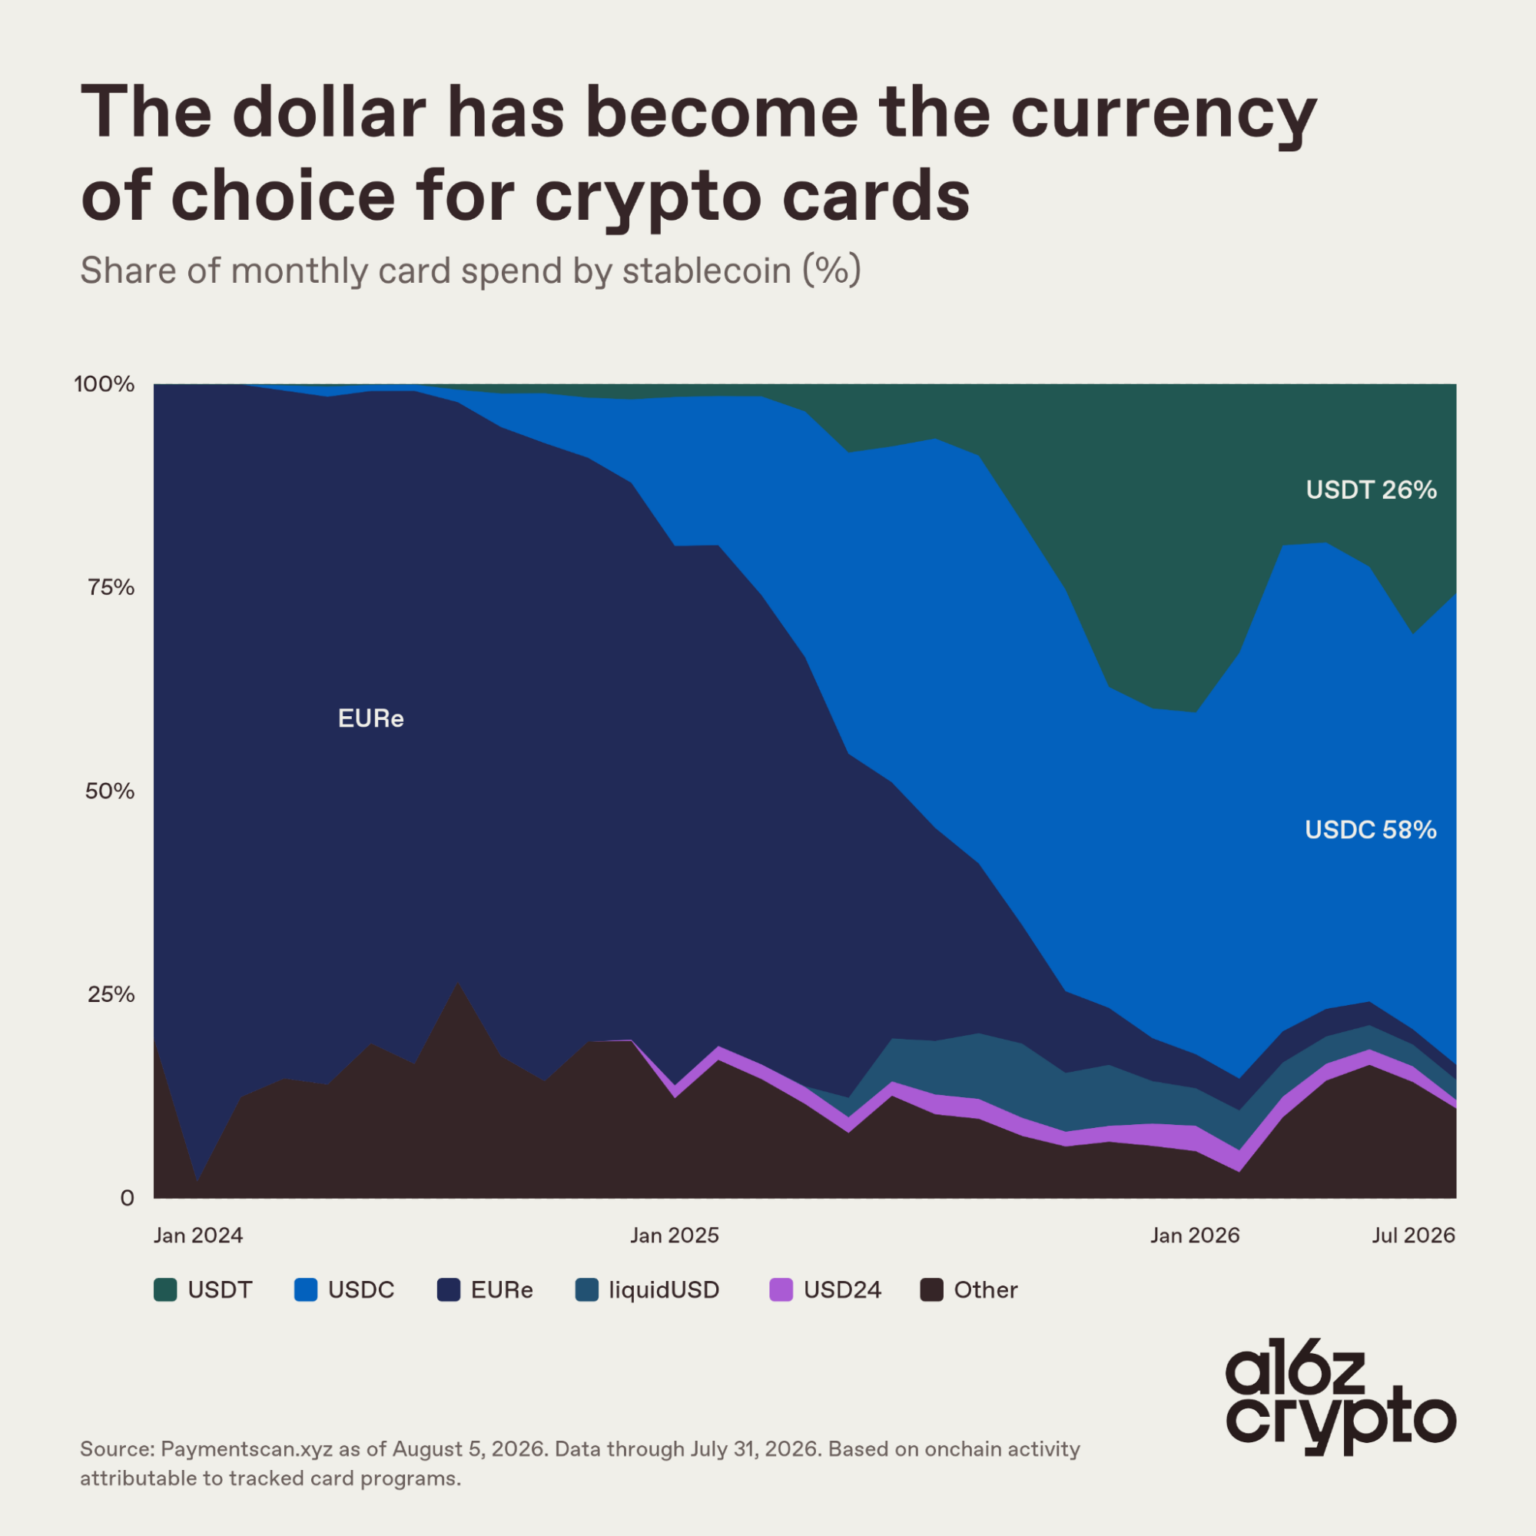
Dollar-backed stablecoins have taken over crypto payment cards. USDC (USDC) and Tether (USDT) together account for roughly 84% of card spending. The split reverses a market that was dominated by euro tokens less than two years ago.
The shift coincided with a wave of new card programs and settlement chains. Over the same period, dollar stablecoins gained share while EURe and Gnosis Pay faded.
Crypto Card Spending Goes Dollar as Euro Crashes to 2%
Crypto payment cards let people spend stablecoins or crypto assets anywhere major card networks operate. The stablecoins convert to local currency at checkout, so merchants see an ordinary card transaction.
In early 2024, the euro-backed EURe accounted for about 88% of card volume. Most of that activity ran through Gnosis.
However, that share has now fallen to roughly 2%, according to a16z crypto’s latest report. The growth of dollar-backed stablecoins has almost entirely pulled spending away from euro rails.
USDC now handles about 58% of card spending and USDT about 26%. A year ago, those figures were near 48% and 7%, respectively.
“Crypto payment card spending now happens overwhelmingly in digital dollars,” the report read.

Follow us on X to get the latest news as it happens
Card Spending Climbs Past $759 Million a Month
Meanwhile, the data shows that monthly crypto card volume reached $759 million in July. That marks a 2.5x jump from $306 million a year earlier.
When tracking began in October 2023, monthly volume sat below $1 million. Cardholders made nearly 9 million purchases in July, up from about 5.2 million a year ago.
The average purchase came to about $86. Settlement has also spread across blockchains as more programs have been launched.
Optimism (OP) now carries about 29% of card volume. Solana (SOL) and Base each hold near 19%, while Gnosis has dropped to roughly 2%.
Nearly all tracked spending still moves through Visa. However, the largest program by volume, RedotPay, self-reports its figures. It does not settle onchain with any certainty, which adds some uncertainty to the totals.
Even so, crypto card spending remains small compared to traditional networks, which process trillions of dollars each month.
Subscribe to our YouTube channel to watch leaders and journalists provide expert insights
The post USDC and USDT Now Own 84% of Crypto Card Spend as the Euro Retreats appeared first on BeInCrypto.

Ethereum continues to hold a commanding position in the tokenized real-world asset (RWA) market, while Solana is emerging as the only other ecosystem to build significant spot trading activity, according to a new joint report by CoinShares and Token Terminal.
Other major networks, including Arbitrum, BNB Chain, and Base, have yet to develop meaningful RWA spot trading despite being operational for years.
Established Chains Lead
The report attributed the gap to the concentration of liquidity and trading infrastructure on established networks, where asset issuers and market makers already benefit from active markets. As a result, newer blockchains are also competing to attract established DeFi applications.
There has been a sharp divergence between crypto-native trading activity and tokenized real-world assets over the past year. Between the second quarter of 2025 and the second quarter of 2026, aggregate spot DEX volumes fell by about 70%, while RWA spot trading volumes rose roughly 220% year over year from a much smaller base. The report said the trend suggests tokenized asset adoption is continuing independently of broader crypto market conditions, despite slower growth in recent quarters.
RWA Lending Builds Steam
There is also a widening gap between overall DeFi activity and tokenized real-world assets. Between the second quarter of 2025 and the second quarter of 2026, total DeFi deposits declined by around 15% amid investor withdrawals and lower crypto asset prices.
RWA deposits, on the other hand, across lending platforms and decentralized exchanges, more than tripled. The figures rose from $2.3 billion to $7.4 billion. This trend points to growing demand driven by the financial utility of tokenized assets rather than crypto market conditions alone.
Ethereum remained the leading blockchain for RWA-backed lending as well, with nearly 70% of all real-world asset deposits allocated to lending platforms built on the network. This makes it the primary ecosystem for on-chain collateral.
Meanwhile, Plasma ranked second, supported by Aave’s expansion beyond Ethereum, while Solana’s growth was largely driven by Kamino, a native lending platform focused on productive uses for RWA collateral.
The post Ethereum Stays on Top of RWA Market as Solana Strengthens Its Position appeared first on CryptoPotato.
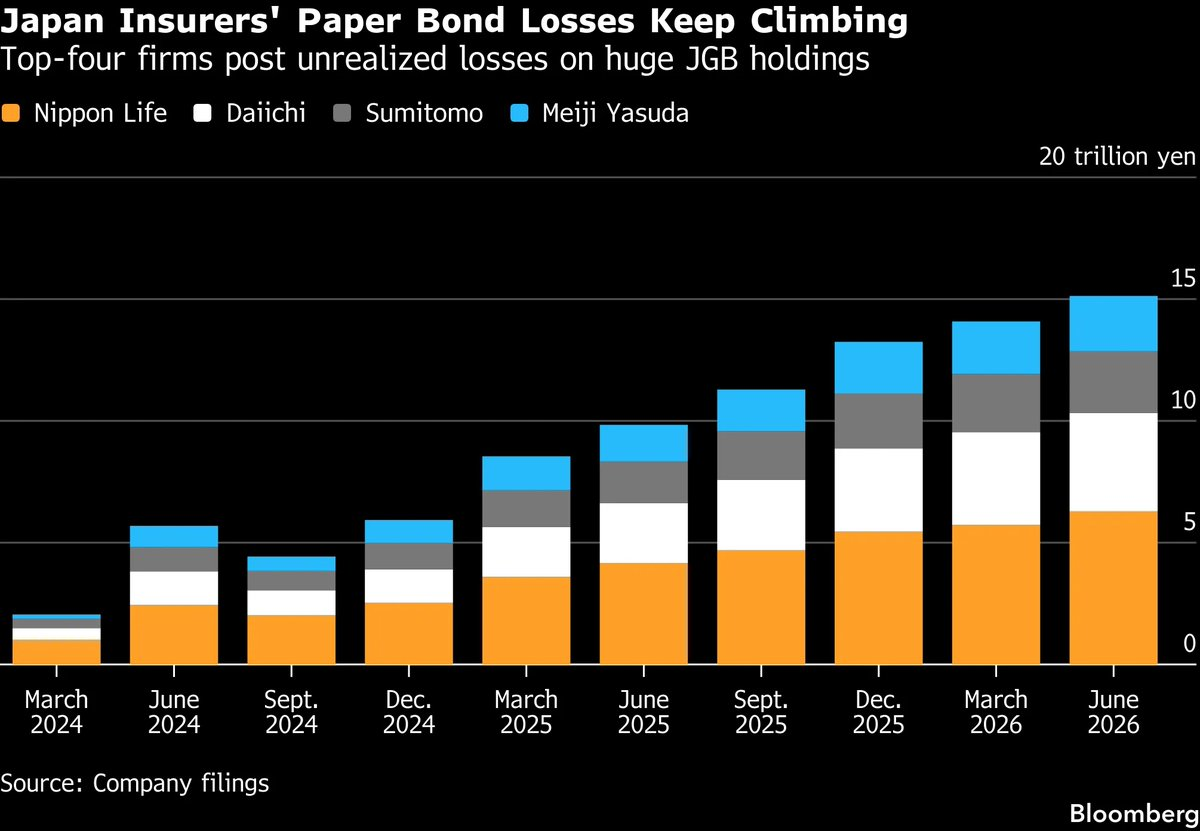
Japan’s exit from decades of ultra-low interest rates is beginning to expose the hidden costs of higher borrowing costs. The country’s four largest life insurers are now sitting on roughly $96 billion in unrealized losses on Japanese government bonds (JGBs).
On their own, the losses are largely an accounting issue. However, they also highlight a broader challenge facing the Bank of Japan (BOJ). Every additional rate hike helps stabilize the yen and curb inflation, yet it also pushes bond prices lower, deepening losses across insurers, banks, and pension funds.
Japan’s Return to Higher Rates Comes at a Cost
Japan’s four largest life insurers, Nippon Life, Dai-ichi Life, Sumitomo Life, and Meiji Yasuda, reported combined unrealized losses of ¥15.13 trillion ($96 billion) on domestic government bonds as of the end of June 2026, up roughly 7% from the previous quarter.

“Something is breaking inside Japan’s financial system,” remarked analyst Bull Theory.
The losses reflect one of the fastest shifts in Japan’s bond market in decades. As the BOJ abandoned negative interest rates and gradually normalized monetary policy, yields climbed sharply from the near-zero levels that prevailed for years.
Bond prices move inversely to yields. As rates rise, the market value of older bonds paying lower coupons falls. Much of the insurers’ portfolios were accumulated during the BOJ’s years of aggressive monetary easing, leaving them exposed to today’s higher-rate environment.
Despite the eye-catching figure, the losses remain largely unrealized because insurers generally intend to hold these bonds until maturity to match long-term policy obligations.
Higher interest rates also reduce the present value of future insurance liabilities, partially offsetting the decline in bond values from an economic perspective.
The bigger concern is liquidity rather than solvency. Should policyholders surrender contracts at a faster pace, insurers could be forced to sell bonds before maturity.
Such a move would potentially convert paper losses into realized ones while adding further pressure to Japan’s bond market.
Why the BOJ Has Become Increasingly Constrained
The insurer losses illustrate the difficult balancing act facing the Bank of Japan.
Inflation remains above the BOJ’s long-term target, while the yen has experienced persistent periods of weakness against the US dollar. Normally, these conditions would support additional interest-rate increases.
However, every hike also increases stress across Japan’s financial system.
Higher yields continue to erode the market value of government bonds held by financial institutions. While stronger rates can help stabilize the currency and improve long-term market functioning, they also risk creating broader financial strains if yields rise too quickly.
The result is a narrowing policy path. Moving too slowly risks renewed yen weakness and imported inflation. Moving too aggressively risks amplifying losses throughout Japan’s financial sector.
Why America’s Debt Market Is Paying Attention
Japan’s importance extends far beyond its domestic financial system.
The country remains the largest foreign holder of US Treasury securities, with holdings of roughly $1.14 trillion. Any meaningful changes in how Japanese institutions manage overseas portfolios can ripple through global bond markets.
There is little evidence that Japanese investors are preparing for large-scale Treasury sales. In fact, outright selling would likely crystallize losses while pushing US borrowing costs even higher.
Instead, authorities have alternative tools. During periods of currency intervention, Japan can access the Federal Reserve’s Foreign and International Monetary Authorities (FIMA) Repo Facility, temporarily obtaining dollar liquidity by pledging Treasuries as collateral rather than selling them outright.
Nevertheless, investors continue to monitor Japanese portfolio flows because even relatively modest reallocations by the world’s largest foreign Treasury holder can influence US yields during periods of market stress.
Bitcoin Is Watching the Yen Carry Trade
For Bitcoin, the insurer losses themselves are not the main story.
Instead, traders are focused on what rising Japanese yields could mean for the yen carry trade, one of the most influential sources of global market liquidity.
For years, investors borrowed cheaply in Japanese yen, where interest rates were close to zero, and invested those funds into higher-yielding assets around the world, including stocks, bonds, and increasingly digital assets.
As Japanese interest rates rise, that strategy becomes less attractive.
Higher borrowing costs and a strengthening yen can force leveraged investors to unwind positions, selling risk assets to repay yen-denominated loans. Previous episodes of BOJ tightening and sharp yen appreciation have coincided with periods of heightened volatility across both traditional markets and cryptocurrencies.
So far, Bitcoin has remained relatively resilient. Following the insurers’ earnings reports, the pioneer crypto continued trading above $65,000, up by over 3% in the last 24 hours.

This suggests markets view the bond losses as a symptom of Japan’s policy transition rather than an immediate financial crisis.
Still, macro traders increasingly see Japanese bond yields and the yen as early indicators of shifts in global liquidity conditions.
What Investors Should Watch Next
The $96 billion in unrealized losses does not, by itself, threaten Japan’s financial system.
Instead, it highlights the growing costs of the country’s departure from decades of extraordinary monetary stimulus.
The next phase will depend on several closely watched indicators:
- Whether Japanese bond yields continue climbing.
- Whether policy surrender rates remain contained, and
- How aggressively the BOJ believes it can continue normalizing interest rates without destabilizing financial markets.
For Bitcoin investors, the key signal may not be the insurers’ balance sheets at all. It will be whether higher Japanese rates begin triggering a broader unwind of the yen carry trade, a development that has historically tightened global liquidity and weighed on risk assets long before the effects became visible elsewhere.
The post $96 Billion Japan Bond Losses Put America Debt and Bitcoin on Alert appeared first on BeInCrypto.
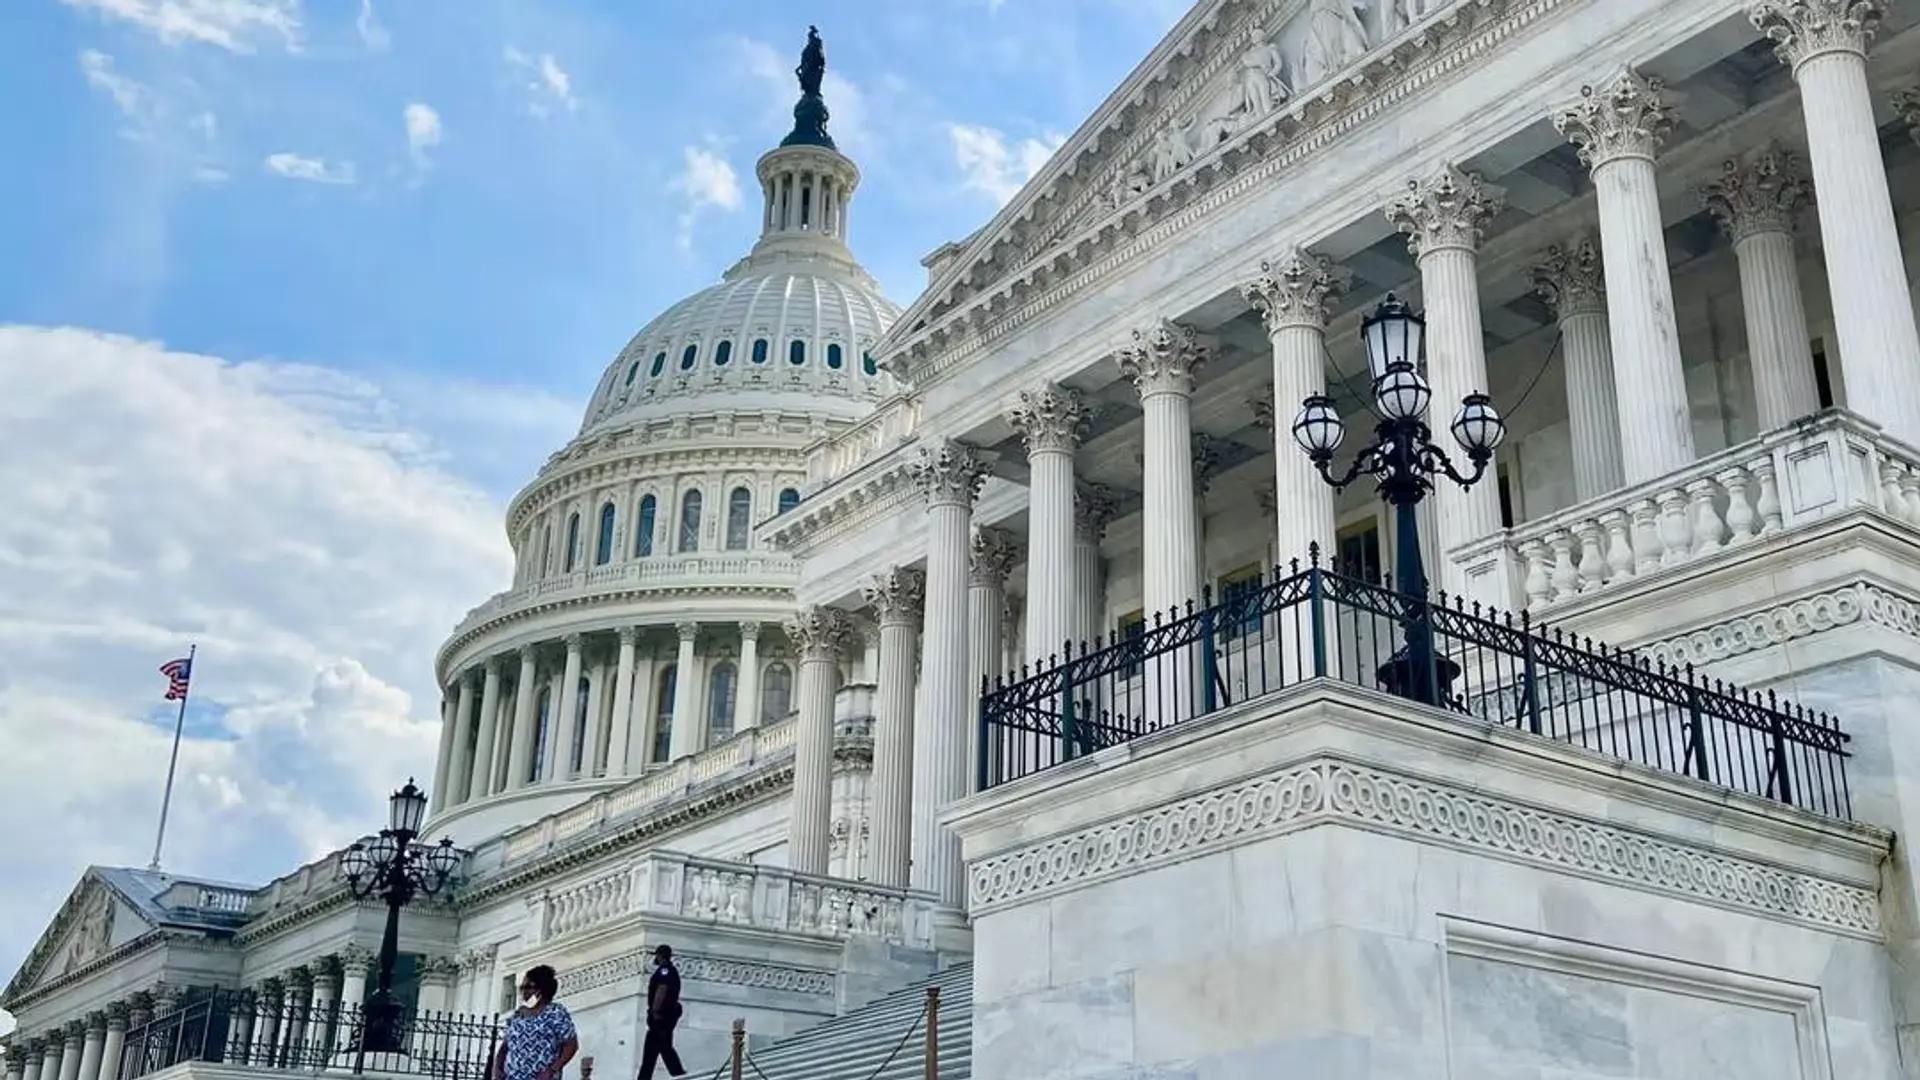
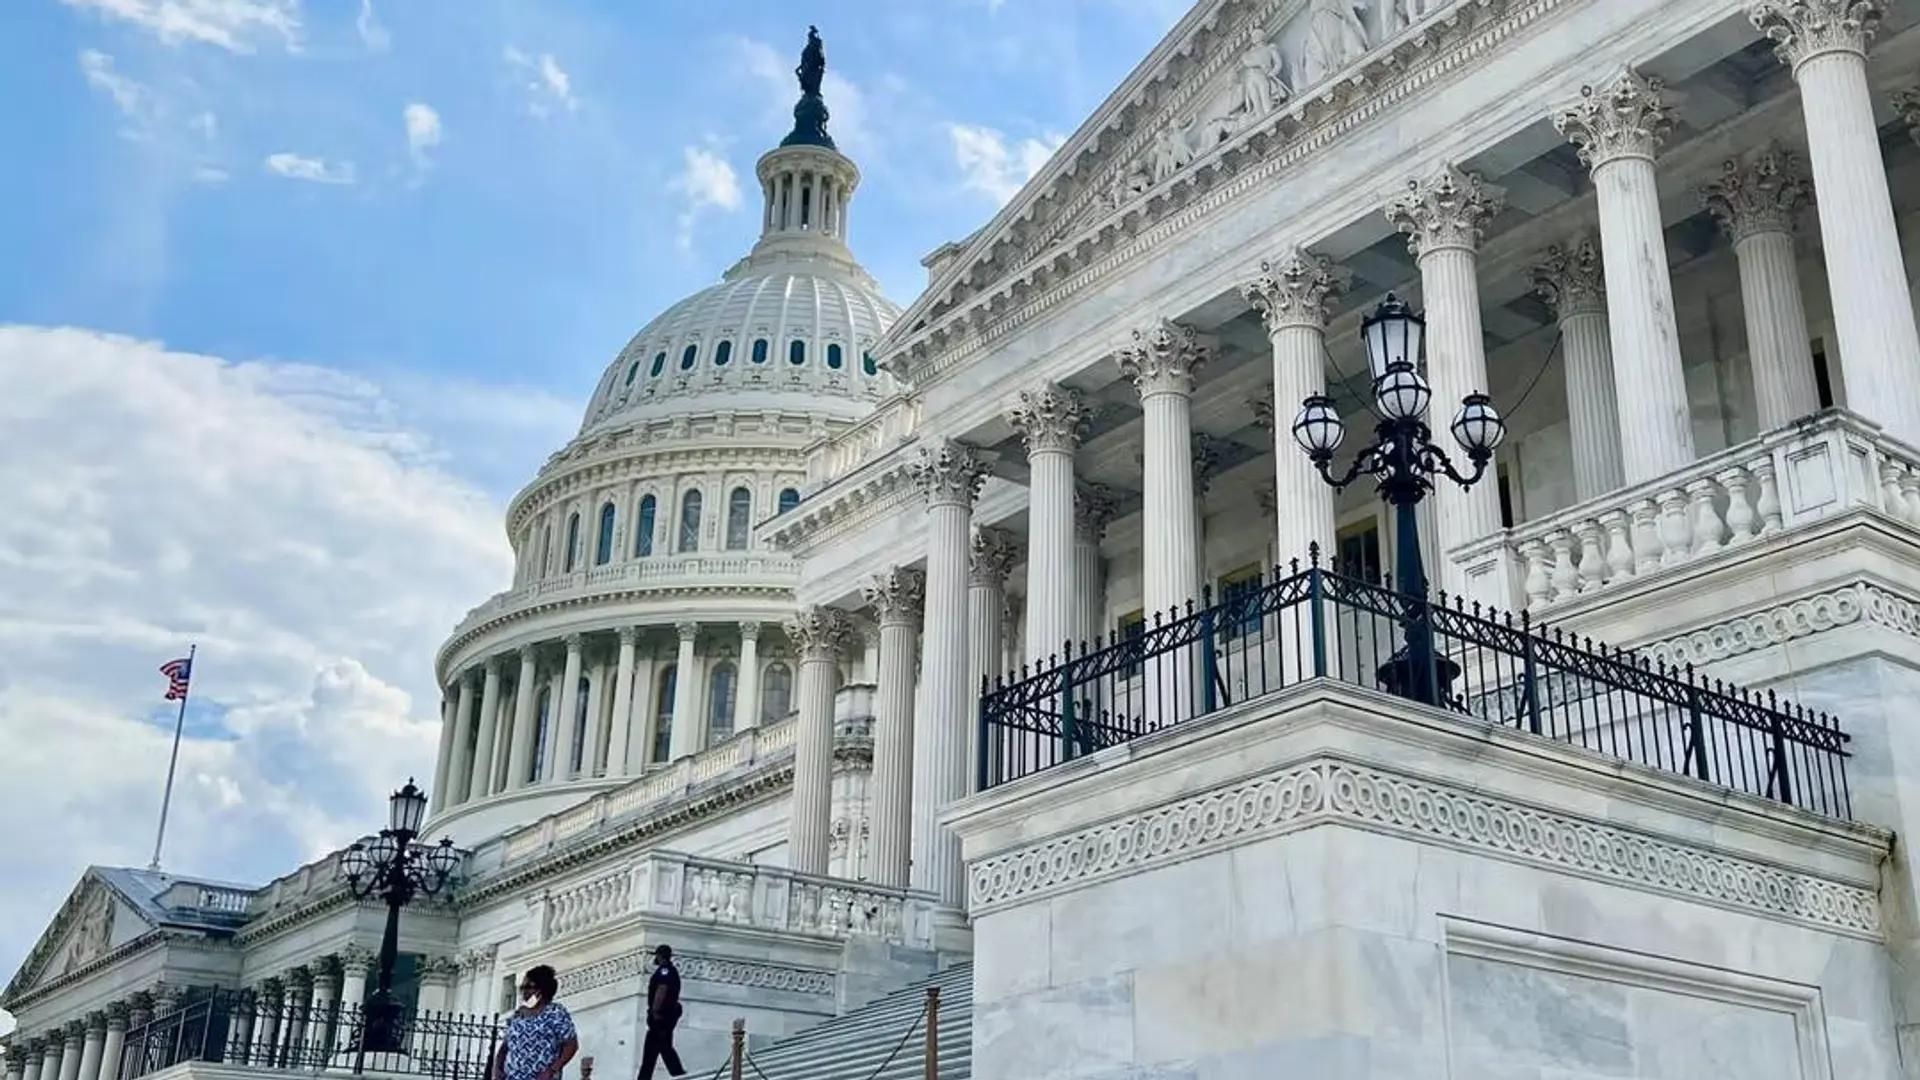
The crypto industry is angry and disappointed that the Senate is not holding a procedural vote on the Clarity Act this month, but that isn’t the worst possible outcome.

Soon after Netanyahu’s comments, Hamas encouraged mediators to continue putting pressure on Israel.
Basem Naim, a senior Hamas official, wrote on X that the group is still “committed to the roadmap reached.”
“We expect the mediators and the American guarantor to press Netanyahu and his government to compel him to adhere to the roadmap and not obstruct the path for internal political and electoral reasons,” he said.
More than 1,250 people have been killed in the Israeli attacks since the original ceasefire in October 2025, most of them civilians, according to the Gaza Health Ministry. Over 73,000 Palestinians have been killed in Gaza since the war began, the ministry said. Hamas has not disclosed how many of its fighters have been killed.
What Is Netanyahu’s Response to Trump?
Netanyahu has long enjoyed a cordial relationship with the U.S. President, whom he has called “the greatest friend that the state of Israel has ever had in the White House.” However, the relationship has appeared more strained since the countries worked together in strikes against Iran on Feb. 28.

Berkshire Hathaway’s second-quarter filings confirmed $23.5 billion in stock purchases, the conglomerate’s first net buying in 14 quarters. Yet the documents name only one new position, a $10 billion stake in Alphabet (GOOGL).
That leaves roughly $13.5 billion in fresh buying without a name. The answer arrives by August 14, when Berkshire files its 13F, the quarterly disclosure that lists every US stock large investors hold.
The Trade Berkshire Hathaway Has Not Named Yet
Berkshire turned net buyer for the first time since 2022, and its famous cash pile finally shrank.
However, the more revealing math hides across two filings. The 10-Q shows $39.4 billion of equity purchases in the first half. However, the first-quarter report recorded just $15.9 billion of that total.
Berkshire therefore bought $23.5 billion of stocks between April and June while selling only $3.7 billion. BeInCrypto reported the Alphabet investment at $10 billion in June. Subtract it, and about $13.5 billion in quarterly buying remains publicly unidentified.
The filing offers one clue. The cost basis of its commercial, industrial and other equity bucket jumped $21.1 billion during the quarter. That category likely includes Alphabet, suggesting the mystery money targets similar businesses.
Meanwhile, Alphabet’s arrival pushed Chevron out of the top five holdings, a quiet shift from oil to technology. Warren Buffett had already offered an earlier Alphabet endorsement, so the direction surprises less than the scale.
Abel’s Fingerprints Are All Over the Filing
The repurchase section carries a detail most reports skipped. Buyback decisions now rest with the chief executive, who consults the chairman, the role Buffett retains.
Greg Abel used that authority immediately. Berkshire repurchased $4.5 billion of its own shares in the quarter, up from $235 million in the previous three months. In effect, the new chief executive declared his own stock undervalued.
The buying came from strength rather than desperation. Operating earnings climbed 16% to $13 billion, while insurance float reached $177.5 billion.
Acquisitions also drained the vault. Berkshire closed the $9.4 billion OxyChem chemicals purchase in January and completed the $6.8 billion Taylor Morrison homebuilder deal on July 24. Consequently, cash and Treasury holdings fell from a record $397.4 billion to $365.5 billion.
That war chest still towers over most markets. It exceeds every crypto asset except the Bitcoin (BTC) market cap, which currently sits near $1.31 trillion. Traders have long treated Berkshire’s cash as a fear gauge, so its first decline in years reads as a risk-on signal.
Abel has shown no appetite for digital assets so far, leaving questions about Berkshire’s future in crypto unanswered.
The August 14 disclosure will show whether the unnamed billions deepen the technology tilt or spread across old-economy names. Either way, Wall Street’s most-watched cash pile is finally moving, and the fine print now matters more than the headline.
The post A $13.5 Billion Berkshire Hathaway Mystery: What Is Greg Abel Buying Beyond Alphabet? appeared first on BeInCrypto.
Bitcoin remains trapped in a broader consolidation structure, with the latest recovery failing to generate convincing bullish momentum. The price is again approaching overhead supply, but buyers have yet to produce the type of breakout needed to signal a meaningful structural shift.
Bitcoin Price Analysis: The Daily Chart
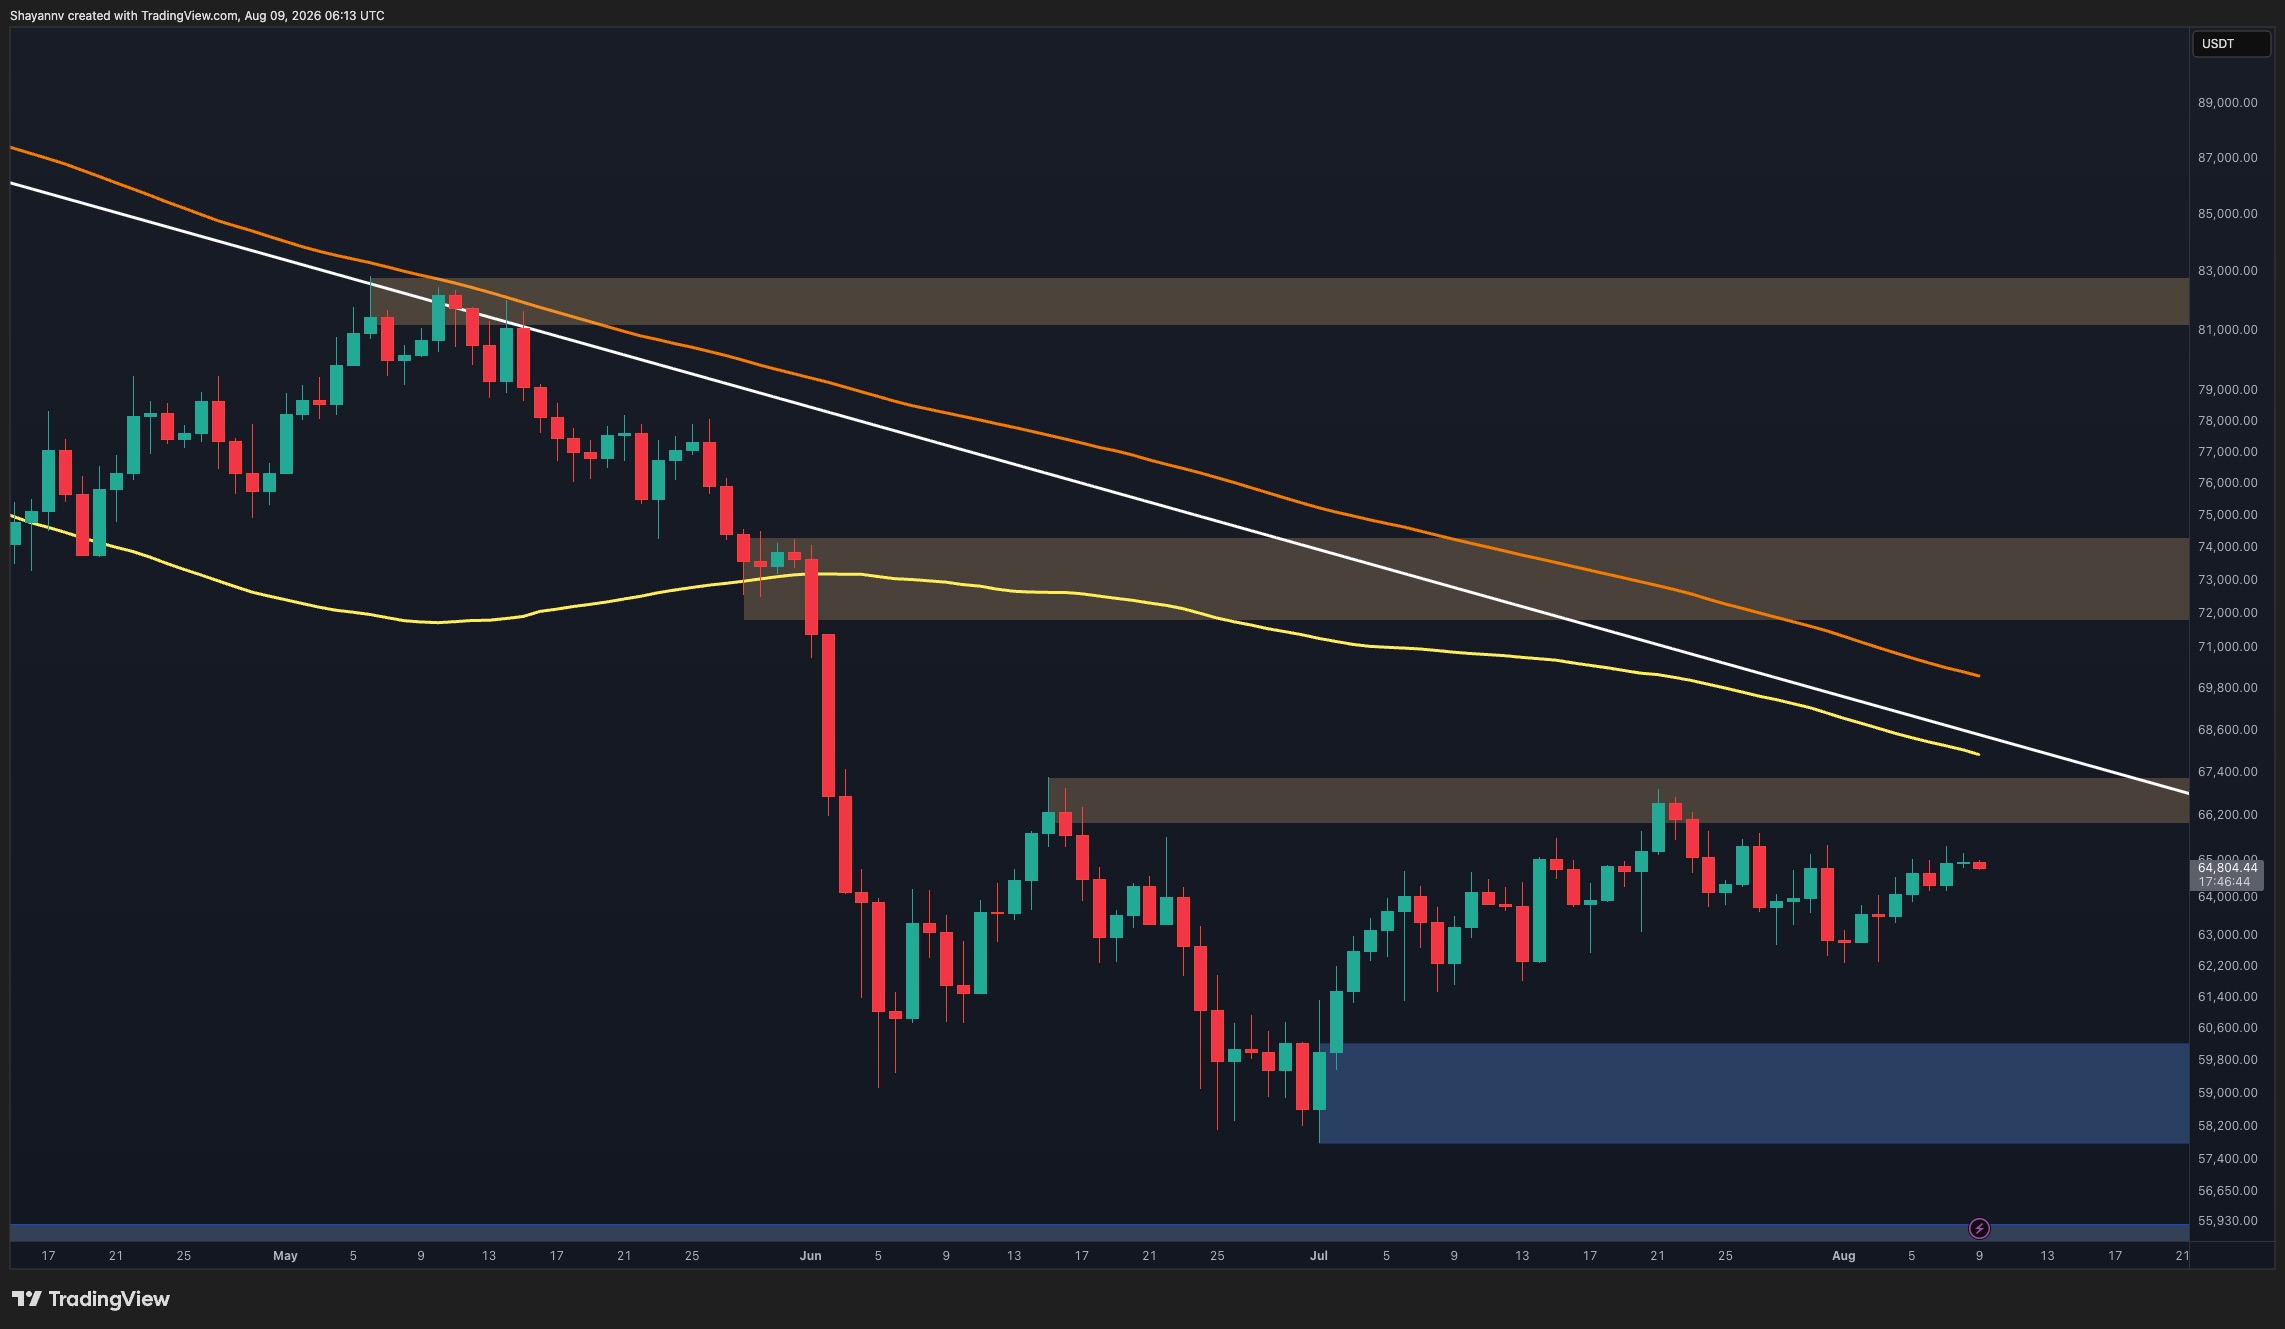
On the daily timeframe, BTC is trading around $65K after recovering from the late-June lows. However, the rebound continues to lack strong bullish momentum, with recent candles becoming relatively compressed as the price approaches the $65.8K-$66.8K resistance zone.
This area has already capped previous recovery attempts and is now reinforced by the descending white trendline approaching from above. More importantly, Bitcoin remains well below the declining moving averages, leaving the broader market structure tilted to the bearish side despite the recent stabilization.
Therefore, the current advance still appears more like consolidation beneath resistance than the beginning of a confirmed bullish reversal. A decisive daily breakout above the $65.8K-$66.8K zone and the descending trendline would improve the outlook, while another rejection could shift attention back toward the major $57.8K-$60K demand region.
The hesitant price action also appears consistent with a market awaiting greater macro and geopolitical clarity. Developments surrounding US-Iran tensions and the Strait of Hormuz, along with upcoming US inflation data this month, could provide catalysts for volatility. Until a decisive move occurs, Bitcoin may remain vulnerable to sharp liquidity-driven fluctuations within its broader range.
BTC/USDT 4-Hour Chart
The 4-hour chart makes the immediate challenge for buyers even clearer. BTC has recovered significantly from the $61.8K-$62.3K support zone, but the rally has repeatedly struggled to reclaim the orange resistance box around $64.8K-$65.4K.
Recent candles are consolidating around the lower boundary of this supply zone rather than breaking decisively through it. This inability to reclaim resistance despite the recovery from $62K suggests that bullish momentum is fading near a critical threshold.
As long as BTC remains below the $64.8K-$65.4K region, another rejection remains a significant possibility. Such a move could initially unwind the latest recovery and eventually expose the $61.8K-$62.3K support box once again.
Conversely, a clean breakout and sustained acceptance above $65.4K would weaken this bearish scenario and could allow buyers to challenge the larger $65.8K-$66.8K resistance area.

Onchain Analysis
The Realized Price UTXO Age Bands provide additional context for Bitcoin’s current market structure. The chart shows the realized prices of the 1-3 month and 3-6 month holder cohorts, which currently sit above spot price at approximately $67K and $72K, respectively.
With BTC trading near $65K, both groups are therefore holding coins at an aggregate unrealized loss. This creates an important overhead cost-basis structure. In particular, the 1-3 month cohort’s realized price around $67K is relatively close to the market and could act as resistance if BTC continues recovering, as recently underwater holders may use a return toward their cost basis to reduce exposure.
The 3-6 month cohort’s realized price around $72K represents another higher threshold. Reclaiming these realized-price bands would indicate that the market is absorbing potential supply from recent buyers and would strengthen the recovery narrative. Until then, their position above spot price complements the technical picture, where Bitcoin continues to face substantial resistance overhead.

The post Bitcoin Price Analysis: Here’s What the Charts Suggest for BTC Next Week appeared first on CryptoPotato.


Bitcoin’s BIP-110 split widened further on Aug. 9, with the enforcing branch still unable to produce a third block hours after mandatory signaling began.
Summary
- BIP-110 remains frozen at block 961,633 while Bitcoin’s main chain has advanced through block 961,744.
- Current-period signaling stands at zero among 113 main-chain blocks mined since mandatory signaling began Saturday.
- OCEAN reports 257 PH/s on its BIP-110 endpoint, with no new block for 17 hours.
- Roughnecks mined both BIP-110 blocks using OCEAN’s DATUM system at Bitcoin’s 127.48 trillion difficulty level.
- Saylor estimates 99.85% of hashpower rejected the fork, though that figure remains his own calculation.
The latest BIP-110 Monitor snapshot showed the minority chain stuck at block 961,633 while Bitcoin’s dominant, non-enforcing chain had reached 961,744. That increased the gap to 111 blocks from 88 earlier Sunday.
The stall offers the clearest test yet of how much mining support BIP-110 has attracted. Only 51 of the 2,016 blocks in the previous difficulty period signaled for the proposal, equal to 2.53%. Since the mandatory window started at block 961,632, the monitor had recorded zero signaling blocks among the first 113 blocks on the dominant chain.
Bitcoin BIP-110 branch remains frozen after two blocks
BIP-110 enforcing nodes began rejecting non-signaling blocks at height 961,632 on Aug. 8. Roughnecks then produced an alternative block at that height and followed it with block 961,633. OCEAN’s BIP-110 block record confirms that Roughnecks mined the first block using its DATUM system at a difficulty of 127.48 trillion.
Progress stopped shortly afterward. OCEAN’s BIP-110 mining endpoint showed its latest block remained 961,633 roughly 17 hours later, with displayed hash power around 257 PH/s at the latest retrieval. Meanwhile, the non-enforcing Bitcoin chain continued adding blocks at its normal pace.
As crypto.news reported, the gap had reached 98 blocks when Bitcoin stood at 961,731 earlier Sunday. The newer monitor data shows another 13 Bitcoin blocks were added without a corresponding BIP-110 block, bringing the difference to 111.
The branch has not technically ceased to exist. Miners can still direct additional computing power toward it and attempt to extend its chain. However, the latest data provides no evidence that enough hash power has arrived to restore anything close to Bitcoin’s regular block production rate.
Full Bitcoin difficulty makes the minority fork difficult to advance
The problem comes from Bitcoin’s difficulty adjustment system. BIP-110 split away at the start of difficulty period 477, but the enforcing branch inherited the same mining target as the dominant chain. Losing most of its mining power therefore did not immediately make its blocks easier to find. OCEAN records the difficulty at 127.48 trillion.
Bitcoin normally recalculates difficulty after a 2,016-block period. Since the BIP-110 branch has produced only blocks 961,632 and 961,633 in the current window, it still needs to work through the remainder of that period before a normal retarget can provide relief. With block production already measured in many hours rather than roughly ten-minute intervals, the time required could become extremely long unless additional miners join.
Michael Saylor seized on that weakness Sunday. In an X post, the Strategy executive chairman said “about 99.85% of Bitcoin’s hashpower stayed with Bitcoin” and called the result decisive. That 99.85% figure is Saylor’s estimate rather than a measurement published by the Bitcoin protocol or BIP-110 specification.
Saylor separately estimated that, at “~0.15% of Bitcoin’s hashpower,” the fork could take “~25 years” to reach its first difficulty adjustment. That projection should also be treated as an estimate based on the hash power assumption he used at the time. Mining power can enter or leave either branch, so the expected timeline can change sharply.
Mandatory signaling continues despite the miner rejection
The unusual feature of BIP-110 is that missing its voluntary signaling target did not end the deployment. The official BIP-110 specification sets a 55% threshold during voluntary signaling but also includes a mandatory window between blocks 961,632 and 963,647. Nodes enforcing the proposal reject blocks during that period unless their version field signals bit 4.
The previous difficulty period ended with just 51 supporting blocks out of 2,016, or 2.53%. Period 477 has been even more one-sided on the dominant chain so far. At block 961,744, the monitor counted zero signaling blocks out of 113 produced since the new period began.
This is why BIP-110 can create a minority branch despite low miner support. Nodes running its rules reject blocks that ordinary Bitcoin nodes accept, causing the two groups to disagree about which blocks are valid. The dominant chain retains far greater observed mining activity, while BIP-110 enforcing nodes remain on the two-block branch.
Saylor and Blockstream co-founder Adam Back had warned before the split that enforcing BIP-110 without broad support could divide the network. Supporters, including Bitcoin Knots maintainer Luke Dashjr, have instead argued that temporary consensus restrictions are necessary to curb non-monetary data storage. These remain opposing positions in the broader dispute over Bitcoin block space.
Holders still face replay risk while both chains exist
The stalled branch also leaves a practical issue for anyone considering moving pre-fork coins. BIP-110 does not inherently give those balances replay protection, meaning a transaction signed on one branch can potentially remain valid on the other under some circumstances.
Bitcoin developer Kevin Loaec warned users that attempting to sell coins on the minority fork without first separating balances could expose corresponding BTC on the dominant chain. The danger arises because both histories began with the same pre-split transaction outputs.
The risk does not mean someone automatically gains control of an entire Bitcoin wallet. Rather, a transaction valid on both chains could be copied and rebroadcast, potentially moving the same transaction inputs on each network. Users who leave pre-split coins untouched do not create a signed transaction that can be replayed.
The economic relevance of that issue will depend partly on whether exchanges, wallets and users begin assigning value to the minority chain. So far, its two-block history and slow production leave little infrastructure for normal transfers or trading.
What happens next for BIP-110
The next formal checkpoints remain block based. Under BIP-110, mandatory signaling continues through block 963,647. The proposal is designed to enter LOCKED_IN no later than block 963,648, then move to ACTIVE one difficulty period later. Its actual reduced-data consensus rules would begin at block 965,664 and run for 52,416 blocks, or roughly one year at Bitcoin’s intended block rate.
Those heights are straightforward for the dominant Bitcoin chain to reach if current block production continues. They are much harder for the enforcing branch while it remains at 961,633. The two chains can therefore reach nominally identical block heights on very different calendars.
BIP-110 supporters have also prepared a more radical fallback. An Aug. 1 GitHub branch maintained by Chris Guida contains 12 commits involving a potential proof-of-work change, including code for selecting another algorithm and configuring a hard fork time. No activation time is set in the code.
Guida has described the work as contingency code rather than an immediately scheduled fork. That means the present BIP-110 split remains governed by Bitcoin’s existing proof-of-work difficulty unless supporters adopt another change later.
For now, the latest measurable trend remains one-sided. At 15:27 UTC Sunday, Bitcoin had extended the gap to 111 blocks, BIP-110 had not produced a third block, and no block in the dominant chain’s new difficulty period had signaled support. Whether that changes depends primarily on miners directing substantial new hash power toward the enforcing branch.
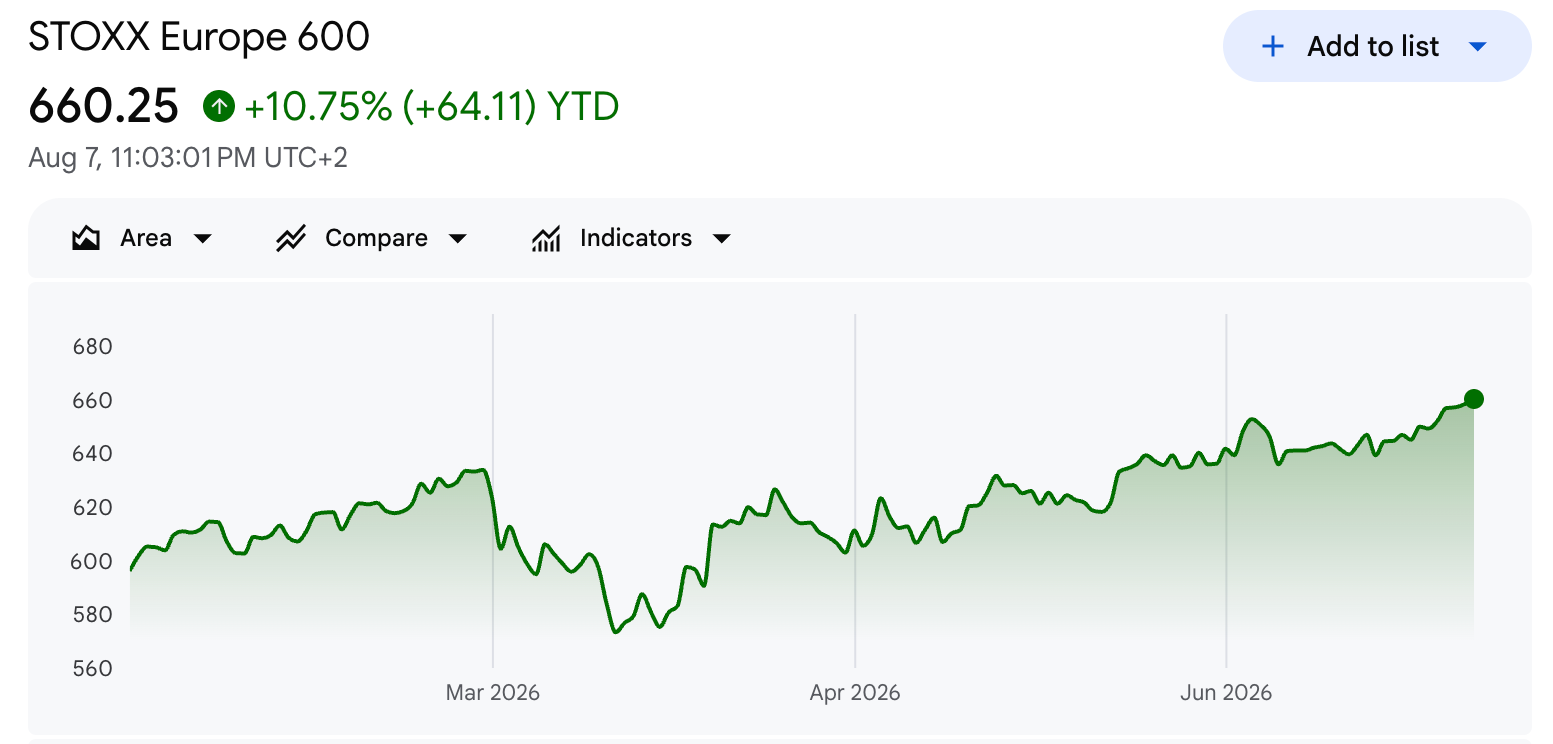
European stock exchange-traded funds (ETFs) recorded a month of positive net flows in July, their first since the US-Iran conflict began in late February, according to Bloomberg data.
The return of capital signals renewed investor appetite for the region. A strong earnings season and easing oil prices have restored Europe’s appeal as a hedge against volatile technology stocks.
Investor Money Returns to Europe
BlackRock highlighted that its European equities products attracted $4.4 billion in July. The asset manager described the flows as evidence of anti-momentum allocations away from volatile chipmaker stocks.
A July sell-off in global semiconductor stocks had pushed investors toward regions less tied to technology and artificial intelligence stocks. Europe emerged as a favored destination.
Strong corporate results reinforced the shift. Companies in the Stoxx Europe 600 are on track for 22% year-on-year earnings growth in the second quarter, the strongest since 2022.
Banks led the performance. BNP Paribas saw quarterly profits surge by a third, while UBS profits jumped 17% to a record, both driven by trading revenues.
Follow us on X to get the latest news as it happens
Banks Turn Bullish on the Rally
Meanwhile, UBS raised its year-end target for the Stoxx 600 to 690 points from 630. Against Friday’s close, that implies roughly 5% further upside.
Goldman Sachs echoed the confidence in its August picks. The bank projects 168% upside for UK clean energy developer Ceres Power and 102% for German defense contractor Rheinmetall over 12 months.
The Stoxx 600 has gained 10.7% in 2026 and touched a record 663.4 points this month. Germany’s Dax, the FTSE 100, France’s Cac 40, and Spain’s Ibex also reached highs.

Not every strategist agrees. Societe Generale expects the Stoxx 600 to fall to 600 points, while TFS forecasts a 9% decline to 585.
Subscribe to our YouTube channel to watch leaders and journalists provide expert insights
The post European Stock ETFs Post First Positive Month Since the Iran War Started appeared first on BeInCrypto.

BofA, JPMorgan, Oppenheimer Name Their 3 Favorite AI Stocks, One Has a $255 Target

‘Close’ – Pep Guardiola’s real reason for rejecting first job since Man City exit

5 Useful Harbor Freight Trailer Accessories You Can Buy

Renter of Home in Anne Heche Crash Denies Settlement With Son

No Jackpot Winner as $257 Million Prize Rolls Over to $269 Million Monday Draw

Weekend Open Thread: Staud – Corporette.com

WORST HACK IN BITCOIN HISTORY! CRYPTO SELF CUSTODY ISN’T SAFE? (COLDCARD WALLET)

Stock Market is Run by a Government of India….#maduraiveeranmoneycoach #financial #motivation

Marriage: The Ultimate Financial & Love Hack? #shorts
-

 Fashion2 days ago
Frugal Friday’s Workwear Report: Cap-Sleeve Pointelle Crewneck Sweater
-

 Fashion2 days ago
Weekend Open Thread: Mattifying Sunscreen
-

 Business7 days ago
DTCR: Deleveraging And A Hedge Fund Collapse Point To A Possible AI Bottom
-

 Sports4 days ago
Jordan Coyle & Cordiamo take Laya Arena Stakes at RDS
-

 News Videos1 day ago
Can Astrology Help Find Gold and Silver Trends? A Financial Astrology Guide
-
 Crypto World6 days ago
US Tech Stocks See Largest 5-Week Inflow in History: Can Nasdaq Break Its Downtrend?
-
 Business4 days ago
US stocks: Dow closes at record on Mideast optimism; SpaceX, AMD drag Nasdaq
-

 Politics3 days ago
Reform UK And Greens Sink To Lowest Favourability Ratings To Date
-

 Business5 days ago
Nvidia Stock Climbs 2.5% as Chip Sector Rally Builds Ahead of AMD Earnings, Nvidia’s Own Report Looms
-

 Tech7 days ago
OpenAI teases Astra, its next major AI model, after it solves 10 long-standing math problems
-

 Crypto World5 days ago
Polymarket targets $20 billion valuation as competition heats up in prediction market sector
-

 Tech5 days ago
OpenAI, Anthropic AI agents targeted real people and systems in cyber tests
-

 Business4 days ago
Supply chain issues impact Ingredion
-

 News Videos7 days ago
#crypto #cryptocurrency #cryptonews #cuet2026 #ceuta
-

 Business7 days ago
Myspace owners announce plans to relaunch the once-popular platform
-

 News Videos7 days ago
Crypto.com Partners with UFC for UFC 331 Event
-
 Crypto World5 days ago
CLARITY Act Senate Vote Locked In, But 60-Vote Hurdle Looms Large
-

 News Videos7 days ago
Huge SPINS!! (for me) #slots #casino #gambling #money #jackpot
-

 Tech2 days ago
Rinn Pharma & Biopharma to join NordicPharmaTrain network
-

 News Videos7 days ago
#xrp #xrpripple #xrparmy #xrpnews #bitcoin #btc #crypto #cryptocurrency #blockchain #viral
You must be logged in to post a comment Login