

Crypto World
Analyst warns Ethereum could slip to $1.2K next

Ethereum’s Ether (ETH) could slip toward the $1,200 region in the coming weeks, as a fractal-driven setup highlighted by trader Leshka.eth points to a potential deeper pullback if key support gives way. The analyst emphasizes a daily Supertrend pattern that has preceded outsized declines when bearish flips have failed to hold.
Historically, the pattern produced notable reversals: bullish flips that failed to sustain gains in October 2025 and January 2026 culminated in sharp drops of roughly 45% and 48%, respectively. The current formation forms near $1,990, and the trader warned that a break below that level could open the path toward the $1,200 zone. As Leshka.eth put it: “If that level breaks, the next target is the $1,200 zone.”
The narrative sits alongside a broader chart look that ties the bearish setup to a measured downside target from a bear-flag pattern on ETH’s daily chart, signaling a test of lower levels if momentum remains negative. The Ethereum price context has shifted as the market contends with a softer macro backdrop and a tug-of-war between risk appetite and liquidity considerations.
On the price action front, ETH has erased more than 17% from its monthly high in a little over two weeks. The pullback comes as Ether futures and spot sentiment loosen, with Ether ETFs reportedly registering net outflows of about $300 million in that span. Market observers describe the demand for Ethereum as having cooled to one of its weakest levels in 16 months, adding to the headwinds for a near-term recovery.
In the broader market backdrop, macro forces are not supportive of an immediate rebound. Risk appetite has waned amid geopolitical headwinds and recession concerns, while bond traders have pushed back expectations for Federal Reserve rate cuts beyond December 2027, according to probabilities tracked by CME’s FedWatch tool. The combination of softer macro signals and cleaner liquidity dynamics has kept ETH in a fragile zone even as short-term liquidity remains plentiful in some pockets of the market.
Key takeaways
- Bearish fractal setup on ETH’s daily chart points to a possible drop to $1,200 if the near-term level around $1,990 is breached, reaffirming a risk of deeper downside rather than a quick bounce.
- Historical occurrences where similar bullish flips failed have preceded sharp declines of roughly 45% to 50%, underscoring the difficulty of a sustained reversal in this pattern.
- On-chain demand signals show weak conviction among large and mid-size holders, with mega-whales (>10,000 ETH) flattening and mid-tier cohorts not reaccumulating decisively, suggesting limited downside protection from holders at present.
- The macro environment and ETF flows temper near-term momentum, with outflows and recession concerns weighing on Ethereum’s immediate prospects even as staking activity and exchange-supply dynamics offer a more complex longer-term picture.
Bearish fractal signals and price structure
The proposed bearish path hinges on a Supertrend-based pattern observed on ETH’s daily chart. The Supertrend, a trend-following indicator that changes color to mark direction, has previously produced brief bullish flips that did not stick. In the two notable prior instances—October 2025 and January 2026—the price rose briefly above the upper band only to fail and slide aggressively once the band’s support failed to hold. The current setup centers near $1,990, with the implication that a break below that crumb could activate the next leg lower toward the $1,200 zone. This aligns with a broader bear-flag interpretation that yields a measured downside target consistent with a sharper decline if support fails.
Trading-view charts referenced by the analyst illustrate a pattern where the price dropped decisively after the upper-band break and the subsequent loss of support, reinforcing the risk of a renewed downtrend if the current formation cannot sustain upward momentum. While such fractals do not guarantee outcomes, they provide a framework for assessing risk in a market dominated by macro uncertainty and shifting liquidity conditions.
On-chain behavior and holder conviction
Beyond price patterns, on-chain metrics paint a mixed picture of ETH demand. Glassnode data show that accumulation signals remain tepid across major wallet cohorts. For instance, mega-whale addresses holding more than 10,000 ETH have flattened after peaking in late 2025, and the 30-day change across this cohort has moved back toward neutral after extended declines. That pattern suggests that the biggest holders have not been stepping in with renewed aggression to back a sustained rally.
The story is similar for smaller but meaningful cohorts. Ethereum wallets holding between 1,000 and 10,000 ETH remain well below their late-2025 highs, with the 30-day change hovering around flat to marginally negative levels. Likewise, addresses in the 100–1,000 ETH bracket continue to trend below last year’s peaks, indicating a broad lack of renewed buying conviction among mid-sized to mid-tier holders. Taken together, the on-chain picture points to distribution pressures rather than broad-based accumulation, reinforcing the risk of a continued slide if the $1,990 zone gives way.
Despite the overall cautious stance from holders, there are some glimmers of potential longer-term support. Market observers note that on-chain activity around Ether staking has been rising, while the amount of Ethereum available on exchanges has fallen to ten-year lows. This combination signals that some holders are choosing to stake rather than liquidate, a dynamic that could eventually bolster Ethereum’s supply-side stability and reduce immediate selling pressure if demand improves. Still, these factors have not yet outweighed the current headwinds reflected in price action and investor sentiment.
For readers tracking the narrative, the balance of signals suggests that the immediate trajectory will hinge on whether ETH can defend the $1,990 threshold. A break lower would align with the fractal-driven downside scenario and the bear-flag target discussed by analysts, potentially amplifying the downside risks in the near term.
What to watch next
Investors should monitor a few key developments in the days ahead. First, whether ETH can sustain a move back above $1,990 or whether sellers regain control and push the price toward the $1,200 zone. Second, on-chain data—especially the behavior of mega-whales and the flow of Ether into staking pools—will be crucial for gauging whether demand may crystallize later in the year. Finally, macro momentum, including Fed expectations and risk appetite in relation to geopolitical developments, will continue to shape ETH’s risk premium and potential recovery path.
The market’s path remains uncertain, but the combination of a fragile macro backdrop, cooling on-chain demand, and fragile price patterns suggests a cautious stance for ETH in the near term as traders weigh the potential for further downside against the lure of long-term staking and shrinking exchange supply.


US Federal Reserve governor Christopher Waller said Sunday that the growing use of dollar-backed stablecoins could bolster the global influence of US monetary policy.
Waller told participants at the 32nd Dubrovnik Economics Conference that countries that increasingly rely on stablecoins backed by the US dollar may effectively import US monetary conditions, Bloomberg News reported Sunday.
“I’ve always just looked at stablecoins as a payment instrument; there’s nothing evil about it, nothing dangerous about it,” Waller said. “They are just bringing competition into the payments world,” Reuters reported.

Source: The 32nd Dubrovnik Economic Conference
A contrary view was presented by his fellow presenter, Bank of England policymaker Megan Greene, who said stablecoins could fade from view in a matter of a few years. She said:
“I think tokenized deposits are probably going to take over from stablecoins and five years from now, I suspect we might wonder why we were talking about stablecoins.”
Both were part of a panel discussion titled “Stablecoins and monetary policy” at the annual Croatian National Bank event.
A long-time skeptic of central bank digital currencies (CBDC), Waller said that enthusiasm for CBDCs has faded among many central banks. BoE’s Greene disagreed.
“I like to think of it as a massive race between the tortoise, the hare and the rhino.” Greene said. “The tortoise is the central bank digital currency …the hare is stablecoins and the rhino is tokenized deposits. We’ll probably end up with all three, but if I had to put money in one … it would be the rhino, tokenised deposits, which I think will probably take off,” Reuters reported.
Related: ECB pushes back on euro stablecoin proposals, citing financial stability risks
Stablecoin policy stymies US crypto legislation
Debate over US policy on stablecoin yield has stymied progress on the US Digital Asset Market Clarity Act under consideration in the US Senate.
The crypto market structure bill is one of the most significant pieces of crypto regulations in the US, but it is unclear if it will be signed into law in 2026 due to opposition from the banking lobby and the looming US midterm elections.
The CLARITY Act, which aims to establish a federal regulatory framework for digital assets passed out of the Senate Banking Committee on May 15 after months of debate between banks and the crypto industry over stablecoin yield provisions. However, it must still pass both chambers of Congress before heading to the president’s desk.
Wyoming Senator Cynthia Lummis warned Saturday that the US will lose its leadership position in crypto to other countries, including China, if lawmakers fail to pass the legislation this year.
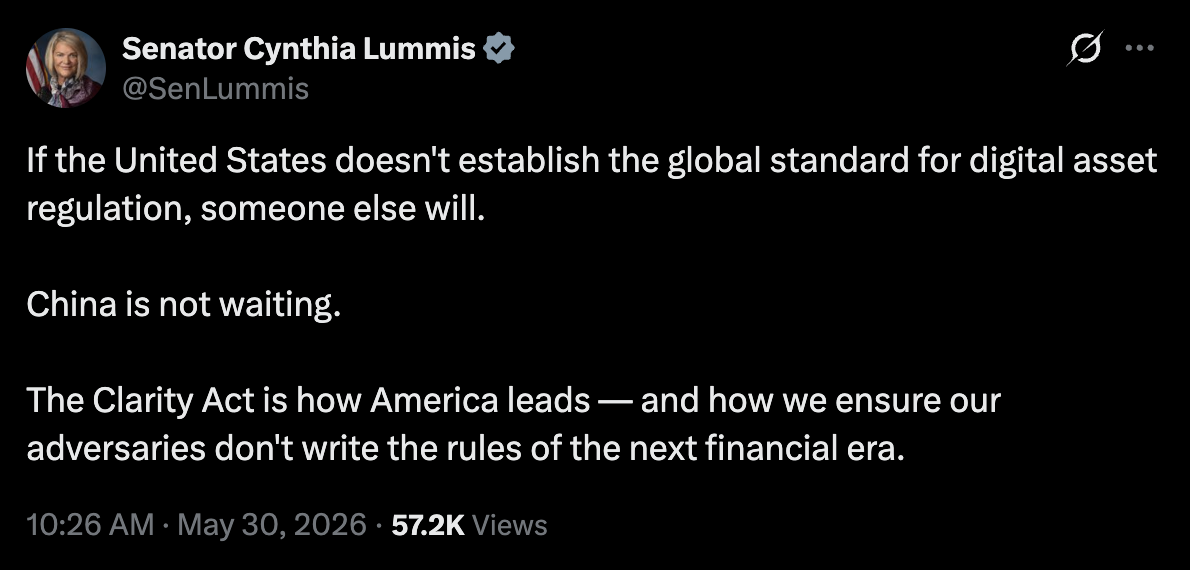
Source: Senator Cynthia Lummis
“America built the dollar-dominated financial system that has anchored global stability for a century. The Clarity Act ensures we build the next one. The time to act is now, before Beijing decides it will,” Lummis said in an X post.
Learn: Why banks are fighting stablecoins after shaping the rules
A Satoshi-era Bitcoin wallet that sat untouched since August 2010 moved 20 BTC on Sunday, ending 15.8 years of total dormancy. The transfer, worth roughly $1.47 million at current prices, drew immediate attention from on-chain analysts.
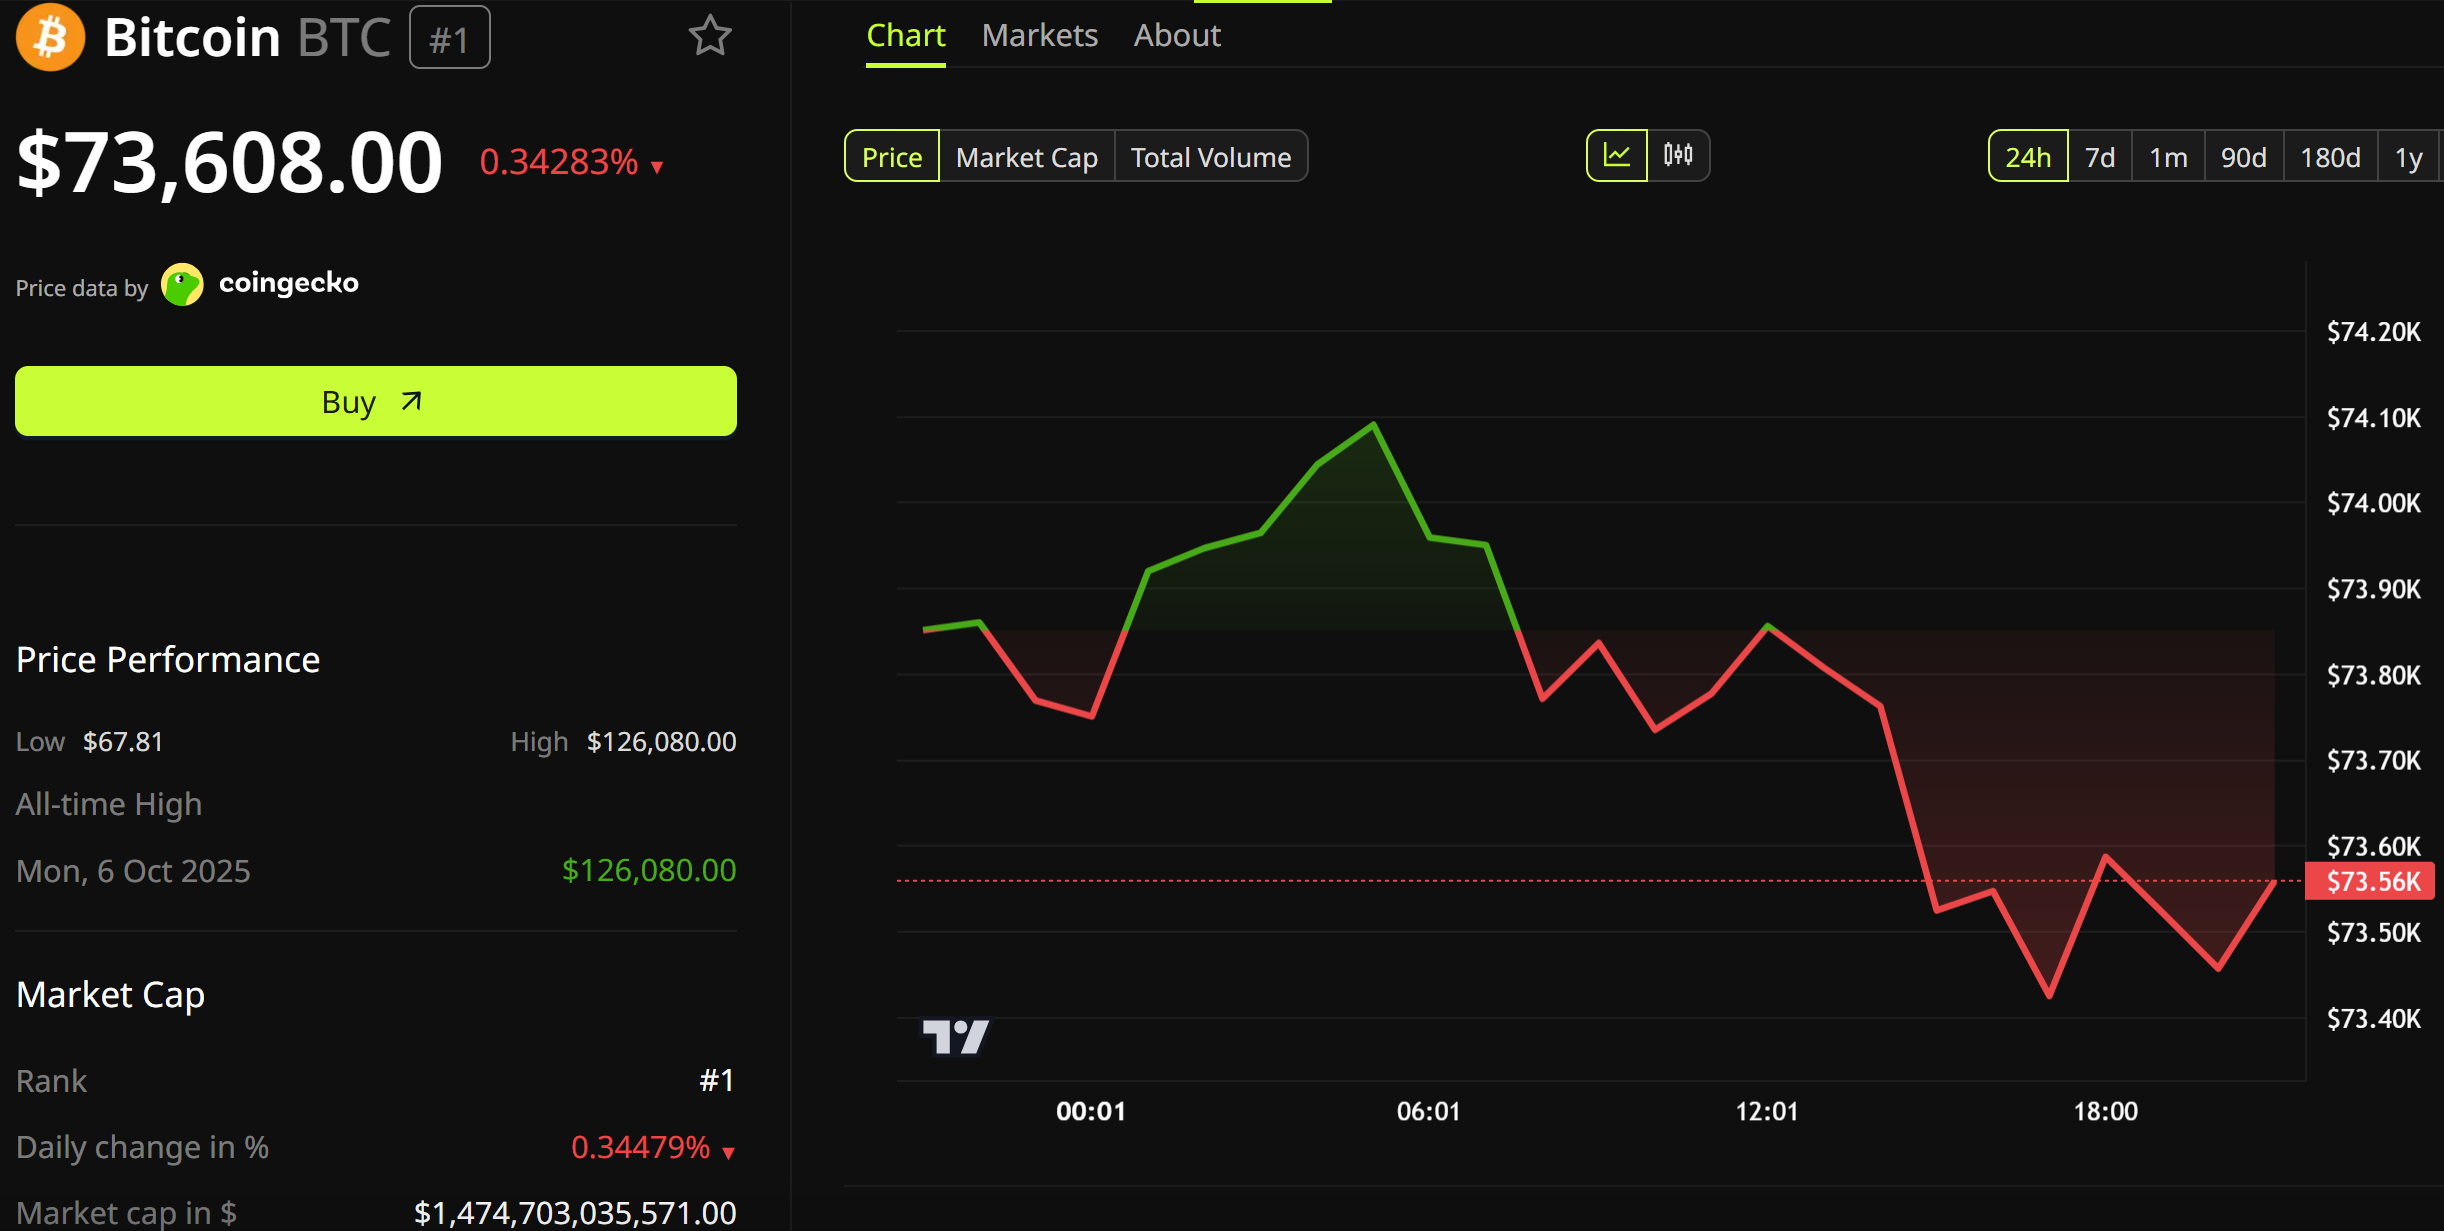
Galaxy Research first flagged the event in block 951828, mined at 05:14 UTC on May 31, 2026. Bitcoin (BTC) was trading near $73,608 around the transfer time, off 0.3% on the day.

An Anonymous Holder, Not Satoshi
The address, starting with 1CDSyXAQxro4FPUoqAQb, last received coins nearly 16 years ago. That places the wallet firmly within Bitcoin’s earliest mining era.

CPU mining was common at the time, and only a small circle of enthusiasts ran the network. Alex Thorn, head of firmwide research at Galaxy, quickly ruled out any connection to Satoshi Nakamoto.
“satoshi era coins moved this AM (not suspected of being satoshi’s coins though),” he noted.
Galaxy distinguishes likely Satoshi clusters from other early wallets through on-chain heuristics. The 20 BTC amount here did not match those profiles.
Similar Satoshi-era miner movements have surfaced repeatedly through 2025 and 2026, often without market consequence.
Small Footprint in a $16 Billion Daily Market
Twenty BTC reads as statistical noise against Bitcoin’s roughly $16.3 billion in daily spot volume. The token is down nearly 4% over the past week and 6.2% across 30 days. Macro flows continue to dominate price action.
A similar pattern accompanied a dormant miner wallet reactivation that produced limited price impact.
Bitcoin’s slow redistribution from earliest holders has accelerated alongside higher prices.
An 80,000 BTC whale movement earlier this year sent coins to exchanges without triggering panic.
Whether this anonymous owner sells, consolidates, or simply rotates to modern address formats remains unclear.
The answer surfaces only if the 20 BTC reaches an exchange. The transfer adds to a broader long-term holder redistribution trend defining Bitcoin’s 2026 cycle.
The post $1.47 Million in Satoshi Era Bitcoin Moves After Nearly 16 Years appeared first on BeInCrypto.
Crypto World
This Week in Crypto: MicroStrategy’s Bitcoin Fears Fade, $500M Claude Bill, Thiel Stock Halves
Crypto and its neighboring markets spent the week separating conviction from hype. Bitcoin (BTC) shook off sell-off fears and pushed its long-term floor higher, even as a $500 million AI bill and a 50% stock crash showed how fast unbacked bets unravel.
That split ran through the week’s biggest names. SpaceX banked a $2.29 billion defense win, and Bitcoin holders bought weakness, while a runaway AI tab and a Las Vegas sports flop supplied the cautionary half.
MicroStrategy Reversal Cools Bitcoin Sell-Off Fears
Bitcoin trades near $73,600 after a week that tested nerves more than support. MicroStrategy, the largest corporate holder, withdrew 411.5 BTC worth about $30 million from Coinbase Prime hours after depositing it.
The deposit was its first direct exchange move in nearly two years. The round trip eased fears that Michael Saylor was lining up a sale. Prediction-market odds of a 2026 sale eased but stayed high.
The firm still holds 843,738 BTC and has bought none since May 18. Tom Lee’s BitMine bought the weakness too, adding 25,000 ether (ETH) for $50.6 million.
Bitcoin’s 200-Week Floor Climbs Past $61,000
The structural picture looks steadier than the price. Bitcoin’s 200-week moving average has climbed past $61,000, up from $60,000 in early May.
Blockstream CEO Adam Back flagged the move on May 30 as a long-term bull signal. The average smooths nearly four years of weekly closes and has marked every prior cycle bottom.
Only the 2022 bear market saw a weekly close below it. With BTC near $73,600, the spot price sits roughly $12,600 above that rising floor. Back paired the chart with a discipline argument borrowed from the late Charlie Munger.
A $500 Million Claude AI Bill Lands in One Month
The fallout from the week’s biggest AI bill is still spreading. An unnamed enterprise client ran up a $500 million charge on Anthropic’s Claude AI in a single month, Axios reported.
The cause was simple. Nobody set usage limits or spending caps for thousands of employees. Microsoft later trimmed internal Claude Code licenses after per-engineer costs hit $500 to $2,000 a month.
Uber reportedly exhausted its 2026 AI budget by April. Amazon even shut an internal AI leaderboard after staff gamed it with low-value prompts. The blowup is accelerating enterprise AI discipline across the sector.
SpaceX Banks a $2.29 Billion Space Force Contract
Defense and space names ended the week higher on a single award. SpaceX secured a $2.29 billion US Space Force contract to build the Space Data Network Backbone.
The system will move secure military data over low-orbit satellites, with a prototype due by the end of 2027. It feeds the Pentagon’s wider Golden Dome plan and deepens Elon Musk’s role in national security. Rocket Lab (RKLB) climbed about 13% on the week.
The deal also sharpens the SpaceX IPO speculation that crypto prediction markets keep pricing.
Thiel-Backed Enhanced Games Stock Halves After Vegas Flop
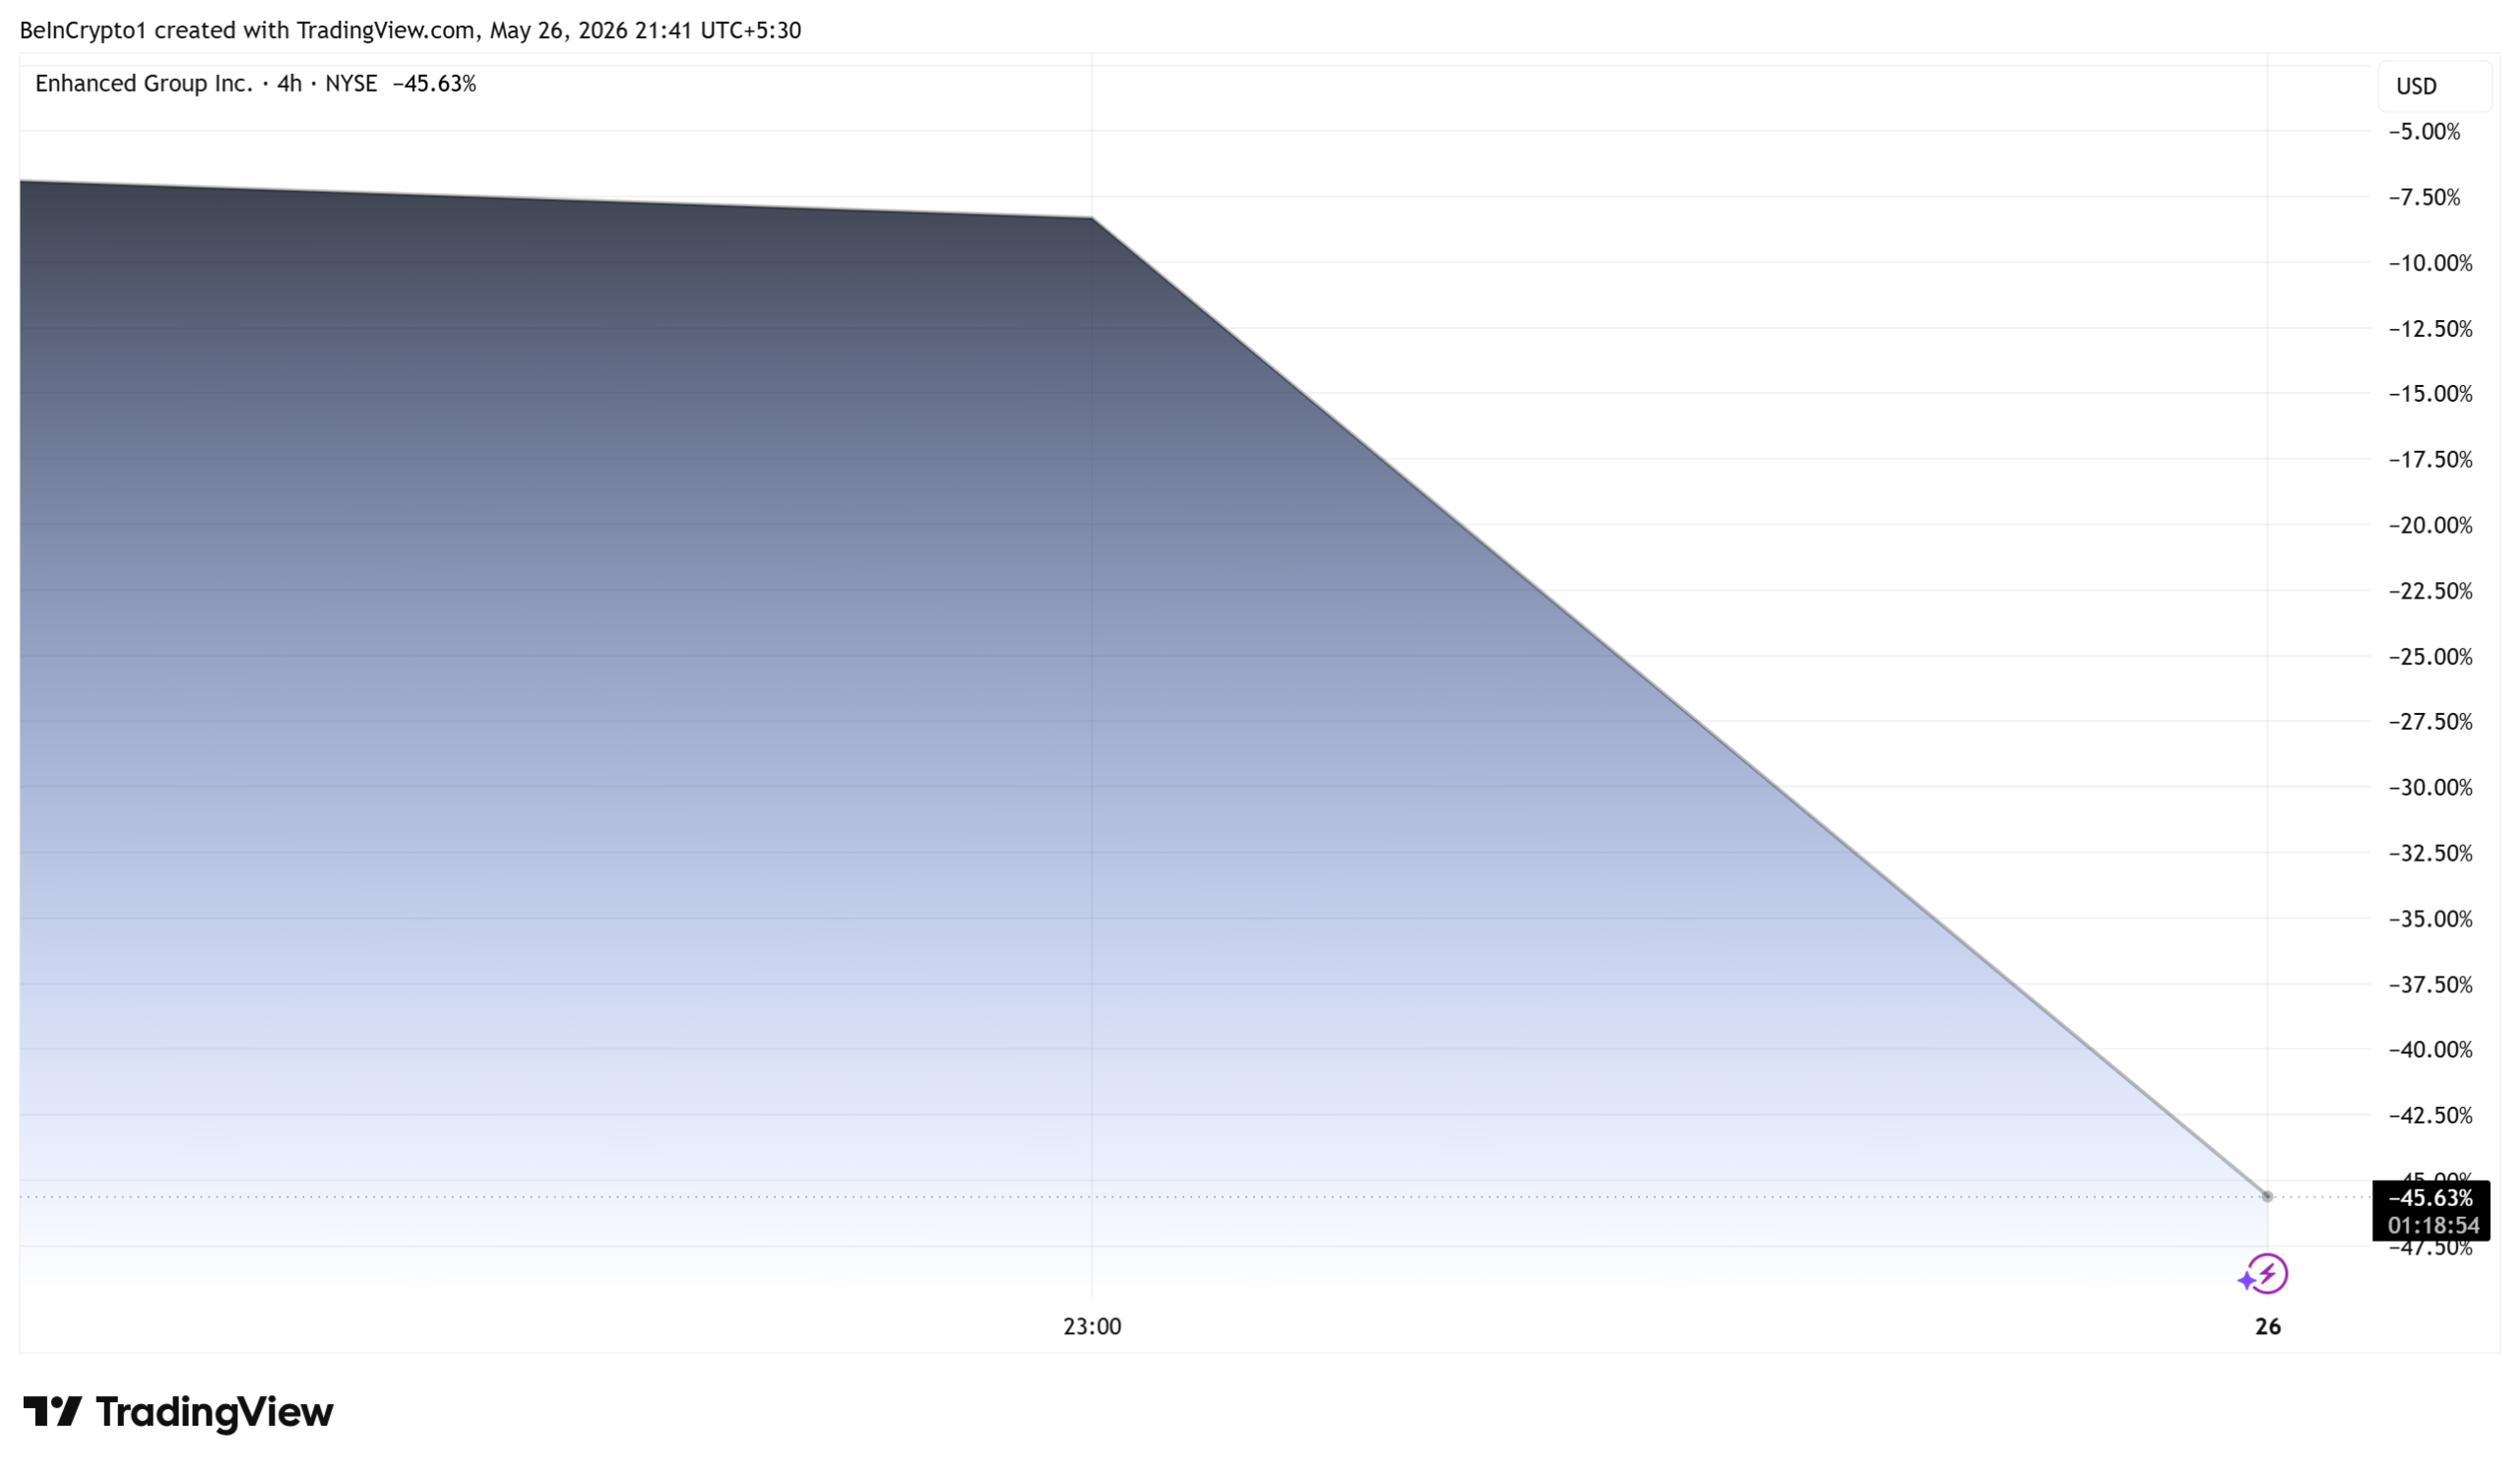
Enhanced Group (ENHA) closed the week as the market’s clearest hype check. The Peter Thiel-backed stock fell about 50% on Tuesday.
A six-hour Las Vegas debut produced just one unofficial world record. The May 24 event paid a $25 million purse, and the company’s own data showed 91% of athletes used testosterone.

Swimmer Kristian Gkolomeev set the lone record, while clean athletes won three events outright. The slide wiped close to $800 million from a firm that went public this month at a $1.2 billion valuation. The setup echoed another venture-backed spectacle in which a human intern recently outpacked a humanoid robot.
The post This Week in Crypto: MicroStrategy’s Bitcoin Fears Fade, $500M Claude Bill, Thiel Stock Halves appeared first on BeInCrypto.


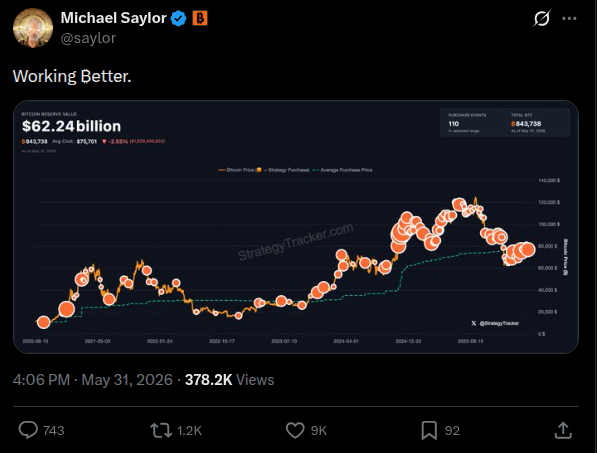
Michael Saylor, founder and executive chairman of Strategy, posted “Working ₿etter” on X on May 31, drawing immediate speculation from traders and market watchers about another Bitcoin (BTC) acquisition.
The message echoes a familiar pattern that market watchers have learned to follow. Strategy has historically disclosed new Bitcoin purchases within days of similar posts, turning each update from Saylor’s account into a closely followed signal for a potential 8-K filing.
Longest Purchase Pause in Recent Months
Strategy has not added to its holdings since May 18, the longest gap in its recent weekly buying run. The company holds 843,738 Bitcoin as of May 31, per StrategyTracker data.
The reserve value stands at approximately $62.24 billion, with an average acquisition cost of $75,701 per coin.
The post also follows Strategy’s brief Coinbase Prime move last week. The company deposited 411 BTC there, which pushed Polymarket odds of a 2026 Bitcoin sale above 90%, then withdrew the funds hours later in a reversal that cooled the sell-off narrative.
Bitcoin Balance Sheet Scrutiny Grows
A new purchase would come amid rising concern over MicroStrategy’s capital position. The company spent $1.38 billion in May buying back $1.5 billion face value of its 2029 convertible notes, trimming its USD reserve to approximately $871 million from around $2 billion before the transaction.
Arca chief investment officer Jeff Dorman published a direct warning about the capital flywheel, arguing that roughly $15 billion in outstanding preferred stock and approximately $1.5 billion in annual dividend obligations now put real strain on the accumulation model.
“MSTR, BTC and Pref holders are really in a bind. Someone is going to lose badly here, and it will happen in the next 4 months,” Dorman stated.
Saylor acknowledged at Q1 2026 earnings that Bitcoin sales remain an option if other capital sources run short. Gold advocate Peter Schiff has repeatedly cited that comment in his ongoing liquidity critique of the firm.
A June 8 vote by STRC holders on shifting preferred dividends to semi-monthly payments adds another near-term capital deadline to the mix.
The post may precede a formal acquisition filing or simply be routine communication. Either way, the next few days will indicate where Strategy’s treasury playbook is headed.
The post Michael Saylor’s Post Fuels New Bitcoin Purchase Speculation for MicroStrategy appeared first on BeInCrypto.

Strategy’s leadership, led by Strategy chairman Michael Saylor, signaled on Sunday that the bitcoin treasury company plans to announce fresh BTC purchases in the coming days as it presses toward a pivotal proxy vote tied to its STRC perpetual preferred stock. The vote centers on a proposed dividend schedule change and could shape Strategy’s ongoing BTC accumulation narrative amid a volatile macro backdrop.
Bitcoin traded around the mid-70s in May, with a 3.65% decline for the month, anchoring the context for Strategy’s ongoing buy program. In parallel, Saylor posted a bubble-chart update showing Strategy’s bitcoin purchases over nearly six years, a visual that has become a familiar prelude to news of new acquisitions. The chart is drawn from StrategyTracker.com, a data tracker based in Iceland, and accompanied Saylor’s message “Working Better.”
Key takeaways
- Michael Saylor signaled imminent Bitcoin purchases by Strategy in the days ahead of the June 7 proxy vote on STRC dividends.
- STRC investors would shift to semi-monthly dividends from monthly, a change Strategy says could reduce reinvestment lag, improve liquidity, market efficiency, and price stability if approved.
- Strategy’s BTC holdings remain substantial (843,738 BTC) with an average cost around $75,701 per coin; BTC price hovered near $73,566 at the time of publication, after May’s 3.65% decline.
- The vote’s outcome hinges on retail shareholder participation, a dynamic historically skewed toward institutional holders, according to a Harvard Law School governance study.
- Bitcoin’s longer-term technical backdrop includes the 200‑week moving average moving decisively above $61,000, a level some technicians view as a bullish signal for the asset’s trajectory.
Saylor signals new BTC purchases ahead of STRC vote
As the June 7 proxy deadline approaches, Strategy’s leadership has doubled down on communicating with shareholders and the broader market about its capital allocation path. The company’s anticipated purchases come in the wake of a post in which Saylor shared a chart from StrategyTracker.com—described as an Iceland-registered project—that tracks Strategy’s bitcoin acquisitions dating back to the firm’s early years. The accompanying caption, “Working Better,” underscores a continued emphasis on measured accumulation rather than sudden shifts in stance.
Strategy’s track record remains sizeable: the bitcoin treasury now totals 843,738 BTC, acquired at an average reported cost of roughly $75,701 per coin. While the firm’s buying cadence has varied with market conditions, the chart and historical cadence have become a bellwether signal for market participants watching for potential new purchases. At the time of writing, Bitcoin traded around $73,566, reflecting a broader May pullback from earlier highs.
The broader significance for investors lies in how Strategy’s ongoing accumulation intersects with its corporate structure and governance. StrategyTracker.org emphasizes that the tracker highlights the company’s long-running relationship with bitcoin as a treasury asset, a feature that has helped position Strategy as a visible, public-facing holder within the crypto ecosystem. The Icelandic registration of StrategyTracker is a note favored by market watchers as part of the broader transparency surrounding Strategy’s strategy and holdings.
For readers tracking the dynamics of the world’s largest public holder of BTC, Saylor’s posts and the StrategyTracker visualization continue to function as signals of potential near-term pacing for new BTC purchases, especially as the STRC vote looms.
STRC dividend reform and the race for retail votes
Central to Strategy’s governance discussion is the proposal to change STRC’s dividend frequency from monthly to semi-monthly. The company argues that such a shift could reduce reinvestment lag, improve liquidity, increase market efficiency, and contribute to price stability—if shareholders approve the amendment. The proposal sits at the heart of the June 7 proxy vote, which determines whether the change goes into effect for 2026 and beyond.
In the days leading up to the vote, Strategy has leaned into outreach to retail investors, a cohort that has historically shown uneven participation in proxy affairs. An internal Strategy investor relations communication circulated to employees outlined the 2026 annual meeting proposals and provided links to the shareholder resolutions under consideration. In public messaging on X (formerly Twitter), Strategy underscored the 50% voting threshold required for the STRC amendment, noting that all votes count given the 85 million STRC shares outstanding as of April 17, 2026.
A day before the outreach, Strategy’s CEO Phong Le published a short video thanking STRC shareholders for their trust and explaining the proposed amendment’s implications in a concise format. This kind of leadership outreach illustrates the push to mobilize retail participation ahead of the vote, a dynamic that analysts say can be a meaningful lever in outcomes that hinge on retail proxy engagement.
The retail-vs-institutional voting dynamic has been a recurring theme in corporate governance research. A Harvard Law School Forum on Corporate Governance note from late 2025 highlighted that retail investors have historically cast votes on roughly 29% of the shares they own across five proxy seasons, while institutional holders voted approximately 77% of their shares. The discrepancy remains a reminder that turnout in retail-led votes can shape outcomes, even when a company holds a significant stake in a singular asset such as BTC.
For readers examining Strategy’s trajectory, the STRC vote is not just a procedural step; it could influence the liquidity and perceived stability of the STRC instrument itself, as well as the company’s overall approach to BTC as a treasury asset in a market that has shown volatility and evolving regulatory scrutiny.
The public-facing materials and investor communications also point to an ongoing effort to balance retail participation with the long-term strategic aims that Strategy has pursued since becoming the largest public holder of BTC. The decision by STRC holders to approve or reject the semi-monthly dividend model will feed into the broader discourse around how crypto-backed corporate structures can govern and distribute crypto wealth in ways that align with shareholder value and risk management.
Bitcoin price, technical backdrop, and what’s next
Beyond corporate governance, market technicians have focused on Bitcoin’s price trajectory and long-run signals. Blockstream CEO Adam Back highlighted that BTC’s 200-week moving average has moved well above the $61,000 level, a metric that some traders view as a sign of sustained, contrarian upward momentum. The significance of the 200-week moving average lies in its tendency to smooth out short-term volatility and provide a long-run perspective on trend direction. As the STRC vote unfolds and Strategy continues its accumulation narrative, traders will watch whether the price action confirms a renewed uptrend or tests a fresh support level amid ongoing macro volatility.
Readers should also monitor Strategy’s next moves in BTC purchases. If the company ends up signaling or executing new acquisitions in the days following the vote, the combination of fresh supply from a large holder and any changes to STRC’s dividend mechanics could create ripples across both the equity and crypto markets. For investors, the key questions are how these actions affect Strategy’s balance sheet, the liquidity profile of STRC, and the potential signaling effect for other corporate entities seeking to align crypto treasury management with traditional governance frameworks.
All data points cited—Strategy’s BTC holdings and average cost, the June 7 proxy deadline, the STRC share count, and the voting thresholds—are drawn from Strategy’s public disclosures and market data contemporaneous with the article’s reporting window. The linkage to StrategyTracker provides a historical lens on Strategy’s accumulation pattern, while the investor-relations communications illustrate the ongoing governance engagement that accompanies the ownership of a crypto-forward treasury asset at scale.
For readers keeping score, the next major milestone is the outcome of the STRC proxy vote and any subsequent commentary from Strategy about its BTC purchase cadence. Market participants should watch for any official disclosure of new BTC buys and for how the STRC dividend change interacts with the company’s broader capital allocation framework and treasury strategy in a climate of rising regulatory scrutiny and evolving market structure for crypto assets.
As the narrative unfolds, observers should remain attentive to how retail investor participation in governance evolves, whether the STRC amendment passes, and how Strategy’s ongoing BTC acquisitions influence perceptions of crypto-backed corporate finance in the broader market.
What to watch next: the June 7 proxy vote result, any announced BTC purchases from Strategy in the wake of the vote, and the market’s interpretation of STRC’s new dividend regime as a potential model for other crypto-bearing corporate entities.
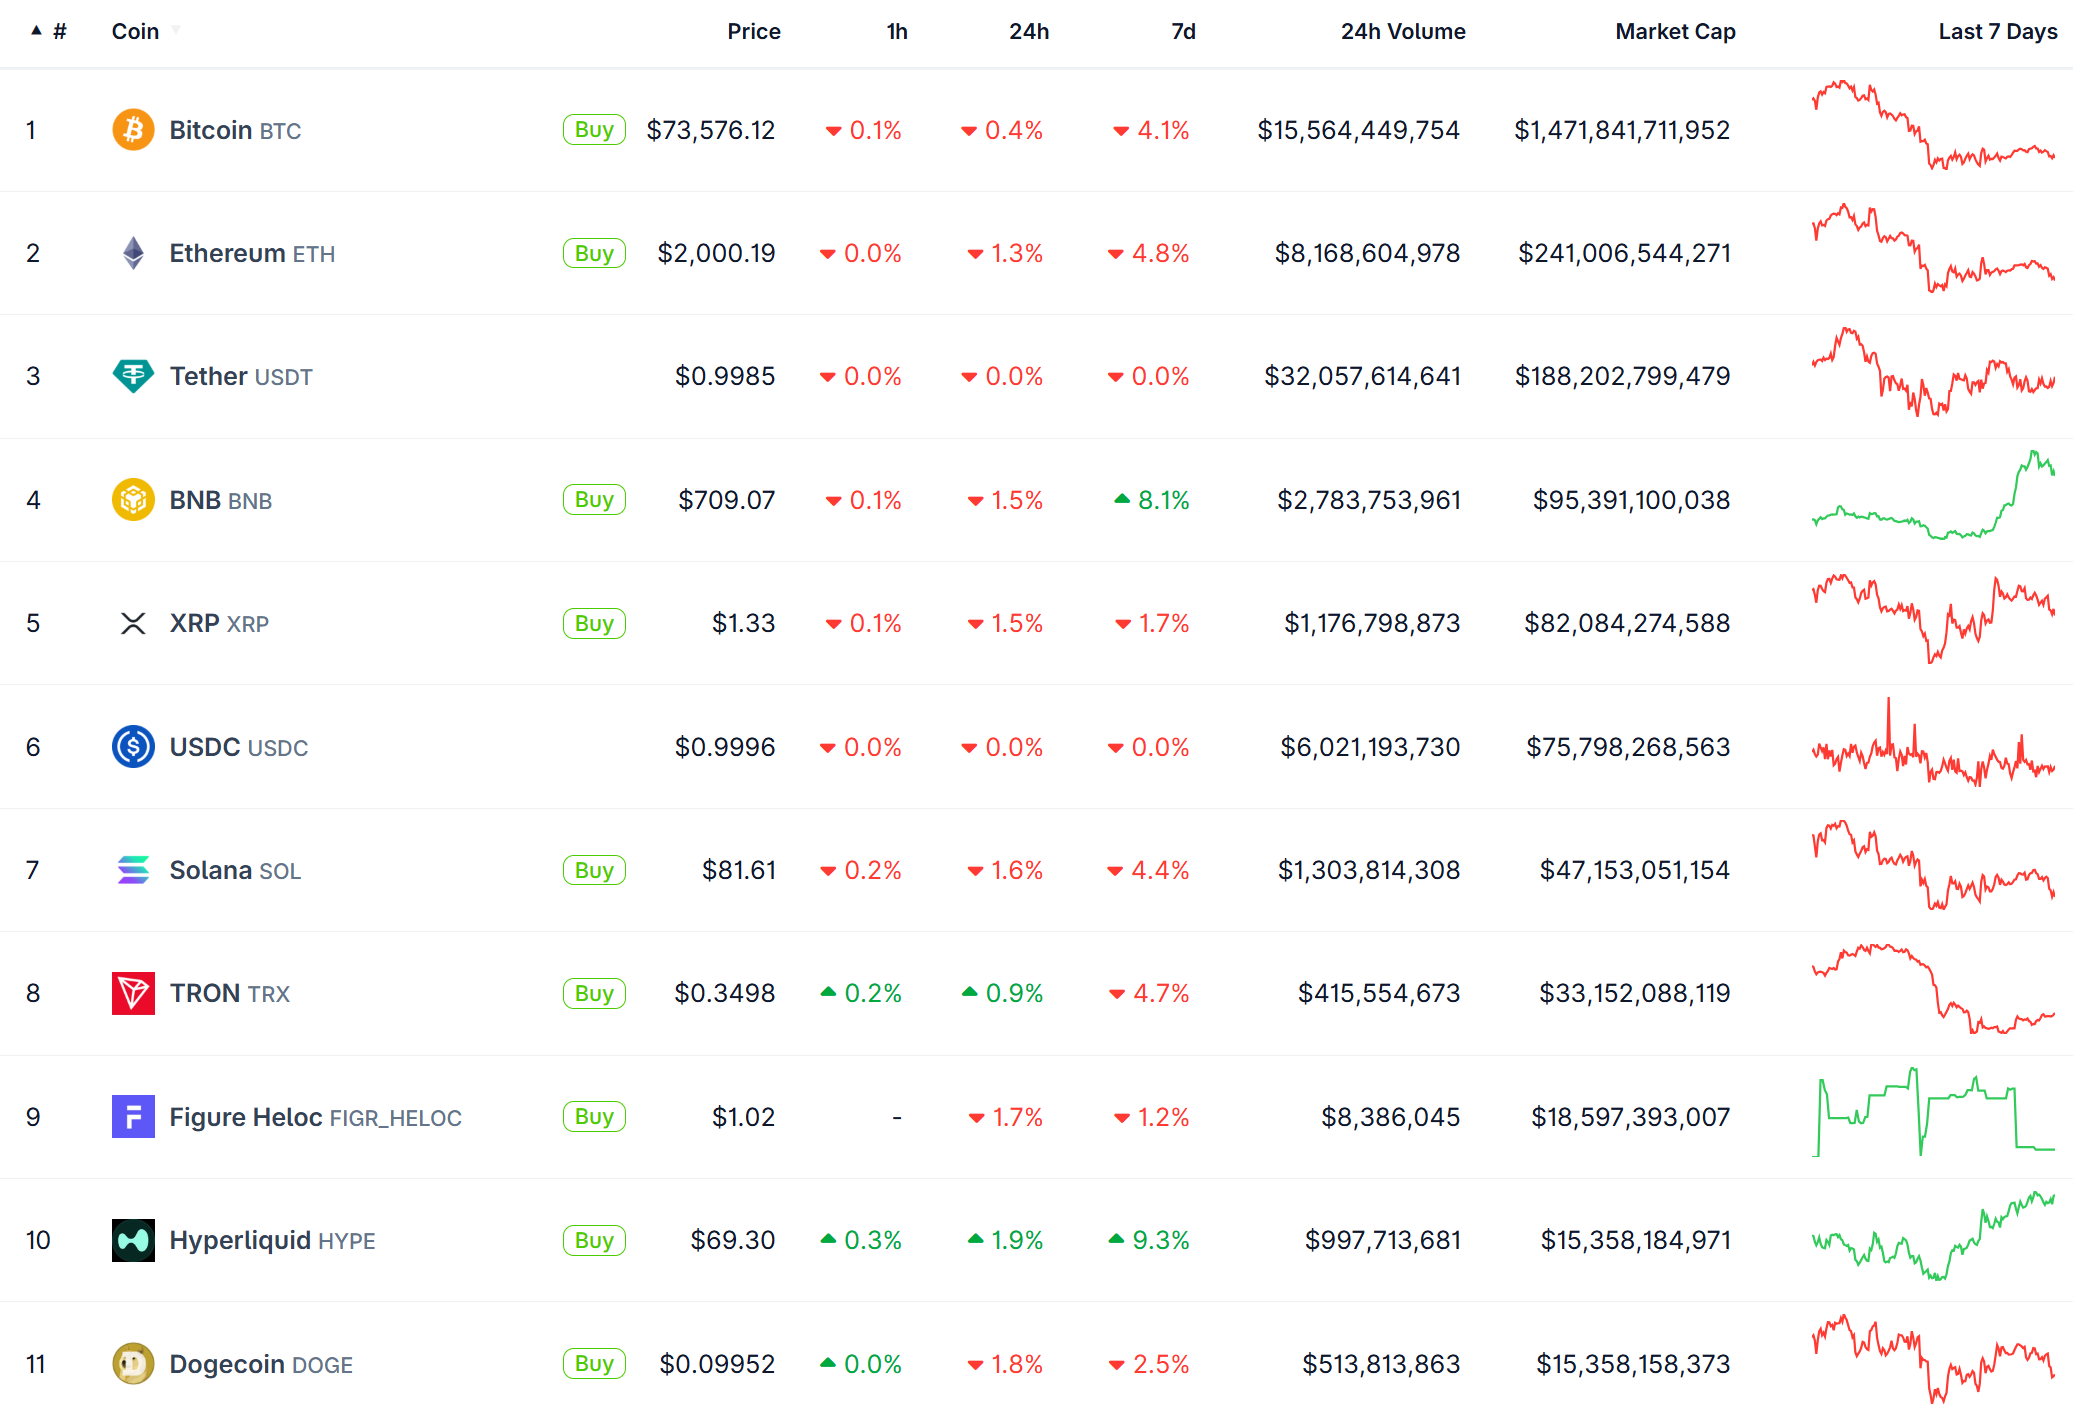
Hyperliquid’s HYPE token has officially surpassed Dogecoin in market capitalization, securing a top-10 spot and marking a major victory for utility-driven assets over meme coins.
As of late May 2026, HYPE trades around $69, with a market cap hovering near $15.4 billion to $17 billion depending on intraday moves, briefly pushing it as high as #9. Dogecoin sits just behind at #11 with a nearly identical valuation.

HYPE Flips DOGE: Hyperliquid Enters Top 10 Crypto by Market Cap
Hyperliquid operates a high-performance Layer-1 blockchain optimized for decentralized perpetual futures and spot trading.
It delivers sub-second finality, an on-chain central limit order book, and gasless trading, rivaling centralized exchange speed while remaining fully decentralized.
The platform has processed trillions in cumulative volume and generated over $1.16 billion in revenue since launch.
Nearly all trading fees flow into an Assistance Fund for continuous HYPE buybacks and burns, creating powerful token value accrual.
Recent catalysts include CFTC approval for regulated U.S. perps, inflows into spot ETFs like Bitwise’s BHYP, and strong user growth exceeding 2 million addresses.
Unlike pure meme coins driven by sentiment, HYPE benefits from real usage metrics: daily volumes often exceeding $1 billion, high open interest, and a deflationary mechanism tied directly to platform success.
Experts note this shift highlights 2026’s preference for tokens with clear revenue streams and on-chain utility. HYPE’s 7-day performance shows strong green momentum, contrasting DOGE’s relative stagnation.
With HyperEVM expanding the ecosystem for broader DeFi applications and ongoing buyback programs, analysts watch for sustained momentum.
Key milestones ahead include further ETF developments, potential governance proposals, and continued competition in the derivatives sector.
This milestone reflects a maturing crypto market where product-market fit and cash flow increasingly determine rankings.
Follow us on X to get the latest news as it happens
The post HYPE Flips DOGE: Hyperliquid Cracks Top 10 Crypto As Price Nears $70 appeared first on BeInCrypto.
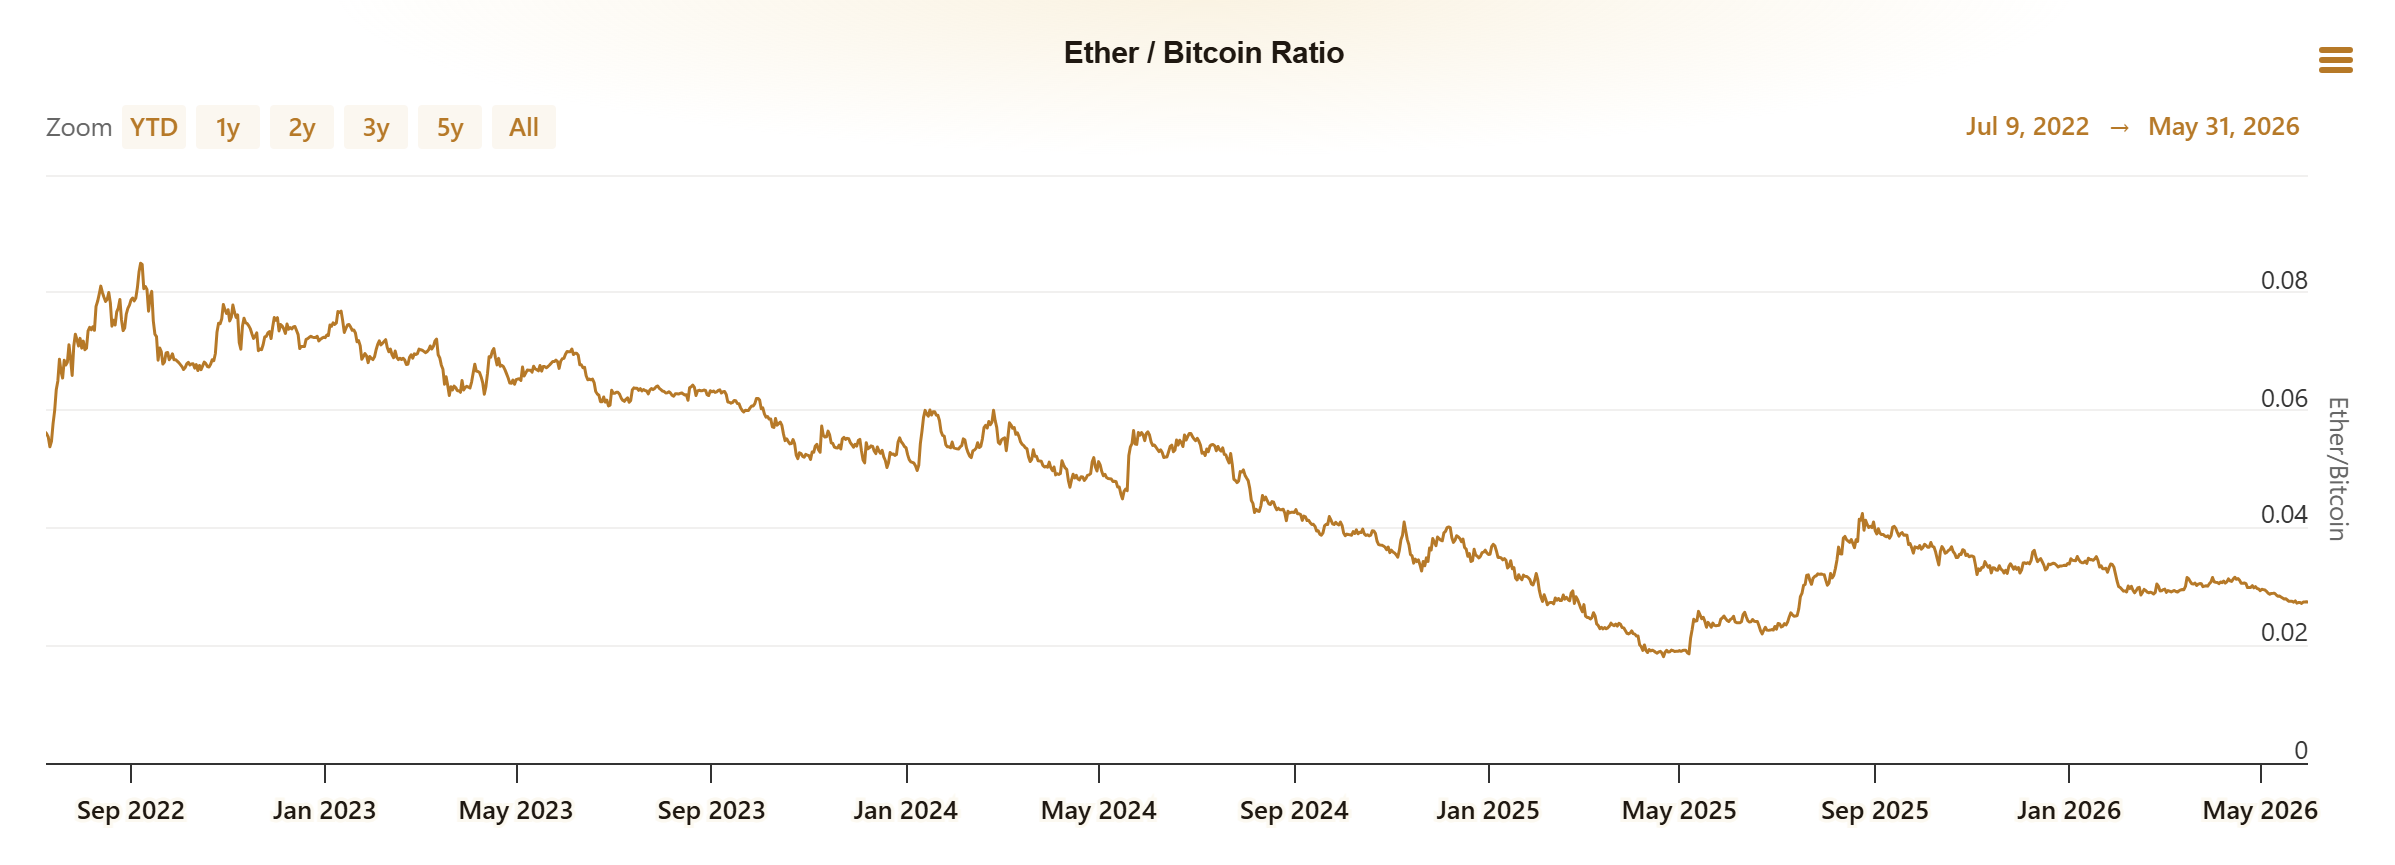
A pointed critique from inside Ethereum’s developer ranks argues that ether’s 65% slide against Bitcoin (BTC) since the Merge stems from specific execution failures at the Ethereum Foundation, not from broad market cycles or coordination problems.
Reid, an ICO-era participant who still builds on Ethereum (ETH), published the indictment, framing the underperformance as accumulated execution debt with names, dates, and missed product calls.
A 65% Drop With Names Attached
Reid’s central data point lines up with public market data. The ETH/BTC ratio peaked near 0.085 around the Merge in September 2022.
It has fallen to roughly 0.028 by late May, capturing ether’s underperformance against Bitcoin. Ether currently trades below $2,000, down 21% over the past year.

Reid rejects Bankless co-founder David Hoffman’s framing of ether’s “deserved cap” as a noble ceiling. He argues the cap sits lower than bulls expected, for reasons with names and dates rather than coordination theory.
Reid covers credit and real-world assets at firms including Figure and Securitize, and discloses he is still long ether.
ESG Marketing and a Missing Staking Interface
Reid argues the Merge’s 99.95% energy-reduction message answered questions capital allocators never asked.
Institutions wanted yield, developers wanted finality, and users wanted cheaper transactions. Solana sold raw speed during the same window.
Proof-of-stake sat on the roadmap from 2015 and took seven years to ship. Solana launched mainnet beta in March 2020 and shipped wallets, decentralized exchanges, and money markets while Ethereum debated specs.
Vitalik Buterin’s writing through 2024 and 2025 shifted from Casper specs toward pluralism and network states.
Reid reads that tone as an established Ethereum cultural posture rather than an active competitive one.
The smoking gun, in Reid’s read, is the absence of a first-party staking app three years after the Merge.
The official path still requires running a validator with at least 32 ETH. Most users route through Lido, which holds about 24% of staked ETH despite repeated centralization warnings from developers.
“‘We don’t pick winners’ is what an organization says when it does not want to compete,” Reid remarked.
Follow us on X to get the latest news as it happens
Rollups as Managed Decline
The rollup-centric roadmap drained the base layer. EIP-4844 went live in March 2024 and pushed blob fees near 1 wei through most of 2024 and 2025.
Ethereum’s quarterly transaction fee revenue has fallen roughly 95% from a Q4 2021 peak of $4.3 billion.

Arbitrum has marketed 90% to 98% operating margins on its L2s. Base captured close to 70% of rollup profits by mid-2025.
Every major L2 issued its own token, fragmenting capital flows inside the ecosystem.
Reid contrasts this with Solana’s integrated L1, which has shown fee capture accruing directly to its native token.
The remaining question is whether Foundation product cadence shifts. The ETH/BTC ratio’s path through the rest of the cycle will reflect the answer.
The post Insider Reveals Real Reason Ethereum Is Down 65% vs Bitcoin Since The Merge appeared first on BeInCrypto.
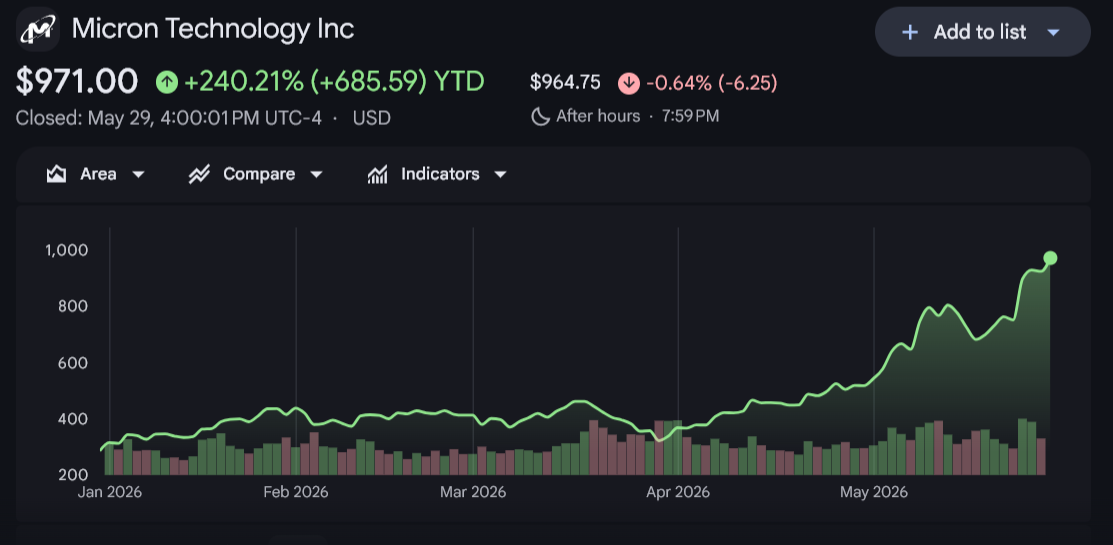
Micron Technology surged to a record high on May 26, jumping nearly 23% intraday before closing up more than 19% at $895.88. The rally briefly pushed the company’s market capitalization above $1 trillion, marking a milestone that places Micron among the largest technology firms globally.
In overnight trading, shares extended gains toward $920 as momentum continued.
The explosive move was fueled by two major catalysts: accelerating AI memory demand and an aggressive price target upgrade from UBS. With MU now trading at historically elevated levels, the key question for investors is whether the rally represents the early stages of a structural re-rating or a short-term momentum surge.

AI Memory Boom Reshapes Micron’s Outlook
Micron’s rally reflects the broader expansion of artificial intelligence infrastructure, which continues to reshape the semiconductor sector.
AI model training and inference require enormous volumes of high-performance memory, particularly advanced DRAM and high-bandwidth memory solutions.
Supply constraints across the industry have tightened pricing power for leading memory producers. Micron sits at the center of this cycle as one of the few global players capable of delivering advanced memory at scale.
The company recently began full-scale operations at its new $2 billion manufacturing facility in Manassas, Virginia, producing 1-alpha DRAM. The site strengthens domestic US memory production and supports critical sectors such as aerospace, defense, automotive, industrial systems, and healthcare.
Management has framed this expansion as part of a broader $200 billion long-term investment strategy to reinforce domestic semiconductor manufacturing capacity.
Chairman and CEO Sanjay Mehrotra described the facility as a strategic milestone in securing advanced memory production within the United States while supporting long-lifecycle enterprise customers.
UBS Price Target Adds Fuel to the Rally
Investor enthusiasm intensified after UBS raised its price target on Micron to $1,625 from $535, representing one of the most aggressive analyst revisions in the semiconductor space this year.
The new target implies roughly 80% upside from recent levels. UBS analyst Timothy Arcuri expects AI-driven memory shortages to persist through at least the second quarter of 2028. Prolonged supply tightness would strengthen Micron’s pricing power and potentially stabilize historically volatile earnings cycles.
UBS also projects Micron could generate more than $100 per share in annual profits between 2027 and 2029 if current industry conditions persist. That outlook significantly reshapes long-term valuation assumptions.
The upgrade triggered broader gains across semiconductor stocks and reinforced the narrative that memory producers are becoming primary beneficiaries of AI infrastructure spending, alongside GPU manufacturers.
Financial Performance Reflects AI Cycle Acceleration
Micron’s recent financial results already reflect this structural shift. In the quarter ended February 26, revenue reached $24 billion, nearly tripling year over year. Adjusted net income surged almost eightfold to $14 billion, driven by improved pricing and AI-related demand strength.
Stock performance has mirrored that momentum. Shares are up more than 200% year to date and have gained over 800% in the past 12 months, dramatically outperforming the broader S&P 500.
Such rapid appreciation, however, raises questions about sustainability. Markets now price in continued supply shortages, stable margins, and durable AI demand. Any moderation in those assumptions could introduce volatility.
Technical Outlook: Elevated but Supported
After its sharp breakout, MU is entering a potential consolidation phase. Parabolic moves often lead to short-term cooling before continuation. If the stock holds above recent breakout levels near $870–$890, the broader bullish structure remains intact.
However, extended rallies can produce profit-taking as momentum indicators approach overbought territory. Traders will monitor whether volume remains elevated during pullbacks, as strong volume support would reinforce institutional participation.
The broader semiconductor ETF strength suggests sector-wide momentum remains supportive, reducing the probability of isolated weakness.
The post Micron Stock Forecast: Can MU Sustain Its AI-Driven Breakout After Record High? appeared first on BeInCrypto.

Strategy chairman Michael Saylor on Sunday signaled the Bitcoin treasury company would be announcing fresh purchases of the cryptocurrency in the coming days.
The social media post comes just days ahead of a proxy vote that depends in large part on retailer shareholders to enable semi-monthly dividend payouts on the company’s STRC perpetual preferred stock.
“Working Better” was Saylor’s tweet late Sunday morning to accompany a bubble chart tracking Strategy’s Bitcoin (BTC) purchases over the past nearly six years. That chart, from Iceland-registered StrategyTracker.com, has been consistently posted by Saylor in the days ahead of news of a purchase by the biggest publicly traded Bitcoin holder.
To be sure, any purchases to be announced will likely reflect the company bought at or below the average cost of previous BTC purchases. While, the average cost of Strategy’s 843,738 Bitcoin is $75,701 apiece, the biggest cryptocurrency by market cap has lost 3.65% of its value during May and was trading at about $73,566 at the time of publication, according to CoinMarketCap data.
“Working Better” tweet. Source: Michael Saylor
Blockstream CEO Adam Back highlighted on Sunday that BTC’s 200-week moving average has pushed far above the $61,000 mark. That moving average is seen by some technical investors as a signal of a long-term upward price trend.
Related: Strategy situation ‘out of hand,’ says Arca exec on $15B preferred stock burden
Retail investors get pressed to vote on STRC dividend change
Strategy is proposing to pay semi-monthly dividends on STRC, instead of monthly. The company claims that if approved and adopted, it will lead to reduced reinvestment lag, enhanced liquidity, market efficiency and increased price stability.
Just days ahead of the June 7 proxy vote deadline, Saylor and Strategy are making a full press to get retail shareholders to return their proxy votes. On an internal company channel, Strategy’s investor relations team posted a message to all employees concerning the company’s 2026 annual meeting and provided links to the proposals under consideration by shareholders.

Part of message to Strategy employees from internal website. Source: Company filing on Edgar
“The amendment for STRC to pay semi-monthly dividends, needs 50% of all 85M shares outstanding as of April 17, 2026, to pass, which means every single vote counts,” read a May 28 post on Strategy’s verified feed on X.com.
CEO Phong Le posted a video a day earlier thanking STRC shareholders for their trust. “I wanted to personally walk you through the proposed amendment and what it means for you,” he said as an introduction to the minute-and-a-half video.
Retail investors have shown limited interest in casting proxy votes. A November research note from The Harvard Law School Forum on Corporate Governance revealed data that showed retail investors have consistently voted only about 29% of their owned shares during the past five proxy voting seasons. Institutional holders have voted about 77%.
Magazine: Guide to the top and emerging global crypto hubs — Mid-2026
Google’s Debug initiative has asked the US Environmental Protection Agency to approve the release of up to 32 million Wolbachia-treated male mosquitoes in Florida over two years.
The proposal sits under EPA docket EPA-HQ-OPP-2025-3951. The public comment period closes on June 5, after which the agency will decide whether to approve, deny, or place conditions on the test.
The application is part of a wider experimental-use request from Google LLC. It also includes a similar release plan for California.
In Florida, Google proposes releasing up to 16 million male mosquitoes in the first year and another 16 million in the second year. California would see the same maximum release volume under the same application.

What Google’s EPA Filing Covers
The EPA notice identifies the mosquitoes as male Culex quinquefasciatus carrying Wolbachia pipientis wAlbB.
Culex quinquefasciatus, often called the southern house mosquito, is linked to the spread of mosquito-borne diseases, including West Nile virus.
The Florida test would help Google collect field data for a possible future product registration under federal pesticide law.
The word “pesticide” can sound confusing here. In this case, the EPA is reviewing Wolbachia as a biological control method because it is being used to suppress a pest population.
That makes the proposal a regulated field test, even though it does not involve conventional chemical spraying.
How Debug’s Wolbachia Technology Works
Debug uses male mosquitoes carrying Wolbachia, a bacterium found naturally in many insect species.
When these treated males mate with wild females that do not carry the same Wolbachia strain, the resulting eggs do not hatch. Repeated releases can gradually reduce the local mosquito population.
Only male mosquitoes are released. That matters because male mosquitoes do not bite or spread disease.
The difficult part is sorting males from females on an industrial scale. Debug uses artificial intelligence and automation to separate mosquitoes by sex, rear them in large numbers, and release them across target areas.
This is where Google’s role becomes important. The project depends on software, robotics, AI-based sorting, and field logistics, not just mosquito biology.
The Idea Has a Real-World Example in Singapore
Debug’s strongest real-world reference point is Singapore.
Since 2018, Debug has worked with Singapore’s National Environment Agency on Project Wolbachia. The program uses Wolbachia-carrying male mosquitoes to suppress Aedes aegypti, the main dengue vector in Singapore.
Singapore’s results have been significant. Official program data show 80% to 90% suppression of Aedes aegypti populations in treated areas and more than 70% lower dengue risk among residents after sustained releases.
Debug has also expanded its Singapore site into its first international research and development hub. The facility now supports AI-based sex sorting, robotics, and large-scale mosquito production.
The company says more than 10 million male Wolbachia mosquitoes are now released weekly in Singapore.
AI is Moving into Public Health Field Work
The Florida application also shows how AI is moving beyond software products and into biological field operations.
Debug’s system uses AI to solve a practical bottleneck: sorting mosquitoes accurately and quickly enough for mass release. Without that, Wolbachia programs cannot scale safely.
Automation also helps with consistency. Large mosquito-control programs need predictable production, reliable sex separation, and repeatable release patterns across neighborhoods.
That makes this proposal part of a wider trend. AI is increasingly being used to manage physical-world systems, from agriculture to public health.
What Happens Next
The EPA will review public comments after the June 5 deadline.
If the agency approves the permit, Google could begin a two-year field test in Florida and California under federal conditions. If the EPA denies the request, the company would need to revise or abandon the proposed trial.
A positive decision would give Debug its first large-scale US regulatory pathway for this type of mosquito-control deployment.
It could also shape how future biological interventions are reviewed in the US, especially as mosquito-borne disease risks rise and cities look for alternatives to chemical control.
For now, the decision rests with the EPA.
The post Why Google Wants to Release 32 Million Mosquitoes in Florida appeared first on BeInCrypto.

Tragedy on Rossall beach in Thornton Cleveleys

Oil prices rise more than 2% as Israel moves further into Lebanon

Jubilant PSG fans celebrate Champions League victory by the Eiffel Tower


-

 NewsBeat4 days ago
Israel says it has killed new Hamas military leader in Gaza City airstrikes
-

 Tech5 days ago
NASA taps Blue Origin to deliver lunar rovers for Moon Base initiative
-

 Politics6 days ago
Bridgerton Season 5: Cast, Release Date And Everything We Know So Far
-

 News Videos5 days ago
XRP *JUST* SUCCEEDED!!!! CLARITY ACT EXPOSED!!! (SHE EXPOSED IT)
-

 Sports6 days ago
2026 NBA Finals schedule, odds: Knicks await Thunder or Spurs after winning East
-
 Crypto World5 days ago
Micron Crosses $1 Trillion Market Cap as AI Demand Reshapes Memory Sector
-

 Business5 days ago
Selena Gomez Reportedly Upset Over Benny Blanco’s Comments on Her ‘Terrible’ Diet
-

 News Videos2 days ago
This is BROKEN! INSANE 5x MONEY CAR WASH WEEK! The NEW GTA Online UPDATE Today! (GTA5 New Update)
-

 Business7 days ago
BTS Sells Out Four Las Vegas Shows at Allegiant Stadium for ARIRANG World Tour
-
 NewsBeat6 days ago
Hottest May day ever as London hits 34.8C in 2C leap from previous records
-
 Tech6 days ago
China assigns ID codes to 28,000+ humanoid robots
-

 Tech6 days ago
Microsoft’s quiet Claude Code retreat and the real cost of enterprise AI
-

 Tech3 days ago
Waymo dominates autonomous vehicle registrations as Tesla trails behind
-

 Business6 days ago
Nikkei 225 Surges Past 65,000 for First Time as Iran Peace Hopes Fuel Record Rally
-
Tech4 days ago
The Samsung pay deal is the moment Korean unions changed register
-

 NewsBeat6 days ago
Crowds find riverside shade in York as temperatures soar
-

 Tech6 days ago
Westone Audio and Etymotic Acquired by Fidelity Collective in Major IEM Market Move
-
 Entertainment6 days ago
‘Breaking Bad’ Star’s Easy-to-Binge 6-Part Crime Series Spin-Off Is Finally Heading to Free Streaming
-

 Tech5 days ago
Millions of AI agents imperiled by critical vulnerability in open source package
-
Crypto World4 days ago
SpaceX’s $2 Trillion IPO: Why Tech Giants Nvidia (NVDA), Apple (AAPL), and Microsoft (MSFT) May Face Pressure
You must be logged in to post a comment Login