
Crypto World
Another DeFi Exploit Drains 150,000 SUI From Scallop’s Deprecated Contract


Scallop, a money market on Sui Network, lost about 150,000 SUI on Sunday after an attacker drained a deprecated rewards contract tied to the protocol’s sSUI spool.
The team froze the affected contract within minutes and pledged full reimbursement from its treasury. Core operations resumed in under two hours.
Another Sui Exploit Hits Peripheral Code, Not the Core Protocol
Scallop disclosed the incident at 12:50 UTC on April 26 through a public notice on X. The attacker targeted a side contract powering rewards for the sSUI spool. That spool is the protocol’s incentive layer for SUI depositors.
The affected contract was frozen immediately, according to the team. Core lending and borrowing pools stayed untouched. User deposits remained safe across every other Scallop market.
Two hours later, Scallop confirmed the freeze had been lifted on the core contracts. Withdrawals and deposits resumed at 14:42 UTC.
Most users on the Sui network were unaffected by the morning’s events.
“Scallop will fully cover 100% of the loss,” the money market articulated.
Stale Package Code From 2023 Sat Behind the Exploit
Independent on-chain analysis points to a deprecated V2 spool package as the entry point. Scallop published the code in November 2023, more than 17 months before the attack. On Sui, deployed packages are immutable. Old versions stay callable unless explicitly version-gated.
The bug centered on an uninitialized last_index counter, which tracks accumulated rewards for stakers. The attacker staked roughly 136,000 sSUI to exploit it.
This math treated the position as if it had existed since the spool launched in August 2023.
The spool index had grown to about 1.19 billion over 20 months. That allowed the exploiter to harvest around 162 trillion reward points. Those redeemed one-to-one for 150,000 SUI from the rewards pool.
The transaction hash 6WNDjCX3W852hipq6yrHhpUaSFHSPWfTxuLKaQkgNfVL captures the on-chain proof of the drain.
A Familiar Pattern Across Sui DeFi
The incident follows a string of Sui exploits in recent weeks. Volo Protocol lost roughly $3.5 million earlier this month in a similar peripheral incident. Each case targeted side contracts rather than core protocol logic.
It also lands one week after a major bridge incident on Ethereum, which produced roughly $292 million in unbacked liquid restaking tokens. Both attacks happened over weekends, when liquidity is thin and response times can lag.
Neither the Sui Foundation nor Mysten Labs has made a public statement on the matter.
For Scallop, however, the financial damage looks contained. The protocol confirmed it will absorb the entire loss without diluting user yields.
The team has not released a full post-mortem yet, with a prospective publishing of a complete audit of every remaining legacy package likely to shape the broader Sui DeFi response.
The deeper question is how Sui builders should manage immutable code and forgotten attack surfaces.
The post Another DeFi Exploit Drains 150,000 SUI From Scallop’s Deprecated Contract appeared first on BeInCrypto.


TLDR:
-
- Polymarket will go offline for roughly one hour on April 28 at 11 a.m. UTC for exchange upgrades.
- The new pUSD stablecoin is backed 1:1 by USDC and will replace direct USDC use across the platform.
- All open limit orders on the v1 orderbook will be cancelled at cutover, requiring users to re-place them.
- API developers must update to the latest Polymarket SDK before cutover, as v1 clients will stop working.
- Polymarket will go offline for roughly one hour on April 28 at 11 a.m. UTC for exchange upgrades.
Polymarket is set to roll out a sweeping infrastructure upgrade on April 28, introducing its native stablecoin pUSD and a revamped order-matching engine.
The exchange will go offline for roughly one hour starting at 11 a.m. UTC. All open limit orders placed on the v1 orderbook will be cancelled at cutover.
User funds and existing positions, however, will remain fully intact throughout the transition period.
pUSD Launch Marks a New Chapter for Polymarket
On April 27, Polymarket Developers posted on X that exchange upgrades go live on April 28 at 11 a.m. UTC. The announcement confirmed roughly one hour of downtime, with the v1 orderbook cleared and all open limit orders cancelled. Funds and existing positions were noted as safe throughout the process.
Polymarket’s new stablecoin, pUSD, will be backed 1:1 by USDC, keeping it pegged at par with the dollar. The token is designed to serve as the native settlement currency across the platform going forward. Users holding USDC balances will need to approve a conversion to pUSD before the upgrade completes.
The shift to a native stablecoin is part of a broader effort to tighten Polymarket’s internal liquidity framework. By anchoring pUSD to USDC reserves, the platform aims to reduce friction in fund flows between markets. This structure also gives the team more control over how capital moves within the exchange.
CLOB V2 Brings a Rebuilt Orderbook and Matching Engine
The CLOB V2 upgrade replaces the existing central limit orderbook with an entirely new architecture. The v1 orderbook will be cleared at cutover, and all open limit orders will be cancelled at that point. Market participants will need to re-enter their positions after the system comes back online.
The new matching engine is built to handle higher throughput and more efficient order processing. Accordingly, API users must update to the latest Polymarket SDK before April 28 at 11 a.m. UTC. V1 API clients will stop functioning entirely once the cutover takes effect.
Developers integrating with Polymarket should treat this deadline seriously. Any system still running v1 client code after the transition will lose connectivity to the exchange. The team has urged all API-dependent participants to test updated SDK versions ahead of the scheduled maintenance window.


The best crypto presale to watch just got a new signal from Wall Street. Grayscale just filed to convert its Zcash Trust into a spot ETF, the first attempt to bring a privacy coin into regulated investment products. Robinhood listed ZEC the same week, opening access to millions of retail traders according to CoinMarketCap.
That institutional attention confirms the long-term case, but if you are looking for the best crypto presale to watch right now, the question is whether better returns exist before the broader market arrives.
Grayscale registered the application to convert its Zcash Trust into a spot ETF, the first such filing for a privacy cryptocurrency, according to CoinMarketCap.
Robinhood added ZEC the same week, driving a 6.92% price gain in 24 hours. The SEC had closed its investigation into the Zcash Foundation earlier this year without enforcement action, removing a regulatory cloud over institutional participation.
These institutions are racing to package privacy exposure for mainstream portfolios, and the best crypto presale to watch captures the coming wave before listing day opens the door.
Best Crypto Presale to Watch Alongside Monero and Zcash
Pepeto
While Grayscale builds the institutional case for privacy coins, Pepeto, considered the best crypto presale, is building something more useful for the retail trader: a fee-free swap tool that transfers tokens across chains at zero cost, a contract screening system that identifies risk before entry, and a network bridge that keeps capital moving freely between blockchains.
Every product already processes live data, and the screening system breaks down trade risk in plain language so any wallet can evaluate a position before putting capital forward. The presale sits at $0.0000001866 with above $9.45 million raised, and the entry window is tightening as the approaching Binance debut draws closer.

Staking at 178% APY on a $25,000 position returns $44,500 in a year, meaning presale holders grow their stack while the listing date approaches. The Binance debut brings Pepeto onto the public market, and each exchange addition after that pulls a fresh wave of buyers into a fixed 420 trillion token supply.
The creator of the original Pepe token cofounded this project, a senior executive with Binance experience designed the listing roadmap, and SolidProof verified the entire codebase before the presale opened. The wallets committing now are getting in ahead of an event the wider market has not priced in, and the current entry disappears the moment the listing sets a new price floor.
Monero (XMR) Price at $375 as Privacy Demand Rises but Exchange Access Shrinks
Monero (XMR) trades at $375 according to CoinMarketCap after holding steady through mixed altcoin activity. Over 73 exchanges delisted XMR through 2025, but the privacy coin holds a $6.9 billion market cap, sitting 53.4% below its all-time high of $798.91 from January 2026.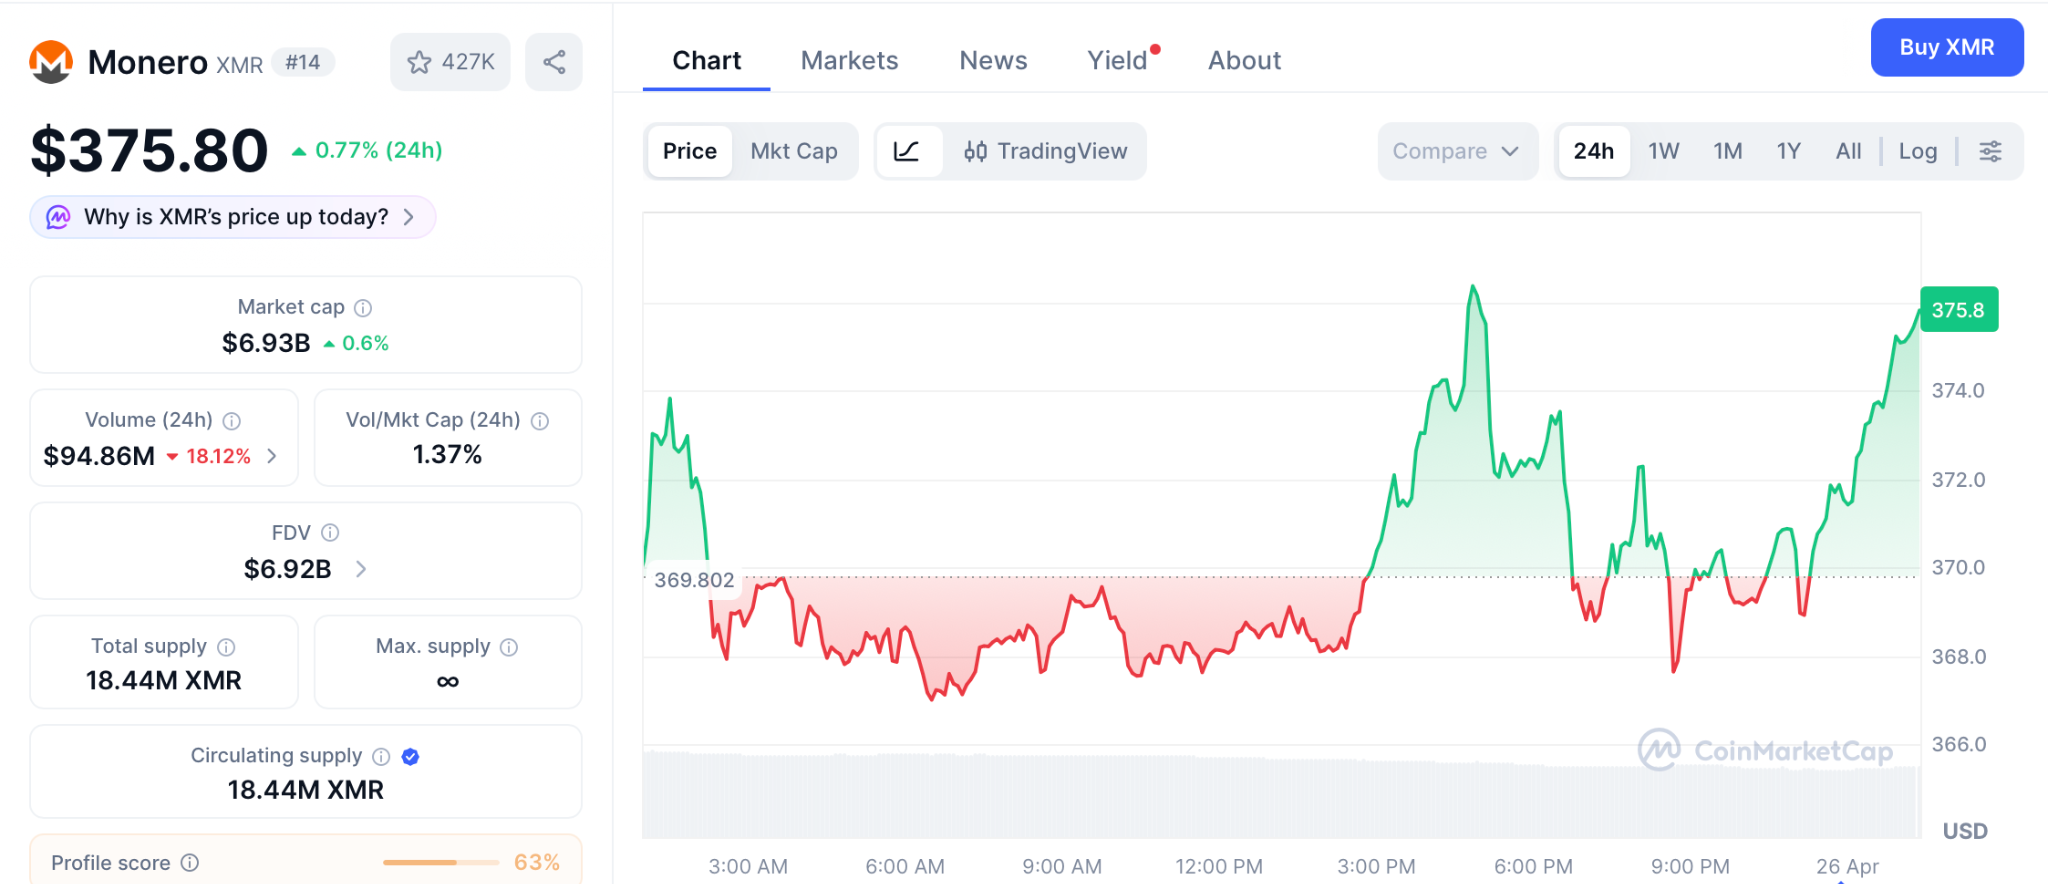
But the math from $375 to the near-term target of $500 delivers about 34% upside. That is decent for a coin facing shrinking liquidity, but it shows why presale tokens sit in the same conversation, because Monero’s ceiling is set by exchange access limits.
Zcash (ZEC) Price at $359.84 as Grayscale ETF Filing and Robinhood Listing Build Momentum
Zcash (ZEC) trades at $359.84 after gaining 6.92% in 24 hours on the Grayscale ETF filing and Robinhood listing. ZEC sits 51.9% below its all-time high of $748 from November 2025, and the move to $500 resistance is roughly 1.4x.
Zcash is the privacy coin most likely to survive in regulated markets, but it cannot match what a sub-penny presale with an approaching exchange debut delivers before the public market gets access.
Conclusion:
Grayscale filing its first privacy coin ETF while Robinhood opens retail ZEC access proves that institutional money is now reaching asset classes that sat behind regulatory walls just months ago, and the opening to secure the entry that delivers when that capital wave hits is live right now, because Pepeto has an active presale with growing demand and three exchange products heading toward the public market.
FLOKI went from a community relaunch priced in fractions of a cent to a $0.0003462 peak, and the wallets that joined after launch day spent multiples more for the exact same token.
Pepeto remains at presale pricing but the raise is accelerating fast enough that the window could close at any point. Knowing about Pepeto today and choosing to stay on the sideline gets harder with every exchange gate that opens after this entry disappears.
Click To Visit Pepeto Website To Enter The Presale

FAQs
What is the best crypto presale to watch in April 2026?
Pepeto stands out with an approaching Binance listing, above $9.45 million raised, three working exchange tools, and a SolidProof audit that give it a stronger launch profile than most presales in 2026.
Why is Pepeto a stronger near-term position than Monero (XMR) or Zcash (ZEC)?
Monero (XMR) and Zcash (ZEC) offer returns under 2x from current prices to near-term targets, while Pepeto gives presale pricing with an approaching listing creating a compressed return window that large cap privacy coins cannot match.
Disclaimer: This is a Press Release provided by a third party who is responsible for the content. Please conduct your own research before taking any action based on the content.
TLDR:
- Schiff warns the Strategy Bitcoin model may rely on constant inflows to sustain its 11.5% dividend payouts.
- STRC has financed over 50,000 BTC, with dividend rates rising steadily since its launch in July 2025.
- Concerns focus on whether dividends depend on new buyers or potential Bitcoin sales for funding.
- Market sentiment remains stable, with analysts maintaining confidence despite ongoing structural questions.
Economist Peter Schiff has raised fresh concerns about Strategy’s Bitcoin-focused financing model. He argues the firm’s rising preferred dividend could strain its structure.
The debate centers on funding sustainability, investor demand, and the company’s growing Bitcoin exposure.
Dividend pressure raises questions on Strategy Bitcoin model
Peter Schiff has warned that the Strategy Bitcoin model may face structural pressure. He pointed to the firm’s rising dividend tied to STRC preferred stock. His concern focuses on how the company sustains these payouts over time.
A post shared by BSCN on X captured Schiff’s warning about the Strategy Bitcoin model. The tweet stated that the structure could enter a “death spiral” if funding weakens. It also noted the dividend has climbed to 11.5% after steady increases.
He stated that the dividend may not remain sustainable without ongoing capital inflows. According to his view, Strategy may need to sell Bitcoin or attract new buyers continuously. That reliance creates pressure on both $MSTR shares and Bitcoin holdings.
The Strategy Bitcoin model has financed about 50,792 BTC since July 2025. During that period, the dividend rate climbed from 9% to 11.5% across seven monthly increases. Schiff described the setup as dependent on constant demand for STRC shares.
He also labeled the structure in harsh terms, calling it an obvious Ponzi-like arrangement. His remarks focused on the risk tied to funding dividends through new capital. As a result, the Strategy Bitcoin model has come under closer scrutiny in recent discussions.
At the same time, Schiff’s critique centers on long-term cash flow sustainability. He argues that dividends should rely on operating income rather than asset sales. That concern remains central to his warning about the Strategy Bitcoin model.
Market response remains steady despite ongoing debate
Despite the criticism, Strategy’s leadership has pushed back against the claims. Michael Saylor’s camp has defended the firm’s approach to Bitcoin accumulation. They maintain that the Strategy Bitcoin model remains aligned with long-term growth.
Meanwhile, TD Cowen has reiterated its buy rating on $MSTR shares. The firm also kept its price target at $385. This stance reflects continued confidence from parts of the market despite Schiff’s warnings.
For now, investor sentiment appears stable around the Strategy Bitcoin model. Market participants have not shown strong reactions to the recent critique. Instead, attention remains on how the company manages funding and dividend commitments.
The discussion continues to center on sustainability rather than short-term performance. Observers are watching whether the Strategy Bitcoin model can support rising dividend obligations. The ability to generate consistent cash flow remains a key factor.
At present, the market response suggests cautious confidence rather than concern. However, the underlying question about funding structure still stands. Future updates from the company may provide more clarity on how it plans to maintain balance.
TLDR:
- Ethereum’s Taker Buy Sell Ratio has reached its highest level since late January 2023 on all exchanges.
- ETH prices dropped from $4,700 in October to $2,300, while aggressive buyer pressure rose sharply.
- Buy orders are outpacing sell orders, showing that demand is absorbing available supply at $2,300.
- Consistent data across Binance and all exchanges strengthens the bullish divergence signal for ETH.
Ethereum’s bullish divergence has emerged as a closely tracked signal in cryptocurrency markets. ETH prices have declined from roughly $4,700 in October to approximately $2,300 as of writing.
The Taker Buy Sell Ratio on Binance and across all major exchanges has risen sharply during this time. This contrast between a declining price and growing buy pressure points to strong demand building at current levels.
Aggressive Buyers Step In as Ethereum Trades Around $2,300
The 30-day simple moving average of the Taker Buy Sell Ratio has reached its highest reading since late January 2023. This pattern is consistent across both Binance and all major exchange data combined.
The ratio crossing above 1.0 shows that buy orders are currently outpacing sell orders in the market. At this level, demand is proving stronger than supply among active Ethereum traders.
Crypto analyst CryptoOnchain flagged this development on social media approximately seven hours ago. The post noted that aggressive traders, referred to as takers, view the $2,300 level as a key accumulation zone.
This type of buying at lower price points often reflects a degree of confidence from larger market participants. It also shows that experienced buyers are actively entering positions at these price levels.
When buy orders consistently outpace sell orders, available supply gets absorbed by demand over time. This process tends to reduce overall selling pressure as it continues. Consequently, the $2,300 range appears to be functioning as an active demand zone for Ethereum.
Taker Buy Sell Ratio Data Suggests Possible Seller Exhaustion in ETH
The Taker Buy Sell Ratio reaching multi-year highs during a price decline is a pattern worth examining. Historically, such readings have appeared near the later stages of downtrends in crypto markets.
This type of pattern has often preceded a shift in overall market momentum in past cycles. Still, historical data alone cannot confirm future price direction with any certainty.
CryptoOnchain’s post described what analysts call seller exhaustion in the Ethereum market. This condition occurs when sellers lose momentum and buy orders begin to dominate overall order flow.
A ratio rising to these levels during a bearish period adds important context to current conditions. It suggests that the selling pressure driving ETH lower may be gradually running its course.
Both Binance and all-exchange data align on this reading, adding consistency to the signal. When two separate data sources produce the same pattern, the likelihood of a false signal drops considerably.
As a result, market participants continue to monitor the Taker Buy Sell Ratio closely. Ethereum holds near the $2,300 level as this order flow data draws attention from active traders.
TLDR:
- Trump memecoin fell 14% after a shooting near the White House Correspondents’ Dinner raised market concerns.
- The suspect carried multiple weapons and was detained after breaching the secured screening area at the venue.
- $TRUMP traded near $2.63 with high volume, extending its decline from the January 2025 peak levels.
- WLFI token also declined alongside Trump memecoin, showing weakness across related politically linked crypto assets.
The TRUMP memecoin declined sharply after a security incident near a high-profile Washington event. Market activity reflected quick reactions, with price pressure following reports of a shooting near the White House Correspondents’ Dinner venue on Saturday evening.
Security incident rattles sentiment around TRUMP memecoin
The TRUMP memecoin moved lower after news broke about a shooting near the Washington Hilton. The incident occurred during the White House Correspondents’ Dinner, where senior officials were present.
A tweet from BSCN reported that a gunman approached a security checkpoint with multiple weapons. The suspect was identified as Cole Tomas Allen, aged 31, and was detained at the scene.
Authorities stated that the suspect carried a shotgun, a handgun, and knives. The situation unfolded around 8:36 p.m. near the magnetometer screening area at the venue.
Officials confirmed that President Trump, Vice President JD Vance, and cabinet members were evacuated safely. The evacuation followed standard security procedures during active threats.
One Secret Service agent was struck during the incident. Reports noted that the agent’s bulletproof vest absorbed the impact, and the agent remained in good condition.
Following these developments, the TRUMP memecoin recorded a swift decline. Market participants reacted quickly to the unfolding situation, leading to increased selling pressure.
The TRUMP memecoin traded near $2.63 by Sunday, according to available data. Daily trading volume reached approximately $597 million during the same period.
Price decline deepens amid weak support from related events
The TRUMP memecoin has now fallen about 96% from its January 2025 peak of $73.43. The recent drop adds to an extended downward trend over the past months.
At the same time, a Mar-a-Lago event targeting top memecoin holders failed to stabilize the price. The gathering did not generate enough buying activity to offset selling pressure.
Market behavior showed limited response to the gala, with traders focusing more on broader sentiment. As a result, the TRUMP memecoin continued to trade under pressure.
In parallel, World Liberty Financial’s WLFI token also declined. The token traded near $0.075, marking an 82% drop from its September high.
Both tokens showed similar movement patterns during the same period. This reflects a broader pullback across related assets following recent developments.
Liquidity remained active, as shown by the high daily trading volume for the TRUMP memecoin. However, price direction stayed weak despite steady market participation.
Short-term movements indicated continued caution among traders. The TRUMP memecoin remained sensitive to external events and news-driven activity.
The combination of the security incident and muted response from related events shaped recent trading patterns. As a result, the TRUMP memecoin continues to trade well below its earlier high
Bitcoin could bottom near $57,000 in October 2026, according to Michael Terpin, a veteran crypto investor and author. The digital asset has risen more than 29% from February’s dip around $60,000 and was trading near $78,000 as this week unfolded. Terpin’s view rests on a historical pattern: the typical one-year drawdown from a market-cycle peak, which he says occurred in October 2025 when BTC briefly topped above $126,000.
For a renewed bull market to gain traction, Terpin argues that BTC must reclaim the $100,000 level. He contends that such a move would likely materialize only if the price falls decisively below the 200-week moving average, a dynamic support commonly watched by longer-term traders. In his words, there’s “a chance of $100,000 this year, but unlikely. It would need to combine strong exchange-traded fund (ETF) buying with what Michael Saylor is already doing at Strategy, combined with an absence of liquidations from a sharp move down.”
Michael Terpin expects Bitcoin to bottom out around the $57,000 level. Source: TradingView
The current backdrop features BTC hovering near $78,000 amid a mix of macro headwinds and liquidity constraints. Oil price volatility remains a factor for risk assets, while geopolitical dynamics and a steady-rate environment in the United States have contributed to cautious crypto sentiment. The market continues to weigh the possibility of further liquidity shifts and the pace of institutional participation as the U.S. Federal Reserve holds rates steady for now.
Key takeaways
- Terpin’s cycle-based bottom forecast places BTC at roughly $57,000 in October 2026, anchored by the observed one-year drawdown from a cycle top around $126,000 in October 2025.
- A renewed bull run hinges on reclaiming $100,000, with a realistic pathway seen only if BTC can dip below the 200-week moving average and avoid forced liquidations amid ETF-driven demand and bullish strategic moves.
- The near-term price path remains uncertain. Analysts flag the potential for a retest toward the mid-to-high $70,000s or lower, with a possible slide toward the $73,000 zone in the short term.
- The market’s tone ahead of the FOMC meeting is mixed. CME data show about 99.5% of traders expect no rate cut, reinforcing caution around a sustained rally without macro-driven support.
- Analysts caution that the recent rally could be a false signal, highlighting the risk of another leg lower by October if macro conditions and market internals don’t improve.
Macro context and the near-term path
As Bitcoin oscillates around the high $70,000s, the broader macro landscape continues to shape its trajectory. Traders and analysts point to a confluence of factors: oil price volatility, geopolitical developments described as a “war in Iran” in some coverage, and persistent liquidity concerns that have kept risk assets from staging a robust breakout. In the U.S., the Federal Reserve’s decision to hold rates steady has contributed to a cautious mood, with market participants awaiting clearer signals on inflation and policy direction.
Ahead of this week’s Federal Open Market Committee (FOMC) meeting, the market’s expectations reflect a near-consensus view that policy will remain unchanged for the time being. The CME FedWatch Tool shows a near-unanimous tilt toward no rate cut in the near term, underscoring a backdrop that could limit immediate upside for crypto markets without a new wave of positive macro catalysts. “Wednesday is (Jerome) Powell’s almost certain last FOMC meeting as Fed Chair. The rate decision is almost certainly a hold flat,” commented market analyst Nic Puckrin, underscoring the ongoing regime of cautious liquidity and macrodriven risk-off sentiment.
Some observers describe the current rally as lacking the exuberance typically associated with a fresh uptrend. Crypto market analyst Matthew Hyland noted that Bitcoin’s price action since February has not generated the broad consensus among investors that usually accompanies a sustained bull run. “It does appear to me the larger expected consensus outcome for BTC is another leg lower by October,” Hyland said, signaling that a larger downside could be on the horizon despite the momentum seen in recent weeks.
Short-term risk assessments point to potential downside scenarios. If the 21-week exponential moving average (EMA) continues to act as a resistance barrier, some analysts anticipate a retracement toward roughly $65,700 before any meaningful upside, with a possible dip toward the $73,000 area in a more immediate horizon. The interplay between moving-average dynamics and macro cues remains a key supply of uncertainty for traders seeking to time a durable bottom.
What this means for investors and developers
Terpin’s cycle-based perspective emphasizes how cyclicality—rather than purely macro promises or herd sentiment—could shape BTC’s intermediate-term path. For investors, the scenario suggests a cautious stance: a potential retest of trend supports before any decisive upside, and a reminder that longer-term trend reversals often require compelling fundamental catalysts beyond a single rally leg.
From a market structure standpoint, the possibility of renewed ETF buying remains a focal point. If investor demand accelerates through regulated vehicles, and if notable holders continue to deploy capital strategically, BTC could carve a new path back toward the $100,000 mark. However, the path would likely be non-linear, with retracements and tests of major moving averages—particularly the 200-week MA—serving as critical waypoints for bulls and bears alike.
For traders, the near-term chart setup remains delicate. The risk-reward balance hinges on macro developments, liquidity conditions, and how effectively Bitcoin can hold above key support lines. The contrast between a potential short-term pullback toward the mid-$70,000s and a longer-term base around the $57,000–$60,000 region creates a wide spectrum of possible outcomes. Market watchers will be paying close attention to how the price behaves around the 21-week EMA and whether any sustained break below that threshold precedes a deeper correction.
Beyond Bitcoin itself, the discourse highlights a broader theme for the crypto market: the degree to which institutional participation, regulatory clarity, and macroeconomic signals align to drive durable uptrends. If the coming quarters bring clearer policy paths and more robust ETF inflows, the probability of re-anchoring around the $100k level could increase. Conversely, a continuation of liquidity constraints or policy surprises could extend the bear phase and push BTC toward lower support zones.
For readers tracking the narrative, the next set of data points—macro inflation readings, the Fed’s communications, ETF allocation trends, and on-chain dynamics—will be instrumental in assessing whether Terpin’s scenario plays out or if alternative pathways emerge. Notably, market commentary and price targets in recent coverage point to a potential return to downside rather than an immediate, sustained breakout, underscoring the importance of disciplined risk management in the near term. For example, prior visuals discussing BTC price action and potential near-term targets have highlighted the risks around a possible move down toward the 73,000 level and the influence of the weekly trend line on price action.
In parallel, traders and analysts continue to weigh the potential implications of a prolonged pause in rate cuts, the evolution of ETF demand, and the ongoing balance between retail and institutional participation. As always, the crypto market remains sensitive to shifting liquidity environments and macro headlines, which can abruptly alter the tactical picture for Bitcoin and the wider digital-asset space.
As the cycle framework suggests a longer horizon, investors would do well to monitor the 200-week moving average, ETF liquidity signals, and the macro policy backdrop as pivotal inputs for determining whether a new leg higher can gain traction or if a renewed downside bias resumes into late 2026.
Readers should stay tuned to subsequent market developments and the evolving regulatory and liquidity landscape, which will help clarify whether Terpin’s bottom-line forecast holds or if new catalysts emerge to reframe BTC’s trajectory.
TLDR:
- Pi Network dominates mobile mining with a $1.85B market cap, controlling 95% of the $1.94B sector value.
- PI trades near $0.1795, rising 5.5% daily with $23.6M volume, showing growing market activity and attention.
- Protocol 22 upgrade deadline on April 27 introduces smart contracts, expanding network functionality and usage.
- Exchange outflows exceed inflows by 310K tokens, while 18M KYC users support steady ecosystem growth.
Pi Network continues to command the mobile mining sector, holding a dominant market share as price action strengthens.
The token trades near $0.1795, showing steady gains while upcoming network upgrades and events draw increased attention from market participants.
Pi Network controls mobile mining sector with strong market share
Pi Network remains the leading project in the mobile mining sector by a wide margin. Data shows it holds a $1.85 billion market cap, covering about 95% of the $1.94 billion category. This places Pi Network ahead of all competing mobile mining projects.
A recent tweet from BSCN reported that Pi Network is also the top trending and top-gaining coin in the segment. The update pointed to rising activity as Pi Network continues attracting attention across the crypto market. The tweet also noted growing trading volume and steady price movement.
Price action shows Pi Network trading near $0.1795, reflecting a 5.5% daily increase. The token also gained 3.8% over the past week, supported by $23.6 million in daily trading volume. These figures indicate renewed interest as traders monitor short-term movement.
At the same time, Pi Network benefits from its large user base. The project reports over 18 million KYC-verified users, which supports ongoing ecosystem growth. This user activity continues to support its position within the mobile mining sector.
Upgrade timeline and events support Pi Network momentum
Pi Network is approaching a key technical milestone with the mandatory Protocol 22 upgrade. The deadline is set for April 27, and it introduces support for smart contracts. This upgrade is expected to expand the network’s functionality and developer activity.
Alongside the upgrade, Pi Network founders Chengdiao Fan and Nicolas Kokkalis are scheduled to speak at Consensus 2026.
The event will take place in Miami in early May, drawing attention from industry participants. Their appearance places Pi Network in a broader market discussion.
Token flow data also shows a shift in supply movement. Exchange outflows have exceeded inflows by 310,000 tokens, suggesting reduced selling pressure. This trend often aligns with accumulation patterns as tokens move away from trading platforms.
In addition, token unlock pressure appears to be easing. This reduces short-term supply stress and may support more stable price movement. Combined with the upgrade timeline, Pi Network enters May with a structured setup.
Overall, Pi Network continues to hold a leading position in the mobile mining sector. Its market share, user base, and upcoming developments keep it in focus. As activity builds, Pi Network remains closely watched for further price movement.
TLDR:
- Strategy holds 815,061 BTC with an average cost near $75,528, maintaining a steady accumulation pace
- Recent purchases between $80K and $110K show continued buying despite higher Bitcoin price levels
- The firm remains in a modest unrealized profit as Bitcoin trades slightly above its average cost
- Over 100 purchases across cycles reflect a consistent Bitcoin accumulation approach without market timing
Michael Saylor has signaled continued commitment to Bitcoin, as new data shows ongoing accumulation by his firm.
The latest tracker presents sustained buying activity, a rising cost structure, and a position holding a modest unrealized gain.
Strategy Maintains Steady Bitcoin Accumulation Approach
The latest tracker data reflects a structured and ongoing Bitcoin accumulation approach, with purchases spread across different market phases.
The firm continues to add Bitcoin regardless of short-term price direction, maintaining a consistent acquisition pace.
A tweet shared by Michael Saylor hinted at another possible purchase, referencing the “Orange ₿eat Goes On.” The update also introduced the firm’s 16th 2026 tracker, reinforcing its ongoing Bitcoin accumulation activity.
The chart shows total holdings of 815,061 BTC, valued at about $63.46 billion. The average purchase price stands near $75,528 per Bitcoin, built through 107 separate buy transactions over time.
Orange dots on the chart mark individual purchases, showing activity during both market rallies and corrections. This pattern reflects a steady Bitcoin accumulation model rather than a reactive approach tied to market timing.
The average cost line continues to rise gradually, indicating that newer purchases occur at higher price levels. This trend signals continued participation in Bitcoin accumulation even as market prices increase.
Recent buying activity appears between the $80,000 and $110,000 range. This suggests the firm remains active in Bitcoin accumulation despite elevated price zones, maintaining consistency in its broader strategy.
Market Position Reflects Long-Term Bitcoin Accumulation Strategy
The firm’s current position sits slightly above its average cost basis, placing it in a modest unrealized gain range. This positioning supports the stability of its long-term Bitcoin accumulation strategy.
Holding above the average entry level may support continued confidence in the current position. At the same time, any movement below that level could influence short-term sentiment across the market.
With more than 800,000 BTC held, a portion of available supply remains out of active circulation. This level of Bitcoin accumulation reduces liquidity within the broader market environment.
Market behavior may respond more sharply during periods of rising demand due to reduced available supply. However, the firm continues to follow a structured Bitcoin accumulation approach rather than short-term trading adjustments.
Historical data from the chart shows no pause in buying activity during previous downturns. This pattern reflects a tolerance for volatility within the ongoing Bitcoin accumulation framework.
Future price movement above recent highs could expand unrealized gains tied to the current holdings. Meanwhile, stable price action near the average cost may support continued Bitcoin accumulation activity.
The tracker continues to document each purchase event, providing a clear record of long-term positioning. As a result, this Bitcoin accumulation strategy remains closely monitored within the market.
TLDR:
- DeFi losses topped $800M in April 2026, with incidents shifting from smart contract bugs to access control failures.
- Major losses included Kelp DAO $292M and Drift $285M, showing concentrated damage across leading DeFi protocols.
- Cross-chain bridges and admin roles emerged as key attack vectors, exposing weak governance and single points of failure.
- Despite improved smart contract security, poor key management and missing timelocks continue driving systemic DeFi risk.
The decentralized finance sector recorded one of its most severe periods in April 2026. Within just 26 days, DeFi losses in April 2026 crossed $800 million. The figures point to a shift in risk sources, moving away from smart contract errors.
Key Management Failures Replace Code Vulnerabilities
According to our Crypto Talk, the scale of DeFi losses in April 2026. The data showed major incidents across several protocols within a short period. Losses included $292 million from Kelp DAO and $285 million from Drift.
Other affected platforms included Grinex, Rhea Finance, and Volo, with smaller yet notable amounts. Even established names like CoW Swap and Silo reported losses. These figures reflect a broad issue rather than isolated events.
At the same time, smart contract bugs have dropped sharply. Reports indicate an 89% decline in such vulnerabilities. This shift shows that code audits and testing have improved across the sector.
However, the same cannot be said for operational security. Many affected protocols had completed audits before the incidents occurred. This raises questions about areas beyond code security.
DeFi losses in April 2026 now point toward failures in managing access and control systems. Weak key handling, poor role distribution, and missing safeguards appear repeatedly. These factors now dominate risk discussions within decentralized finance.
Bridges, Admin Roles, and Single Points of Failure
A closer look at the incidents reveals recurring patterns. Bridges remain a major target due to their complex design. Attackers often exploit weaknesses in cross-chain communication and validation processes.
Admin roles also present challenges when not properly secured. In several cases, single signers held critical authority over protocol operations. This creates a single point of failure that can be exploited.
Timelocks, which delay critical changes, were missing in some affected systems. Without them, attackers can act quickly after gaining access. This reduces the chances of intervention or recovery.
DeFi losses in April 2026 show how human decisions shape protocol safety. While smart contracts may function correctly, access control still depends on people. This includes how keys are stored and who can authorize changes.
The pattern across these incidents suggests a need for stronger governance frameworks. Multi-signature setups and layered permissions may reduce exposure. However, their adoption remains inconsistent across protocols.
As a result, DeFi losses in April 2026 continue to reflect gaps in operational discipline. The focus has shifted from code reliability to access management. This change marks a new phase in the assessment of risks.
The data from April presents a clear timeline of events. Multiple incidents occurred within weeks, affecting both large and small platforms. This clustering adds urgency to ongoing security discussions.
DeFi losses in April 2026 now serve as a reference point for evaluating risk priorities. The sector appears to be moving toward addressing human and structural weaknesses. This trend may shape future security practices across decentralized finance.
TLDR:
- PENGU/USDT holds a strong demand zone after three retests, forming a higher low that signals growing buyer strength
- Price is testing a long-term descending trendline, with a breakout likely to confirm a shift toward bullish momentum
- Fibonacci levels indicate upside targets at $0.015 and $0.020 as the price moves out of the accumulation phase
- Failure to break resistance could return the price to $0.006, keeping PENGU/USDT within its established range
PENGU/USDT is showing early signs of a possible trend reversal after holding a key demand zone for the third time.
The weekly chart structure now points to a shift from prolonged downside pressure toward a more constructive price setup.
Demand Zone Stability Strengthens Reversal Case
The recent analysis shared by Whale Factor points to a developing reversal structure on the PENGU/USDT weekly chart.
The post describes a classic accumulation pattern followed by a breakout attempt. It also notes that the asset has tested the same demand zone three times.
The $0.0045–$0.0060 range continues to act as a strong base. Each retest has produced a bounce, with the latest forming a higher low.
This pattern suggests buyers are stepping in earlier than before. As a result, PENGU/USDT is showing signs of gradual strength building within this range.
This demand zone has remained intact despite extended selling pressure earlier in the trend. The repeated defense of this level indicates sustained buyer interest. At the same time, the formation of a higher low suggests a shift in short-term structure.
In addition, the broader price trend had been bearish, marked by lower highs and lower lows. However, the current setup signals a possible transition phase. If support continues to hold, the structure may favor further upside attempts.
Trendline Test and Fibonacci Levels Define Next Moves
PENGU is now testing a descending resistance trendline that has capped prices since mid-2025. This level represents a key barrier that has rejected multiple bullish attempts. A clean breakout above this line would shift the broader trend outlook.
The current price sits near $0.0095, slightly above the demand zone. According to the shared chart, Fibonacci retracement levels outline potential upside targets. The first level to watch is around $0.015, followed by the $0.020 to $0.025 range.
These levels correspond to the 0.786 and 0.618 retracement zones. They often act as areas where price may pause or face resistance. If momentum continues, PENGU could move through these levels in a stepwise manner.
The projected path suggests a breakout followed by a brief pullback. After that, continuation toward higher levels may occur if buyers maintain control. This structure reflects a controlled upward movement rather than a sharp spike.
On the other hand, failure to break the trendline could shift focus back to support. A rejection at this level may push the price back toward $0.006. If the demand zone breaks, the current setup would no longer hold.
For now, the structure remains intact, with the trendline acting as the immediate decision point. Market participants are watching whether PENGU can sustain momentum above resistance or return to consolidation.

Oil prices rise as US-Iran peace talks stall
Polymarket Launches pUSD and CLOB V2 in Major Exchange Upgrade Scheduled for April 28
The Best Crime Shows From Every Year of the 2010s
Manchester United reach agreement with Casemiro over contract clause amid transfer speculation

US brings back mandatory military draft registration

Steven Gerrard disagrees with Gary Neville over ‘shock’ Chelsea and Arsenal claim | Football


-

 Fashion2 days ago
Weekend Open Thread – Corporette.com
-

 Politics6 days ago
Gary Stevenson delivers timely reminder to register to vote as deadline TODAY
-
Crypto World1 day ago
Hyperliquid $HYPE Rally Builds Momentum as AI Sector Enters Prove-It Phase
-
Crypto World6 days ago
Bank of Hawai’i (BOH) Q1 2026: Net Income Drops to $57.4M as Net Interest Margin Expands
-

 Politics4 days ago
Making troops accountable for war crimes threatens US alliance, ex-SAS colonel warns
-

 Politics4 days ago
Disabled people challenge government SEND proposals over segregation concerns
-

 Business5 days ago
Rolls-Royce Voted UK’s Most Iconic Trade Mark as IPO Register Hits 150
-

 Politics4 days ago
Zack Polanski responds to home secretary’s taser threat
-
 Sports13 hours ago
IPL 2026: Ruturaj Gaikwad registers slowest fifty of the season, enters all-time unwanted list | Cricket News
-

 Business3 days ago
Patterson-UTI Energy, Inc. (PTEN) Q1 2026 Earnings Call Transcript
-

 Politics4 days ago
Starmer handler McSweeney to be dragged from shadows by Foreign Affairs Committee
-
 Crypto World5 days ago
Five Value Stocks with Recovery Potential in 2026: PayPal (PYPL), Nike (NKE), and More
-
Politics4 days ago
Wings Over Scotland | How To Get Away With Crimes
-

 Crypto World5 days ago
New York sues Coinbase, Gemini over prediction market offerings
-

 Politics4 days ago
‘Iran is still a nuclear threat’
-
 Sports4 days ago
Tim Bradley names the current best in the world: “Better than Inoue and Usyk”
-
 Business5 days ago
HCL Tech share price tank over 9% after weak Q4. JPMorgan, HSBC & 3 others cut target price
-

 NewsBeat17 hours ago
LK Bennett closes all stores after entering administration
-

 Crypto World5 days ago
Crypto’s great hope in Senate’s Clarity Act still has a path to survive tight calendar
-

 Fashion5 days ago
Kilkenny Design New Beauty Arrivals for Spring 2026
You must be logged in to post a comment Login