

Crypto World
BingX shows robust 66% growth YoY in CoinGecko perpetuals report


- BingX recorded 565 new perpetual listings since 2025, averaging 35 new contracts monthly.
- The report identified BingX as having one of the strongest market share growth trajectories.
- BingX led in new listings of AI-related assets.
BingX, a leading cryptocurrency exchange and Web3-AI company, today announced a partnership with CoinGecko for the release of the 2026 State of Crypto Perpetuals Report, an in-depth study examining the evolution of the perpetuals market across centralized and decentralized exchanges.
The report identified accelerating growth in trading tied to tokenized real-world assets (RWAs), AI-linked markets, and multi-asset products, trends that closely align with BingX’s leadership in multi-asset trading.
Moreover, the report indicated that trading related to RWAs accelerated sharply in 2026, with first-quarter volumes already surpassing total 2025 levels.
It also highlighted growing traction for stock perpetuals and other traditional finance-linked products as traders increasingly seek continuous access to diversified markets through crypto-native infrastructure.
According to CoinGecko’s 2026 State of Derivatives Report, BingX Experienced Strong Growth:
- #2 Perpetual Listings Globally: BingX recorded 565 new perpetual listings since 2025, averaging 35 new contracts monthly, and among the highest number of new listings of any exchange.
- Fastest Derivatives Growth Into 2026: The report identified BingX as having one of the strongest market share growth trajectories, increasing its derivatives market share by 58% entering 2026 and YoY growth exceeding 66%, bucking the overall trend and driven by large RWA asset growth.
- BingX TradFi Suite Expansion: BingX expanded its RWA perpetual offerings with tokenized equity products tied to global companies, including major stocks.
- AI-Related Perpetual Markets: BingX led in new listings of AI-related assets, which represented the largest category of new BingX perpetual listings, totaling 111 new markets.
Reflecting the company’s Infinite Vision strategy of delivering early access to trending narratives and new market opportunities, BingX has also expanded into alternative investment exposure through the launch of SpaceX pre-IPO and OpenAI pre-IPO perpetual trading.
BingX also introduced EventX to its Futures lineup, alongside Standard & Perpetual Futures, Copy Trading, and TradFi Markets.
EventX is an innovative contracts product that enables users to trade on the outcomes of major global events and digital assets.
Together, these developments reflect BingX’s broader vision of building a unified multi-market trading environment that bridges crypto and traditional finance while evolving alongside changing user and market demands.
About BingX
Founded in 2018, BingX is a leading crypto exchange and Web3-AI company, serving over 40 million users worldwide.
Ranked among the top five global crypto derivatives exchanges and a pioneer of crypto copy trading, BingX addresses the evolving needs of users across all experience levels.
Powered by a comprehensive suite of AI-driven products and services, including futures, spot, copy trading, and TradFi offerings, BingX empowers users with innovative tools designed to enhance performance, confidence, and efficiency.
BingX has been the principal partner of Chelsea FC since 2024, and became the first official crypto exchange partner of Scuderia Ferrari HP in 2026.
For media inquiries, please contact: [email protected]
For more information, please visit: https://bingx.com/
This article is authored by a third party, and CoinJournal does not endorse or take responsibility for its content, accuracy, quality, advertisements, products, or materials. Readers should independently research and exercise due diligence before making decisions related to the mentioned company.


Digital Asset, the company behind the Canton Network institutional blockchain, has closed a $355 million funding round led by a16z crypto, with participation from HSBC, Apollo, CME, BNP Paribas, ABN Amro, ADIA, S&P Global, Tradeweb, and more than 20 other institutional names. The round, announced… Read the full story at The Defiant

Coinbase launched a standalone account product for AI agents, letting assistants including ChatGPT and Claude execute trades, manage portfolios, and pay for data autonomously under user-defined guardrails. Coinbase for Agents went live Thursday as a separate account from the main Coinbase app…. Read the full story at The Defiant
XRP has entered a crucial support region after suffering an aggressive selloff over the past two weeks. While buyers have managed to prevent a deeper breakdown for now, the asset remains trapped within a broader downtrend, leaving the current rebound vulnerable unless key resistance levels are reclaimed.
Ripple Price Analysis: The Daily Chart
The daily chart shows XRP trading inside a long-term descending channel, with the price recently breaking below the lower boundary of a multi-month consolidation range.
The recent selloff pushed XRP into the highlighted support region around $1.08-$1.20, where buyers managed to generate a reaction. However, the recovery has been relatively weak so far, indicating that demand remains limited. As long as the asset stays beneath the former support zone around $1.70-$1.85, any upside movement is likely to be viewed as a corrective bounce rather than a trend reversal.
On the upside, the first significant resistance sits near the descending channel boundary and the 100-day MA around $1.35-$1.40. A successful reclaim of that area would be needed to improve the technical outlook. Beyond that, the $1.70-$1.85 supply zone represents the next major obstacle. Failure to hold the current demand area could expose the lows around $1.05 and potentially open the door for a deeper decline.
XRP/USDT 4-Hour Chart
The 4-hour chart provides a clearer view of the recent breakdown. The recent sharp drop eventually found support near the red demand zone around $1.08-$1.10, which coincides with the measured move target from the breakdown. Since then, XRP has staged a modest recovery, but the bounce has so far produced only a lower high structure, keeping the short-term trend bearish.
For bulls, reclaiming the $1.21 level would be the first sign that momentum is stabilizing. Above that, the $1.25-$1.30 region remains the most important resistance cluster, as it combines previous support turned resistance with multiple Fibonacci levels. A breakout above this zone could trigger a stronger relief rally toward $1.36.
On the downside, the $1.08-$1.10 support area remains critical. A decisive breakdown below this zone would invalidate the current rebound attempt and increase the probability of a retest of the $1.05 swing low shown on the chart.
Overall, the higher timeframe trend remains bearish, while the 4-hour chart suggests XRP is attempting to build a short-term base above support. The next directional move will likely depend on whether buyers can reclaim the $1.21-$1.30 resistance cluster or whether sellers force a breakdown below $1.08.

The post Ripple Price Analysis: XRP’s Weak Recovery Points to More Downside Ahead appeared first on CryptoPotato.

Bitcoin’s slide toward a key on-chain support level has sparked debate after market analyst Shanaka Anslem Perera argued that the behavior usually seen at major market bottoms is still missing.
According to him, BTC came within 9% of the price level that has historically ended bear markets, but investors didn’t sell in the numbers usually associated with capitulation.
Bitcoin Nears Realized Price, But Selling Pressure Looks Different
The metric in question is Bitcoin’s realized price, which is currently around $53,600, and represents the average cost basis across every BTC in circulation.
In a June 11 post on X, Perera stated that in 2018 and 2022, the OG cryptocurrency fell to that level and bounced. Those rebounds, according to him, weren’t coincidences but were because of what happens after Bitcoin comes close to its realized price. Holders often break, selling at a loss in large enough numbers that the supply gets flushed, weak hands leave, and the market finds solid ground again.
But that flush hasn’t happened this time around. In the 2022 capitulation, Perera says holders sold 1.2 million BTC at a loss, but in last week’s drop, the number was only 187,000 units.
Essentially, Bitcoin approached the same price floor without the same behavior, which, per the analyst, is precisely what made that moment ambiguous rather than confirming.
“Bitcoin reached the bottom’s address without the bottom’s behavior,” he wrote. “The flush that clears weak hands and ends bear markets has not happened.”
In his opinion, the dip was driven by disappearing demand rather than panic selling. He pointed to a drop of 652,000 BTC in demand last week, which he described as the worst decline since January 2022, and also noted that spot Bitcoin ETF flows had been hugely negative.
Bitcoin’s cause has not been helped by escalating geopolitical tensions after Iran once again closed the Strait of Hormuz following US strikes on its military infrastructure, sending the price of crude oil jumping by more than 2.5%.
Furthermore, the US Consumer Price Index came in at a higher-than-expected 4.2%, effectively ruling out Fed rate cuts and raising the possibility of hikes under the new Federal Reserve Chair, which added to concerns about reduced market liquidity.
Long-Term Holders Still Steady Despite Market Pressure
One other thing that Perera pointed out in his assessment was that the lack of selling can also be interpreted as a bullish signal.
“The realized price has marked four of the last four major bottoms, and long-term holders are sitting still rather than selling. That is the bull case,” he explained.
That view echoes comments from another market observer, Sykodelic, who noted that long-term holders collectively control a record 16.5 million BTC despite many positions sitting below the prices they were bought for.
Other firms have reached similar conclusions while stopping short of calling a bottom. For instance, Grayscale has said that Bitcoin currently looks undervalued, even though it warned that the conditions right now are not as extreme as past bear market lows.
The post Bitcoin Nears Realized Price But Capitulation Signals Are Missing: Analyst appeared first on CryptoPotato.
Crypto World
Silver Price is Down Nearly 50% from Record High, and This Trendline is the Last Defense
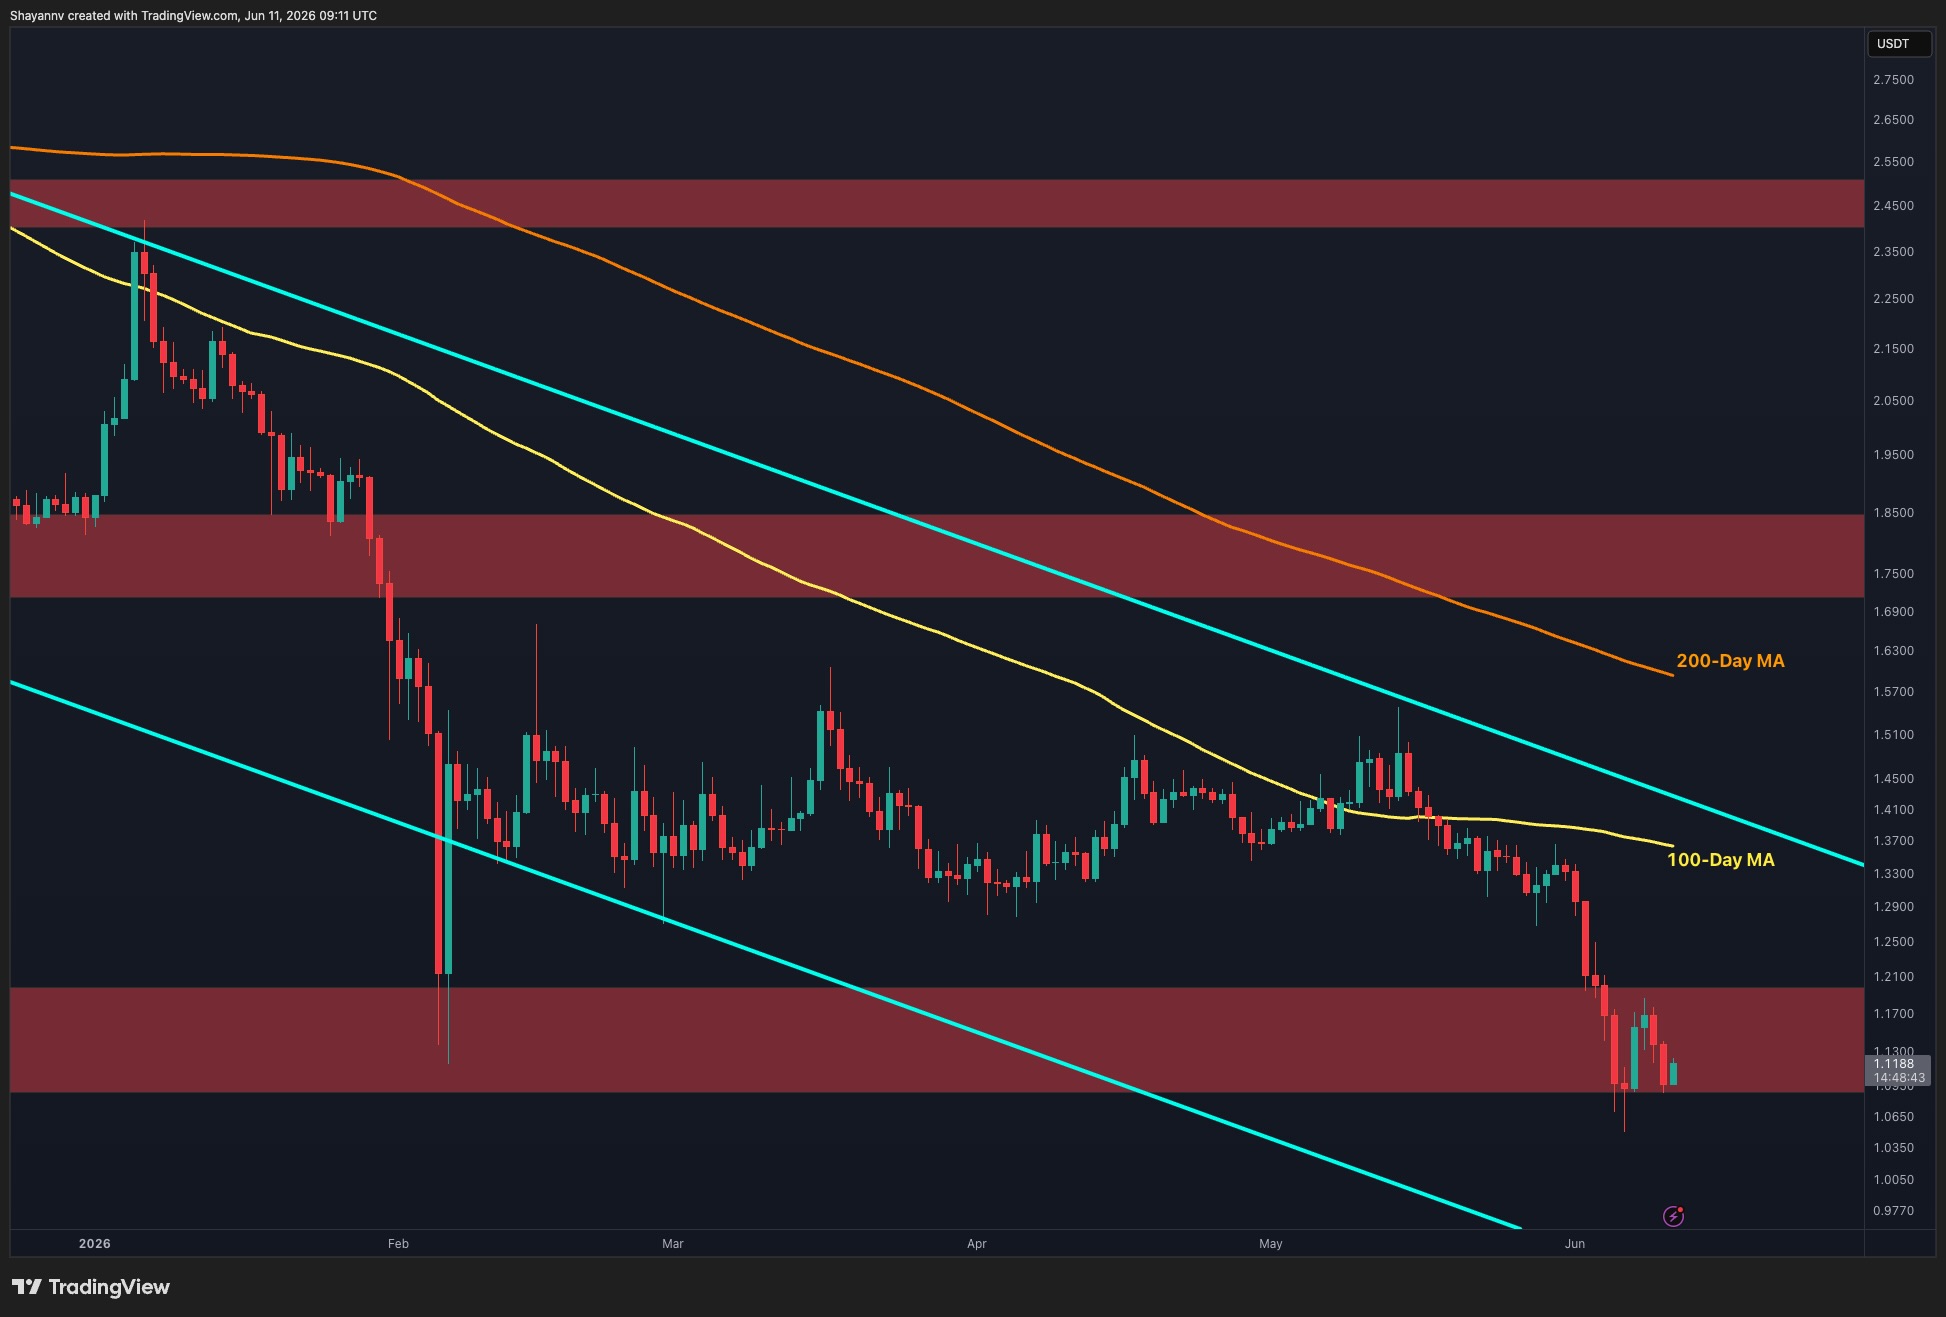
Silver (XAG) closed below its 200-day moving average on June 9 for the first time since April 2025. Silver price now trades near $64 after falling about 47% from its January all-time high (ATH) of $121.75.
The breakdown removes a trend support that held through the entire bull cycle. However, a four-year trendline in the daily Relative Strength Index (RSI) is approaching its fifth test.
Silver Loses the 200-Day Moving Average for the First Time Since April 2025
Silver closed below the 200-day moving average on June 9 and extended the decline a day later. The price printed a low at $61.50 on June 11 before a modest bounce to around $64.
The previous close below this average came on April 4, 2025. Back then, silver spent only three days under the line before reclaiming it. The current breakdown looks different because it follows a 47% drawdown rather than a brief pause in an uptrend.

Sellers also took out the support near $69, which aligned with the 0.618 Fibonacci retracement of the rally from $36.20 to $121.75. An earlier BeInCrypto analysis had already flagged the risk of a slide to $63.
The next major support sits near $54.50, at the 0.786 Fibonacci level. Below that, the $50 area marks strong long-term support and the previous record high. Meanwhile, the 0.382 Fibonacci level near $89 remains the key resistance.
A 4-Year RSI Trendline Faces Its Fifth Test
The bearish price structure has one important counterweight. The daily RSI has been trading above an ascending trendline since May 2022.
The line has already produced four bounces (blue circles) in May 2022, March 2023, October 2023, and April 2025. Notably, the April 2025 touch coincided with silver’s quick recovery above the 200-day moving average.

The indicator now reads near 30 and approaches the trendline for the fifth time. A bounce here could reset momentum and fuel a counter-trend rally. In contrast, a clean break would end the four-year pattern and confirm that bearish momentum dominates.
The signal carries extra weight because a May prediction from BeInCrypto already warned of further losses once key supports failed.
Silver Price Prediction as Precious Metals Sentiment Turns Capitulatory
The drawdown extends across precious metals. Trader BullTheoryio estimated the combined damage in a post on X.
“BREAKING: Over $12.95 trillion has been wiped out from gold and silver in just 132 days. Gold has crashed -26.50% from its January peak… Silver is down -47.69%, wiping out $3.2 TRILLION.”
According to the same post, the selloff happened while the Iran conflict stayed active, oil traded near $90, and inflation remained elevated. These are conditions that have historically favored metals, which makes the decline more striking.
Mockery from Bitcoin circles adds a final signal of sentiment. On-chain analyst Checkmatey ridiculed the crash with a satirical post about Jane Street using a quantum computer to mine asteroids and inflate the supply of metal to infinity.
Such open derision of an asset class often clusters near capitulation phases, though it offers no timing guarantee.
If the RSI trendline holds, the silver price could attempt a recovery to the broken $69 area. A reclaim of that zone would open the way to the 0.5 Fibonacci level near $79. Only a move above the $89 resistance would invalidate the broader bearish structure, a scenario explored in a recent outlook on physical market tightness.
If the trendline breaks, the path opens to $54.50, then to $50. Silver’s fate now rests on a single momentum line that has not failed in four years.
The post Silver Price is Down Nearly 50% from Record High, and This Trendline is the Last Defense appeared first on BeInCrypto.
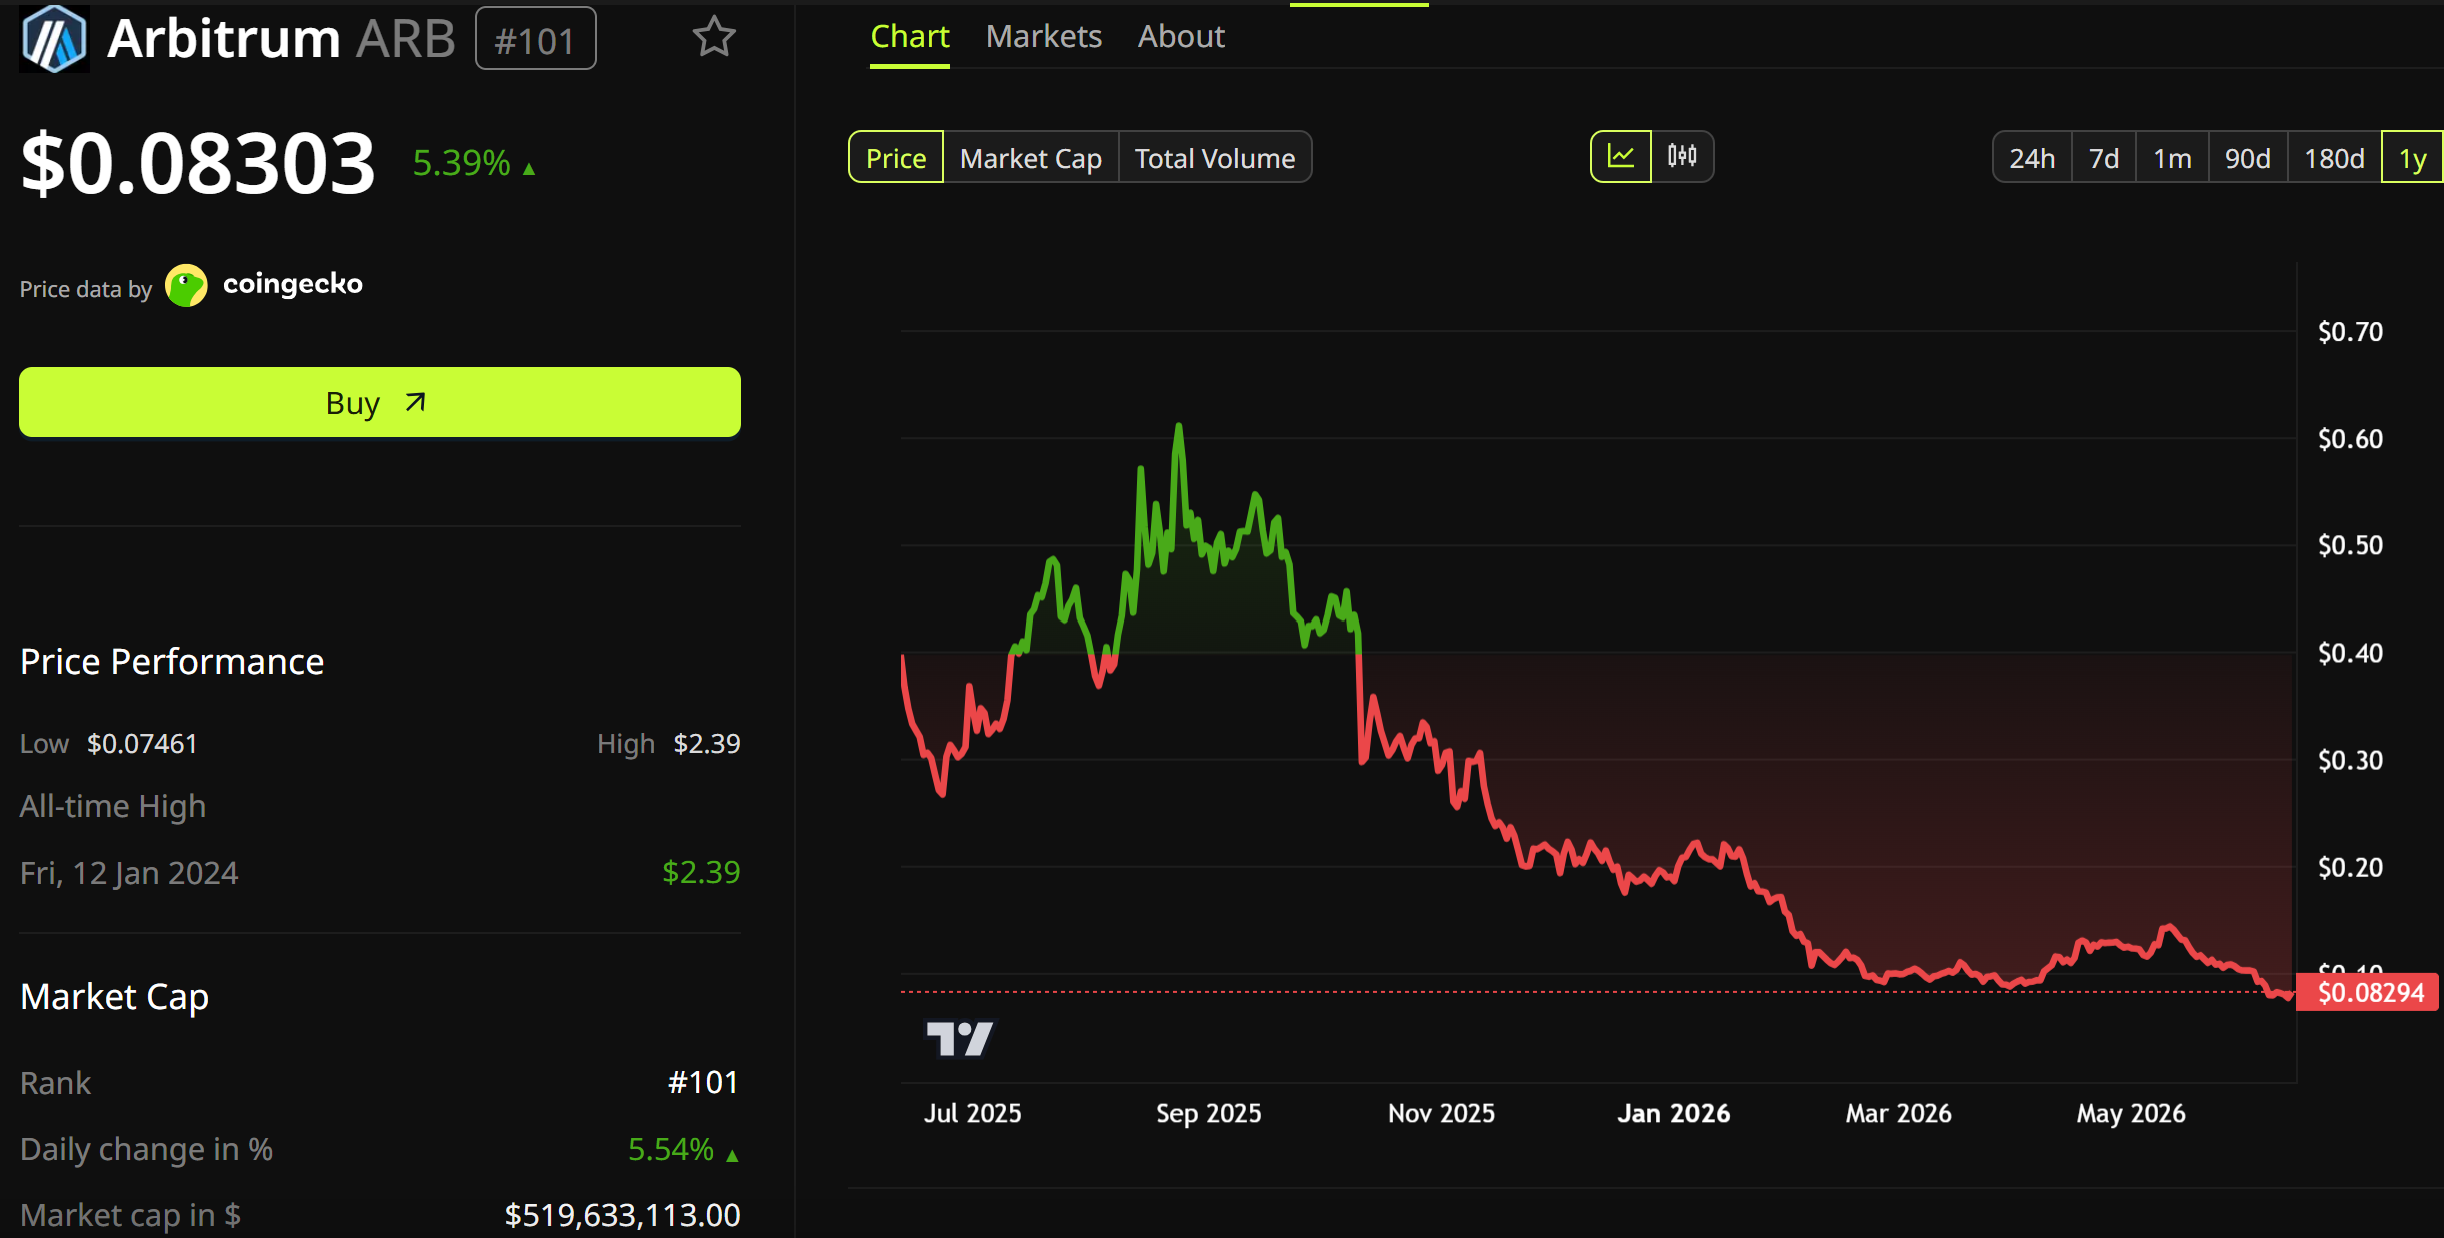
LG Electronics is building a blockchain network for placing and selling ads, the company told Fortune on June 11. The South Korean device maker worked with Arbitrum to develop its own layer-2 chain for the platform.
The project emerged from LG’s dedicated blockchain research lab, which piloted the system with an unnamed Japanese ad agency. A commercial rollout is under evaluation for later this year.
Why LG Electronics Built a Blockchain for Advertising
The platform gives advertisers and publishers a shared database of ad inventory, according to Fortune. It also records how audiences interact with each placement.
That common ledger could replace the manual reconciliation that still settles many digital ad deals.
The prize is substantial. Dentsu forecasts digital ad spend at $740 billion in 2026. That is about 73% of a global media market set to top $1 trillion for the first time.
Samuel Byungsun Park leads LG Electronics’ blockchain research department. He said LG is evaluating whether the approach delivers meaningful value to advertisers, publishers, and audiences.
Historically, LG has tested Web3 in waves. The company previously unveiled its digital asset wallet Wallypto and filed an NFT trading TV patent, both tied to its consumer device business.
Follow us on X to get the latest news as it happens
Corporate Chains Shift From Renting to Owning
LG joins a growing list of firms building their own ledgers rather than renting block space.
Stripe incubated Tempo, a payments chain that raised $500 million. Meanwhile, Robinhood is working with Arbitrum on its own tokenized-equity chain, and Circle is developing the Arc network.
However, Arbitrum’s enterprise wins have not lifted its token. Arbitrum (ARB) traded near $0.083 on Thursday, up 5% in 24 hours yet down 80% over the past year.

Arbitrum cofounder Steven Goldfeder argued the model can automate ad sales without manual intervention. Still, he warned that owning a chain does not fit every company.
“I am very opinionated when someone asks me, ‘Should I launch a blockchain?’ For many people, the answer is yes, but probably for most people, the answer is no,” Goldfeder said in comments to Fortune.
LG committing depends on what the pilot proved about cost and speed. The decision on a full market launch should land later this year.
The post LG Wants to Put the $700 Billion Ad Industry On-Chain With Arbitrum appeared first on BeInCrypto.

A bipartisan proposal in the U.S. House aims to consolidate criminal investigations into cryptocurrency theft, scams, and other digital asset-related crimes under a Department of Justice-led task force. The legislation envisions the DOJ as the principal federal coordinator, uniting the FBI, Homeland Security Investigations, and Treasury’s Financial Crimes Enforcement Network (FinCEN) to streamline evidence collection, blockchain forensics, asset tracing, and victim support across federal, state, and local law enforcement. According to Cointelegraph, the measure would also enable training and technical assistance for state and local agencies, with the task force coordinating international law enforcement collaboration on cross-border investigations and delivering annual threat assessments to Congress.
The proposal explicitly states that it would not authorize new regulation of cryptocurrency markets, would not expand the authority of federal agencies, and would not create new criminal offenses. Rather, its focus is on interagency coordination within the enforcement framework already responsible for financial crimes. The bill names Republican Representative Lance Gooden and Democratic Representative Josh Gottheimer as its sponsors. The text and accompanying materials have been referenced in reporting, including a link to the draft bill hosted by Gooden’s office.
The initiative also comes amid rising crypto-related losses and an expanding role for technology in investigations. The FBI’s 2025 Internet Crime Report highlighted that Americans reported more than $11 billion in crypto-related losses last year. In parallel, the crypto-analytic community is increasingly leveraging artificial intelligence to support casework.
The task force would engage with international counterparts on cross-border cases and would produce annual reports outlining emerging threats, enforcement challenges, and potential policy recommendations for Congress. The bill’s architects frame the measure as a coordination enhancement rather than a regulatory expansion, aimed at closing gaps in investigative workflows and ensuring consistency in evidence handling across jurisdictions.
The broader policy conversation surrounding this proposal sits alongside a growing emphasis on advanced analytics in crypto investigations. Industry players have rolled out AI-enabled tools designed to trace fund flows, audit transaction graphs, and support investigative decision-making. For example, TRM Labs recently introduced an AI-driven investigative assistant designed to aid crypto compliance and investigations, while Chainalysis announced a later rollout of similar AI-enabled agents for investigations and compliance. These developments reflect a trend toward more scalable forensics as criminals increasingly automate cross-chain activity. Regulatory and financial institutions will be watching closely how such tools intersect with AML/KYC regimes and cross-border enforcement norms.
Crypto-asset exploits continue to drive losses, underscoring the practical significance of enhanced investigative capacity. DeFiLlama data cited a monthly loss total of roughly $630 million in April, marking one of the largest monthly totals in recent months and reinforcing the argument for stronger, more coordinated enforcement and forensics capabilities. Related reporting indicates a broader push toward integrated law enforcement tools and international cooperation in tackling crypto crime.
Key takeaways
- A bipartisan bill would establish a Department of Justice–led task force to coordinate cryptocurrency crime investigations across federal, state, and local agencies, with a focus on best practices and evidence standardization.
- The initiative emphasizes cross-agency collaboration, blockchain forensics, asset tracing, victim support, and training, including international cooperation on cross-border cases.
- Importantly, the bill explicitly prevents new market regulation, expansion of federal authority, or creation of new criminal offenses; the aim is enhanced coordination within existing enforcement powers.
- AI-enabled analytics and blockchain-investigation tools are increasingly central to crypto crime workflows, shaping how investigators trace flows and identify illicit networks.
Legislative framework and enforcement architecture
According to Cointelegraph, the proposal would position the DOJ as the central federal coordinator for cryptocurrency-crime investigations, consolidating activities among the FBI, Homeland Security Investigations, and FinCEN’s enforcement arm. The task force would develop and disseminate best practices for evidence collection, blockchain forensics, asset tracing, and victim support, while providing training and technical assistance to state and local law enforcement agencies. The legislation envisions annual reporting to Congress on emerging threats and enforcement challenges, and it calls for collaboration with international law-enforcement partners to advance cross-border investigations. The sponsors emphasize that the measure is a coordination mechanism rather than a vehicle to regulate markets or expand federal power.
For compliance and oversight teams, the architecture signals a potential shift toward standardized investigation workflows and shared standards for digital-asset evidence. As authorities align practices across jurisdictions, exchanges, custodians, and banks could face more uniform expectations for information sharing and cooperation in criminal investigations.
Technology and investigative capabilities
The bill arrives at a moment when private-sector blockchain intelligence firms are integrating AI into investigative workstreams. In early 2025, TRM Labs announced an AI-assisted investigative assistant designed to trace flows, audit transaction graphs, and propose next steps from natural-language prompts, reflecting a broader industry trend toward scalable forensics. Chainalysis subsequently indicated that its own AI-enabled agents would roll out to support investigations and compliance functions, underscoring a parallel shift toward automated, data-driven intelligence in crypto-crime response. The integration of AI tools—while increasing efficiency—also raises considerations for accuracy, bias, and governance within enforcement workflows.
These tools are increasingly central to how investigators identify illicit activity, parse complex transaction networks, and reconstruct schemes that span multiple chains and jurisdictions. As enforcement bodies scale with these capabilities, firms operating in the crypto ecosystem should anticipate evolving expectations around data transparency, reporting, and collaboration with law enforcement under applicable AML/KYC regimes and cross-border frameworks.
Regulatory policy and market implications
The proposed framework represents a structural approach to enforcement coordination rather than a new regulatory regime. By clarifying roles and standardizing practices across agencies, the bill could influence how exchanges, banks, and institutional investors approach risk management and regulatory compliance. In the broader policy landscape, the development complements ongoing regulatory oversight at the federal level while existing frameworks for monitoring and supervising crypto markets remain distinct from the substance of this enforcement-oriented initiative. Observers will be attentive to how annual congressional reporting shapes understanding of threats and informs any future policy considerations.
Overall, the measure highlights a continued convergence between legislative intent and technological tools in the fight against crypto crime. As cross-border investigations intensify and illicit actors increasingly leverage automation, coordinated, well-governed enforcement mechanisms will be critical to maintaining resiliency in the digital-asset ecosystem.
Closing perspective: If advanced oversight and interagency coordination proceed, the sector should monitor the pace of funding, the scope of interagency collaboration, and the cadence of annual threat assessments—factors that will shape enforcement posture and compliance expectations in the months ahead.


Coinbase this afternoon launched two onchain USDC lending vaults built on Morpho and curated by Steakhouse Financial, giving users their first choice of risk profile when lending from the exchange: a conservative Prime tier backed by blue-chip crypto collateral, and a Higher Yield tier drawing on… Read the full story at The Defiant


LG Electronics is building a blockchain-based advertising network on its own Arbitrum-derived Layer 2, according to an exclusive report by Fortune published Thursday. The company describes the project as a pilot with no commercial launch date set. The South Korean electronics giant, known for TVs… Read the full story at The Defiant
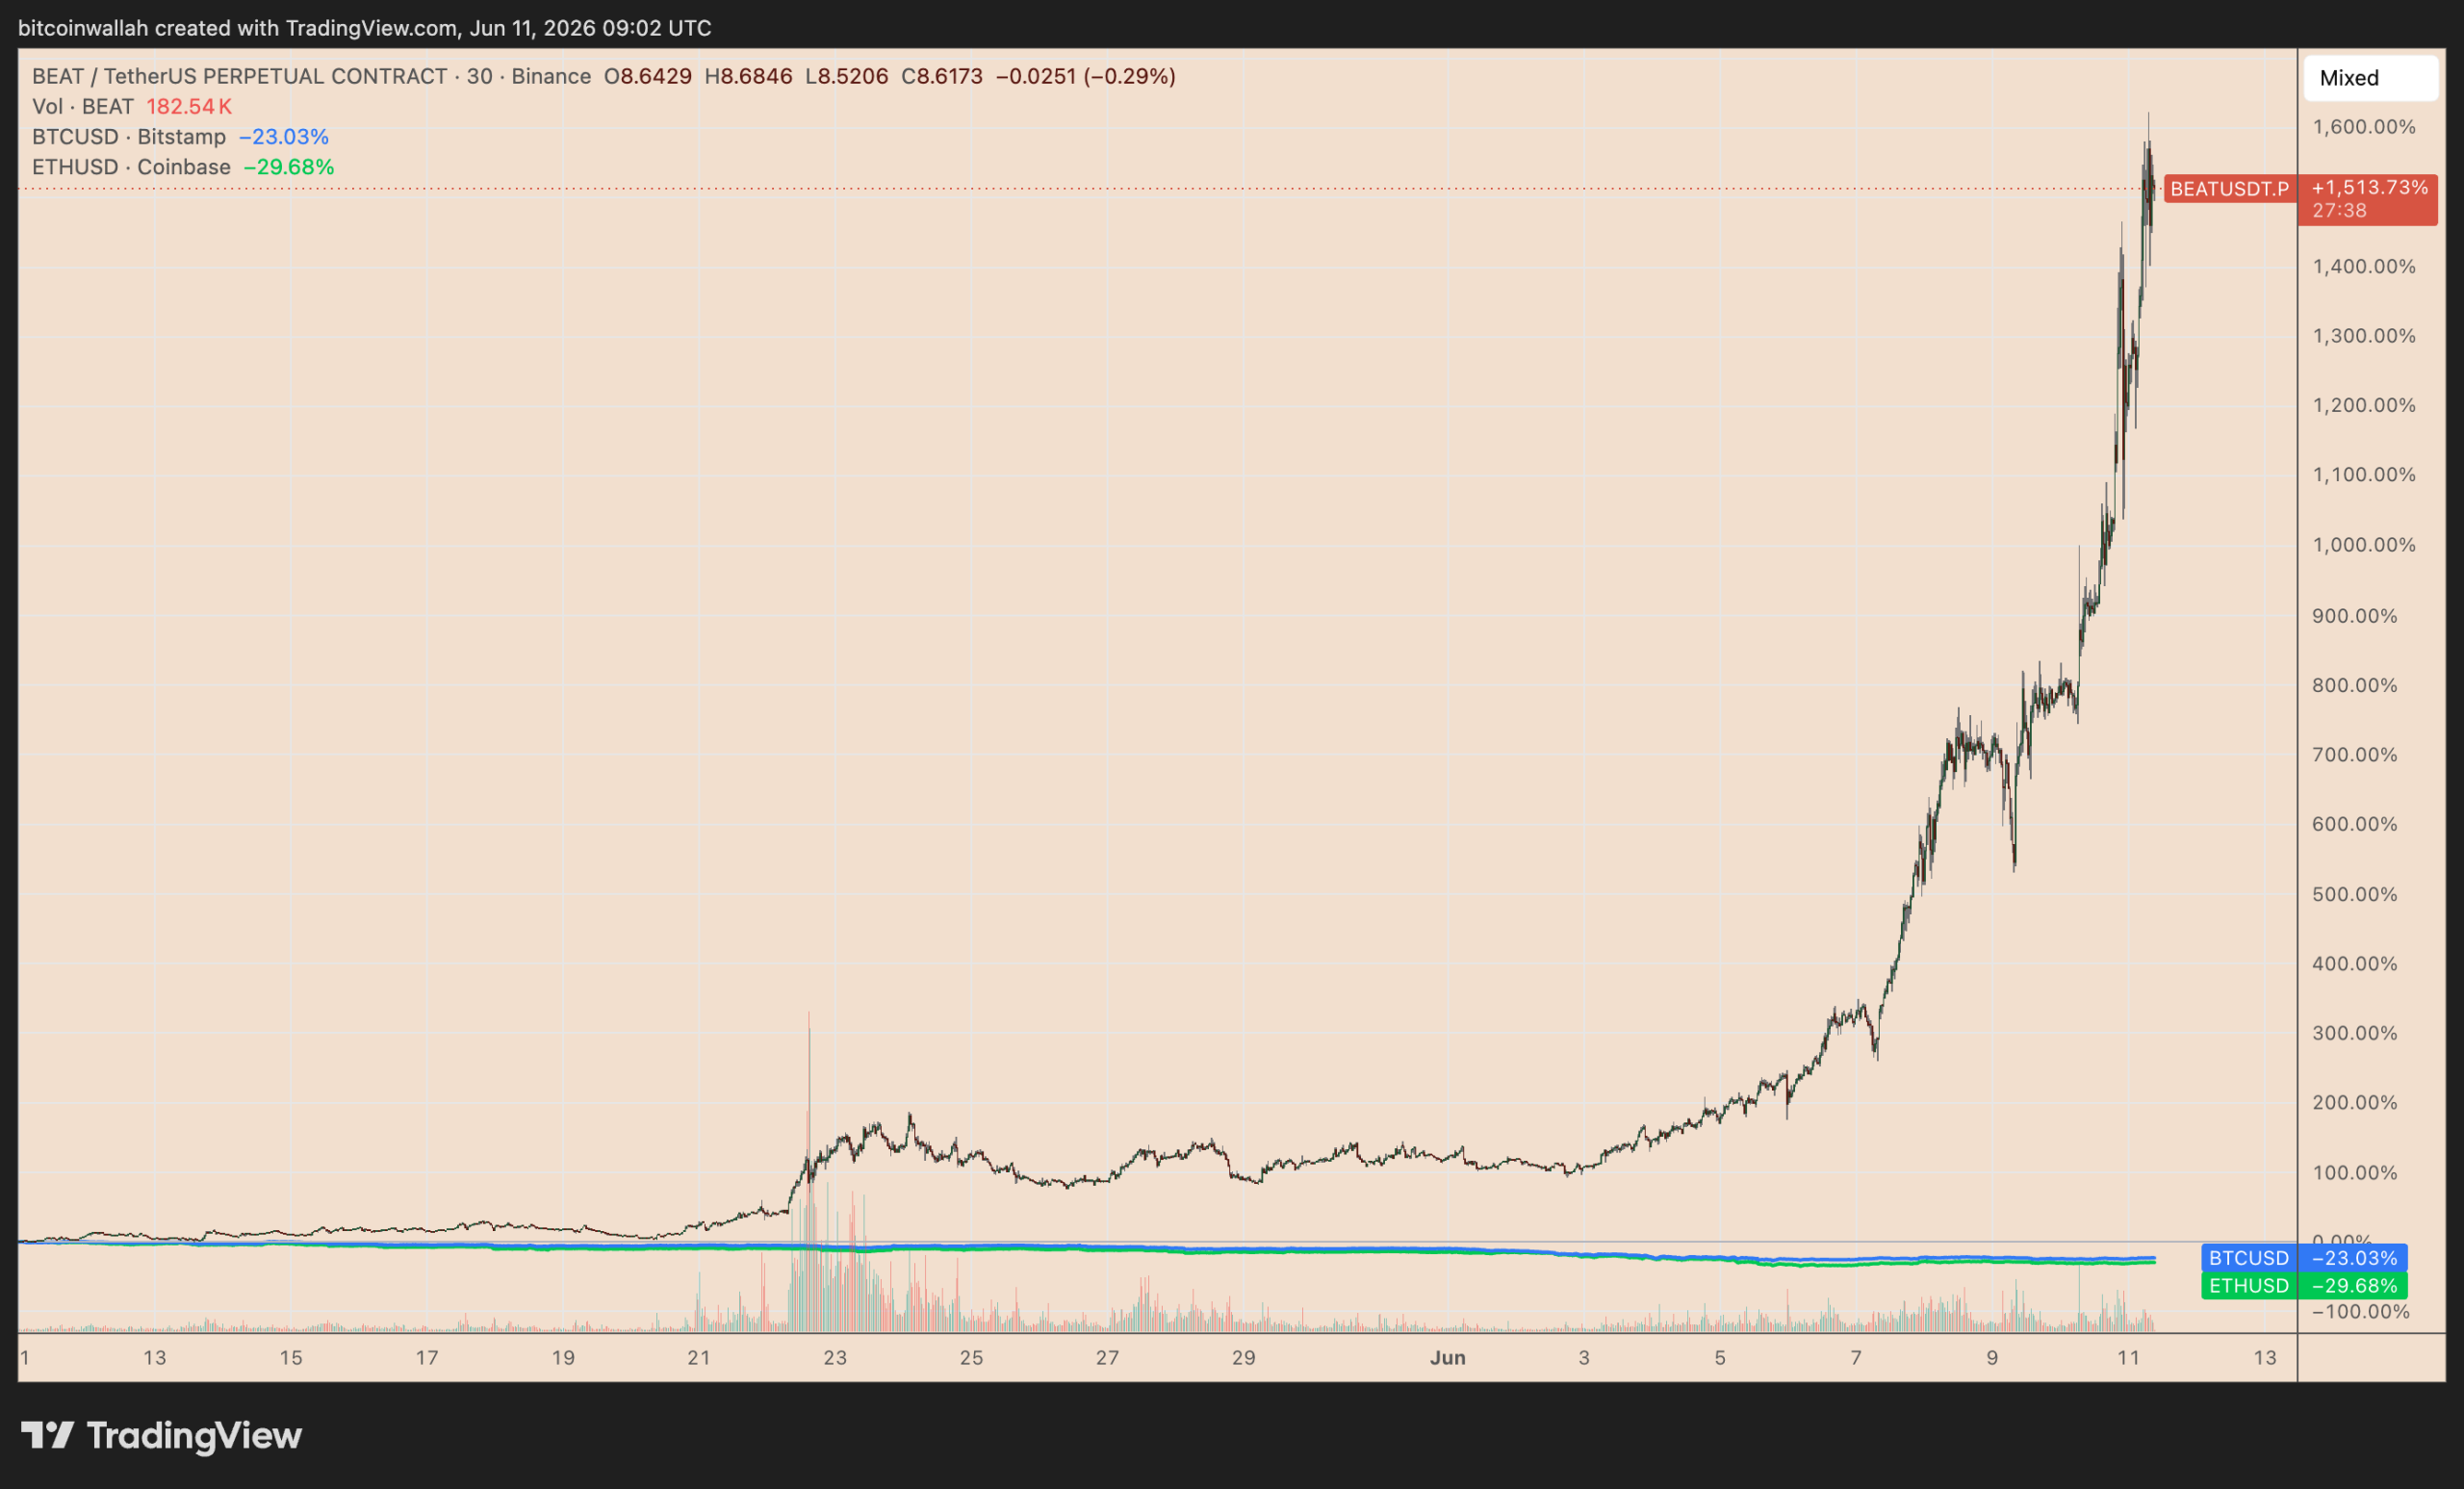
BEAT, the native token of AI music platform Audiera, has exploded higher over the past month, surging more than 1,500% to a record high of $9.20 even as Bitcoin (BTC) and Ether (ETH) fell roughly 25% and 30%, respectively, in the same period.
BEAT/USD vs. BTC/USD and ETH/USD 1-month price performance. Source: TradingView
Key takeaways:
- Strong platform revenues mixed with excessive short liquidations send BEAT’s price higher.
- The AI token is now at its most overbought stage, which may prompt a 35% dip in the coming days.
Why is Audiera’s BEAT price up so much?
BEAT’s sharp outperformance has turned it into one of crypto’s hottest AI-linked trades, driven by a mix of platform revenue claims, token burns, and short liquidations.
Audiera revenue and token burns strengthen BEAT bull case
BEAT’s rally has gained momentum from Audiera’s revenue-and-burn model, which has given traders a stronger value-capture story to chase.
The project reported 772,045 BEAT in weekly revenue between June 1 and June 8, worth about $2.87 million at its stated price of $3.712. During the same period, Audiera said it burned 770,545 BEAT, taking the total burned supply to 12.35 million BEAT.
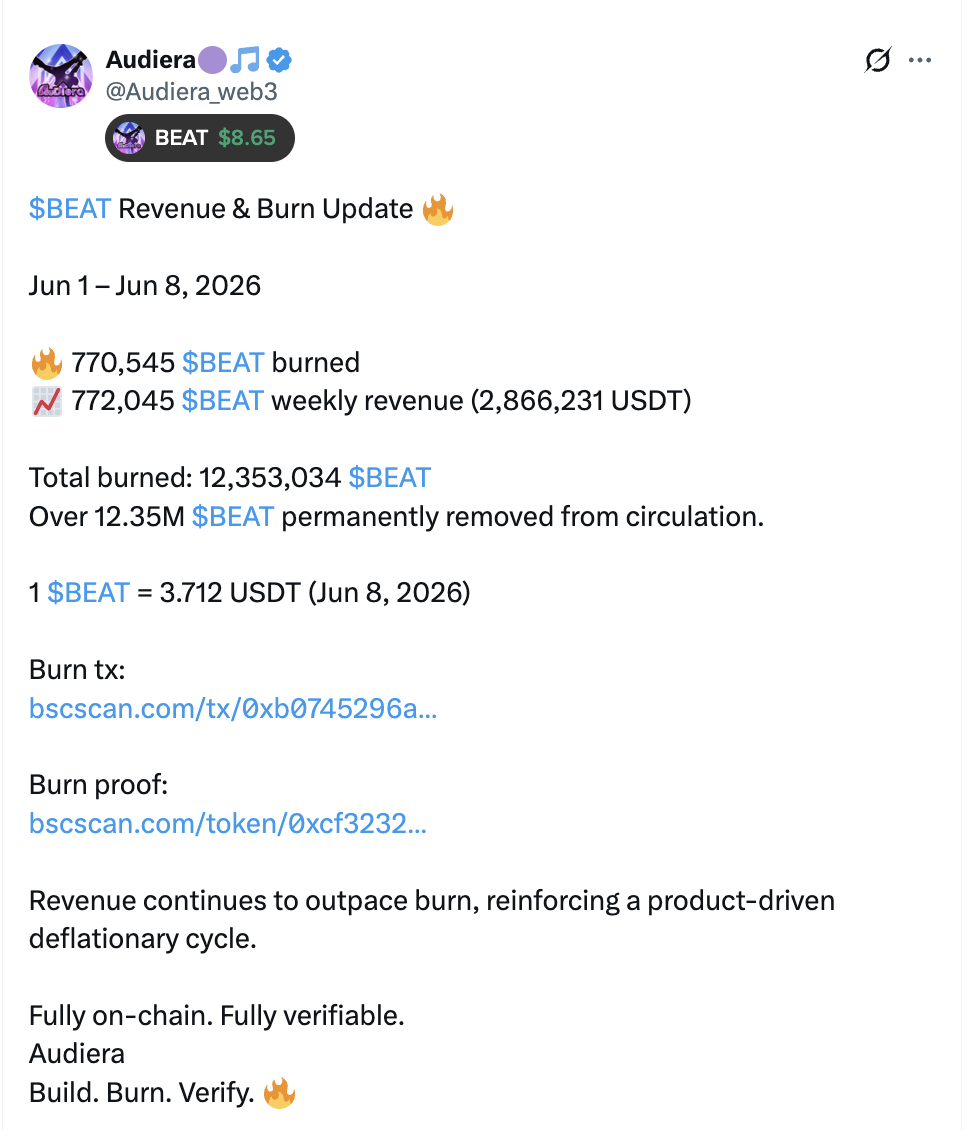
Source: X
Burns reduce BEAT’s available or future supply against its fixed 1 billion-token cap, strengthening the scarcity narrative when demand is rising.
This resembles Hyperliquid’s HYPE token economics, which have seen 120% price gains so far in 2026.
Related: Hyperliquid bear turns bullish after losing over $46M shorting HYPE
However, Hyperliquid has already shown strong product-market fit in perpetual trading, while Audiera’s model remains newer and less tested. That leaves BEAT vulnerable to sharp profit-taking if revenue slows, burn activity weakens, or speculative demand cools.
Short squeeze helps fuel BEAT rally
BEAT’s rally has received a strong boost from derivatives liquidations, particularly from traders betting against higher prices.
Since May, BEAT has seen $28.72 million in short liquidations, compared with $13.74 million in long liquidations. That means bearish traders lost more than twice as much as bullish traders during the rally.
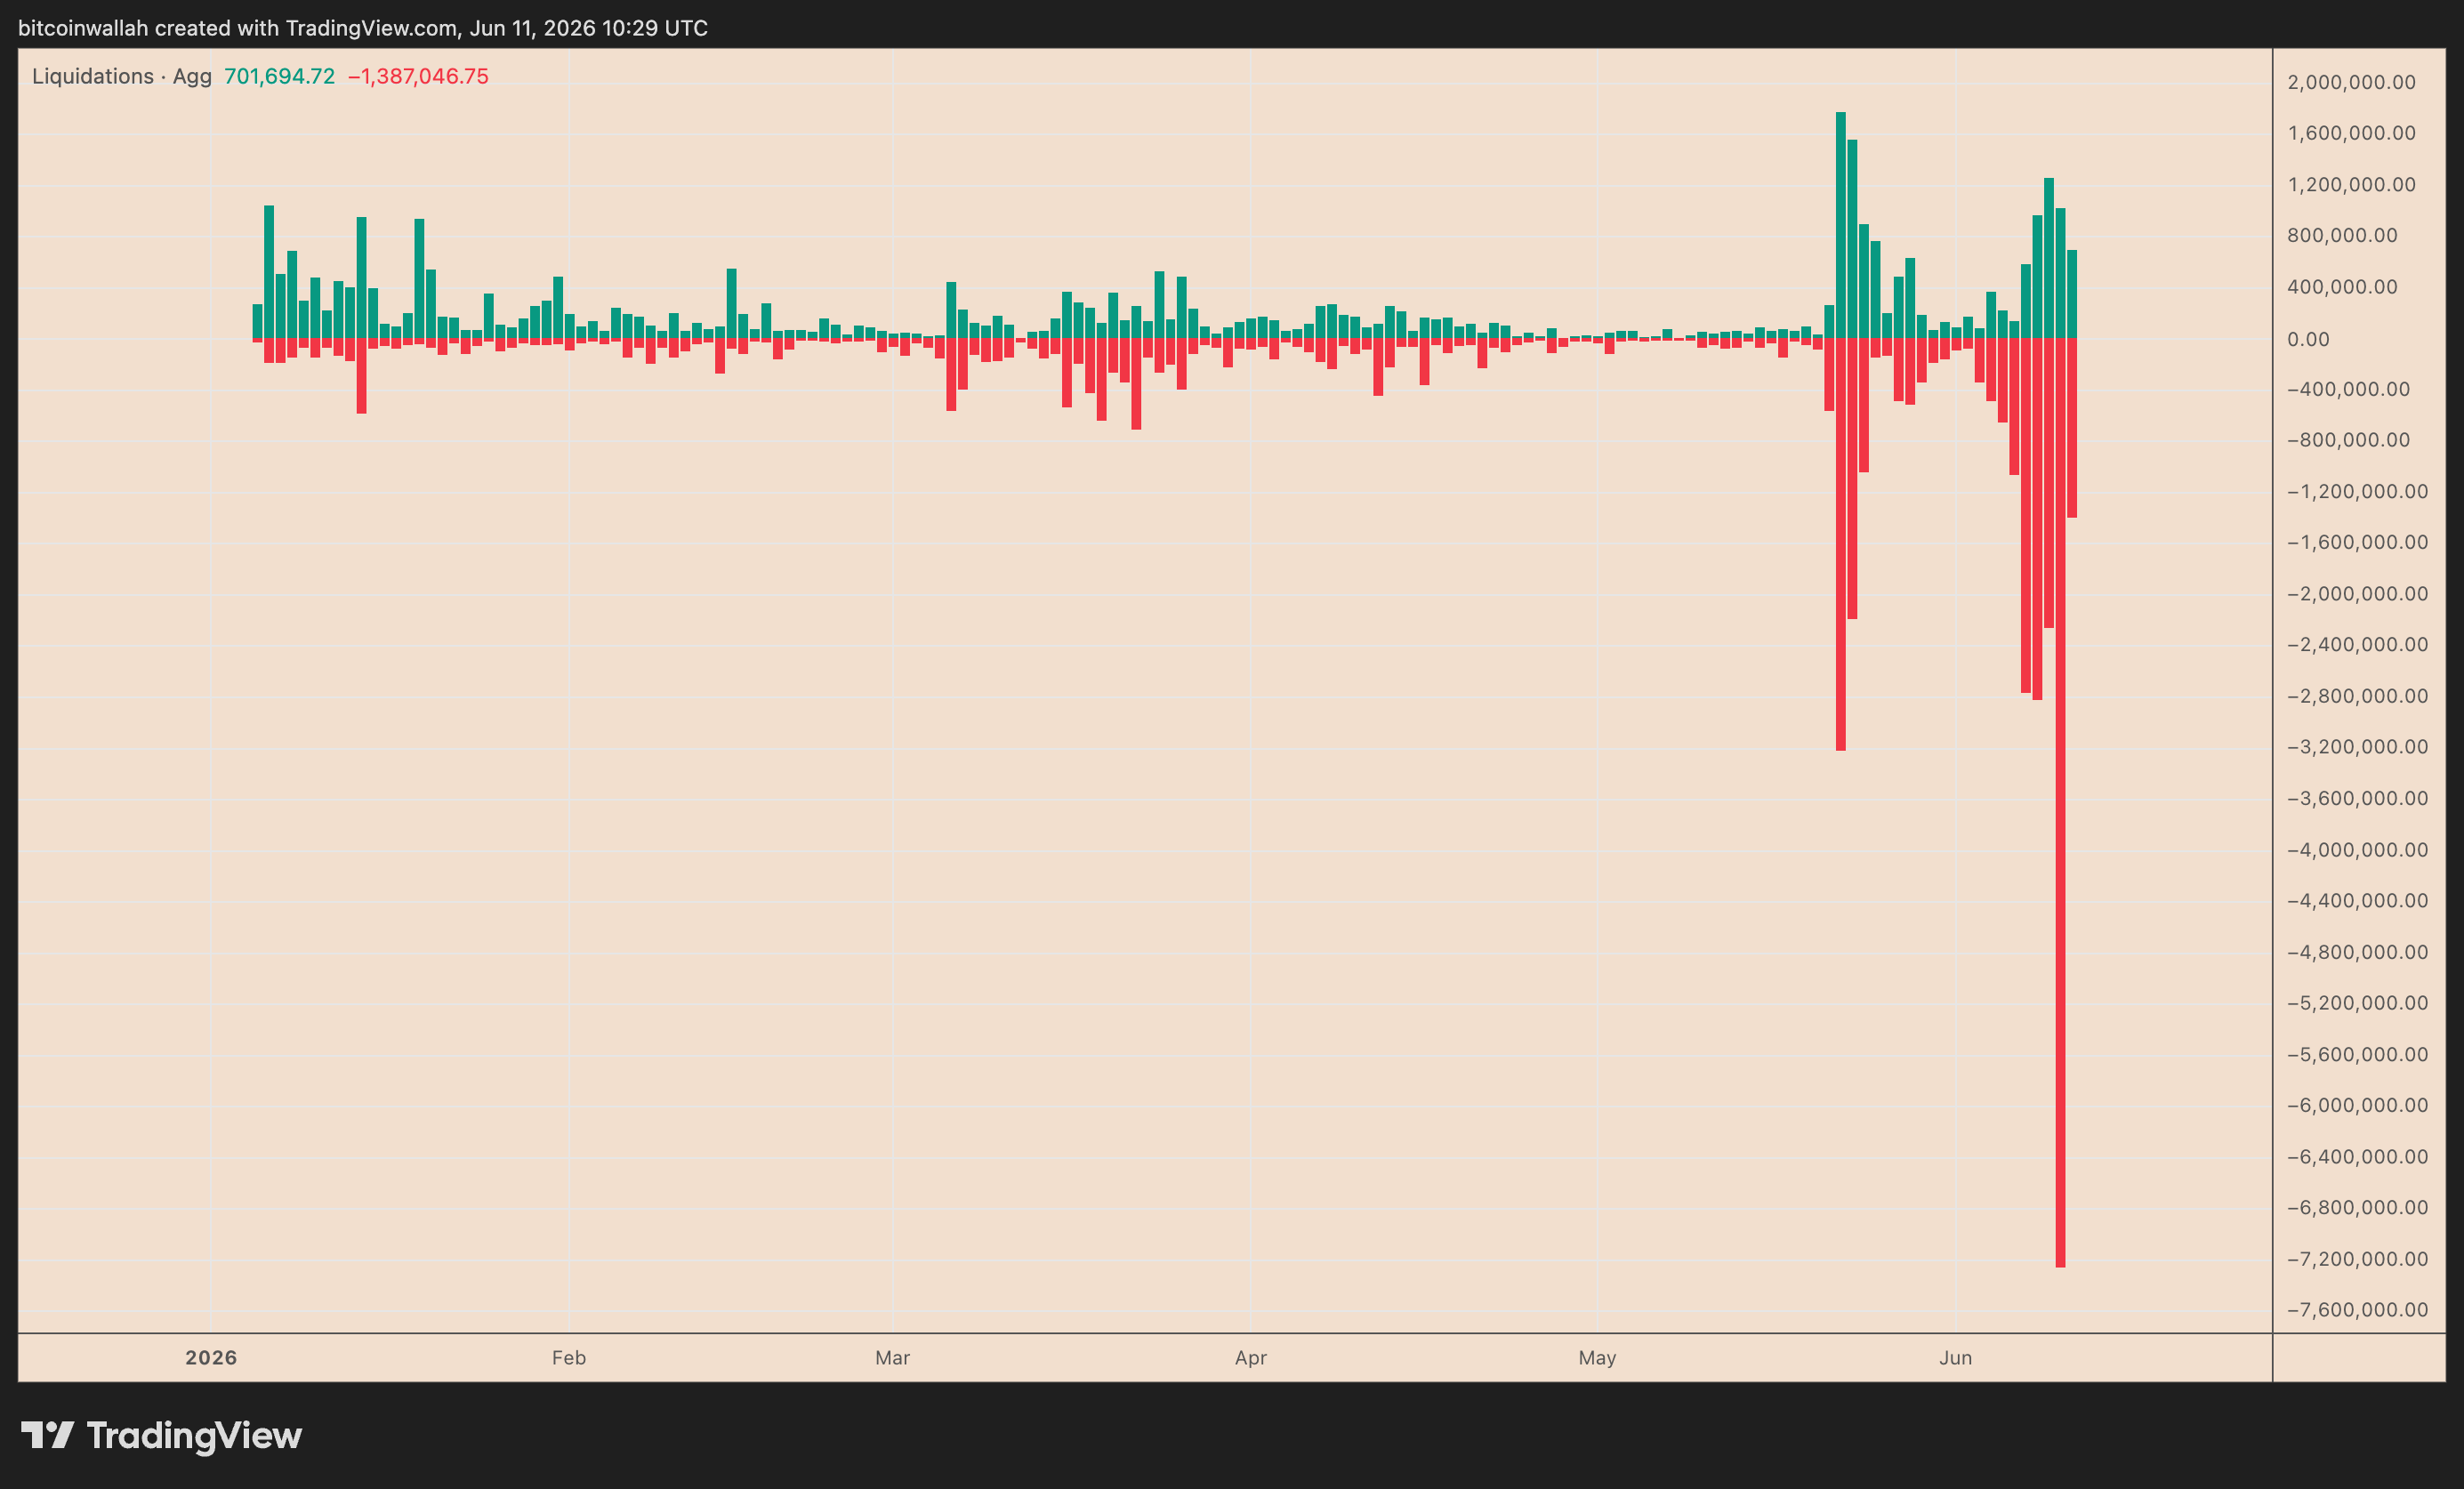
BEAT’s daily aggregated liquidation bar chart. Source: TradingView
This imbalance points to a classic short squeeze. As the BEAT price kept rising, traders holding short positions were forced to close their bets. Since closing a short position requires buying back the token, those liquidations added more upward pressure to the price.
That helped turn BEAT’s rally from a strong uptrend into a vertical move.
However, it also means part of the surge came from forced buying rather than steady spot demand. Once short-liquidation pressure fades, BEAT may need fresh buyers to keep the rally going.
BEAT price may decline 35% in June
BEAT’s price explosion over the past month has made its relative strength index (RSI), which gauges momentum, the most overbought on record.
As of Thursday, BEAT’s daily RSI reading was 96.87, way above its overbought threshold of 70. In other words, the Audiera token’s rally remains vulnerable to a sharp pullback if buyers lose momentum or early investors start booking profits.
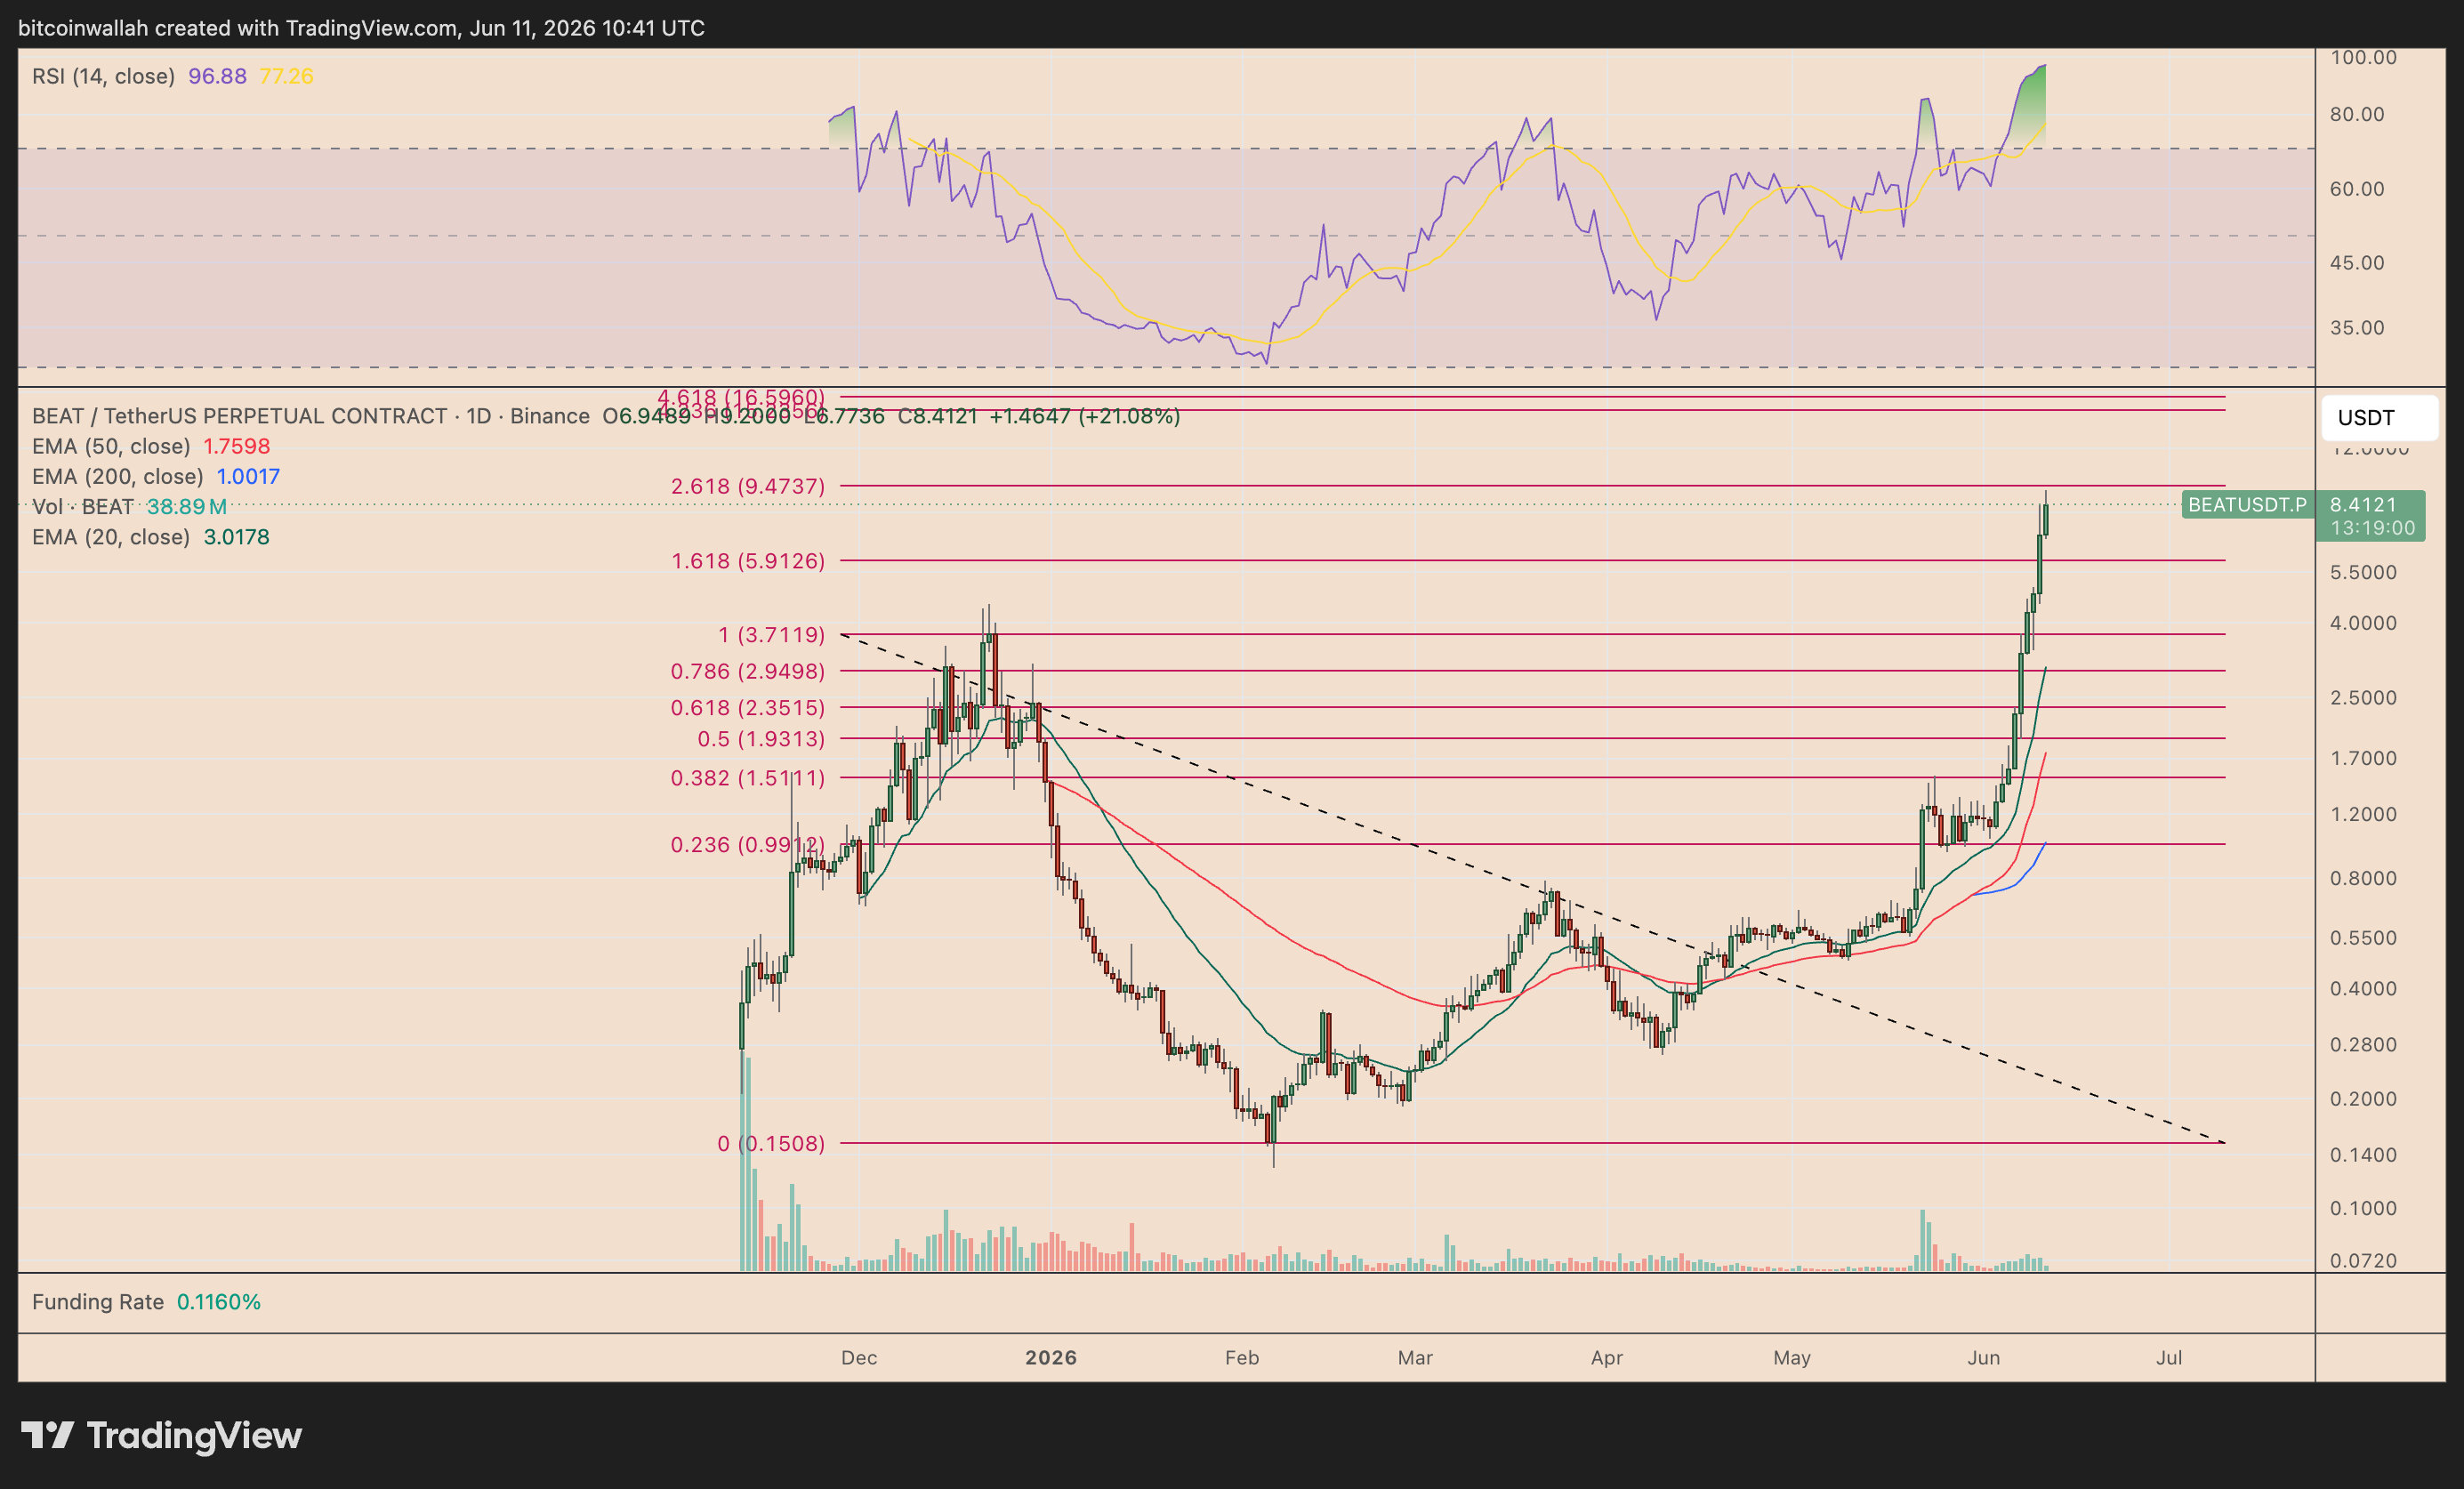
BEAT/USDT daily price chart. Source: TradingView
A decisive pullback from the $9.47 resistance level, which aligns with the 1.618 Fibonacci retracement line, increases the odds of BEAT falling toward the 1.0 Fib line at around $3.71, down roughly 35% from the current price, in June.
Conversely, a clear breakout above the $9.47 resistance level raises BEAT’s potential to rise toward its 4.236 Fib line above the $15 mark in the coming weeks.

Boyfriend Gets Caught Spending Money on TINDER

Support for Yorkshire domestic abuse victims during World Cup

Chewy: Top Value Near 52-Week Lows


-

 Fashion6 days ago
Weekend Open Thread: Evereve – Corporette.com
-
 Crypto World7 days ago
Jensen Huang Approves Samsung, SK Hynix, and Micron for NVIDIA (NVDA) HBM4 Memory Supply
-

 Crypto World4 days ago
Anatomy of the June crypto crash: Fed, Iran, Saylor
-
 Entertainment5 days ago
The Best Mystery Series of All Time Is Surging on Streaming 30 Years After It Ended
-

 NewsBeat4 days ago
Alexander Zverev wins the French Open to finally earn a 1st Grand Slam title
-

 Tech6 days ago
Suspicious Polyfill login prompts pop up on Toshiba, Muji websites
-
 Crypto World5 days ago
Senator Cynthia Lummis Calls CLARITY Act the Most Consequential Financial Legislation of This Generation
-

 Tech7 days ago
Microsoft launches MXC, an OS-level sandbox for AI agents, with OpenAI and Nvidia already on board
-

 Tech5 days ago
Microsoft unveils seven homegrown AI models in new bid for ‘long term self-sufficiency’
-

 Business7 days ago
(VIDEO) Justin Bieber Delivers Surprise Happy Birthday Serenade to Diners at Los Angeles Mexican Restaurant
-
 NewsBeat4 days ago
Alexander Zverev conquers demons and outlasts Flavio Cobolli to win French Open for first major title
-
 Business5 days ago
The Pain Points Taking a Fragile Tech Rally Down a Notch
-

 Business4 days ago
High Stakes for Wembanyama as New York Pushes for 3-0 Lead
-
 Crypto World4 days ago
Eli Lilly (LLY) Stock Surges 4% Following Breakthrough Sleep Apnea Trial Results
-

 Tech6 days ago
Von der Leyen’s AI envoy pick draws conflict-of-interest fire
-

 Tech6 days ago
Meta steals a tactic from Tesla and builds data centers in tents
-
Crypto World7 days ago
LBank Surpasses 25 Million Users Worldwide as AFA Partnership Continues to Drive Global Growth
-

 Tech6 days ago
Hackers now exploit SolarWinds Serv-U flaw to crash servers
-

 Crypto World5 days ago
Trump’s AI Ownership Plan Could Benefit Anthropic at OpenAI’s Expense
-
 Sports2 days ago
Bangladesh beat Australia after 20 years in ODIs, register only their second win over six-time world champions | Cricket News
You must be logged in to post a comment Login