
Crypto World
Bitcoin Could Slide to This Key Level Before Bounce


The exchange’s institutional desk highlights negative gamma exposure between $60,000 and $70,000, a setup that can amplify volatility.
Bitcoin’s brief rebound above $66,000 following U.S. President Donald Trump’s State of the Union address has done little to shift the underlying market structure, with fresh analysis from Coinbase Institutional pointing to a critical support zone near $60,000 that, if broken, could trigger accelerated selling.
The combination of options market dynamics and on-chain data suggests the path of least resistance remains lower, with any sustained recovery likely requiring a reclaim of $82,000, a level that currently stands as the first major hurdle to renewed upside momentum.
Options Market Points to Accelerated Downside Risk
Coinbase Institutional’s latest Bitcoin playbook introduced gamma exposure (GEX) as a lens for understanding how options dealers influence price action. According to the firm, when dealers hold positive gamma, their hedging tends to stabilize prices, selling into strength and buying into weakness. Negative gamma has the opposite effect, forcing dealers to buy as prices rise and sell as they fall, amplifying trends.
The current configuration shows a pronounced negative gamma band concentrated in the $60,000 to $70,000 region, with positive gamma pockets forming higher up near $85,000 and $90,000. This structure, per Coinbase, carries a specific implication: downside momentum into the $60,000 area could accelerate rapidly, while any advance toward $90,000 would likely grind and consolidate rather than break out cleanly.
Dense support sits near $60,000 based on historical market structure and volume profiles, while $82,000 represents the first significant resistance band. According to Coinbase’s market watchers, if Bitcoin fails to hold above $82,000 on approach, the lack of stabilizing gamma in that region suggests resistance may hold. By contrast, a break below $60,000 would occur in a negative gamma environment, meaning selling could feed on itself as dealers hedge in the direction of the move.
On-Chain Data Confirms Defensive Regime
Coinbase’s options-derived outlook matches up with deteriorating on-chain fundamentals. Yesterday, analyst Axel Adler Jr. noted that Realized Cap has declined for a second consecutive month, falling roughly $33 billion from its peak of $1.127 trillion in November 2025 to around $1.094 trillion. Furthermore, the 30-day Realized Cap Net Position Change is still negative, signaling ongoing capital outflows.
Separate data from Glassnode showed the 90-day moving average of the Realized Profit/Loss Ratio falling below 1, meaning more BTC is being sold at a loss than at a profit. According to the analytics platform, such regimes have historically persisted for months before liquidity conditions improved.
You may also like:
Meanwhile, sentiment tracker Santiment said on Wednesday that bullish commentary across X, Reddit, and Telegram has reached a four-week high following Trump’s State of the Union speech. However, the firm cautioned that elevated retail optimism and talk of a “bear cycle” ending have, in the past, coincided with stalled rallies.
Binance Free $600 (CryptoPotato Exclusive): Use this link to register a new account and receive $600 exclusive welcome offer on Binance (full details).
LIMITED OFFER for CryptoPotato readers at Bybit: Use this link to register and open a $500 FREE position on any coin!


A new security framework has been unveiled by the Solana Foundation to audit Solana-based protocols and strengthen risk monitoring.
Summary
- Solana Foundation introduced the STRIDE security framework to assess and monitor risks across DeFi protocols.
- A new incident response network has been set up to coordinate real-time threat intelligence and response efforts.
- The move follows recent exploits, including a $280 million loss at Drift Protocol.
According to the official announcement, the initiative was developed with Asymmetric Research and is called STRIDE. It is designed to assess and track the security of projects on Solana. The program sets a standard process to identify risks, monitor vulnerabilities, and escalate threats across the ecosystem.
Under STRIDE, protocols are evaluated across eight areas, including program integrity, governance controls, oracle dependencies, infrastructure setup, and operational practices. It also covers supply chain exposure, incident response readiness, and forensic capabilities tied to log management. Each participating protocol undergoes an independent review, with results disclosed publicly.
“This gives users, investors, and the broader ecosystem real transparency into the security posture of the protocols they interact with,” Asymmetric Research said.
Alongside STRIDE, the foundation unveiled the Solana Incident Response Network (SIRN), a coalition of security firms designed to coordinate real-time responses to active threats.
“Members will share threat intelligence, coordinate responses to active incidents, and contribute to the ongoing evolution of the STRIDE framework,” the foundation said in its statement.
Just days earlier, Drift Protocol suffered a $280 million exploit, which investigators linked to social engineering tactics tied to North Korean-affiliated actors.
Data from DefiLlama shows that over $168 million was stolen from 34 DeFi protocols in Q1 2026. While that figure is sharply lower than the $1.58 billion recorded during the same period in 2025, the persistence of attacks continues to highlight structural risks in decentralized finance.
While not explicitly referenced in the announcement, recent cases point to the increasingly complex tactics and the use of AI-driven tools to execute exploits. In January, Step Finance lost roughly $40 million after attackers leveraged automated agents to execute rapid transfers, amplifying the scale of the breach, according to reporting from KuCoin.
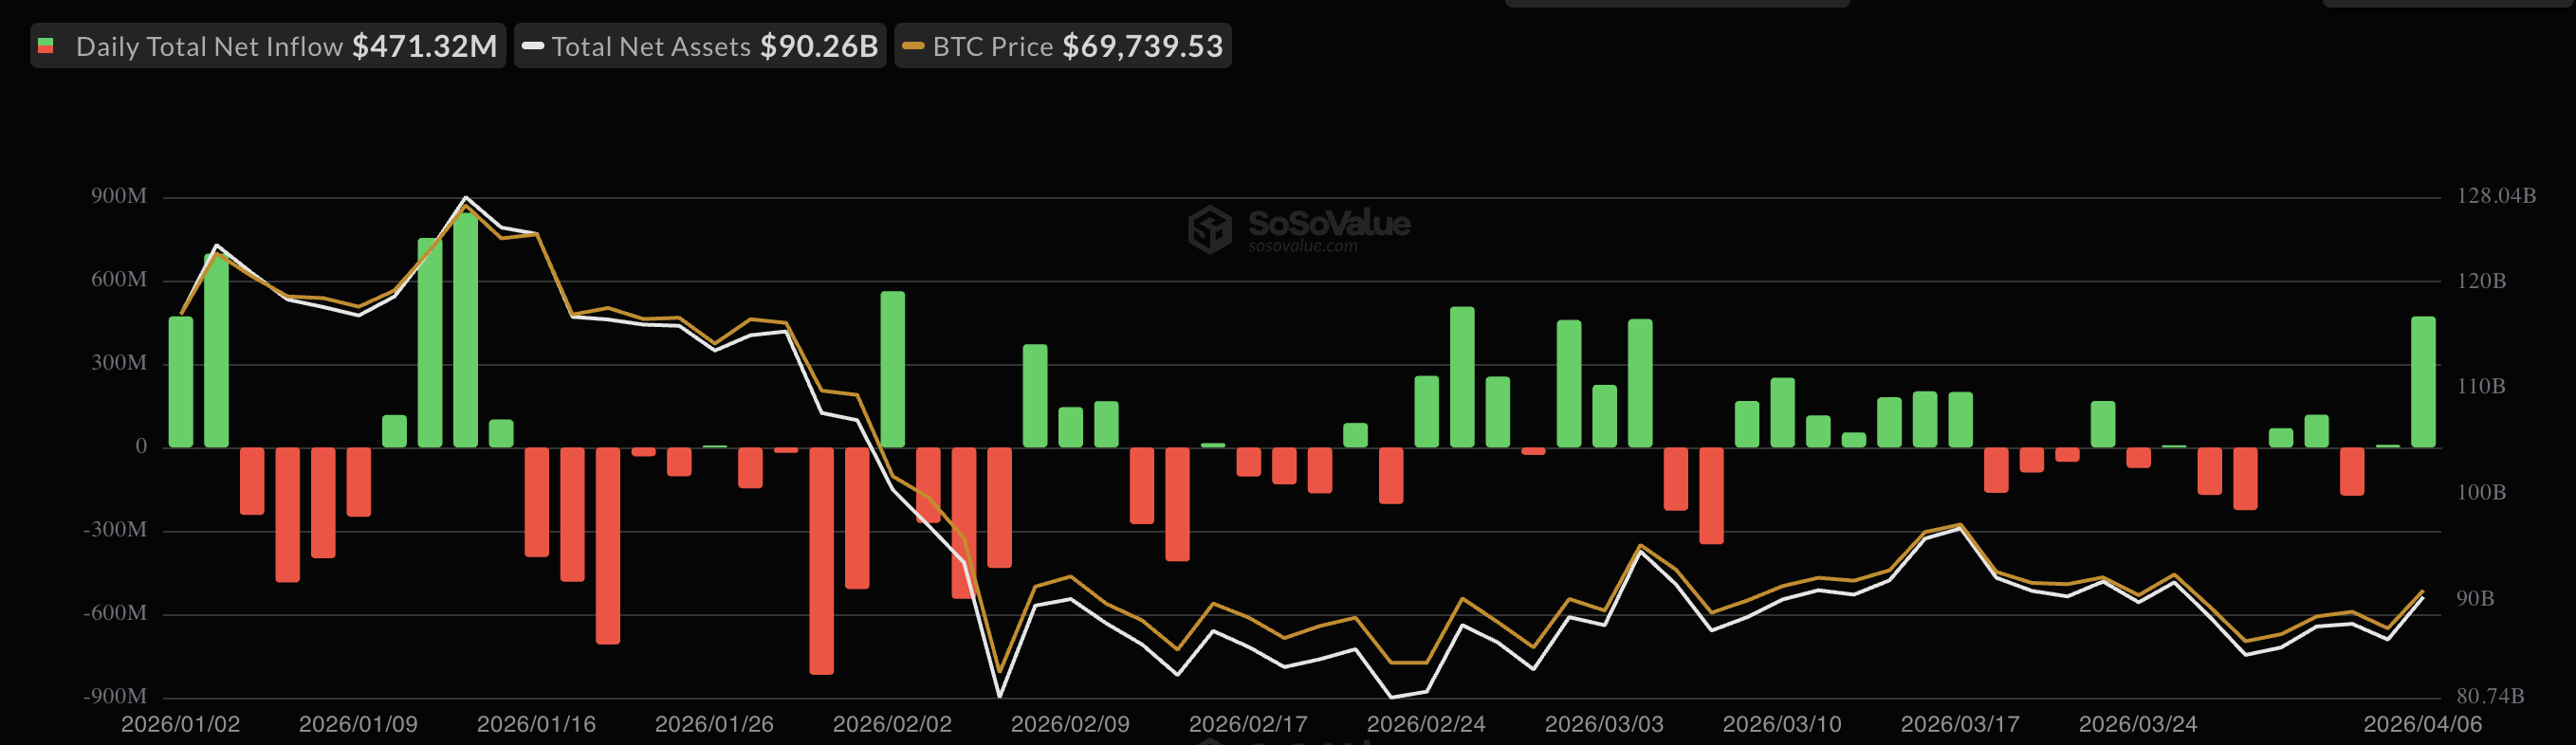
US-listed Bitcoin (BTC) exchange-traded funds (ETFs) recorded $471.32 million in net inflows on April 6, their strongest single day since February 25.
The surge lifted total cumulative net inflows to $56.43 billion. Not a single ETF posted negative flows on the day, with six registering zero and six finishing in positive territory.
Bitcoin ETF Inflows Clash With Weakening On-Chain Demand
According to data from SoSoValue, BlackRock’s iShares Bitcoin Trust (IBIT) led with $181.89 million, followed by Fidelity’s Wise Origin Bitcoin Fund (FBTC) at $147.32 million and Ark & 21Shares’ ARKB at $118.76 million. Together, the three funds accounted for roughly 95% of the inflows on April 6.
Grayscale’s mini BTC trust added $17.59 million, Bitwise’s BITB contributed $3.79 million, and VanEck’s HODL recorded $1.97 million.
Follow us on X to get the latest news as it happens
The strong ETF day arrived against a deteriorating on-chain backdrop. CryptoQuant data shows 30-day apparent demand fell to approximately -87,600 BTC by April 5.
“The situation continues to deteriorate, even though Bitcoin is still managing to remain within its current range. As long as this dynamic does not improve, Bitcoin will likely struggle to break out of this rather negative environment,” analyst Darkfost noted.
Wallets holding 1,000–10,000 BTC have flipped to net distribution, with 1-year holdings swinging from roughly +200,000 BTC at the 2024 peak to about -188,000 BTC. The shift represents one of the most aggressive distribution cycles on record, according to the analytics firm.
Meanwhile, spot Ethereum (ETH) ETFs also saw renewed interest. The funds attracted $120.24 million in net inflows on April 6, the highest single-day total since March 17’s $138.25 million. The inflow snapped a short red stretch in which ETH products posted outflows on two previous trading sessions.
Subscribe to our YouTube channel to watch leaders and journalists provide expert insights
The post Spot Bitcoin ETFs Post Strongest Day Since Late February as $471 Million Pours In appeared first on BeInCrypto.
Key Takeaways
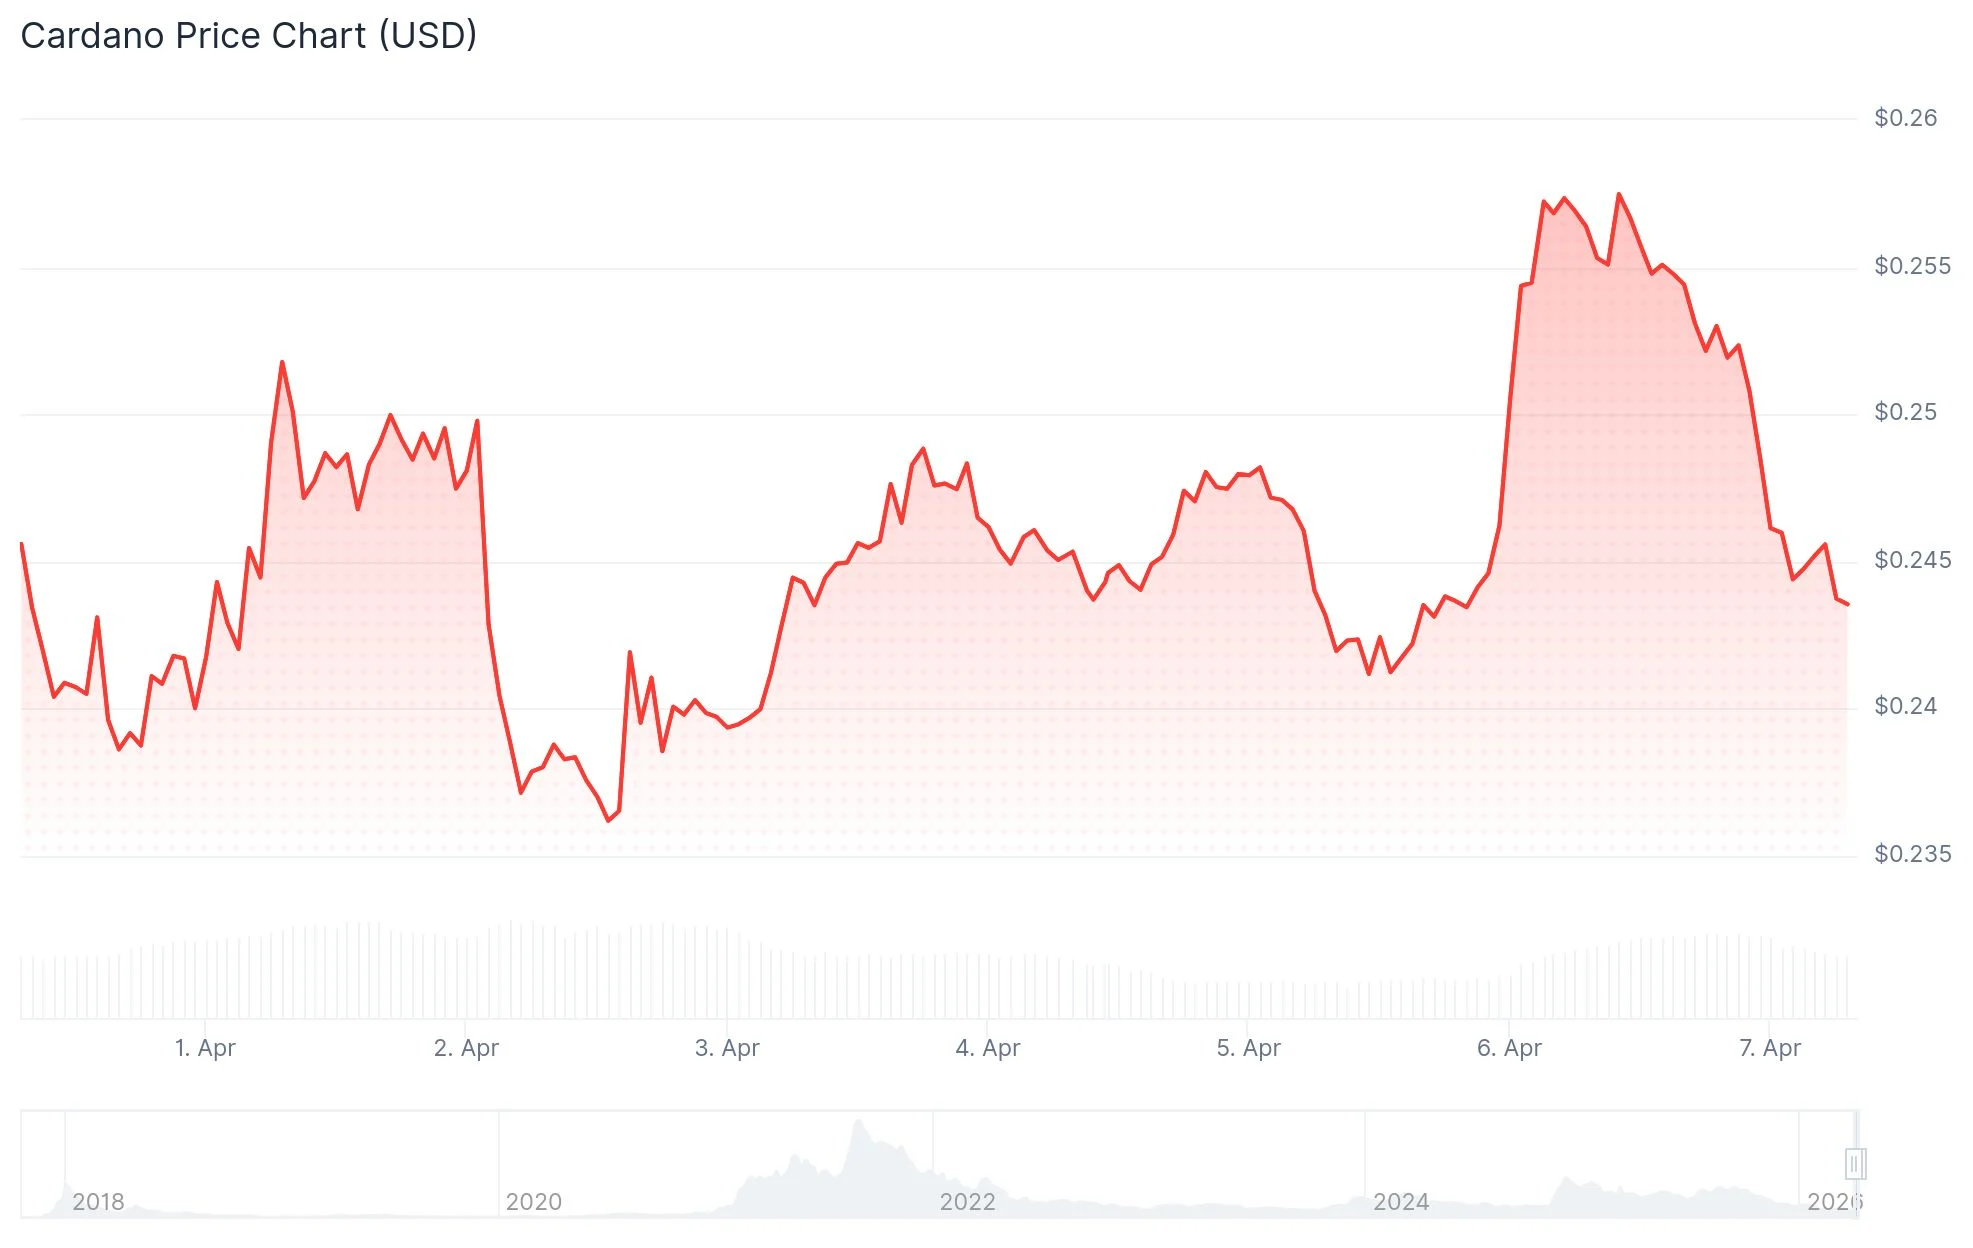
- Cardano is struggling to maintain levels above $0.25 following an unsuccessful rebound effort, with selling pressure persisting throughout the week.
- Derivatives market open interest contracted by approximately 8% over a 24-hour period, accompanied by $701,830 in long position liquidations.
- The open interest-weighted funding rate shifted into negative territory at -0.0132%, indicating short position preference among traders.
- Major holder wallets containing over 10 million ADA tokens climbed to 424, marking a four-month peak and representing a 5% increase over nine weeks.
- Critical price support level identified at $0.2328, while the 50-day exponential moving average presents resistance at $0.2681.
Cardano (ADA) faces continued selling pressure this week, remaining stuck below the $0.25 threshold amid widespread cryptocurrency market turbulence. An early-week attempt at recovery quickly faded, pushing the token back into negative territory.
Early in the week, ADA managed to push toward $0.2546, registering a 5.42% intraday increase alongside a dramatic surge in trading activity that exceeded 100%, bringing volume to $515.84 million. Unfortunately, this upward movement proved short-lived.
Market observer Alpha Crypto Signal identified a falling wedge breakout on the 4-hour timeframe, with ADA successfully reclaiming its descending resistance line and near-term moving averages. According to the analyst, sustained momentum could drive prices toward the $0.27–$0.29 range, though inability to defend the breakout zone risks invalidating the bullish pattern.
Futures Market Data Reflects Near-Term Pessimism
Derivatives metrics from CoinGlass reveal that ADA futures open interest declined by roughly 8% to reach $401.35 million during the past day. Combined liquidations totaled $1.10 million, with long traders absorbing the majority at $701,830.
The funding rate metric weighted by open interest has fallen to -0.0132%, indicating that market participants are willing to pay for maintaining short exposure. This dynamic reflects prevailing bearish sentiment among derivatives traders.
Market analyst UniChartz emphasized the $0.23–$0.24 price range as a critical demand zone, observing that this region has previously catalyzed significant rallies. Should buyers successfully protect this floor, the initial resistance target stands at $0.45.
Major Holders Increase Positions to Multi-Month Peak
Blockchain analytics from Santiment demonstrate that addresses holding more than 10 million Cardano tokens have expanded to 424, representing the highest count in four months. This reflects growth exceeding 5% throughout the previous nine-week period.
Such accumulation activity during price weakness typically suggests institutional or high-net-worth investors anticipate future appreciation over extended timeframes.
The Relative Strength Index currently hovers near 44, while the Moving Average Convergence Divergence indicator has edged into positive territory close to the baseline. These technical indicators point toward tentative stabilization without confirming a definitive trend change.
Near-term price support rests at $0.2328, corresponding to the March 29 bottom. A violation of this floor could expose the February 5 low at $0.2205. Conversely, reclaiming the 50-day exponential moving average positioned at $0.2681 would open the path toward $0.2992.


TLDR
- The Third Circuit Court of Appeals delivered a 2-1 decision preventing New Jersey from applying its gambling regulations to Kalshi’s platform
- Federal Commodity Exchange Act provisions were determined to supersede state-level gambling regulations for sports-event prediction contracts
- The CFTC maintains it has sole regulatory authority over prediction markets, classifying event contracts as swaps under federal law
- Federal courts nationwide are delivering inconsistent judgments, with the Third Circuit supporting Kalshi while the Ninth Circuit backs Nevada’s position
- The CFTC launched lawsuits against Arizona, Connecticut, and Illinois in recent weeks to prevent state-level regulation of prediction markets
A United States federal appeals court has prevented New Jersey regulators from closing down Kalshi’s sports-focused prediction markets, determining that federal regulatory frameworks hold precedence over state gambling legislation.
On Monday, the US Court of Appeals for the Third Circuit issued a 2-1 decision supporting Kalshi, the prediction market operator. The panel determined that New Jersey gaming regulators lacked authority to pursue enforcement measures against the platform.
According to the judges, Kalshi’s sports-focused event contracts fall under federal Commodity Exchange Act jurisdiction. This classification means state gambling statutes cannot govern these activities.
“Kalshi self-certified compliance with the applicable laws and regulations, so those event contracts were presumptively approved under federal law,” the majority ruling said.
The panel emphasized that the CFTC has neither deemed Kalshi’s sports-related contracts contrary to public welfare nor initiated any enforcement proceedings against the company.
In a statement posted on X, Kalshi CEO Tarek Mansour described the decision as “a big win for the industry and millions of users.”
Circuit Judge Jane Roth issued a dissenting opinion, characterizing Kalshi’s offerings as “sports gambling” that are “virtually indistinguishable” from products available on traditional sports betting platforms. She referenced contracts involving NFL game outcomes, point spreads, and scoring totals as evidence.
A Patchwork of Conflicting Court Rulings
Government authorities throughout the United States have initiated legal challenges and issued cease-and-desist directives targeting prediction market operators, including Kalshi and Polymarket. State officials contend these platforms breach state gambling statutes.
Judicial outcomes have varied significantly. While Monday’s Third Circuit judgment supports Kalshi, the Ninth Circuit refused last month to prevent Nevada from obtaining a temporary restraining order against the identical company.
A Nevada state judge also prolonged restrictions on Kalshi only days prior to Monday’s appeals court decision. Another Ninth Circuit proceeding involving several platforms is scheduled for later this month.
CFTC Pushes Back Against State Regulators
Since assuming leadership, CFTC Chair Michael Selig has prioritized prediction market oversight. He maintains the CFTC possesses “exclusive jurisdiction” over event-based contracts.
The previous week, the CFTC initiated legal action against Arizona, Connecticut, and Illinois to block what it characterized as unauthorized state attempts to govern prediction markets.
During remarks at Vanderbilt University on Monday, Selig explained that the agency’s commodity definition is comprehensive and treats sports events, political outcomes, and conventional commodities like corn and grains under the same regulatory umbrella.
The CFTC additionally submitted an amicus brief articulating its position to the Ninth Circuit before next week’s scheduled hearing.
The jurisdictional dispute between state and federal authorities regarding prediction market regulation continues, with numerous cases advancing through the judicial system concurrently.
Key Points
- Senator Bill Hagerty anticipates the CLARITY Act will advance to the Senate Banking Committee during April
- The legislation aims to transfer primary crypto regulation from the SEC to the CFTC
- Disagreements over stablecoin yield provisions have caused delays, but recent discussions suggest a breakthrough
- Senate Banking Committee Chairman Tim Scott hasn’t announced a markup session date
- Polymarket traders estimate a 63% probability of Trump enacting the legislation in 2025
During remarks at the Digital Assets and Emerging Tech Policy Summit held at Vanderbilt University on Monday, Senator Bill Hagerty projected that the CLARITY Act would proceed through the Senate Banking Committee over the coming weeks, establishing an April timeframe for the landmark crypto regulation bill.
Hagerty expressed optimism that the legislation could successfully navigate the banking committee before April concludes, provided that lingering concerns are addressed satisfactorily.
“There’s still a lot more work to do,” Hagerty acknowledged, though he emphasized that none of the remaining challenges were “insurmountable.”
The CLARITY Act secured House passage in July under its current title. Senate progress has been hindered by disputes surrounding stablecoin interest payments, ethical considerations, and resistance from certain cryptocurrency industry factions.
The proposed legislation would reallocate crypto market oversight responsibilities primarily from the Securities and Exchange Commission to the Commodity Futures Trading Commission. Given both regulatory bodies’ involvement, the bill requires endorsement from the Senate Agriculture Committee as well as the Senate Banking Committee.
The Agriculture Committee moved its iteration of the bill forward in January. The Banking Committee must still conduct a markup session before the legislation can advance to a full Senate floor vote.
Progress Emerges on Stablecoin Yield Standoff
The debate over stablecoin yield mechanisms has represented the most significant obstacle. Cryptocurrency firms, notably Coinbase, had raised objections to previous language that imposed sweeping restrictions on stablecoin reward programs.
Sources from both the crypto and banking sectors informed Crypto in America last week that representatives from both industries examined revised stablecoin yield provisions and express cautious optimism about reaching consensus. The specific wording of the updated language remains confidential.
Paul Grewal, Chief Legal Officer at Coinbase, expressed confidence that an agreement would materialize. He indicated to reporters last week that legislators were “close to a deal” on outstanding matters.
Committee Markup Timing Remains Uncertain
Senate Banking Committee Chairman Tim Scott hasn’t established a timeline for the markup session. The committee has also remained silent on whether it intends to publish a revised draft for public review.
Pro-cryptocurrency Senator Cynthia Lummis has suggested a markup could occur this month. However, pro-XRP attorney and Senate candidate John Deaton cautioned that delays extending into summer would likely redirect Congressional attention toward midterm election campaigns, potentially dooming the bill.
Hagerty recognized the political timeline pressure. “If we get this done in April, we can clearly get this taken care of before the midterms,” he stated.
Cryptocurrency-focused political action committees are mobilizing for 2026 campaigns. Fairshake disclosed a $193 million fundraising total designated for the November midterm elections. The Fellowship PAC, which claims to have secured more than $100 million from crypto-supportive donors, announced Tether executive Jesse Spiro as its new chairman this week.
Polymarket trading currently indicates 63% probability of Trump signing the CLARITY Act into law during 2025, although those odds temporarily declined to 50% in recent trading.
A New Yorker investigation accuses OpenAI CEO Sam Altman of systematic deception, drawing direct comparisons to Sam Bankman-Fried (SBF) and Bernie Madoff from senior Microsoft executives.
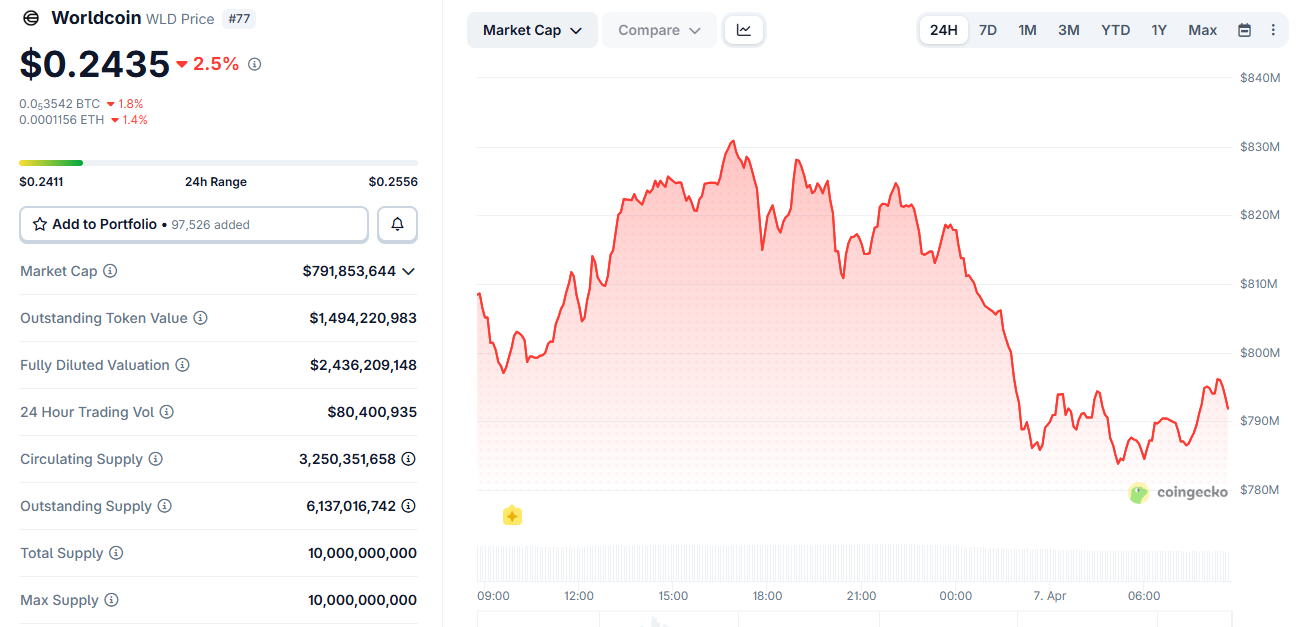
Worldcoin (WLD), the crypto project Altman co-founded, fell 2.9% to $0.2432 as the revelations hit social media. The token is down over 10% in the past seven days.
The SBF Shadow Over Sam Altman
The 15,000-word article by Ronan Farrow and Andrew Marantz draws on interviews with over 100 people. An unnamed OpenAI board member described Altman’s behavior in stark terms.
“He has two traits that are almost never seen in the same person. The first is a strong desire to please people, to be liked in any given interaction. The second is almost a sociopathic lack of concern for the consequences that may come from deceiving someone,” wrote The New Yorker, citing an OpenAI Board Member.
Multiple senior Microsoft executives allegedly told the reporters that OpenAI’s CEO had repeatedly misrepresented agreements and reneged on deals.
One said there was a real chance Altman would be remembered alongside Madoff or SBF as a major financial fraud.
Katie Miller amplified the comparison on X (Twitter), arguing that those who worked closest with Altman, including Elon Musk and Anthropic CEO Dario Amodei, consistently flagged him as dishonest.
Elon Musk responded to the story by writing that Altman is “not who you want in charge of superintelligence.”
OpenAI’s Financial Cracks Widen
The exposé lands during an already turbulent period for OpenAI. CFO Sarah Friar reportedly told colleagues the company is not ready for its planned 2026 IPO.
Based on reports, she warned that slowing revenue growth may not sustain spending of over $600 billion on committed servers through 2030.
Altman has responded by excluding Friar from key financial discussions, according to The Information.
Since August 2025, she no longer reports directly to him. This structural shift raises governance questions ahead of what could be one of the largest IPOs in history.
What This Means for Worldcoin
WLD now trades at $0.2432 with a market cap of roughly $790 million. The token faces additional supply pressure from a major cliff unlock on July 23, releasing 52.5% of the total supply.
Altman’s credibility is not just a corporate governance issue. It directly affects investor confidence in every project tied to his name.
With Worldcoin already near all-time lows, the convergence of founder risk and token dilution creates a challenging environment for holders watching the SBF comparisons gain traction.
The post Worldcoin Prices Dips As Sam Altman’s Trust Crisis Deepens With New SBF Comparison appeared first on BeInCrypto.


Progress on a potential crypto safe harbor framework is now entering a key regulatory phase as it is up for White review.
Summary
- SEC has submitted its crypto safe harbor proposal to the White House for review ahead of public release.
- Framework introduces startup and fundraising exemptions along with a pathway for assets to exit securities classification.
US Securities and Exchange Commission Chair Paul Atkins said the agency’s proposed “Regulation Crypto Assets” package has been submitted to the Office of Information and Regulatory Affairs, placing it under White House review ahead of publication.
“We will have reg crypto that we will be proposing here shortly. It’s in fact at OIRA right now, which is the next step before being published,” Atkins said during remarks at the Digital Assets and Emerging Technology Policy Summit.
The regulatory process now moves through OIRA review before publication in the Federal Register, where it will be opened for public comment. That stage often determines how proposals are adjusted before any final adoption.
As previously reported by crypto.news, Atkins first detailed plans for the framework earlier this month. The proposal outlines a three-part framework designed to address how crypto projects raise capital and transition out of securities classification.
One component introduces a startup exemption, allowing early-stage ventures to raise funds over a four-year period with lighter disclosure requirements. Another creates a fundraising exemption that permits issuers to raise capital within a 12-month window while maintaining access to other registration exemptions under federal securities laws.
A central feature of the package is an investment contract safe harbor. Under this approach, certain digital assets could fall outside securities classification once project teams step back from managerial roles that were previously promised or implied during fundraising.
Atkins indicated that parts of the framework are still being refined, with the SEC seeking industry input to ensure the rules are workable in practice. Additional elements, including exemptive relief and safe harbor protections, are being built into the proposal as the agency shapes the final structure.
Meanwhile, the commission, led by Paul Atkins, has also stepped up efforts to ease its enforcement-first approach and clarify other parts of the crypto market.
The SEC has signed a Memorandum of Understanding with the Commodity Futures Trading Commission. Both agencies have agreed to eliminate any friction that could hamper rule-making in the future.
Lawmakers are also negotiating whether the Digital Asset Market Clarity Act should allow stablecoin yields.
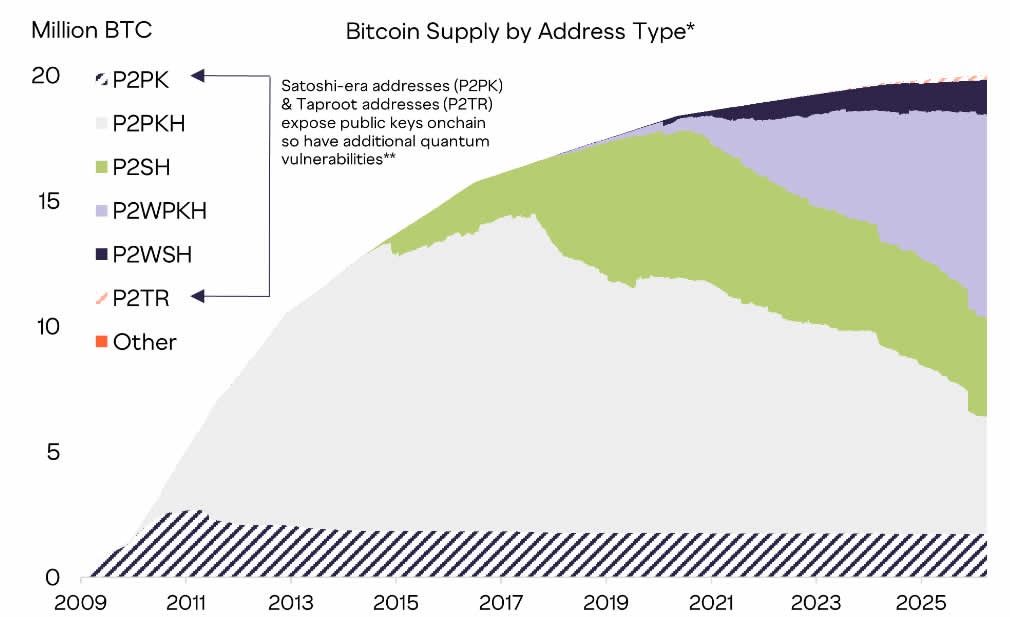
The challenge to solving the quantum threat to Bitcoin could be more social than technical, according to Grayscale’s head of research, especially if the community fails to come to an agreement on certain contentious issues.
Google released a paper that shook the crypto industry on March 30, suggesting that a quantum computer could potentially crack the cryptography protecting Bitcoin (BTC) using far fewer resources than previously thought.
Grayscale head of research Zach Pandl, however, suggested the problem for Bitcoin doesn’t come from its technical solution, as “bitcoin has lower risk than other cryptocurrencies” because it uses a UTXO model and proof-of-work consensus, does not have native smart contracts and certain address types are not quantum vulnerable.
Instead, the challenge would be for the community to reach a decision on the way forward, said Pandl.
The Bitcoin community has been fiercely debating what to do about old dormant coins, particularly the roughly 1.7 million BTC locked in early P2PK addresses, including Satoshi’s estimated 1 million BTC stash, currently worth about $68 billion.
The Bitcoin community has three options
The Bitcoin community needs to decide what to do about coins where the private key has been lost or is otherwise inaccessible, wrote Pandl.
They have three main options: burning the coins, deliberately slowing their release by limiting the rate of spending from vulnerable addresses or doing nothing.
“All are conceptually doable, but the challenge is reaching a decision, and the Bitcoin community has a history of contentious debates over protocol changes, including last year’s dispute around image data stored in blocks.”
Pandl was referring to a big fracas that erupted in 2023 over the use of blockspace for Bitcoin Ordinals, technology that enables inscribing data such as text and images to a satoshi, the smallest unit of Bitcoin.
Two years later, the debate may have quietened down, but the two sides continue to hold opposing views.
Related: Researchers say quantum computers could, in theory, be ready by 2030

No threat now but time to get started
Pandl cautioned that it was “time to get started” and that blockchains need to adopt post-quantum cryptography, echoing the sentiment from Google.
Both Solana and the XRP Ledger are already experimenting with post-quantum cryptography, wrote Pandl. Meanwhile, the Ethereum Foundation released its post-quantum roadmap in February.
Pandl concluded that investors “should not fret” for now, but it is time to accelerate efforts to prepare for our post-quantum future.
“In our view, there is no security threat to public blockchains from quantum computers today.”
Magazine: Nobody knows if quantum secure cryptography will even work
Indonesia’s courts are increasingly accepting on-chain evidence as a legitimate basis for terrorism-financing prosecutions, marking a notable shift in how blockchain data is treated in legal proceedings. In cases resolved in 2024 and 2025, authorities relied on wallet addresses, transaction histories, and on-chain flows to build the narrative of illicit funding, a development highlighted by TRM Labs as a sign that crypto traces are becoming a cornerstone of prosecutorial work.
“Indonesian courts have demonstrated that cryptocurrency evidence — wallet addresses, transaction histories, on-chain flows — is not only admissible but can anchor a terrorism financing prosecution,” said TRM Labs in a statement. The firm adds that these cases reflect a broader trend in which regulators and law-enforcement agencies are nearing parity with traditional financial channels when pursuing illicit financing.
TRM noted that terrorism-financing networks have increasingly used cryptocurrency as a movement mechanism, partially because authorities have historically scrutinized fiat channels more intensively. However, the framework is evolving, with courts and investigators reportedly closing the gap between digital traces and real-world consequences.
In Indonesia, one defendant allegedly sent more than $49,000 in USDt across 15 transactions from a domestic exchange to a foreign platform, with funds later routed to an ISIS-linked fundraising campaign in Syria, according to blockchain analytics cited by TRM Labs. The tracing work was conducted by Indonesia’s financial intelligence unit and the counterterrorism police unit, Densus 88, who presented the findings to the courts. The blockchain data was deemed a pivotal piece of evidence in each of the three cases.
TRM Labs emphasized that the Indonesian case underscores a broader Southeast Asian push to harness blockchain intelligence in criminal investigations, as authorities increasingly view crypto-forensics as a critical enforcement tool.
“Similar patterns are emerging across Southeast Asia, where governments are investing in blockchain intelligence capabilities and enhancing collaboration between public and private sectors to address illicit finance risks.”
Beyond Indonesia, regional authorities are building capacity to trace cryptocurrency flows. TRM noted that Singapore and Malaysia’s financial-intelligence units and law-enforcement agencies are expanding technical capabilities to follow crypto activity across borders, reflecting a growing regional emphasis on digital-forensics as part of anti-financial-crime strategies.
These developments sit against a broader backdrop of regional enforcement and cases that illustrate the expanding role of crypto-tracing tools in Southeast Asia. In April, Cambodian and Chinese authorities extradited Li Xiong, a leader of the Huione Group, to China to face fraud and money-laundering charges connected to the organization’s scam operations. The move followed the earlier arrest of Chen Zhi, the head of Prince Group, which operates the Huione network. Separately, TRM’s data from 2025 showed a surge in illicit stablecoin activity, with about $141 billion worth of stablecoins flowing to illicit entities, marking a five-year high in this space.
Key takeaways
- Indonesian courts are increasingly accepting on-chain data — including wallet addresses and transaction histories — as admissible and pivotal evidence in terrorism-financing prosecutions.
- A concrete case linked more than $49,000 in USDt moved across 15 transactions from a local exchange to a foreign platform, with funds ultimately directed to ISIS-linked fundraising in Syria.
- Regional significance is growing: Southeast Asian authorities are expanding blockchain-forensics capabilities and fostering cross-sector collaboration to tackle illicit crypto activity.
- TRM data points to a broader scale of illicit crypto use in 2025, including a substantial surge in illicit stablecoin activity, underscoring why forensics capacity matters for regulators and law enforcement.
Courts and crypto traces: what changed in Indonesia
Central to the Indonesian cases was the application of blockchain analytics by the country’s financial intelligence unit in tandem with Densus 88, the national counterterrorism police unit. By correlating on-chain activity with exchange flows and cross-border transfers, investigators constructed a continuous chain of custody from a domestic source to an international donor and ultimately to a fundraising operation tied to ISIS. The courts’ acceptance of these traces signals a shift in evidentiary standards, aligning digital footprints with traditional investigative records.
TRM’s analysis frames this development as part of a wider trend in which prosecutors are learning to treat crypto evidence not as an adjunct but as a core element of financial-crime cases. The implications for investors and operators are nuanced: while the cases demonstrate that crypto-era enforcement is moving toward greater scrutiny, they also underscore the increasing value of transparent, auditable on-chain activity as a legal tool.
Regional momentum and what it means for the market
The Indonesian trajectory is occurring amid a regional mobilization to fortify crypto-forensics. Southeast Asia is seeing a push to scale capabilities that can trace crypto flows across borders, with Singapore and Malaysia cited as examples of jurisdictions expanding their analytical arsenals and public-private collaboration. For market participants, the trend translates into a more predictable regulatory environment around digital-asset tracing, even as enforcement remains vigilant against abuse.
From an investor perspective, the trend raises several practical considerations. First, the integrity of on-chain evidence can influence case outcomes, potentially elevating the risk-reward calculus for illicit actors and increasing the likelihood of sanctions or asset seizures in connected networks. Second, as authorities invest in blockchain intelligence tools, exchanges and custodians may be called upon to provide faster or more granular data, which could affect due-diligence timelines and compliance costs. Third, the regional emphasis on cross-border cooperation could help standardize some investigative approaches, reducing ambiguity for global firms operating in multiple markets.
Broader enforcement context and ongoing developments
The Southeast Asian enforcement narrative extends beyond Indonesia. In a related development, Li Xiong, a leader of the Huione Group, was captured in Cambodia and China and extradited to China to face fraud and money-laundering charges tied to scam operations. This came three months after the arrest of Chen Zhi, head of the Prince Group, which operates Huione. In parallel, TRM reported that illicit stablecoins activity reached about $141 billion in 2025, signaling a five-year high and reinforcing the importance of robust tracing capabilities for regulators and financial institutions alike.
Taken together, these pieces illustrate a broader pattern: as crypto tracing tools mature and cross-border cooperation intensifies, authorities appear increasingly confident in leveraging on-chain data to pursue financial crime, including terrorism financing. For market participants, that means continuing attention to compliance, transparent corporate disclosures, and readiness to respond to regulatory expectations around crypto-asset flows.
Readers should monitor ongoing capacity-building efforts among Southeast Asian FIUs and law-enforcement agencies, as well as any new court rulings that further define the role of on-chain evidence in criminal cases. The evolving landscape will shape both risk and opportunity for exchanges, wallets, and institutional actors operating in the region.


Bitcoin price struggled to maintain footing above the $70,000 level as traders waited for clearer direction from ongoing geopolitical negotiations between the United States and Iran.
Summary
- Bitcoin remains capped below $70K as traders await clarity on US Iran ceasefire talks.
- Institutional demand continues to absorb supply, with accumulation trends outpacing miner issuance.
Bitcoin briefly climbed past $70,200 earlier in the week after reports suggested both sides were exploring terms for a temporary ceasefire that could ease pressure on global energy markets.
Discussions appear to be advancing behind the scenes, with multiple regional intermediaries involved in shaping a framework that could pause hostilities for several days before moving into wider negotiations.
People familiar with the situation have indicated that both Washington and Tehran have received a proposal that could initiate talks around reopening the Strait of Hormuz.
At the same time, United States President Donald Trump repeated his warning that Iran would face severe consequences if it failed to comply with the outlined conditions.
“I won’t go further because there are other things that are worse than those two,” he said, reinforcing earlier threats targeting infrastructure.
Trup has set a deadline for 8 pm Eastern time on Tuesday, and market participants are closely tracking any signal of progress or breakdown in negotiations.
As a result, price action has remained hesitant near the key psychological support at $70,000. Traders have become reluctant to commit in either direction before the geopolitical outcome becomes clearer.
A confirmed agreement could open the door for a move toward the $75,000 region, as easing tensions would likely support risk appetite across financial markets.
Failure to reach a deal could shift sentiment in a different direction, with Bitcoin once again attracting attention as an alternative store of value during periods of uncertainty.
Iranian officials, however, have yet to signal acceptance of the proposed terms and continue to insist that shipping routes will remain restricted until compensation and sanctions relief are addressed.
That stance has kept upside moves in check, with repeated attempts to break higher running into resistance as sellers step in near recent highs.
Institutions continue buying
Underneath the surface, demand has remained firm, with accumulation continuing to absorb a significant portion of newly issued supply.
Bitcoin treasury firm Strategy has continued to accumulate Bitcoin at a pace that exceeds the supply produced by miners.
Since early March, Strategy has acquired 46,233 BTC. During the same time, miners have produced only about 16,200 BTC. This means Strategy has acquired nearly three times the fresh supply.
At the same time, inflows into spot Bitcoin ETFs have also turned positive.
Such conditions have limited the depth of pullbacks, even as technical setups point toward potential weakness.
However, on the macro side, rising bond yields are introducing a competing force for capital.
Yields on the United States 5-year Treasury have climbed to around 4% from 3.55%, signaling that investors are seeking higher returns from government debt amid ongoing uncertainty.
Elevated energy prices and increased fiscal spending tied to military activity have contributed to inflation concerns, which in turn are influencing bond markets.
A successful ceasefire could reinforce confidence in Treasuries, encouraging some investors to rotate away from alternative assets, including Bitcoin.
For now, price remains caught between steady accumulation and external pressures, with the next move likely to hinge on developments in the geopolitical backdrop.
Disclosure: This article does not represent investment advice. The content and materials featured on this page are for educational purposes only.

5 AI Agent Use Cases I’d Start Today to Make Money Online
Cyclist seriously injured after bus crash in Cambridge

NFL Players from Campbell County H.S. (Gillette, WY)


-

 NewsBeat5 days ago
Steven Gerrard disagrees with Gary Neville over ‘shock’ Chelsea and Arsenal claim | Football
-

 Business4 days ago
No Jackpot Winner and $194 Million Prize Rolls Over
-

 Fashion4 days ago
Weekend Open Thread: Spanx – Corporette.com
-

 Crypto World5 days ago
Gold Price Prediction: Worst Month in 17 Years fo Save Haven Rock
-

 Business1 day ago
Three Gulf funds agree to back Paramount’s $81 billion takeover of Warner, WSJ reports
-
Crypto World7 days ago
Dems press CFTC, ethics board on prediction-market insider trades
-

 Sports2 days ago
India men’s 4x400m and mixed 4x100m relay teams register big progress | Other Sports News
-

 Business3 days ago
Expert Picks for Every Need
-

 Business5 days ago
Login and Checkout Issues Spark Merchant Frustration
-

 Tech7 days ago
EE TV is using AI to help you find something to watch
-

 Sports7 days ago
Tallest college basketball player ever, standing at 7-foot-9, entering transfer portal
-

 Tech7 days ago
How to back up your iPhone & iPad to your Mac before something goes wrong
-

 Tech7 days ago
What Are The Biggest Limitations Of Supercomputers?
-

 Crypto World6 days ago
Bitcoin enters the public bond market as Moody’s gives a first-of-its-kind crypto deal a rating
-
Crypto World6 days ago
Bitcoin stalls below key resistance as technical signals skew bearish
-

 Tech5 days ago
Commonwealth Fusion Systems leans on magnets for near-term revenue
-

 Politics7 days ago
Transform Your Space with Stunning Small Works
-

 Politics6 days ago
Starmer’s centre has collapsed, and the left was right all along
-
Business2 days ago
No Jackpot Winner, Prize to Climb to $231 Million
-

 Business7 days ago
Matrix Composites shares up 50pc on new takeover bid
You must be logged in to post a comment Login