
Crypto World
Bitcoin Jumps to $64K as Gold Rallies and Oil Rebounds

Bitcoin rebounded after Monday’s Wall Street open, returning to the $64,000 area as traditional markets rotated away from equities and toward commodities. The move followed a weekly close earlier in the weekend session, with BTC/USD recovering more than 2% on the day according to TradingView.
At the same time, geopolitical noise around the US–Iran standoff spilled toward Oman, raising renewed questions about the Strait of Hormuz shipping route—though oil prices appeared largely unmoved in early trading. Derivatives data also pointed to a crowded long trade, with Bitcoin funding rates reaching levels not seen since late 2024.
Key takeaways
- BTC/USD climbed more than 2% on Monday after rebounding from Sunday’s weekly close, with price returning to roughly $64,000.
- US–Iran ceasefire concerns and Trump’s comments related to Oman fed risk headlines, but WTI crude stayed near $82.35 per barrel.
- CryptoQuant data shows Bitcoin funding rates hitting 20-month highs of 0.022 as long positions build within the current range.
- QCP Capital said BTC remains near the lower end of its recent range, warning that sustained moves beyond the range would carry more signal than day-to-day fluctuations.
BTC tracks a shift from equities to commodities
TradingView data showed Bitcoin up over 2% on Monday, rebounding from the prior weekly close. The move coincided with softer US equity sentiment: the S&P 500 was down about 0.5% from its Thursday all-time high around the time of writing, as stocks gave way to gold as investors searched for alternative havens.
Geopolitical headlines added volatility to the broader macro picture. With an agreed 60-day ceasefire between the US and Iran set to expire, Trump told Fox News he would consider military action if Oman “gets in the way” amid a dispute linked to reopening the Strait of Hormuz oil route. Despite the rhetoric, oil markets appeared calm, with WTI crude trading flat around $82.35 per barrel at the time.
Gold showed more movement than oil at the start of the week. Safe-haven demand lifted XAU/USD by just over 1%, reaching a daily high of $4,427 per ounce. Cointelegraph previously reported that a mix of retail participation and government interest helped push gold to multiweek highs.
Data tracked by Bytetree, which monitors the 30-day change in inflows to gold-backed exchange-traded funds (ETFs), placed 30-day inflows at nearly $12 billion through Aug. 13. In an Investing.com piece that quoted a Bank of America strategist, Michael Hartnett argued that “long gold remained the trade,” framing it as a hedge amid concerns around currency debasement, bond stress, and inflationary pressures.
Investors keep BTC near a familiar range—until positioning shifts
In a Monday bulletin, QCP Capital said Bitcoin’s ability to withstand macro pressures without a major breakdown suggested the market is not yet signaling a decisive trend change. The firm emphasized that focusing on single price levels may miss the bigger picture.
Instead, QCP Capital pointed to range behavior: it described BTC as still sitting close to the lower end of its recent trading band and argued that a sustained move outside the range would reveal more meaningful information about market positioning than relatively contained intraday moves.
This framing matters for traders because it implies that catalysts may be more important than incremental price changes. Earlier coverage referenced expectations that a return to the $61,000 area could prompt an unwinding of BTC long positions—an observation tied to how leverage can amplify downside when levels break.
On Monday, liquidation activity appeared contained as BTC moved back toward the $64,000 region. CoinGlass data cited in the report put 24-hour cross-crypto liquidations at approximately $180 million, suggesting that the rebound occurred without a large liquidation-driven panic on the day.
Funding rates surge: long exposure is getting crowded
Beyond spot price, derivatives positioning offered a more pointed signal. CryptoQuant data showed Bitcoin funding rates reaching 20-month highs of 0.022 on Aug. 14. The analytics firm characterized derivatives sentiment within the current BTC price range as positive, adding that most traders were taking long positions.
When funding rates rise while price holds relatively stable, it can indicate that market participants are piling into the same side of the trade. That can be constructive if momentum extends—but it also increases the risk that a reversal could trigger crowded unwinds, depending on how price reacts at the edges of the prevailing range.
The report also cited CryptoQuant’s earlier observation that futures activity on Binance was outweighing spot markets by nearly eight times. While this metric alone doesn’t predict direction, it supports the broader theme: derivatives are playing a large role in how leverage and sentiment develop around Bitcoin’s current trading boundaries.
What to watch next amid macro and leverage signals
For now, Bitcoin is rebounding, but the underlying positioning looks increasingly one-sided as funding rates climb and longs become more crowded. Investors and traders should watch whether BTC can sustain moves beyond its recent range—since QCP Capital suggested that only a sustained breakout would meaningfully clarify market positioning—while keeping an eye on funding rate changes and liquidation levels for signs that leverage is either being rewarded or set up for a sharper unwind.



YouTube will count a view the moment a video starts playing from August 24. There is no minimum watch time. The rule covers uploads, Shorts, and live streams worldwide.
Public view totals will climb fast. However, the number that decides pay moves into a submenu that most creators never open. For anyone not yet monetized, the bar is about to get higher.
Follow us on X to get the latest news as it happens
The Old Standard Becomes “Engaged Views”
YouTube is not deleting the old count. It is renaming it. The stricter method now sits in YouTube Analytics under Advanced Mode, labeled Engaged views.
Shorts went first. YouTube switched Shorts to the play-based standard last year and kept the tighter version for payouts. It is now copying that split to every other format.
The volume being recounted is enormous. CEO Neal Mohan put average daily Shorts views at 200 billion in a January letter.
YouTube defines the metric that actually matters in its own documentation.
the viewer stayed to watch past the initial seconds, and does not include any loops
Not every play makes that cut. Loops do not count. Nor do private uploads, unlisted uploads, deleted videos, or clips watched as ads.
YouTube has never published a hard threshold for long-form video. The Monday announcement does not add one. Creators have guessed at these rules for years, much like the platform engagement myths that spread on X (Twitter).
Why Creator Pay Does Not Move
Money still runs on strict numbers. Long-form and live pay are based on engaged watch hours. Shorts pay is based on engaged Shorts views.
Both live in Advanced Mode. Neither changes next Monday. A channel could post a much bigger view count in September and earn exactly the same.
The stakes are large. YouTube ads brought in $11.06 billion last quarter, up 13% from a year earlier, according to Alphabet’s results from big tech earnings week.
YouTube says it has paid creators and partners more than $100 billion over four years.
YouTube also says this change leaves Partner Program eligibility alone. That is true of this change.
A second announcement, published two weeks earlier, does move the bar. From February 1, 2027, new applicants will need 8,000 qualified watch hours over 365 days, YouTube said in an update. The Shorts route rises to 20 million qualified views over 90 days.
Both figures double today’s requirements of 4,000 hours and 10 million views. The 1,000-subscriber minimum stays. Creators already inside the program are not affected.
What the Split Means for Sponsorship Deals
YouTube tied the view change to brand deals in its Monday announcement. Consistent counting, it argued, helps creators show sponsors their real reach.
That argument cuts both ways. An inflated public figure is easier to pitch. It is also easier for an experienced media buyer to discount.
Expect sponsors to start asking for Advanced Mode screenshots. Creators who cannot produce them may find the headline number counts for less than they did.
Some rivals skip the measurement problem entirely. Rumble added Bitcoin tipping for creators, paying channels straight from their audience.
Two clocks are now running. The public number inflates on August 24. The bar that pays doubles on February 1, 2027. Creators still outside the program have until February to qualify under the lower one.
The post YouTube Views are About to Explode, But Your Money Won’t appeared first on BeInCrypto.
Bitcoin (BTC) is starting the new week at around $63,000, but bear-market history continues to repeat with weekly close below a key long-term trend line.
Key points:
- Bitcoin has been trading in a range between $57,700 and $67,300, but last week’s close came with a drop below the key 200-week moving average at $64,216.
- Markets are pricing in near-70% odds of a hold by the Federal Reserve in September, as July meeting minutes are due this week.
- Japan Q2 GDP figures fall short of expectations at 1.1% as analysis warns of “global tightening” that could impact Bitcoin and risk assets.
Bitcoin sees weekly close below 200-week moving average
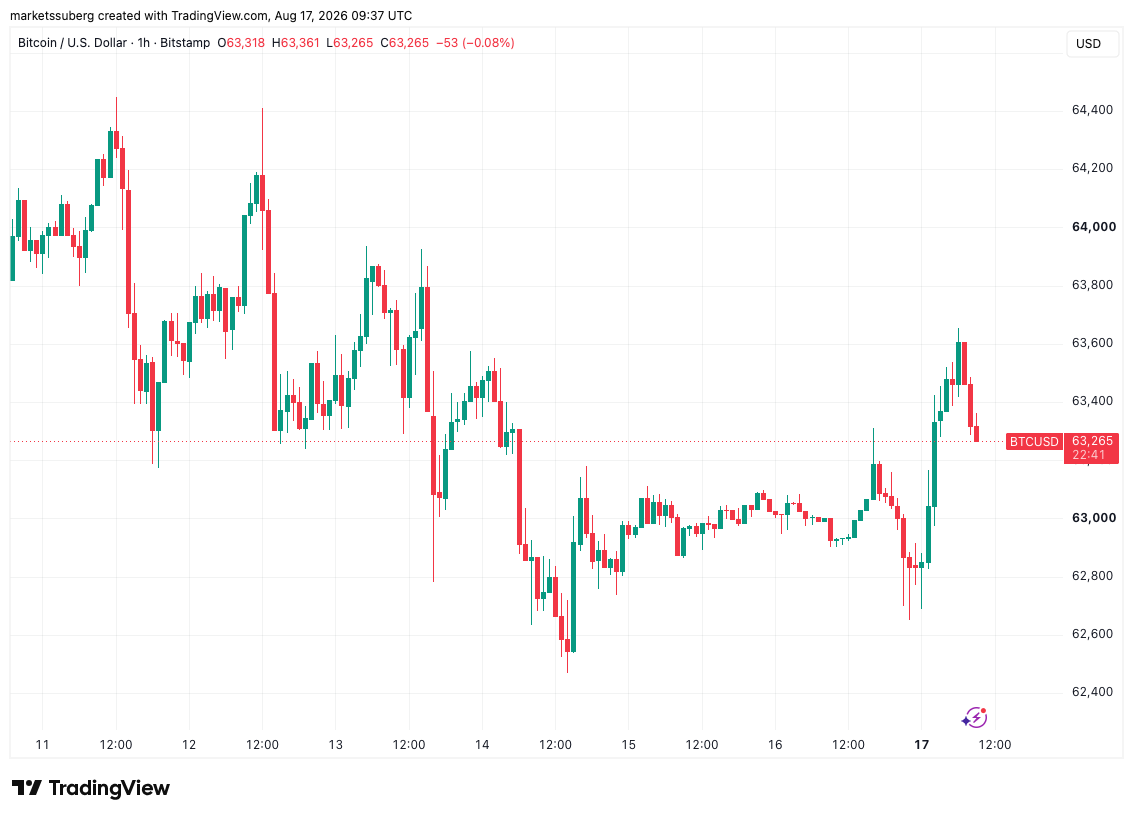
Bitcoin price action enjoyed a modest rebound after Sunday’s weekly close, seeing local highs of $63,655 on Bitstamp.
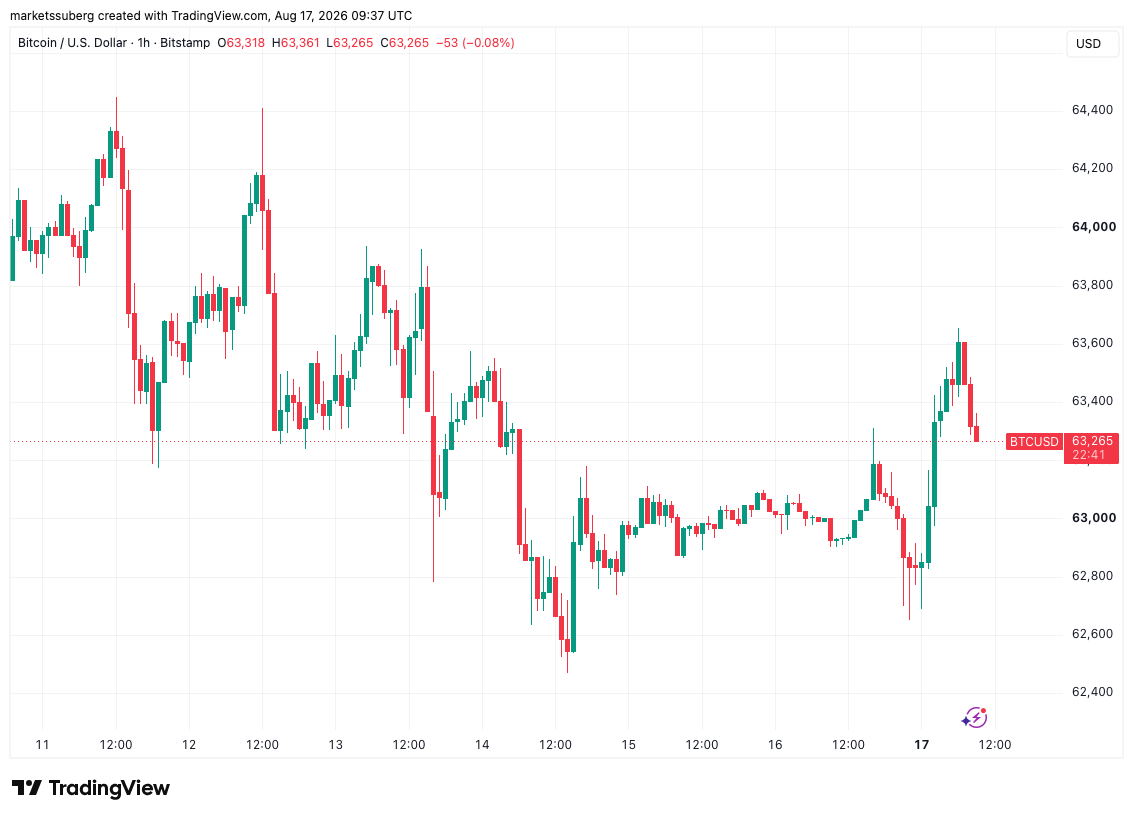
BTC/USD one-hour chart. Source: Cointelegraph/TradingView
Data from TradingView shows BTC/USD continuing to tread water as the week begins, failing to challenge either side of a narrow trading range.
Analyst Benjamin Cowen, however, drew attention to the fact that BTC/USD is now back below its 200-week simple moving average (SMA). As Cointelegraph reported, this moving average was a defining feature in the 2022 bear market, when it turned resistance in August before BTC entered its long-term bottoming phase.
“What is interesting is how in both summer 2022/2026, Bitcoin capitulated below the 200W SMA, then bounced, then gave it up in mid-August,” he wrote in a post on X.
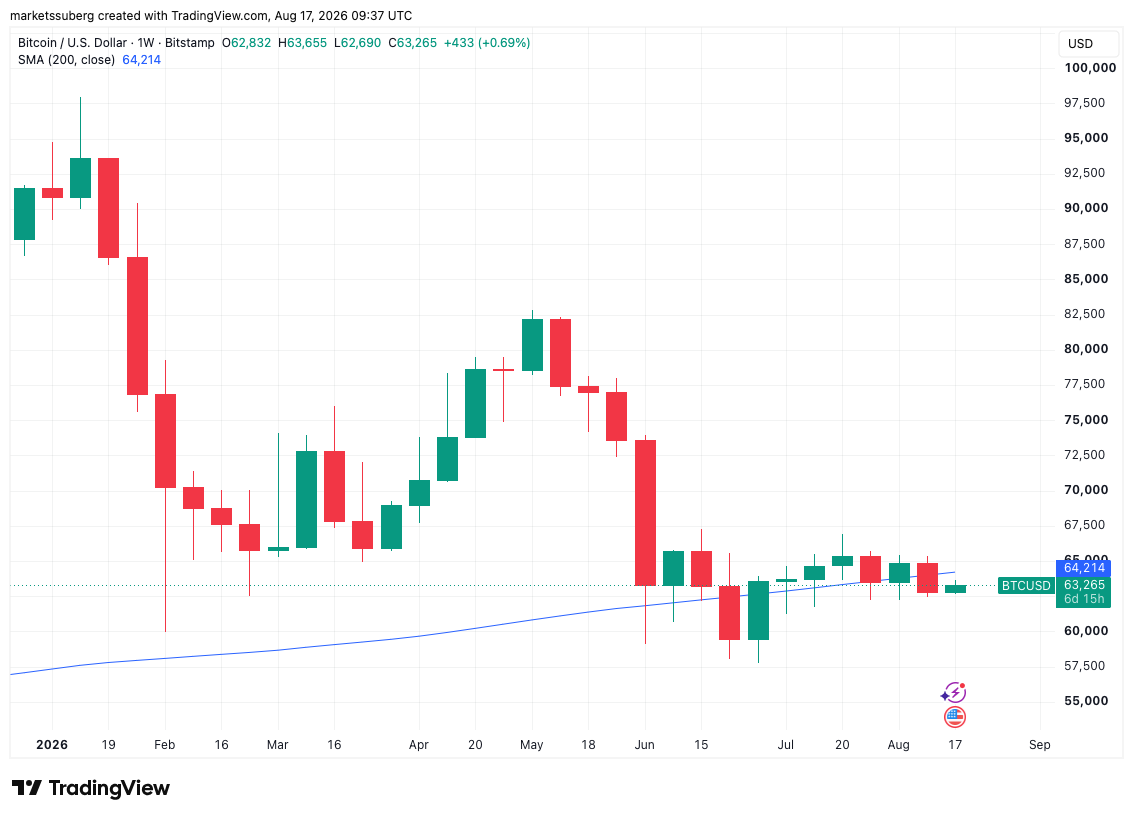
BTC/USD one-week chart with 200 SMA. Source: Cointelegraph/TradingView
Commenting, trader and analyst Rekt Capital added that price had failed to reach his own weekly-close target of $63,220, thus positioning for further downside in future.
“A rejection from $63,220 would fully confirm the breakdown and send price lower within the current ~$58,000-$66,000 Range (blue-blue)” he told X followers alongside an explanatory chart.
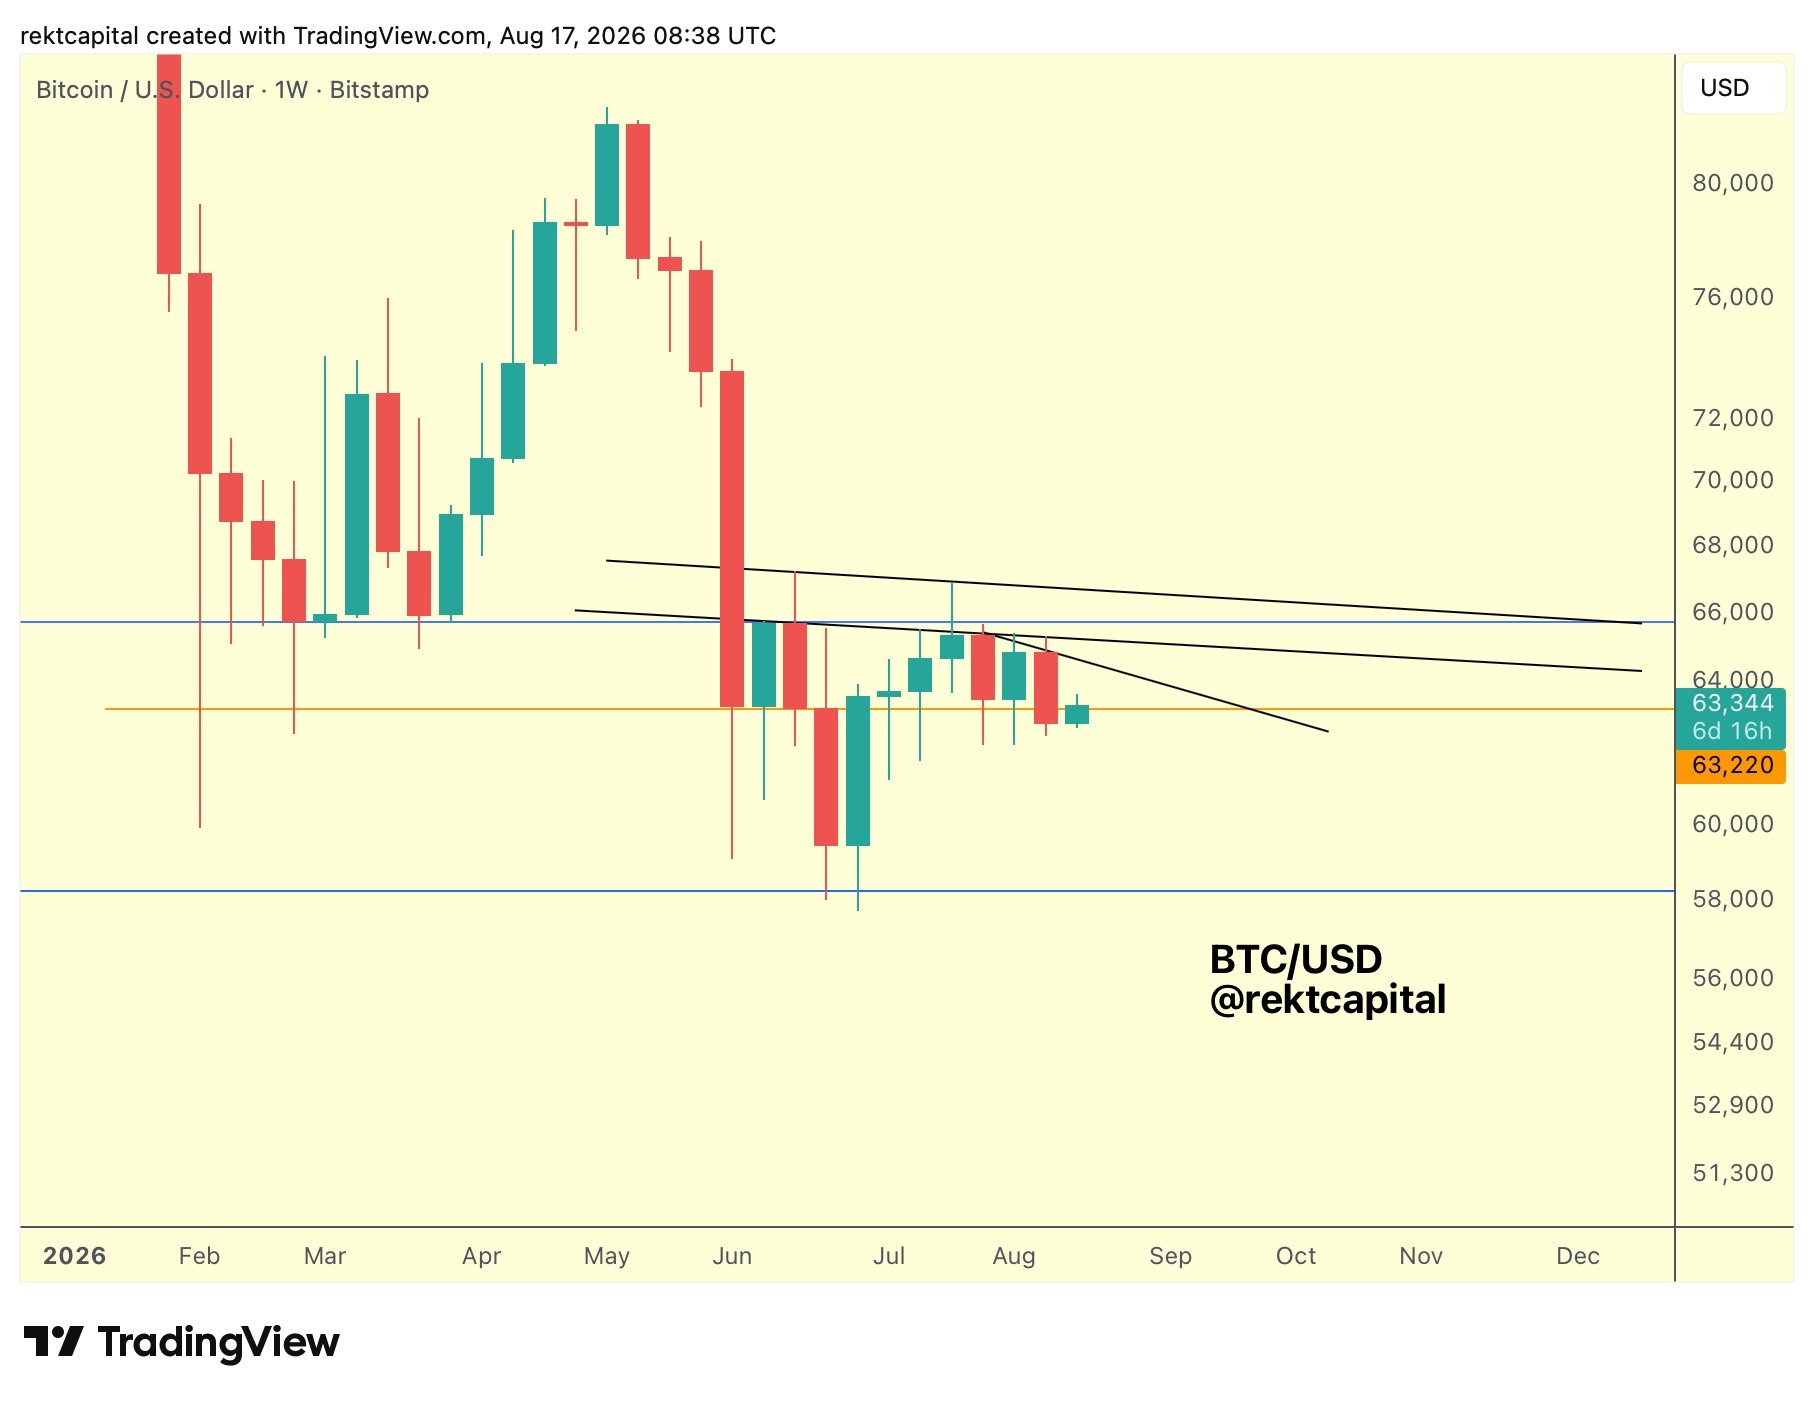
BTC/USD one-week chart. Source: Rekt Capital on X.com
Fed minutes due amid policy dissent
Friday sees the release of preliminary Purchasing Managers’ Index (PMI) data for the manufacturing and services sectors. The data has recently been in an uptrend diverging from relatively weak employment figures, which have seen several months of downward revisions.
Last week’s Consumer Price Index (CPI) and Producer Price Index (PPI) releases, meanwhile, painted a softer-than-expected picture of US inflation trends. This sparked a rethink on future interest-rate hikes by the Federal Reserve.
The latest data from CME Group’s FedWatch Tool shows near-70% odds that the Fed will hold rates at their current 3.50-3.75% range, compared with 42% odds a month ago.
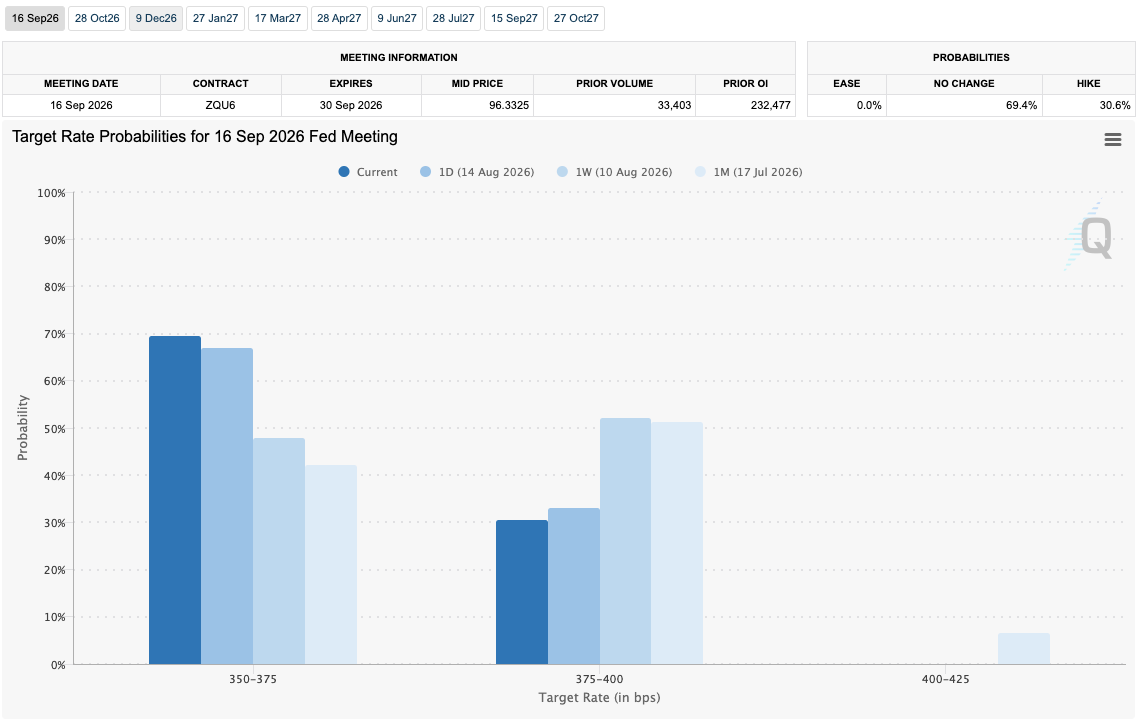
Fed target-rate probability comparison for September FOMC meeting (screenshot). Source: CME Group
“A pair of reports showing moderating inflation is helping keep the outlook for monetary policy from turning too hawkish,” trading resource Mosaic Asset Company summarized in analysis released on Sunday.
Mosaic noted that while CPI came in at 3.4% year-on-year, this was still far above the Fed’s 2% target — a goal that chair Kevin Warsh continues to state will be achieved. On Wednesday, the Fed will publish the minutes of its July meeting. Rate hikes were paused in the prior meeting with the largest split among officials over the move since 1970.
Last week, Cleveland Federal Reserve Bank president Beth Hammack, who was one of three dissenting voices calling for a 0.25% rate hike in July, questioned whether public patience would tolerate it if the return to 2% rates took several years.
“Maybe we’d get there, but if it takes another three to four years to get there, is that OK? Is that enough?” she said at an event with the Dayton Area Chamber of Commerce in Kettering, Ohio, quoted by Bloomberg.
Japan on the radar as GDP disappoints
Japan’s central bank is on the radar for risk-asset traders this week after Q2 GDP figures significantly missed expectations. Quarter-on-quarter and year-on-year GDP increased 0.3% and 1.1%, respectively — below the anticipated 0.5% and 2.0%.
The timing of the print comes as markets see the Bank of Japan (BoJ) hiking rates from current 1.0% levels in September amid surging bond yields and continued weakening in the yen. Previously, Cointelegraph reported on a rare joint intervention in yen currency markets by Japan and the US after JPY/USD weakened to new 40-year lows.
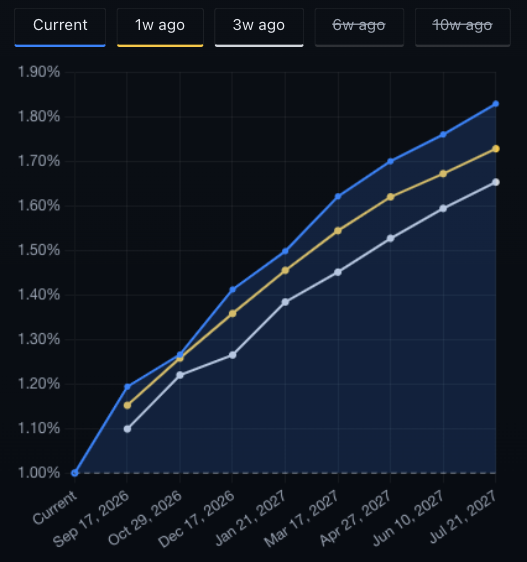
BoJ interest-rate probabilities (screenshot). Source: RateProbability
The GDP print, meanwhile, included the first drop in private consumption in eight quarters, signaling that existing stimulus measures were failing to prop up consumer confidence.
“The boost to consumption from policy measures is already fading, and inflation will increase in H2 as firms will pass on increased costs, deteriorating consumers’ purchasing power,” Norihiro Yamaguchi, lead Japan economist at Oxford Economics, told CNBC.
The yen avoided major volatility on the back of the GDP data, lingering near 159 per dollar on Monday.
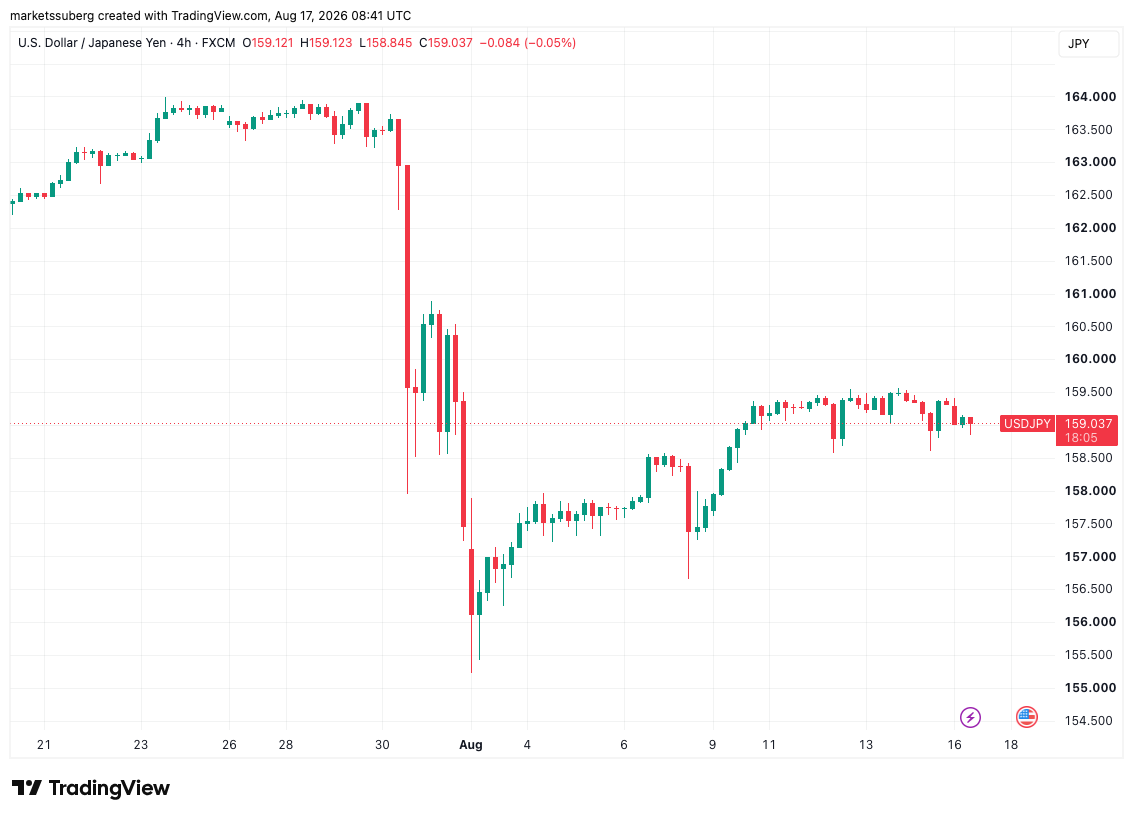
USD/JPY four-hour chart. Source: Cointelegraph/TradingView
Responding to the aftermath, Axel Adler Jr., a contributor to onchain analytics platform CryptoQuant, noted potential implications for risk assets to come. Japan’s 10-year bond yield hit 2.93% on Monday, its highest levels since 1996.
“For now, this is not a signal to sell risk assets. But the market is approaching an important point: JGB > 3% + further BOJ rate hikes + a stronger yen + rising US Treasury yields,” he wrote in an X post.
“If these factors align, Japan’s rate normalization could turn into a global tightening of financial conditions and hit stocks and Bitcoin.”
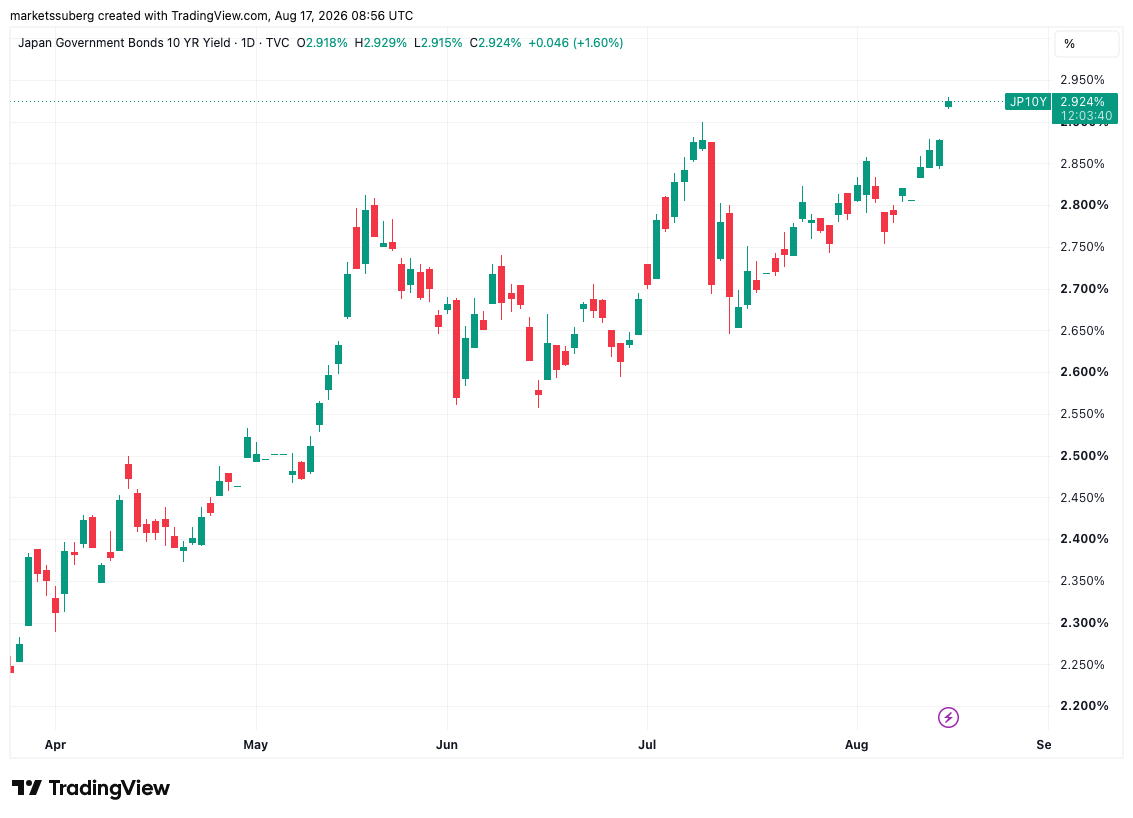
Japan 10-year bond yields one-day chart. Source: Cointelegraph/TradingView
Bitcoin forgotten as consumer sentiment lows contrast with stocks gains
Rising stocks paired with record-low consumer sentiment are flashing a new warning sign for Bitcoin, which is increasingly being overlooked.
In the latest edition of its regular newsletter, The Week Onchain, crypto analytics platform Glassnode revealed a striking divergence between Bitcoin and equities in terms of sentiment.
“Consumer Confidence remains among the weakest readings of the past decade even after two consecutive improvements, while the US Stock Market Index set a fresh all-time high on August 7 and holds just beneath it,” it summarized.
The softer US inflation prints helped send the S&P 500 to all-time highs of 7,816 on Thursday. At the same time, the consumer sentiment survey by the University of Michigan is expected to drop 7.6% in August.
“Weak sentiment next to record prices looks like a contradiction until the driver is named: households that expect living costs to rise and the economy to soften are moving out of cash and into assets. The equity market, carried above all by the AI trade, is where that capital lands,” Glassnode commented.
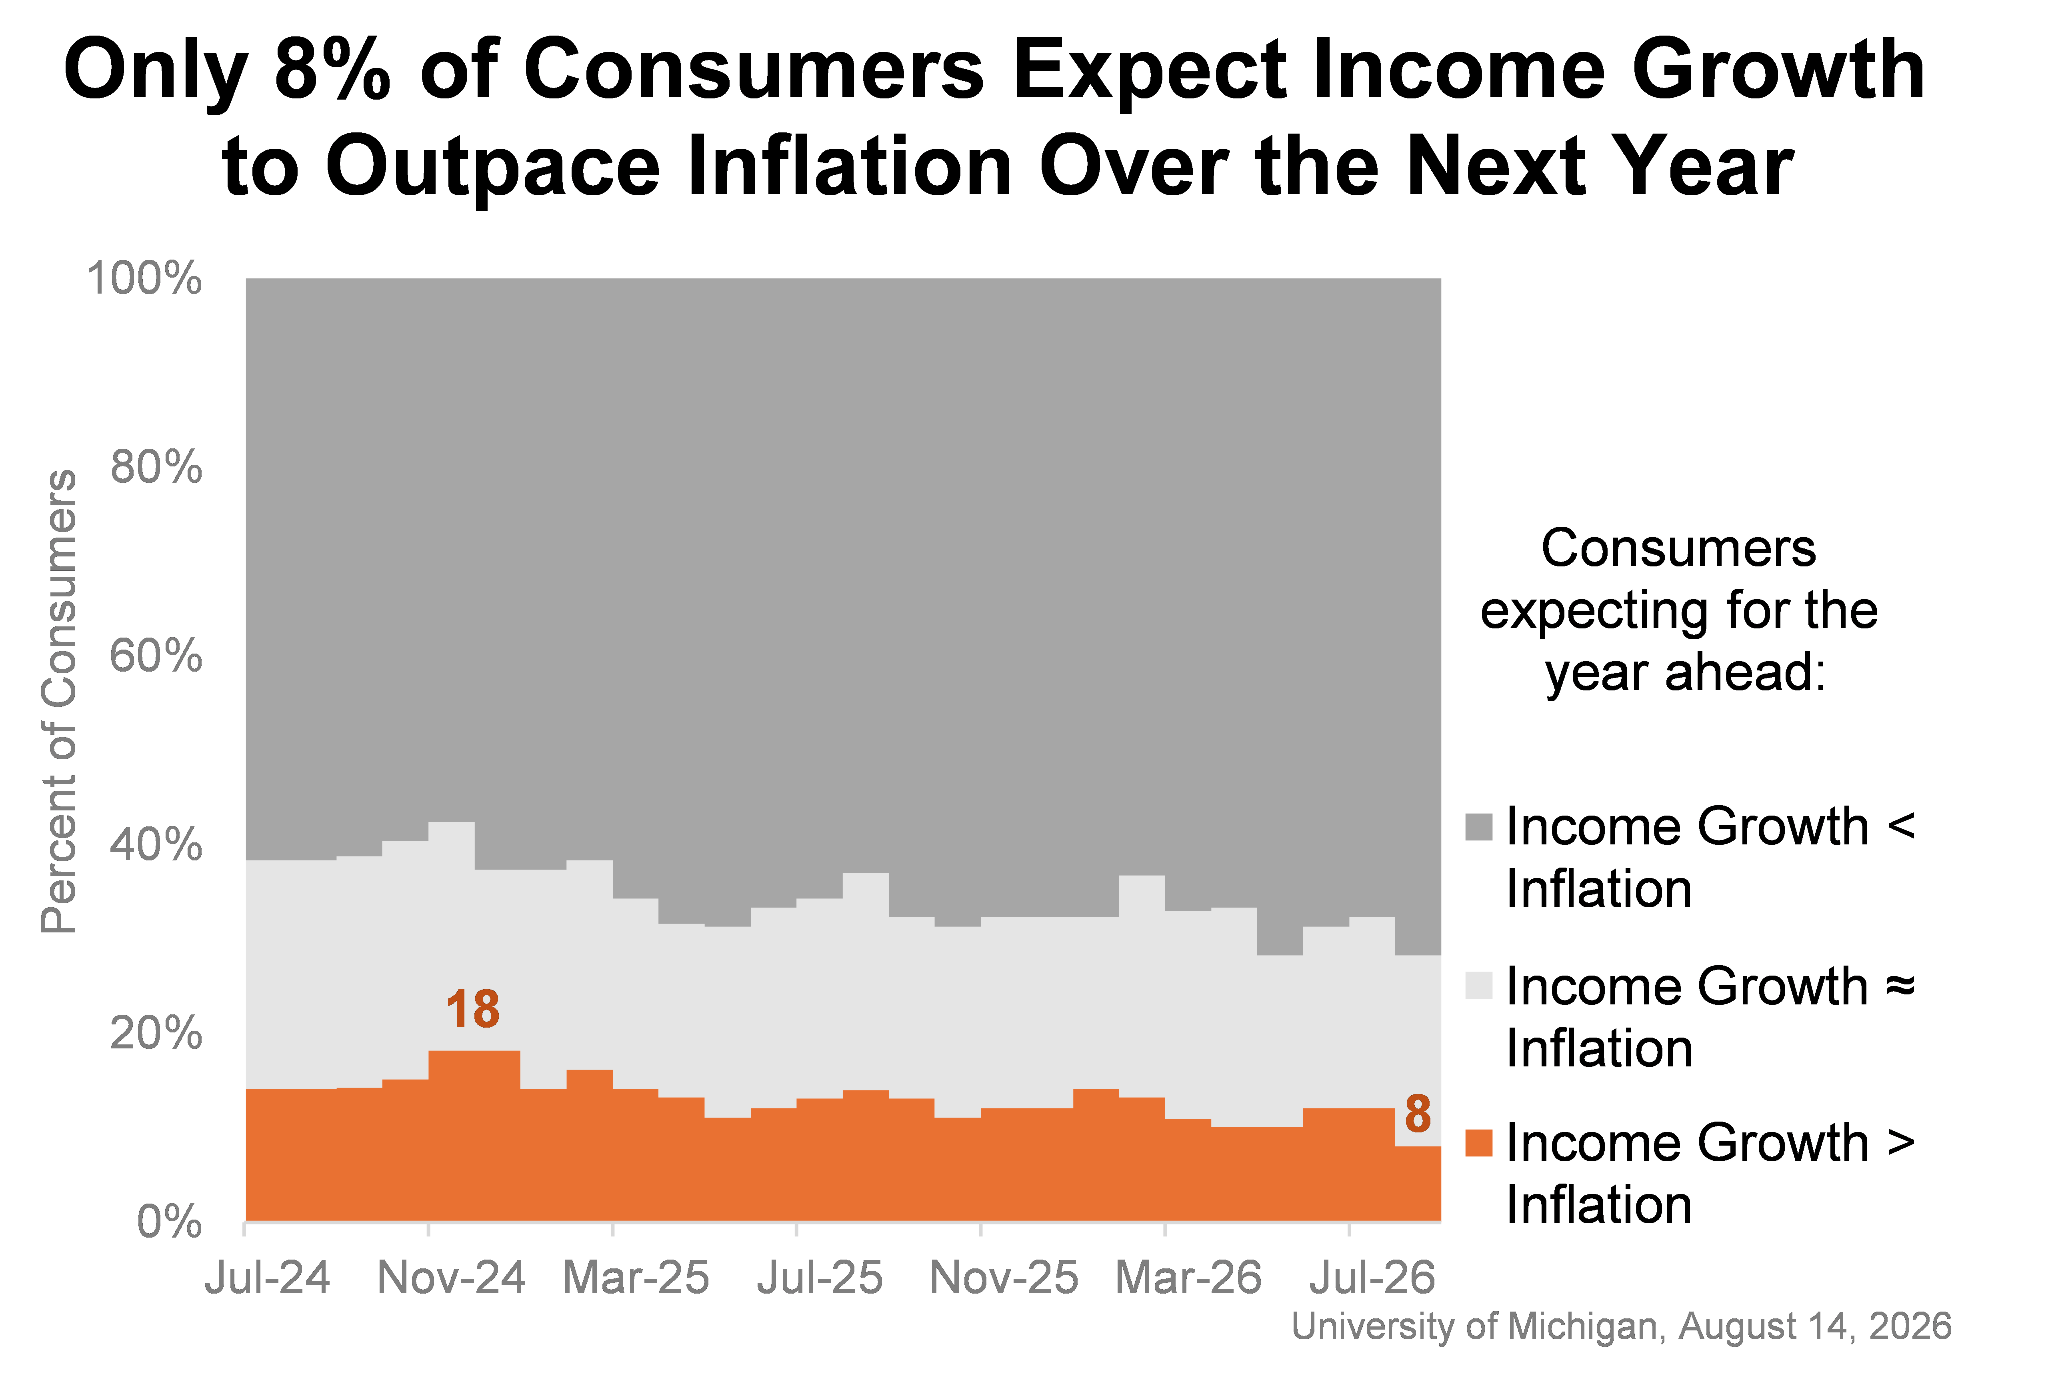
US consumer sentiment data. Source: University of Michigan
Bitcoin continues to be left out of this capital rotation. A sign of change, Glassnode argued, would be a sustained rebound in institutional inflows to the US spot Bitcoin exchange-traded funds (ETFs).
Last week, these saw net outflows of $267.2 million, per data from UK-based investment company Farside Investors. Just one out of five trading days finished with net inflows, totaling a mere $7.8 million.
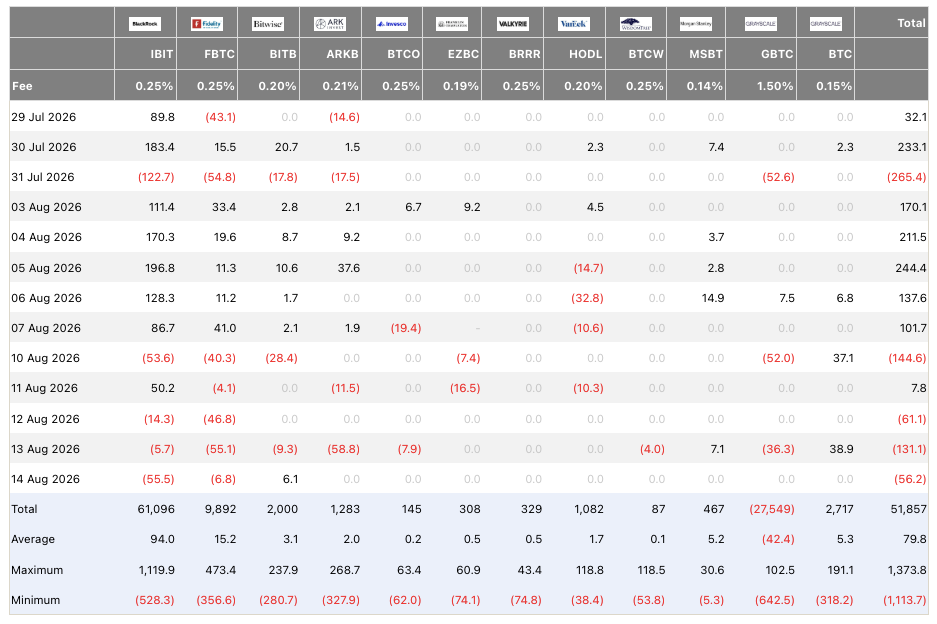
US spot Bitcoin ETF netflows (screenshot). Source: Farside Investors
Exchange BTC reserves grow with whale inflows in focus
Bitcoin supply dynamics are the latest troubling feature for its price trajectory, CryptoQuant analysis reports.
Related: Here’s what happened in crypto today
Whales have started to dominate exchange inflows, exacerbating an existing absence of retail interest and causing exchange BTC reserves to reverse higher. Binance’s whale ratio reached 0.71 on Aug. 10, its highest since early March.
“Exchange deposits do not necessarily mean immediate selling, but they increase the amount of BTC available for trading or hedging,” CryptoQuant commented.
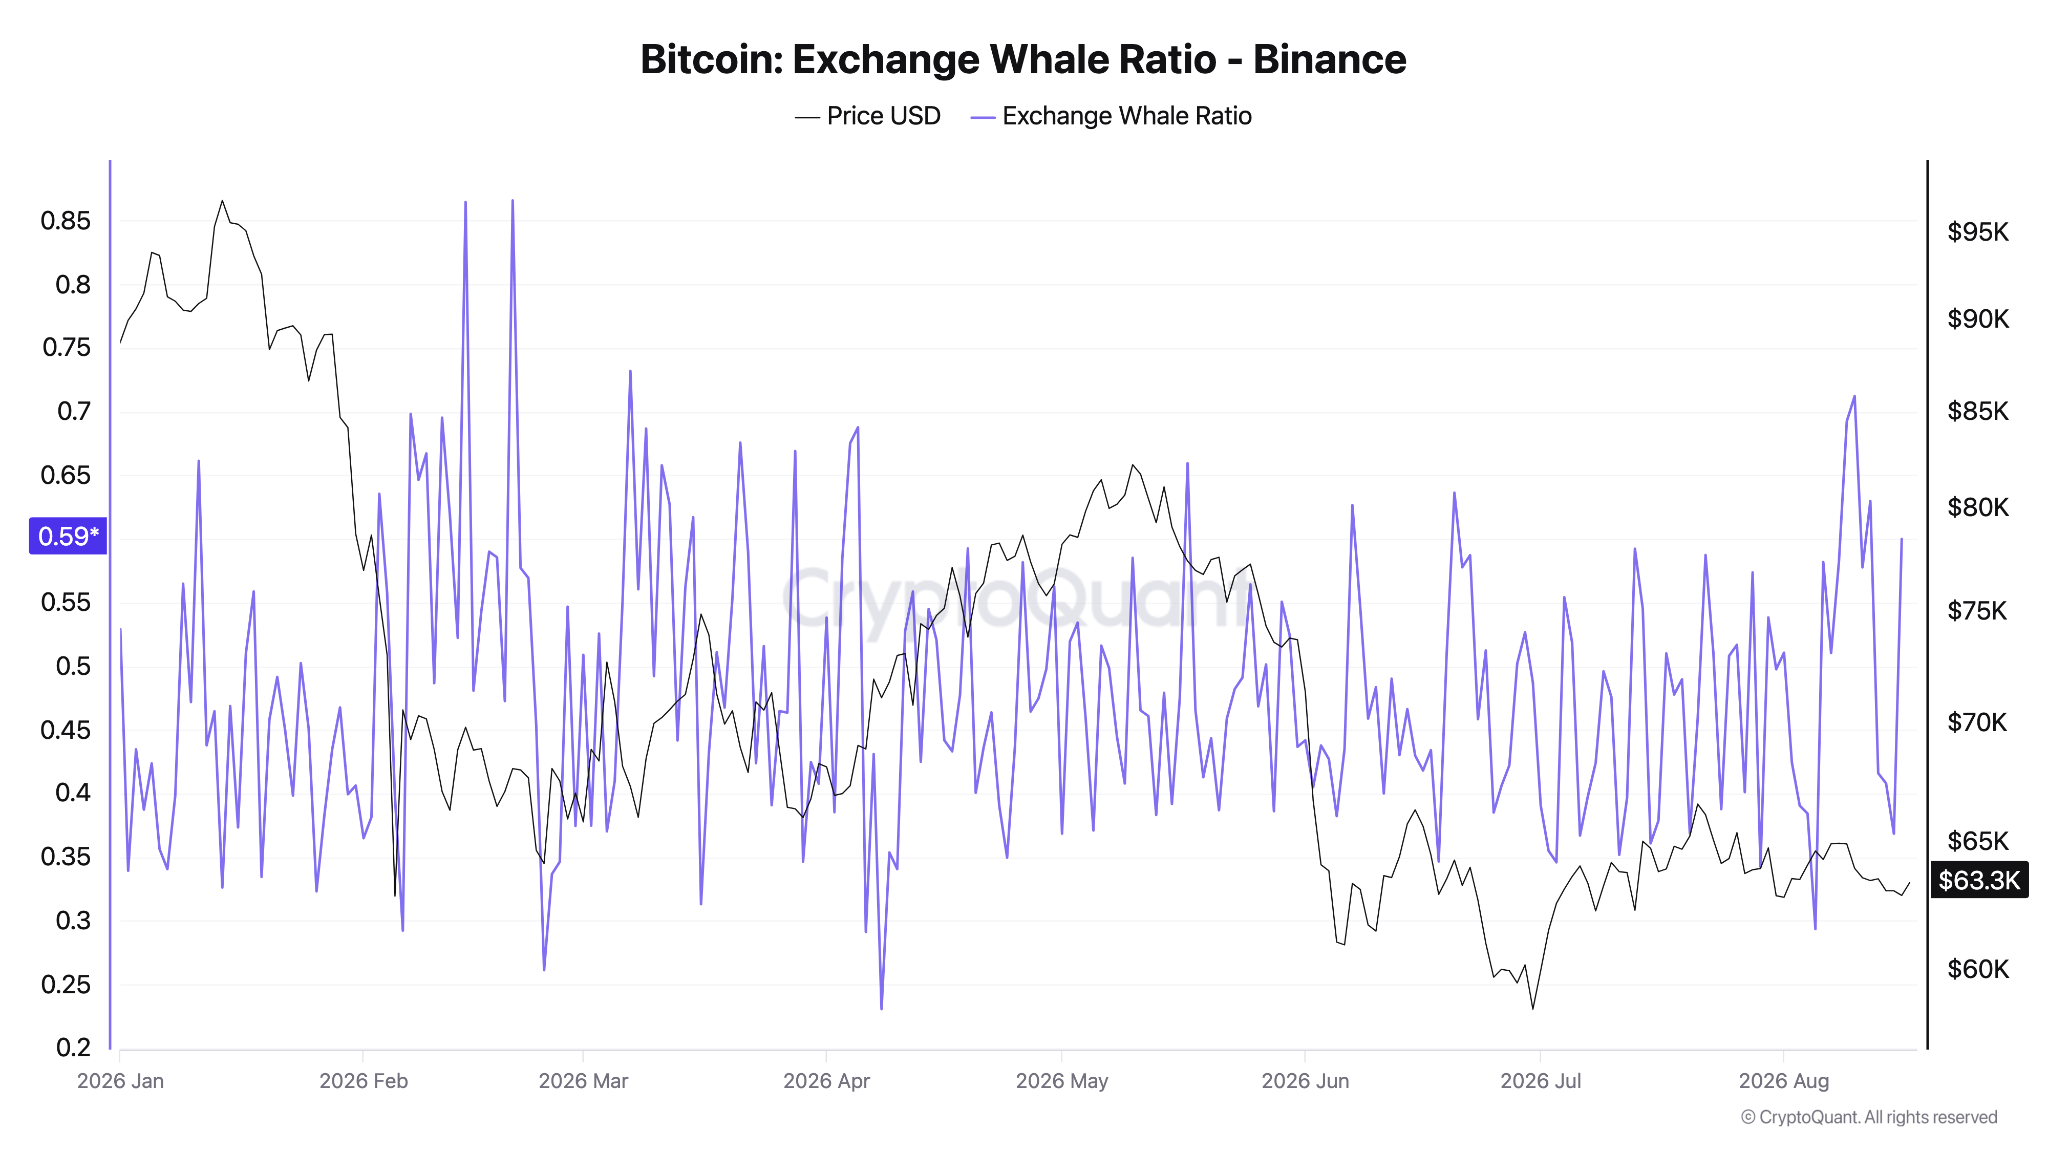
Binance exchange whale ratio. Source: CryptoQuant
Binance’s BTC reserves totaled 674,332 BTC on Sunday, up 2.57% month-to-date and at their highest since November 2025.
“The long-running trend of BTC leaving exchanges may therefore be weakening,” CryptoQuant continued.
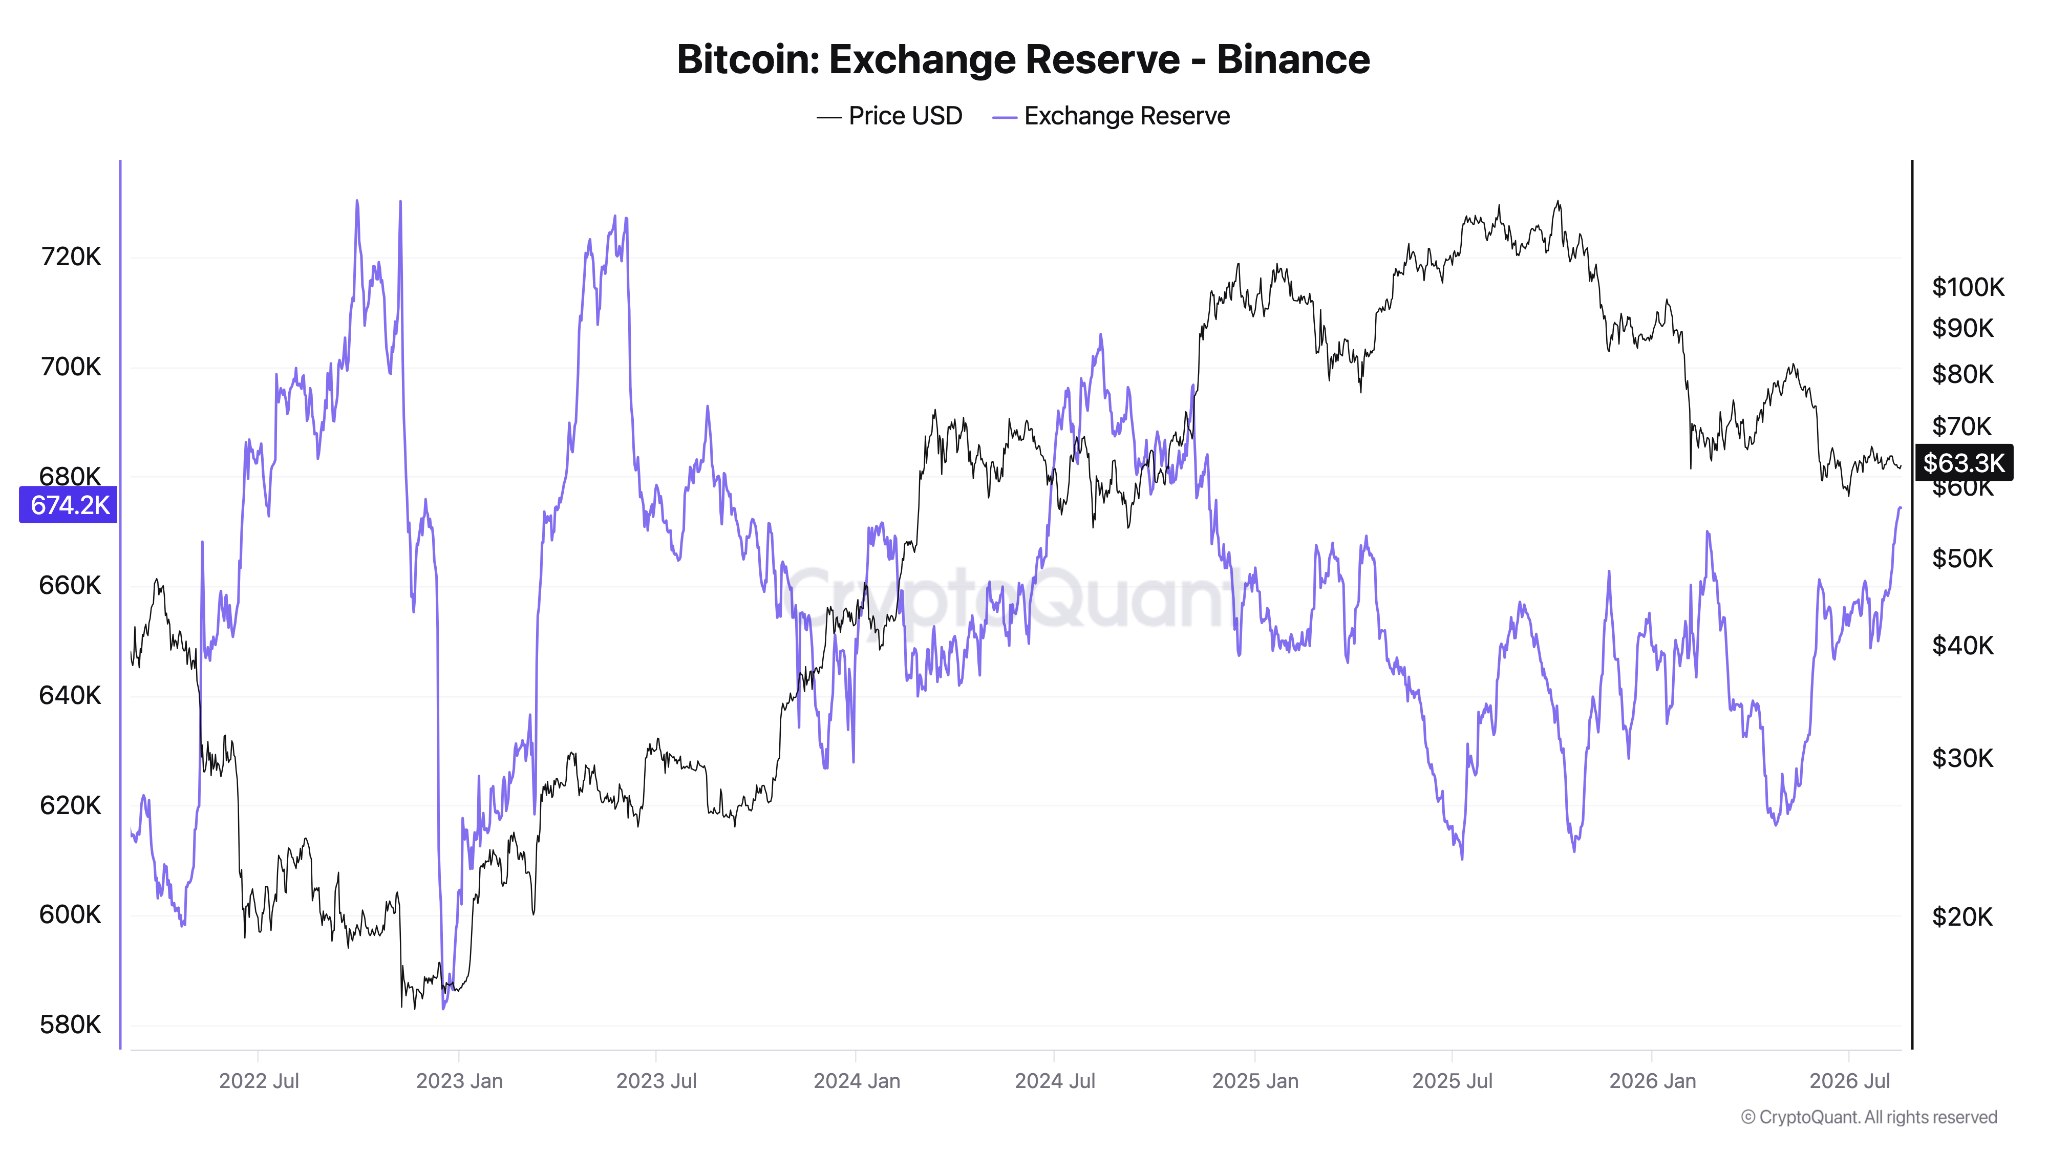
Binance BTC reserves. Source: CryptoQuant
As Cointelegraph reported, exchange activity has been driven by derivatives markets as BTC/USD trades in a tight range since early June. On Binance, futures trading volume was eight times that of spot markets in early August.
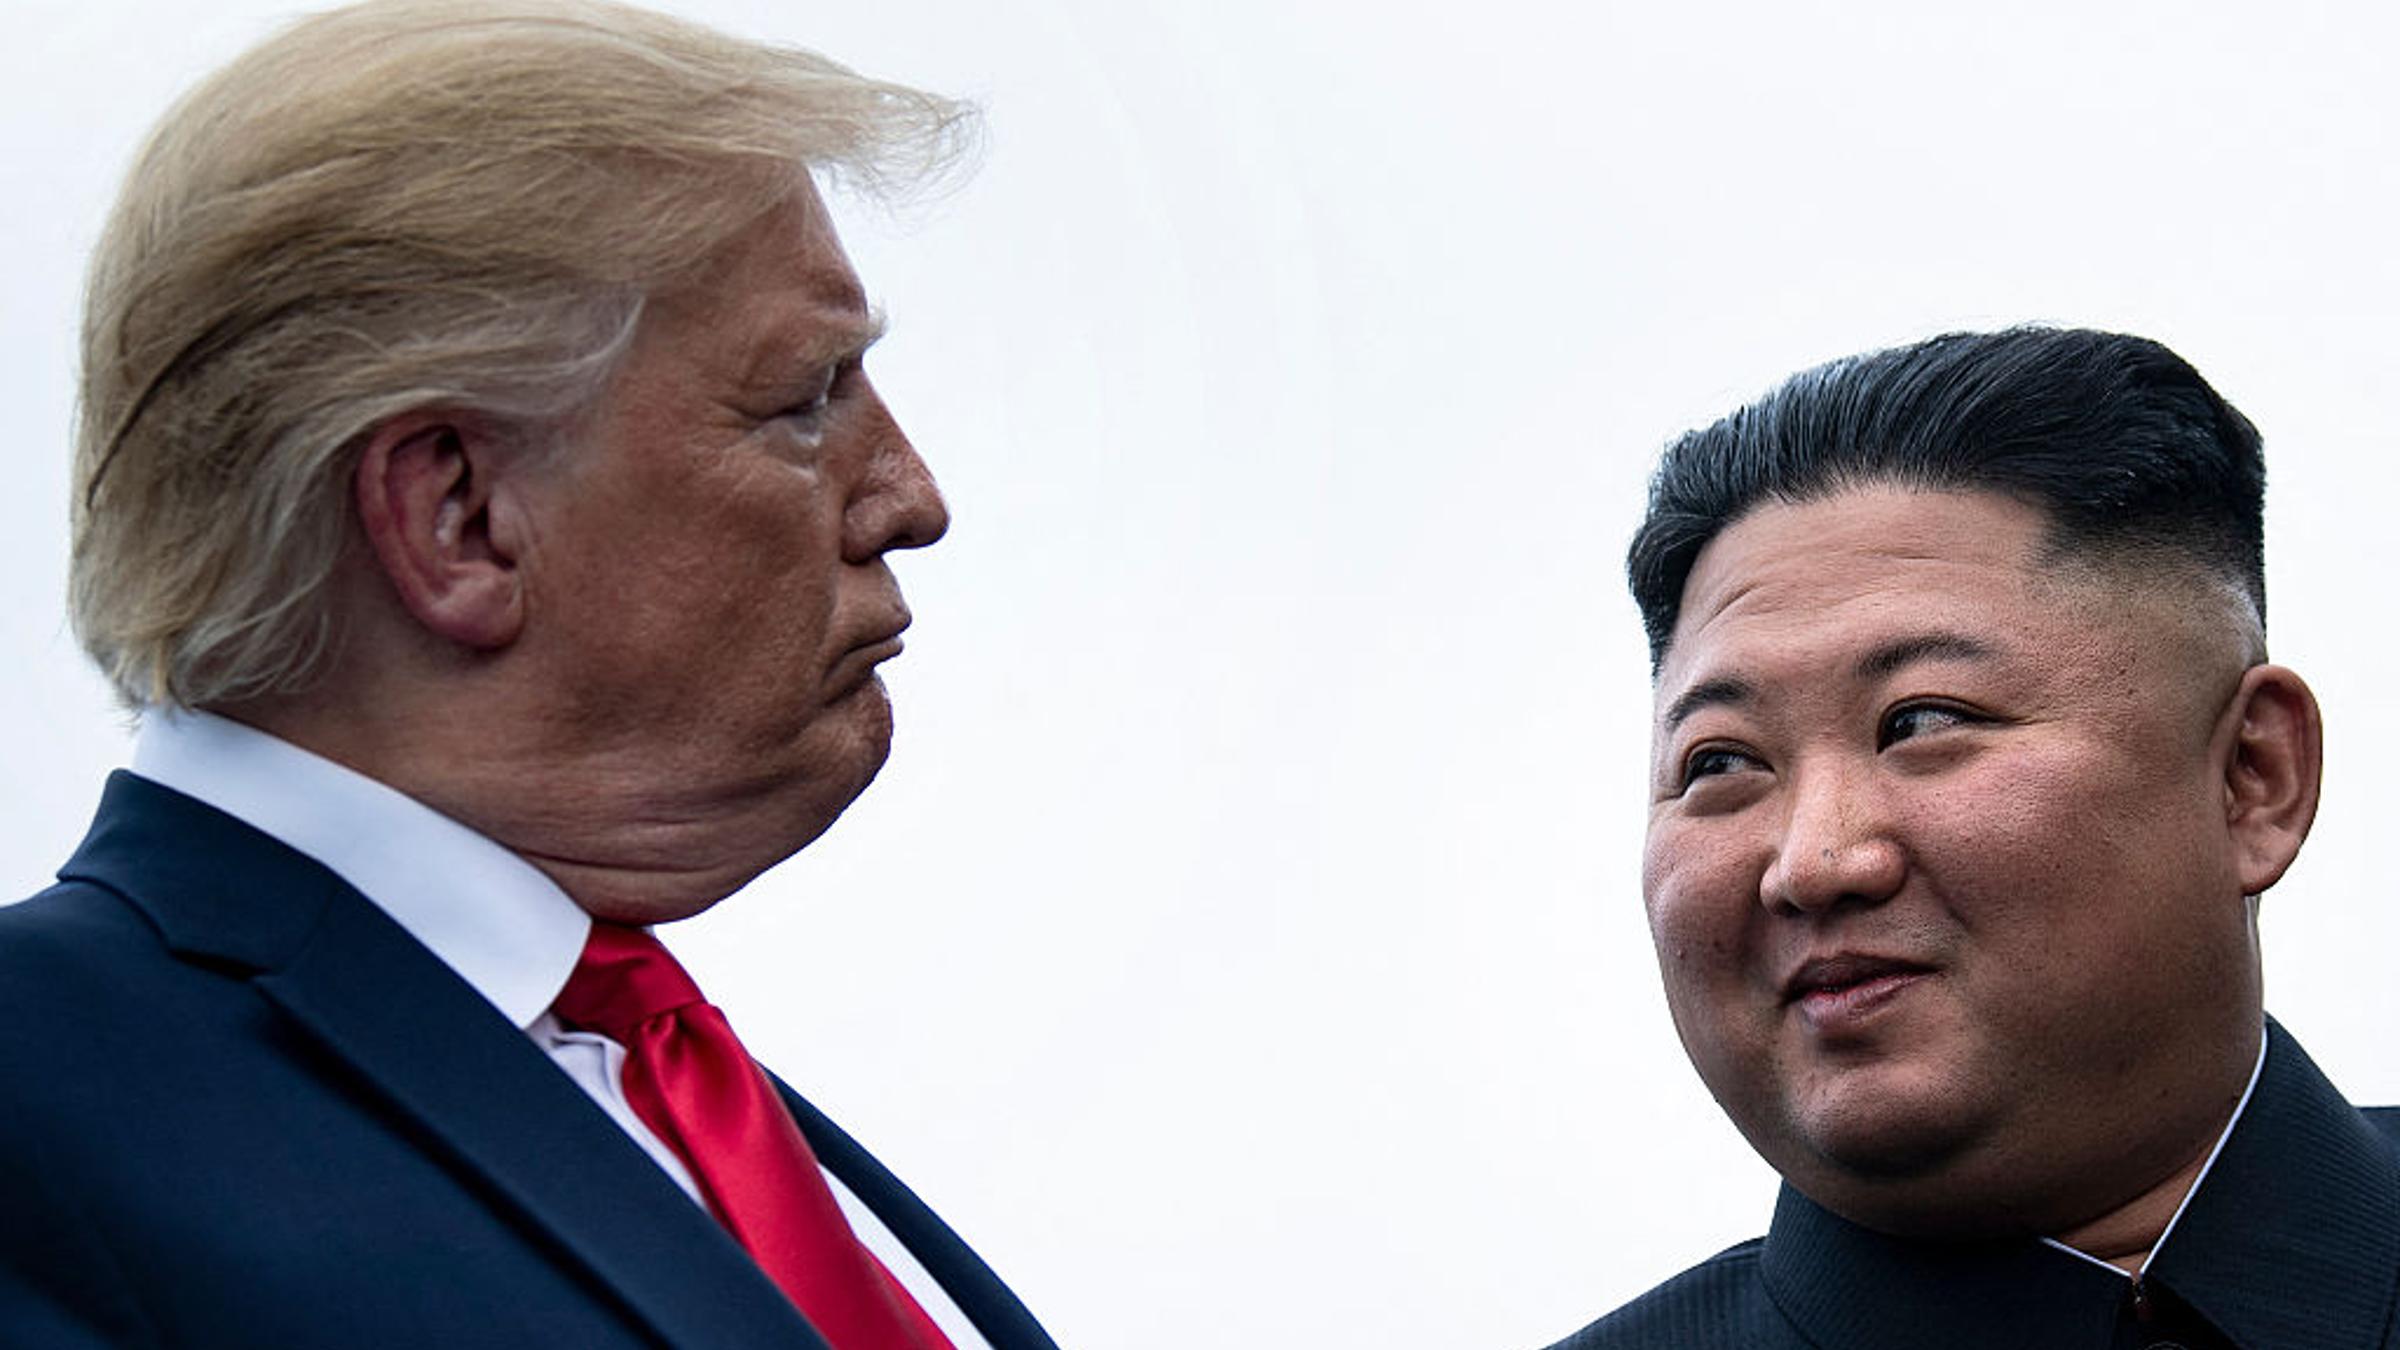
Pyongyang has also aggressively expanded its global military footprint following its June 2024 comprehensive strategic partnership with Moscow, dispatching more than 14,000 North Korean troops, artillery ammunition, and ballistic missiles to support Vladimir Putin’s war in Ukraine. (Ukrainian President Volodymyr Zelenskyy has warned that Kim is preparing to deploy 30,000 more.)
Trump’s criticism of South Korea for declining to help “denuclearize” Iran also sits uneasily alongside North Korea’s longstanding role in the development of Tehran’s strategic weapons programs. From a counter-proliferation perspective, North Korea presents a distinct challenge: unlike Iran, it already possesses an operational nuclear arsenal and has an extensive history of transferring missile and military technology abroad.
“The North Koreans provided Iran with technical assistance, building turnkey factories, technology design, production capabilities, tactics—those kinds of things,” says Daniel Pinkston, an international relations expert at Troy University in Seoul. “Technological agreements and high-level scientific visits go back years.”
Crypto World
Search Interest in Prediction Markets Falls 83% From Its World Cup Peak as Kalshi Pulls Away


Worldwide search interest in prediction markets has returned to roughly where it sat before the 2026 World Cup, and the two venues that take almost all the category's trading volume are moving apart as it does. Both peaks in Google's data land on tournament dates. The decline since is a return to… Read the full story at The Defiant
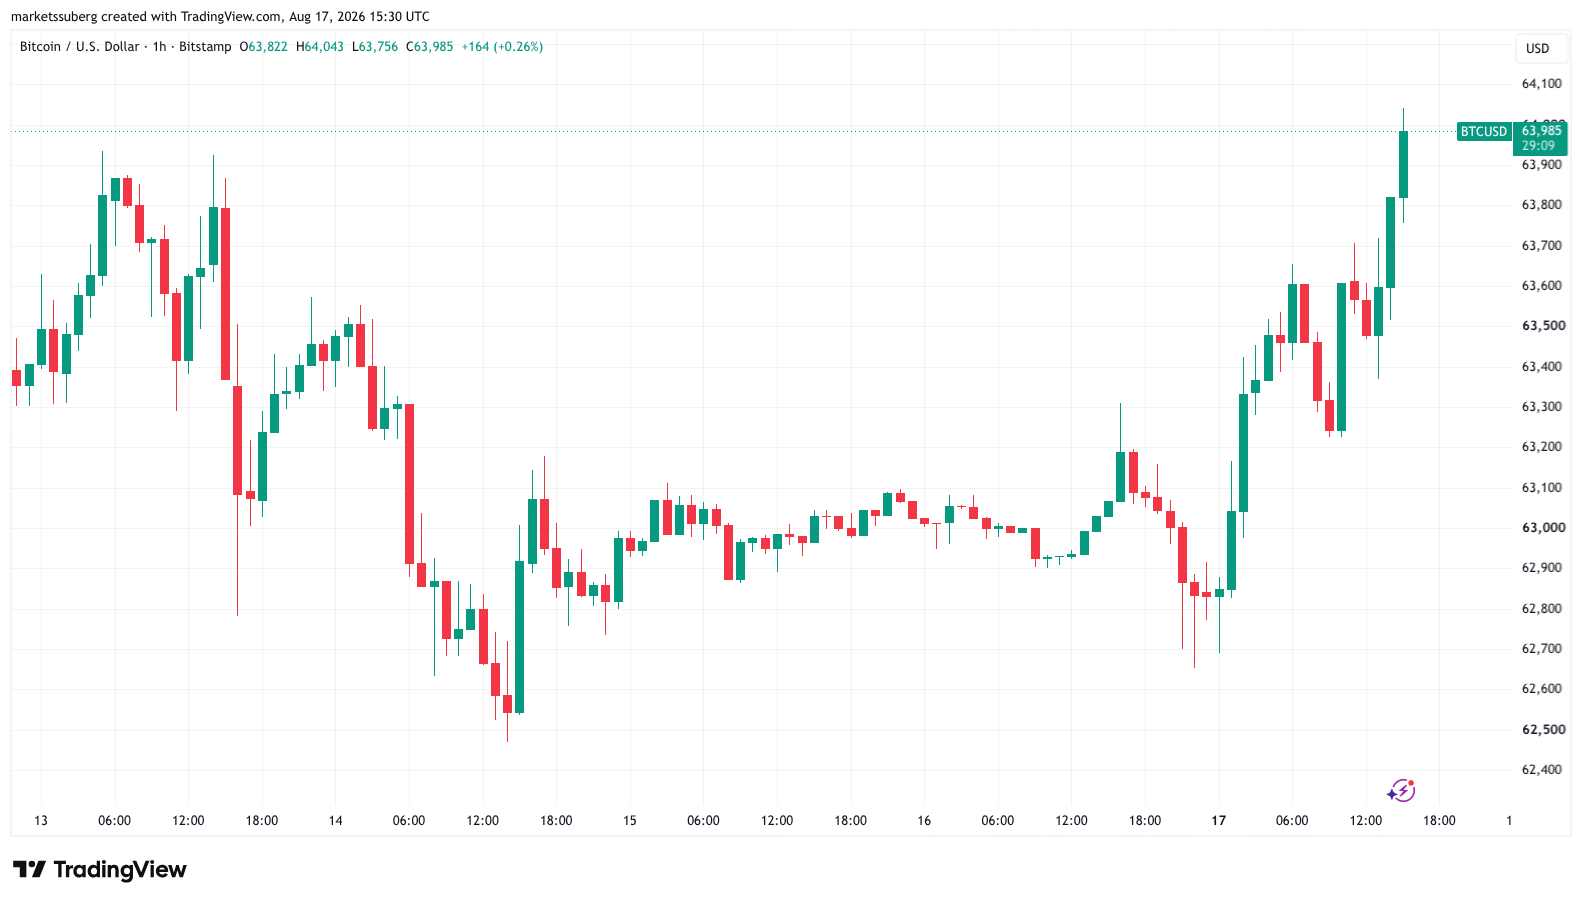
Bitcoin (BTC) returned to $64,000 after Monday’s Wall Street open as US stocks gave way to gold.
Key points:
- Bitcoin continues a rebound from Sunday’s weekly close, gaining 2% on Monday.
- Oil stays steady after US president Donald Trump threatens to bomb Oman over the Strait of Hormuz.
- Bitcoin funding rates hit 20-month highs of 0.022 last week, data reveals.
Bitcoin inches up as US-Iran rhetoric spreads to Oman
Data from TradingView showed BTC/USD up by more than 2% on the day, rebounding from Sunday’s weekly close.
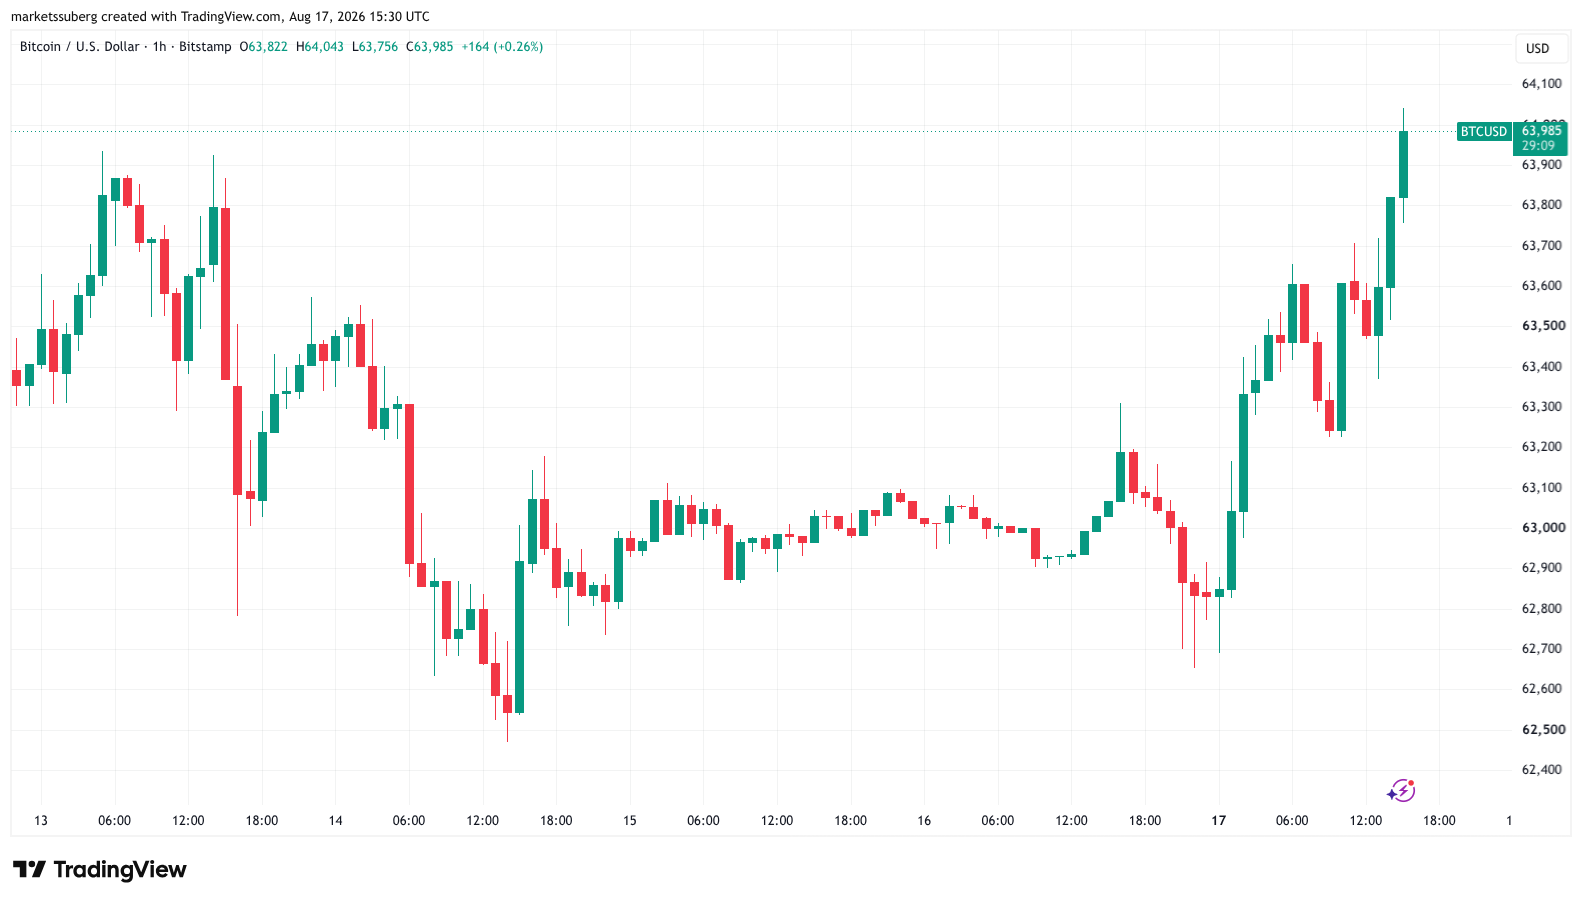
BTC/USD one-hour chart. Source: Cointelegraph/TradingView
US equities turned lower as an agreed 60-day ceasefire between the US and Iran was set to expire, with the S&P 500 index down 0.5% from Thursday’s all-time highs.
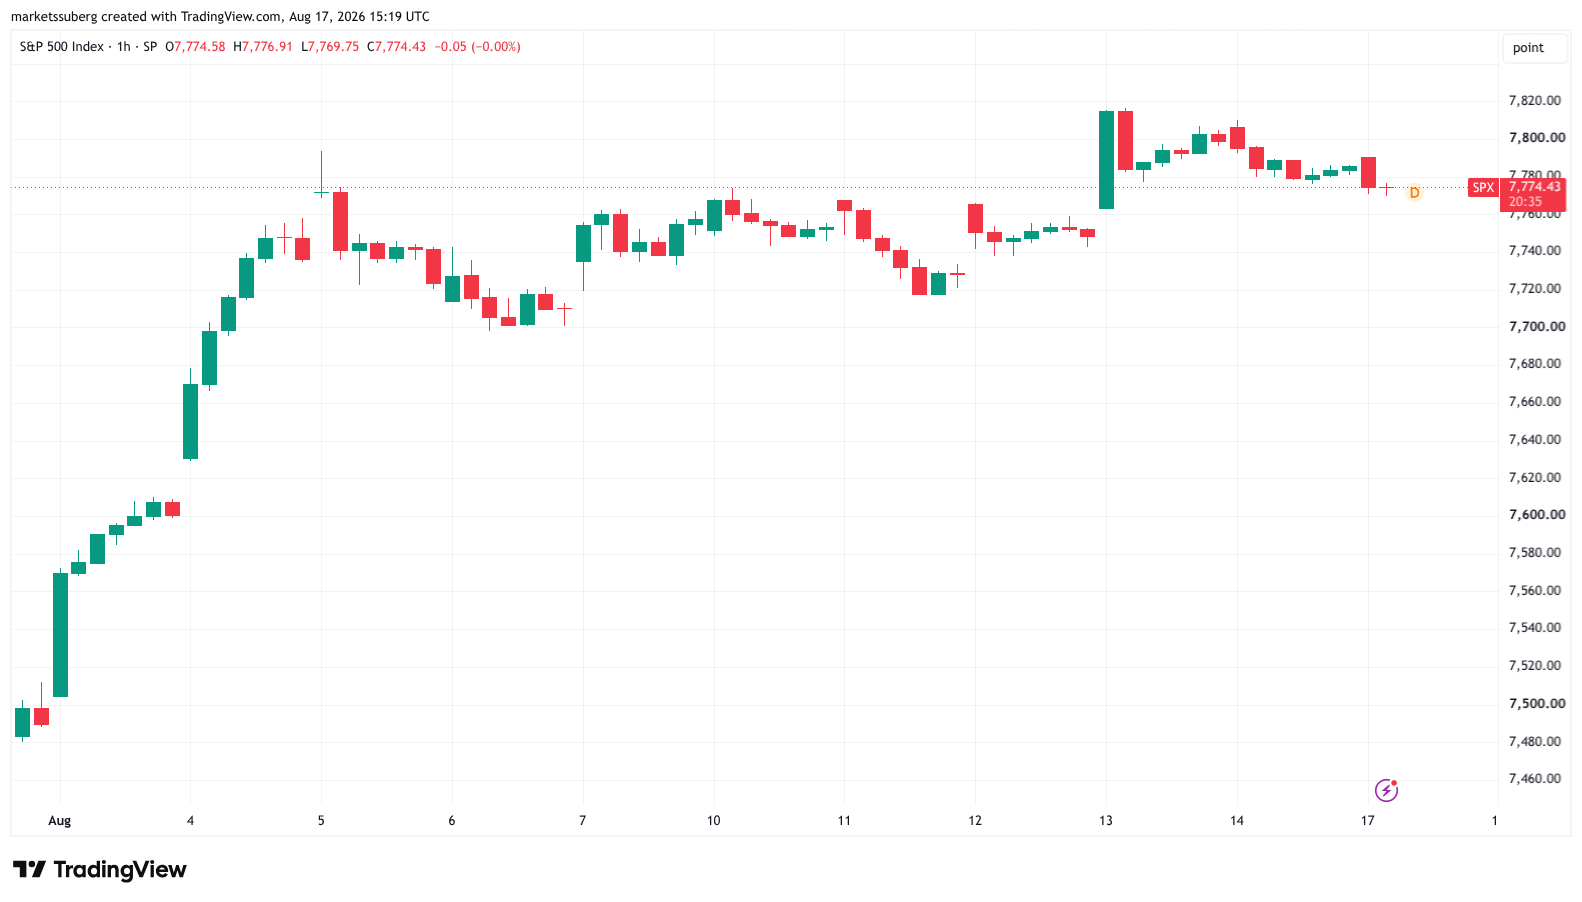
S&P 500 one-hour chart. Source: Cointelegraph/TradingView
Speaking to Fox News, Trump threatened Oman with military action amid an ongoing dispute over the reopening of the Strait of Hormuz oil route.
“If Oman gets in the way, we’ll bomb the s*** out of them,” he told the network.
Oil markets appeared unfazed by the tensions, with WTI crude flat at $82.35 per barrel at the time of writing.
Safe haven gold was more volatile, gaining just over 1% to start the week to reach a daily high of $4,427 per ounce. Earlier, Cointelegraph reported on a combination of retail and government interest fueling gold’s multiweek highs.
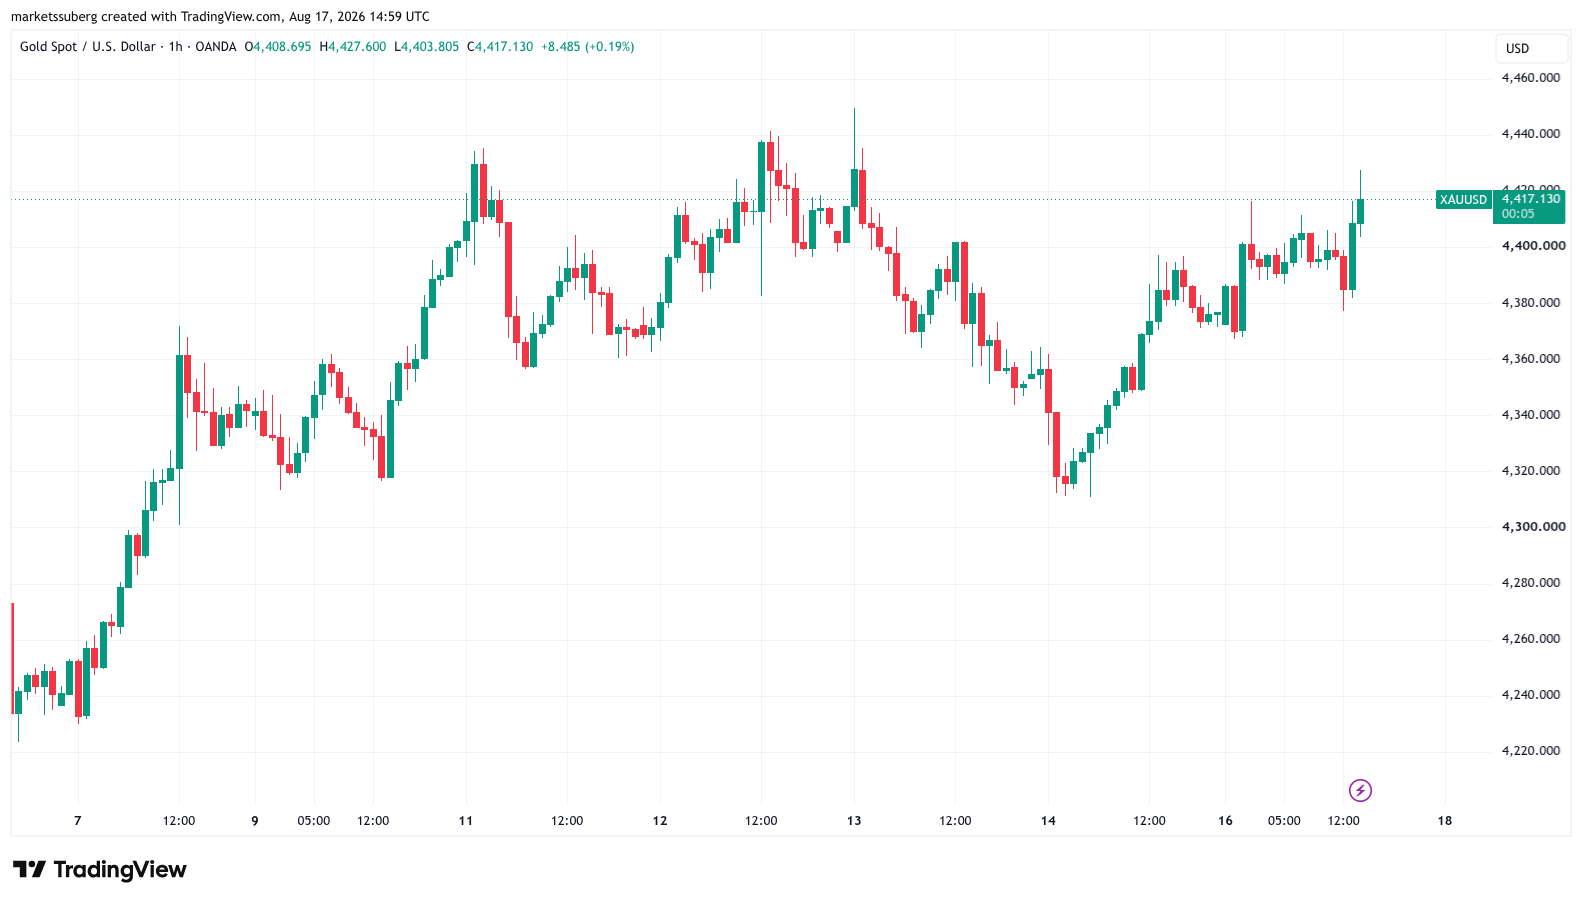
XAU/USD one-hour chart. Source: Cointelegraph/TradingView
Data from investment research platform Bytetree tracking the 30-day change in inflows to gold-backed exchange-traded funds (ETFs) put the figure at nearly $12 billion through Aug. 13.
In a note on Monday quoted by Investing.com, Bank of America strategist Michael Hartnett wrote that long gold remained the trade, describing it as “still [sic] best hedge against dollar debasement, bond collapse, asset inflation, capitalist populism vs socialist populism politics of 2020s.”
Related: BTC price loses 200-week trend line as 2022 repeats: Five things to know in Bitcoin this week
Funding rates hit levels not seen since late 2024
In its latest Market Color bulletin published on Monday, trading company QCP Capital noted Bitcoin’s continued ability to weather macro tailwinds without a major breakdown from its current range.
“Rather than treating individual price levels as directional signals, the more useful observation is that BTC remains close to the lower end of its recent range. A sustained move outside that range would provide more information about market positioning than the relatively contained moves seen within it,” it wrote.
Earlier, Cointelegraph reported on expectations that a return to $61,000 would trigger an unwinding of BTC long positions, adding to downside BTC price momentum.
The latest data from CoinGlass showed liquidations remaining muted as BTC/USD returned toward $64,000, with 24-hour cross-crypto liquidations at $180 million.
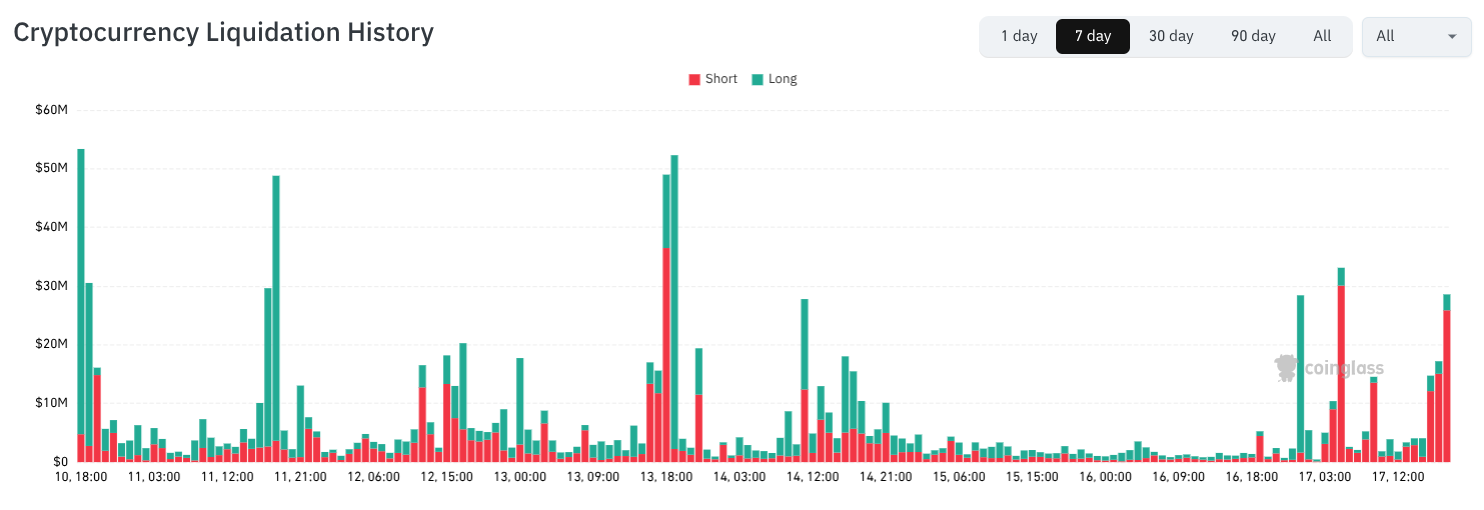
Crypto liquidation history (screenshot). Source: CoinGlass
In a sign of long BTC becoming an increasingly crowded trade, derivatives market funding rates hit 20-month highs of 0.022 on Aug. 14, per data from onchain analytics platform CryptoQuant.
“The derivatives market sentiment is positive within the current BTC price range, indicating that most traders are taking long positions,” it commented on the readings.
CryptoQuant previously noted that futures trading volume on Binance was outweighing spot markets by almost eight times.
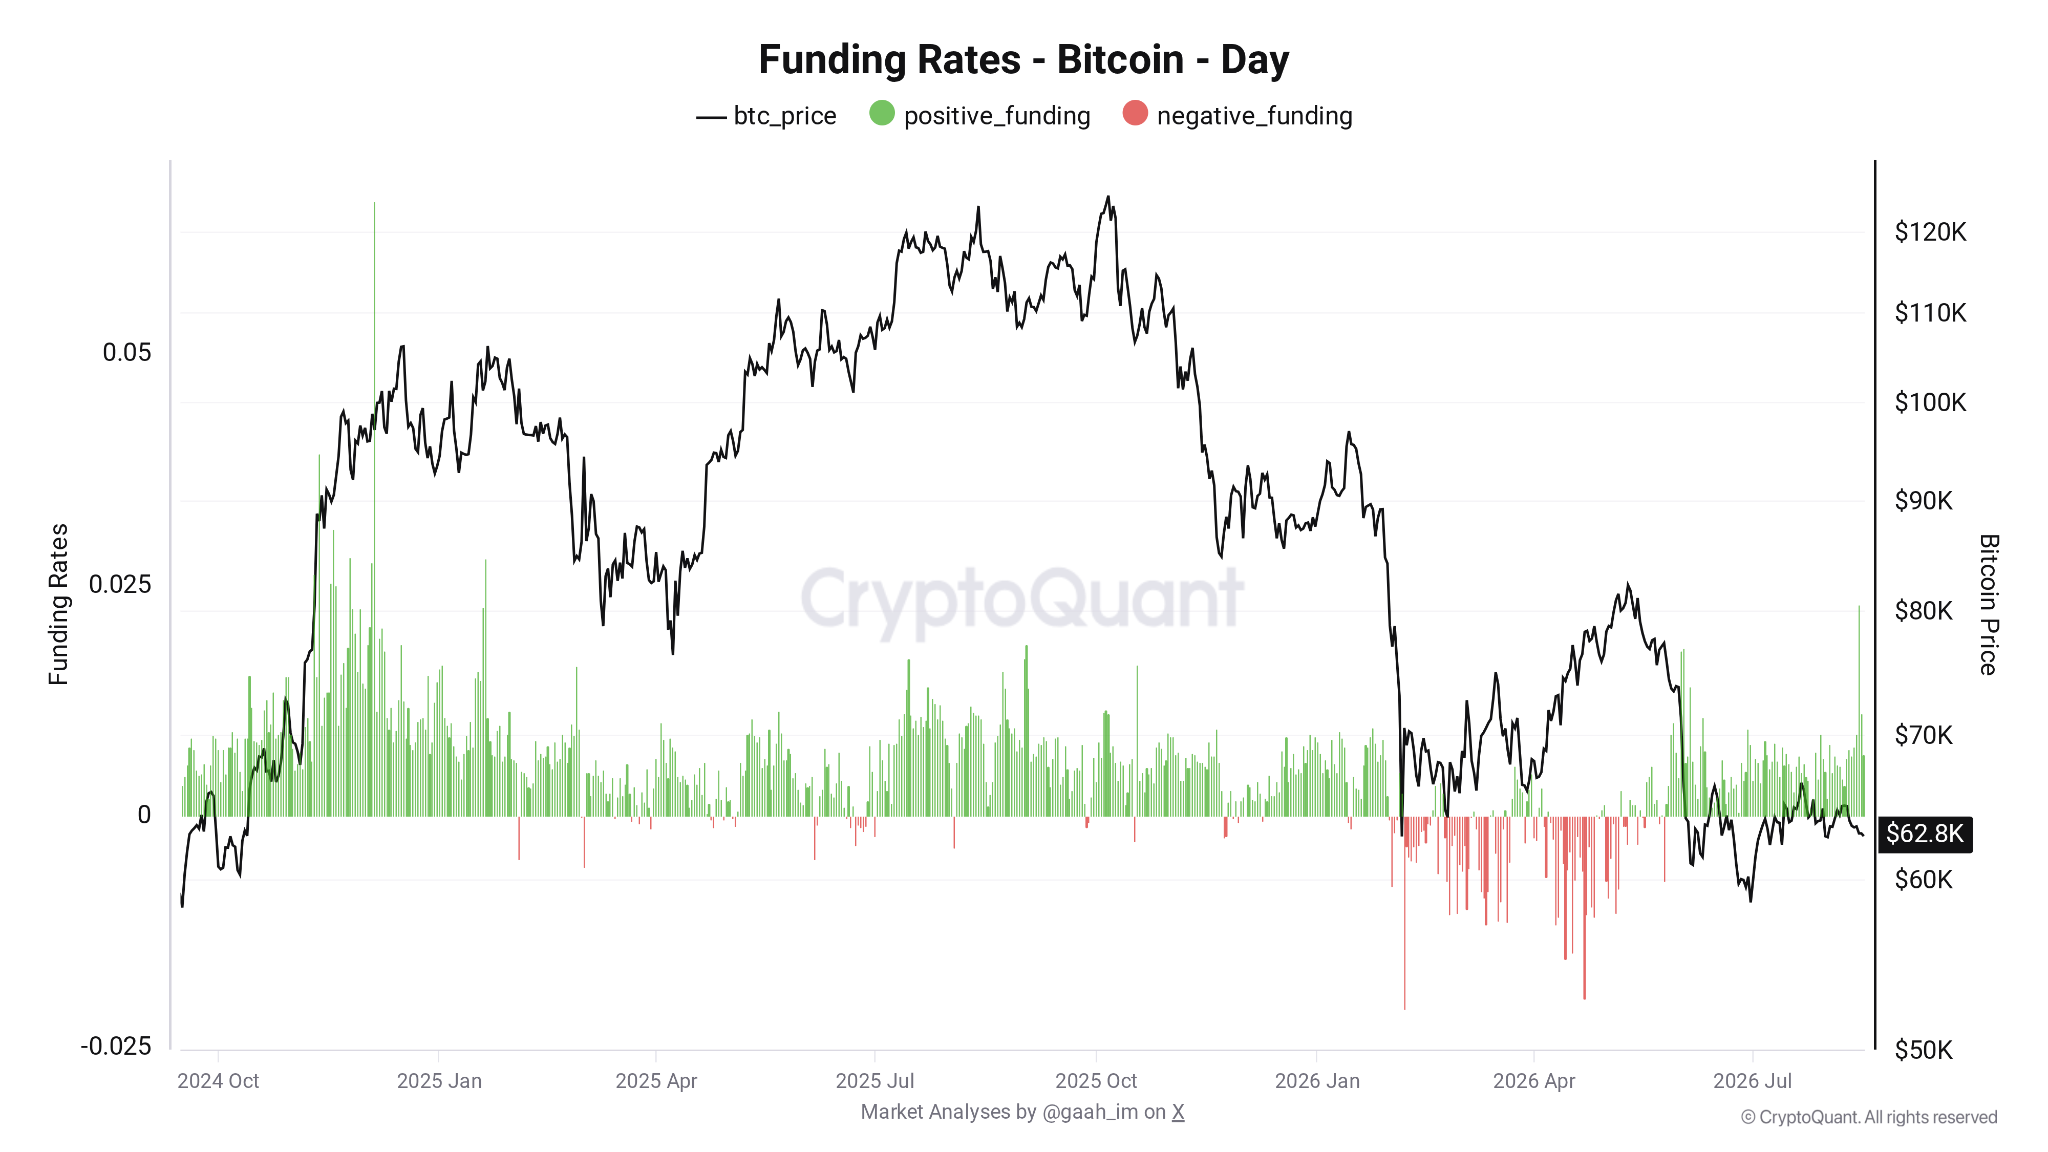
Bitcoin funding rates chart. Source: CryptoQuant


The US Department of the Treasury issued a notice of proposed rulemaking related to the implementation of the Guiding and Establishing National Innovation for US Stablecoins (GENIUS) Act, a bill to establish a framework for payment stablecoins signed into law last year.
In a Monday notice, the Treasury Department said that it was opening a proposed rule up to public comment ahead of the January 2027 implementation of the GENIUS Act. Under the terms of the bill, the stablecoin law had been scheduled to go into effect 120 days after agencies finalize rules, or 18 months after it was passed in July 2025, making its effective date Jan. 18, 2027.
Treasury Secretary Scott Bessent said that the department “welcomes input from stakeholders as [it works] to provide the regulatory certainty businesses need to innovate and grow in America.”
Together with the Treasury Department, other US government agencies including the Office of the Comptroller of the Currency (OCC), the Federal Deposit Insurance Corporation (FDIC) and the Federal Reserve Board have issued notices of proposed rules in 2026 related to the implementation of GENIUS. However, all departments reportedly missed the 120-day deadline in July to finalize regulations before January, signaling that GENIUS could go into effect without clear guidance.
Related: Wise to resubmit US bank charter application under GENIUS Act
According to Treasury, once the GENIUS Act goes into effect, an entity generally may not “issue a payment stablecoin” in the US without a related federal or state license. Public comment on the department’s proposed rules is open for 60 days following publication in the Federal Register.
US-UK regulators discuss GENIUS progress
In July, the UK-US Financial Regulatory Working Group met in London to discuss cooperation between the two country’s financial agencies, including implementation of the GENIUS Act.
Although UK authorities have taken steps to address stablecoin regulation, the pending implementation of GENIUS has some crypto industry insiders arguing the country is falling behind the US.
Magazine: Data of 54,000 wallet users leaked, CLARITY odds just 10%: Hodler’s Digest


The regulatory review could shape an emerging market that lets companies and investors trade and hedge the cost of increasingly scarce AI computing power.

XRP has struggled to hold its ground in August and is facing renewed downside risk after slipping below the psychologically important $1 level.
Analysts are now warning that the crypto asset could have further room to fall before establishing a durable market bottom.
Battle Around $1 Intensifies
Crypto analyst Patel expects XRP to potentially decline another 20%-40%, which puts the projected macro accumulation zone between $0.85 and $0.65. The outlook comes after the token suffered a steep decline from its cycle peak. In fact, XRP is down by over 70% since July 2025.
Rather than viewing the current weakness as an immediate buying opportunity, Crypto Patel’s analysis points to the range as an area where macro accumulation could become more attractive if selling pressure intensifies.
Zooming in, however, one momentum indicator is beginning to stabilize. On the 4-hour RSI, another market watcher, Diana, noted that the indicator is holding around 42 and has moved slightly above its signal line near 41.8, while price remains largely flat and recent candles are becoming tighter rather than extending aggressively lower.
According to her, bulls would need XRP to move through $1.015, $1.05, and $1.081. A break above $1.081 would bring $1.145 and $1.20 into focus. On the downside, Diana said a decisive break below $1 with follow-through would put $0.906 and $0.861 back on the radar.
“If this is ACCUMULATION, XRP doesn’t need to explode immediately. It needs to keep absorbing the selling around $1 until buyers finally force a breakout.”
Wall Street’s Growing XRP Exposure
Despite the choppy price action, Wall Street is quietly loading up on XRP exchange-traded funds. CryptoPotato recently reported that several major financial firms reported exposure to these funds at the end of the second quarter.
For instance, Jane Street Group stood out with more than 1.2 million shares of the Bitwise XRP ETF, compared with just 20,605 shares at the end of the first quarter. The trading firm also held positions in XRP ETFs from Franklin Templeton, Grayscale, Canary Capital, and 21Shares.
Meanwhile, Bank of America reported 13,260 shares of the Volatility Shares XRP ETF, which is worth around $76,000. Morgan Stanley also disclosed holdings in three funds, including Franklin, REX-Osprey, and Bitwise products.
Other reported holders included Wolverine Asset Management, which has nearly 200,000 Bitwise shares, and Gallacher Capital Management, with 86,744 Capital XRP ETF shares. Main Street Group and National Bank of Canada also reported smaller positions related to the asset.
The post Ripple’s (XRP) $1 Breakdown Could Get Worse Before It Gets Better appeared first on CryptoPotato.
Peter Schiff picked the 55th anniversary of America’s break with gold to make a blunt case. The 1971 decision, he argues, is why the dollar is in trouble today.
Schiff is a founding member of Euro Pacific Asset Management. He made the argument on his weekend podcast. Washington defaulted on gold back then, he says, and the world is now leaving the dollar.
Why 1971 Still Shapes the Dollar Debate
President Richard Nixon closed the gold window on August 15, 1971. Foreign governments could no longer swap dollars for metal. The rate had been $35 an ounce.
“I have directed Secretary Connally to suspend temporarily the convertibility of the dollar into gold or other reserve assets… your dollar will be worth just as much tomorrow as it is today,” Richard Nixon, in his August 15, 1971 address.
Nixon called the move temporary. It has now lasted 55 years.
The promise about value aged worse. Federal price data shows a 1971 dollar buys roughly 12 cents of goods today. Consumer prices have climbed 718% since that August.
Schiff calls the move a default, not a technical fix. Federal Reserve notes promised gold, he says. Washington simply stopped paying.
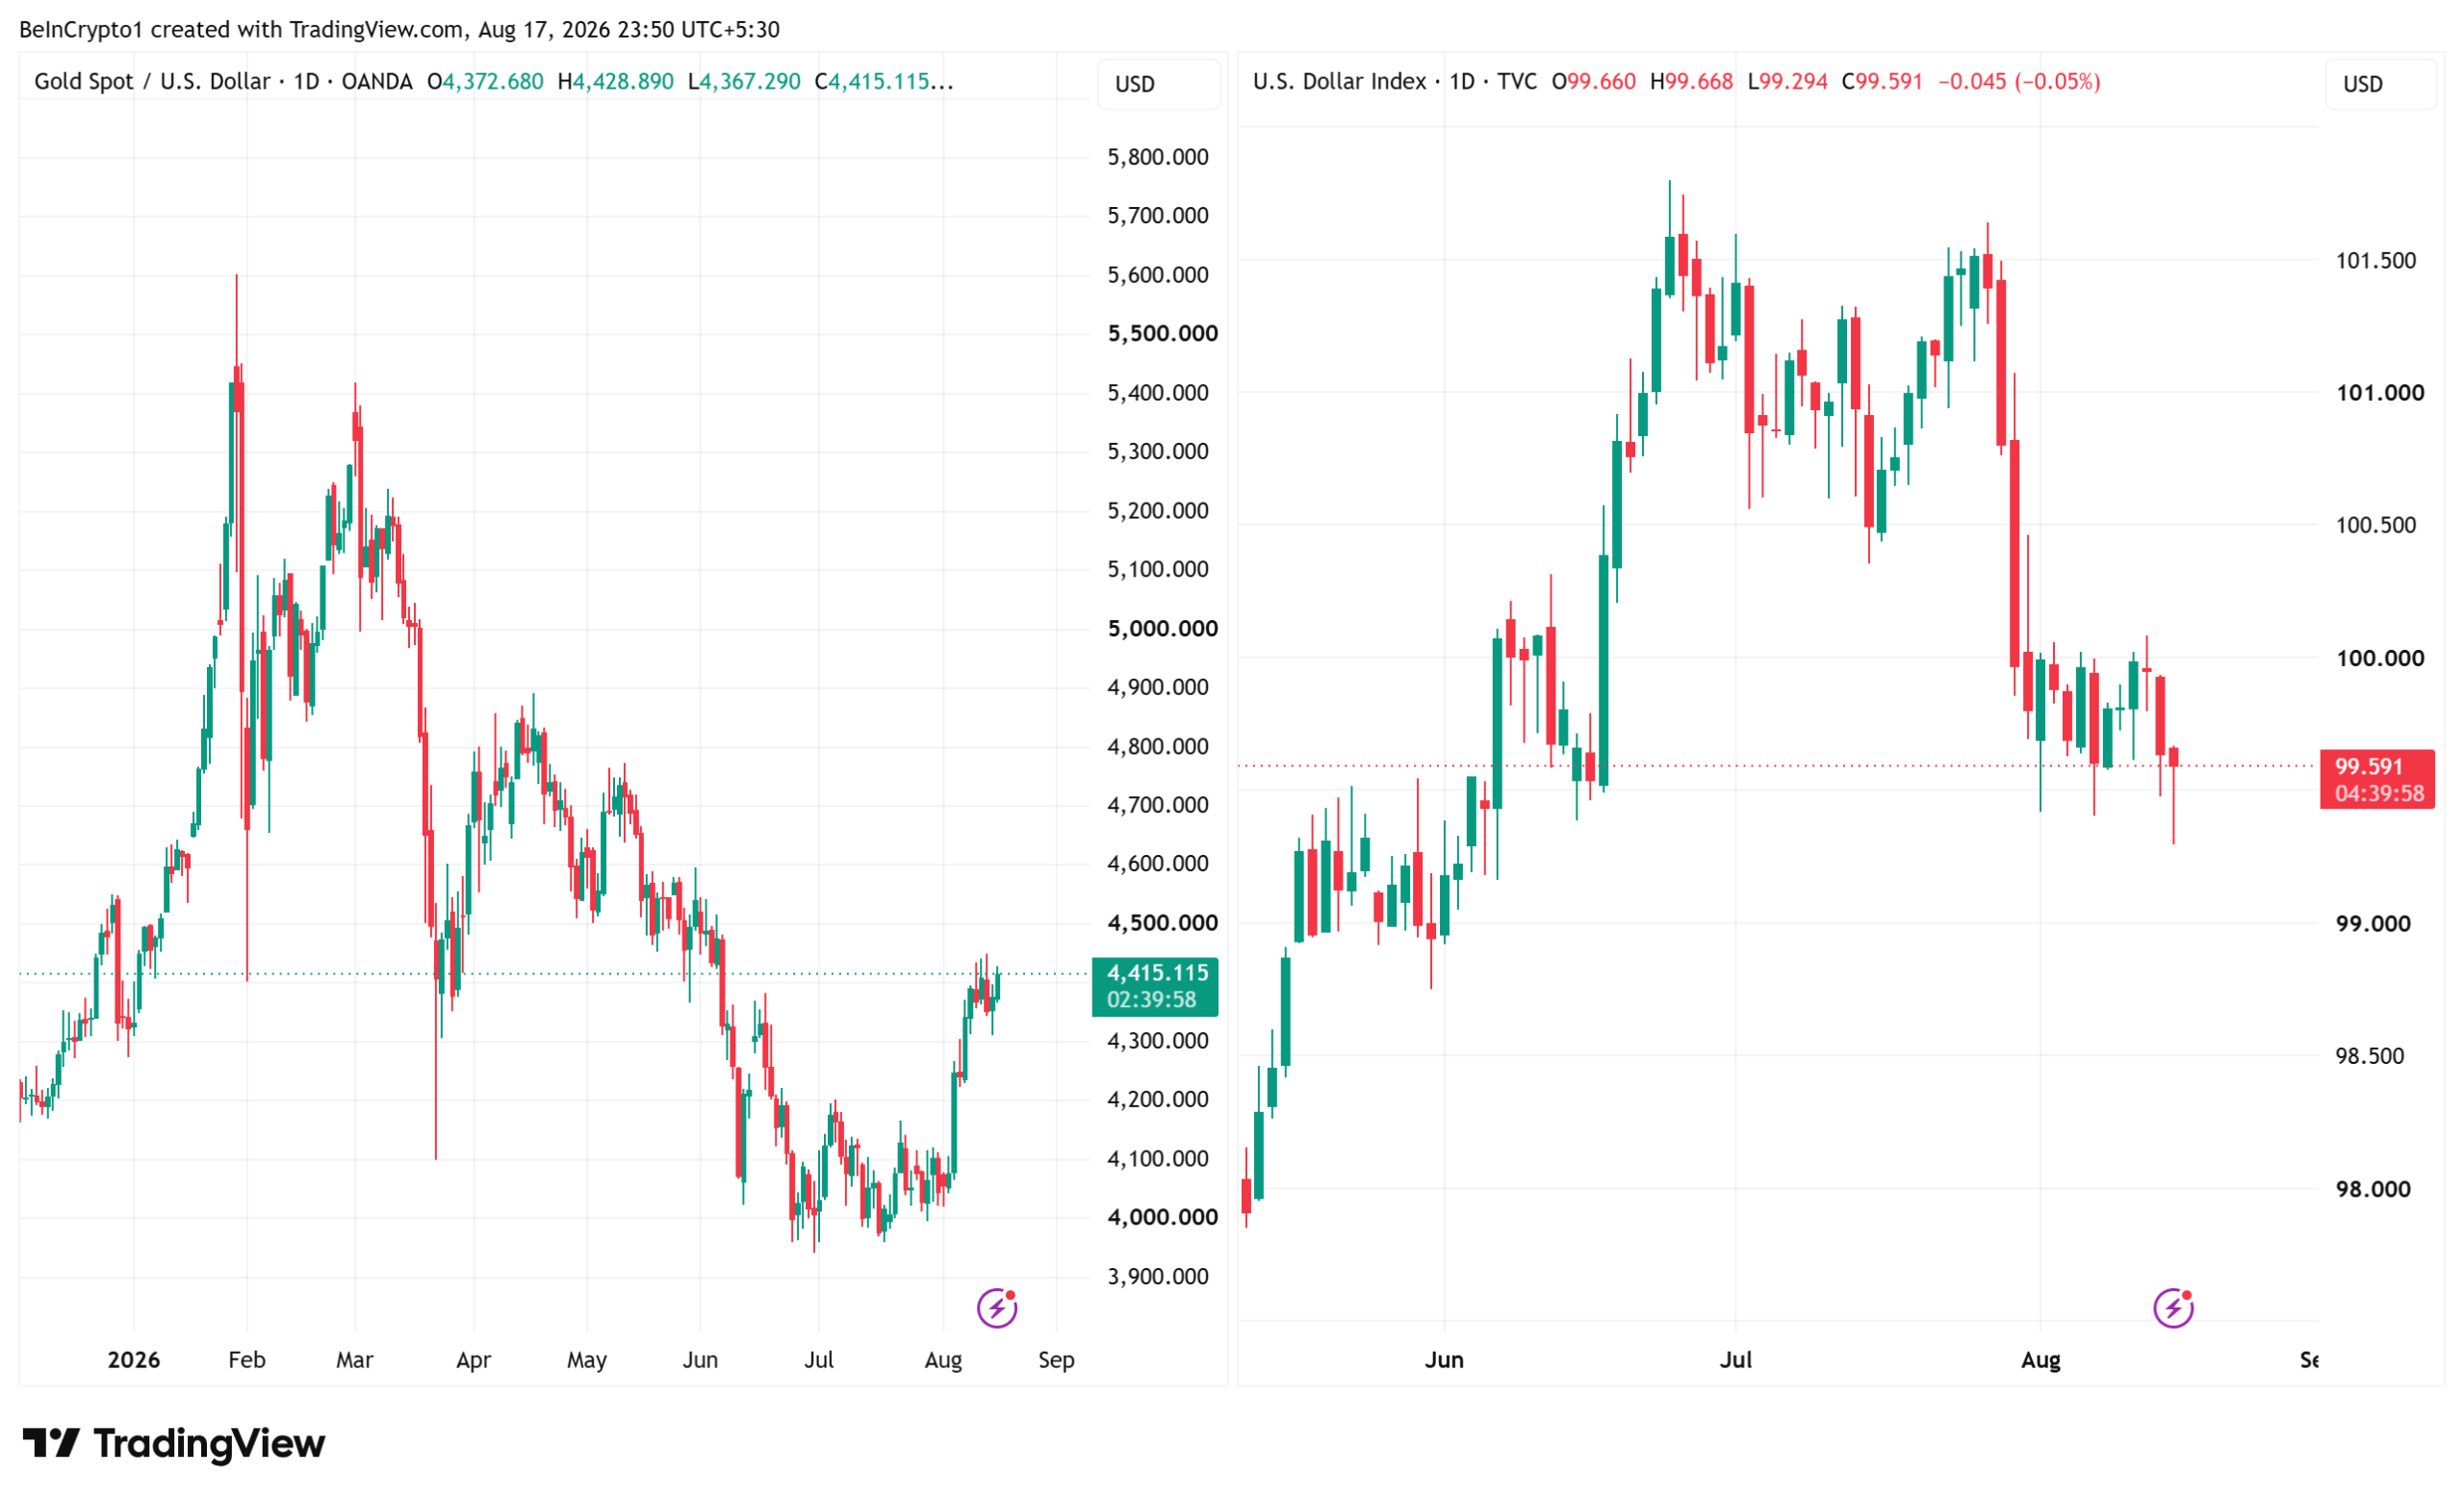
Gold tells its own story. The metal closed Monday at $4,418, up 0.94%. That is about 126 times the 1971 price. The dollar looks soft rather than broken. It slipped to a three-month low against peers on Monday.

“We left gold in 1971. Now the world is leaving the dollar,” said Schiff.
Follow us on X to get the latest news as it happens
The Federal Reserve’s broad dollar index has lost only 1.8% in a year.
De-Dollarization Becomes the Next Test
Schiff’s bigger claim is that 1971 only finished half the job. The dollar lost value through the 1970s. Yet the world kept holding it anyway.
That habit paid for a lot. It let America buy more than it made. It let Washington borrow without a hard limit.
Federal debt reached $39.93 trillion on August 13. Roughly $65 billion now stands between the country and $40 trillion.

“The world is de-dollarizing. The world is going off of the dollar standard. It’s a process. It started. It hasn’t finished, but I think the economic consequences are going to be profound,” Schiff added.
He expects households to feel it first. Imports get pricier once trade deficits close. Living standards fall when a country can only spend what it earns.
BeInCrypto research ran a 55-year currency savings test on that question. Gold worked best as long-term insurance. The dollar still won on liquidity.
The Gold Bid Is Now a Central Bank Question
Schiff’s thesis has a testable part. If the world is really leaving the dollar, central banks should show it.
The gold half checks out. Central banks bought 289 tonnes in the second quarter, according to World Gold Council figures. That is 62% more than a year earlier.
The first quarter looked very different. Buying collapsed to 56.5 tonnes. Some governments sold metal to raise cash during the energy crunch.
Veteran strategist Jeff Currie built a framework around that swing. Currie once ran commodities research at Goldman Sachs and now advises Carlyle Group. Gold loses its biggest bid, he argues, when central banks turn into forced sellers. His long-run target is $10,000 an ounce.
The dollar half does not check out yet. The greenback’s share of world reserves rose to 57.13% in the first quarter, IMF figures show. It sat at 56.42% three months earlier.
The euro holds 20.03% of reserves. China’s renminbi holds under 2%. Earlier BeInCrypto analysis of dollar reserve share data found currency swings, not selling, drove most of a previous decline.
Bitcoin has not stepped into the gap either. Bitcoin price near $63,517 leaves it roughly flat over the past month. Gold climbed while it stalled.
So central banks are buying gold hard. They are not dropping dollars yet. Schiff’s 55-year argument now rests on whether those two lines finally cross.
The post Peter Schiff Links 1971 Gold Decision to Today’s Dollar Crisis: Will XAU Hit $5,000? appeared first on BeInCrypto.
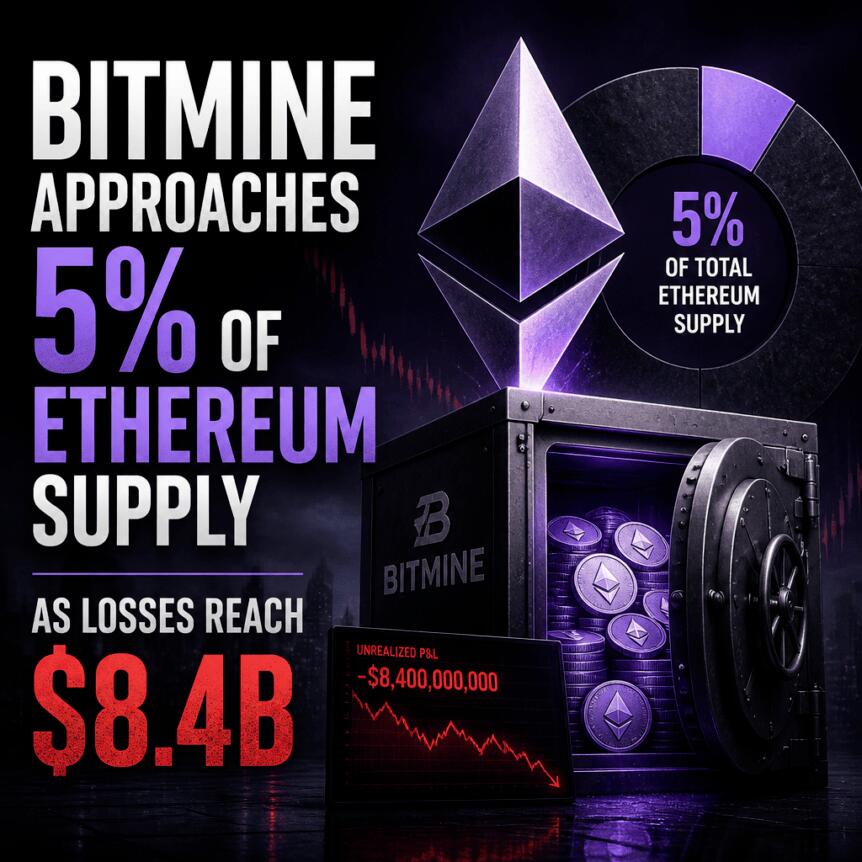
Tom Lee’s Bitmine Immersion Technologies has restarted a steady program of Ethereum treasury buying, adding 9,926 ETH during the week ending Aug. 16. The company says the purchase brings its Ether holdings to roughly 5.82 million ETH—about 4.8% of Ethereum’s circulating supply—putting it close to its long-term goal of owning 5% of the asset’s total supply.
In its disclosure, Bitmine also provided valuation context: at an ETH reference price of $1,893, the latest portfolio total is worth about $11 billion. But the company notes that many of its ETH were acquired at significantly higher prices, underscoring how difficult the prolonged bear market has been for Ethereum treasury strategies.
Key takeaways
- Bitmine bought 9,926 ETH for the week ending Aug. 16, lifting holdings to about 5.82 million ETH (around 4.8% of circulating supply).
- At a reference price of $1,893, Bitmine’s Ether stake is valued near $11 billion, though acquisition costs are substantially higher for a large portion of the position.
- Industry data cited by DropsTab estimates unrealized losses of more than $8.4 billion on the current ETH treasury.
- Despite the drawdown, Bitmine continues to stake more than 5 million ETH, which it says is generating protocol rewards.
- Bitmine’s staking yield was reported at 2.61% over seven days, implying roughly $287 million in annualized staking rewards, according to Tom Lee.
Restarting the “Alchemy of 5%” push
Bitmine’s strategy is built around scale and patience. After resuming purchases last week, the company is now within reach of its “Alchemy of 5%” target: holding 5% of Ethereum’s total supply. That target matters because it signals a treasury model designed to treat Ether as a long-duration bet rather than a tactical trading position.
According to Bitmine’s disclosure, the latest weekly buy also helps explain why the company continues to frame its program as a process rather than a series of opportunistic trades. The reported accumulation keeps the company moving toward a specific ownership threshold—one that would materially increase its influence and relevance as an institutional holder in Ethereum’s expanding ecosystem.
Unrealized losses remain a pressure point
The renewed buying comes even as Ether’s market environment has tested Bitmine’s conviction. The company is reported to be sitting on more than $8.4 billion in unrealized losses on its ETH holdings, based on industry data cited by DropsTab. DropsTab’s estimate places Bitmine’s unrealized losses at around 43% relative to the company’s reported acquisition costs, despite the current portfolio value being above $11 billion.
That mismatch—between the size of the position and the magnitude of drawdowns—highlights a key risk for any “buy-and-hold” treasury plan executed through a full market cycle. Even when a strategy is long-term, the path matters: buying during a downtrend can create large paper losses that only reverse if market prices recover meaningfully.
Staking helps fund the wait
What differentiates Bitmine’s approach from a simple spot accumulation strategy is its ongoing staking operation. The company said it is staking more than 5 million ETH, which it values at roughly $9.6 billion at current prices. By staking, Bitmine earns protocol rewards for helping secure the network—providing a source of yield that can partially offset the emotional and financial pressure of unrealized drawdowns.
Bitmine’s filing also links its staking activity to a measurable performance indicator. Based on a seven-day staking yield of 2.61%, Tom Lee projects annualized staking rewards of roughly $287 million. While annualized estimates can fluctuate—since staking yields depend on network conditions and how rewards are distributed—the point for investors is clear: Bitmine’s treasury is not entirely exposed to price movement. A portion of its return profile is tied to staking economics rather than only to Ether’s market direction.
Still, staking does not remove the core uncertainty. If Ether’s price does not recover, unrealized losses can remain large even while protocol rewards accrue. Conversely, if Ether rebounds, staking rewards can accelerate the path toward a healthier overall position—both in absolute returns and relative to acquisition costs.
Why steady accumulation is notable now
Bitmine’s restart of weekly Ether purchases suggests the company is treating the current phase of the market as compatible with its long-term ownership targets. Earlier coverage noted that Bitmine has continued accumulating Ether through weekly buys since launching its ETH treasury strategy in June 2025. In that context, the latest addition looks less like a reaction to short-term price action and more like execution of a defined roadmap.
For market observers, that matters because large treasury actions can act as a counterpoint to narratives that institutional interest fades during downturns. Even when unrealized losses mount, Bitmine appears willing to keep buying as it approaches its 5% target—while using staking yield to keep the strategy funded.
There is, however, an important asymmetry to watch. As Bitmine nears the 5% level, further buying can become harder depending on remaining supply dynamics and how the company structures future deployment. The company’s near-term challenge may shift from “can it keep accumulating?” to “how does it manage valuation risk and portfolio efficiency as its position grows?”
Next, investors and traders will likely focus on whether Bitmine can sustain weekly accumulation while Ethereum staking yields remain stable enough to support the projected reward rate. Just as importantly, readers should watch how fast the market price of Ether moves relative to Bitmine’s acquisition costs—because staking can soften the drawdown, but only a meaningful price recovery can fully relieve the unrealized loss picture.

YouTube Views are About to Explode, But Your Money Won’t

Bitcoin Copies August 2022 With Weekly Close Below 200-Week Trend Line

James Toney snubs Usyk, Stevenson and Inoue when naming the best fighter in the world

Weekend Open Thread: Staud – Corporette.com

Weekend Open Thread – Corporette.com

Weekend Open Thread: Brooks Brothers

#motivation #MoneySecrets #money #shorts #viral #trending #viralvideo #reels #viralshorts #youtube

Is the dinar part of a global financial reset ? #dinar #globalfinancialcrisis

Worst Crypto News Ever – Bitcoin Holders Just Got F**ked
-

 Fashion3 days ago
Weekend Open Thread: Ann Taylor
-
 NewsBeat6 days ago
Communication cards help banking customers access services or report scams
-
 Business7 days ago
Oil Price Today (August 11): Crude oil rises to $88 after Trump’s compensation demand dents Hormuz opening. Here’s why
-

 Crypto World7 days ago
Revolut wins French banking licence, creates second EU banking hub
-
 Sports4 days ago
This U.S. Amateur is a glimpse into golf’s future in more ways than you think
-
 Crypto World7 days ago
Why Did Nvidia Stock Fall on Monday Despite a $500 Billion Wall Street AI Deal?
-

 Sports3 days ago
Birmingham 2026: Day 6 Timetable for Irish Athletes
-
 NewsBeat3 days ago
Myanmar says over 300,000 Rohingya refugees verified for repatriation as exodus enters ninth year
-

 Politics2 days ago
SEQ Code: The Three Letter Boarding Pass Code That Could Give You The Worst Seat
-
 Entertainment5 days ago
Keke Palmer Subtly Hints At Sean Evans Drama With Cryptic Post
-
 Entertainment7 days ago
57 Years Later, the Best Sitcom Ever Made Still Deserves a Reboot
-

 Fashion6 days ago
Coffee Break: The Fonteyn Jane Flat
-

 Tech6 days ago
Zoom Screen-Sharing Bug Let People Fully Take Over Other Devices On A Call
-

 Crypto World7 days ago
Bitcoin's BIP Editors Remove Luke Dashjr Two Days After BIP-110 Fork Stalled
-

 Fashion6 days ago
Should you refinance your debt? Pros, cons, and real numbers
-

 Fashion6 days ago
Claire Life: Kicking Off MVAAFF With the C Suite Luncheon Featuring Phylicia Rashad, Letoya Luckett, and More!
-
 Crypto World6 days ago
XRP bridge drained after software mistook fake deposits for real ones
-

 Sports5 days ago
DeQuan Jones in ‘high spirits’ after successful leg surgery
-
 Tech7 days ago
Zuck rekindles open weights Llama drama with Muse Glimmer
-

 Business7 days ago
(VIDEO) Emirates Unveils 2.4-Meter Arsenal Crest Sculpture Built From Recycled A380 And Boeing 777 Jet Parts
You must be logged in to post a comment Login