

Crypto World
Bitcoin nears Fidelity power law support



Bitcoin is trading around 62,700 dollars, and Jurrien Timmer, Fidelity’s director of global macro, is watching it drift toward a line he has tracked for more than a decade.
Summary
- Bitcoin is trading near Fidelity’s power law support zone, with the model’s lower boundary around 58,000 dollars.
- Jurrien Timmer views the area as an accumulation zone but is not calling a bottom without a clear catalyst.
- The power law support has aligned closely with major Bitcoin lows in 2015, 2018, and 2022.
- Bitcoin’s deviation from trend and its underperformance against gold now resemble prior cycle-bottom conditions.
- The main missing ingredient is liquidity, which has historically determined when accumulation zones turn into recoveries.
On his power law model, a logarithmic chart that bounds Bitcoin’s entire price history between an upper resistance curve, a middle trendline, and a lower support curve, the floor currently sits near 58,000 dollars. That lower line has caught every major Bitcoin bottom since 2015. Timmer’s label for the zone the market has now entered is unambiguous: accumulation. His caveat is just as unambiguous: he sees no catalyst for a reversal, and he is not calling a bottom.
That combination, a historically reliable floor approaching and a strategist refusing to ring the bell, is the most honest summary of the Bitcoin market in July 2026. The asset is coming off its worst quarter since the 2022 bear market, spot ETFs just recorded their largest quarterly outflow since launch, the speculative premium that carried the price past 120,000 dollars last year has evaporated, and the fast money has visibly rotated elsewhere, first into gold, then into semiconductor stocks. And yet the two quantitative measures Timmer trusts most, the deviation from the power law trendline and the Bitcoin-to-gold ratio, have both sunk to depths recorded at exactly two prior moments: the 2018 low and the 2022 low. Both of those moments were generational buying opportunities. Both also felt like the end of the world at the time.
This feature takes the model seriously in both directions: what the power law actually says, why its track record earns attention, and why the missing-catalyst objection is not a hedge but the core of the analysis.
What the power law model actually is
The power law framework treats Bitcoin’s price growth as a function that decays over time. Early in the asset’s life, prices could multiply a hundredfold in a cycle; as the network matures and the base grows, each cycle’s percentage gains shrink, and the whole price history, plotted on log-log axes, settles into a corridor that rises steadily but ever more slowly. Timmer’s version of the chart draws three curves through that corridor. The upper line marks the euphoria boundary, where prior cycles topped. The middle trendline marks something like fair value under the model. The lower line marks the floor where sellers have historically exhausted themselves.
The track record of that lower line is the reason the chart circulates every time the market bleeds. In the 2014 to 2015 bear market, the model’s support calculation stood near 252 dollars and the actual bottom printed at roughly 230. In 2018, the support line sat near 2,521 dollars against a low of 3,204. In the 2022 winter, the line read about 15,006 dollars and the market bottomed at 16,366. Three cycles, three bottoms, all landing within shouting distance of a curve drawn from math, not sentiment. In the current fit, that curve passes near 58,000 dollars, with some of Timmer’s postings citing figures around 58,237, and Bitcoin at 62,700 is trading roughly 8 percent above it.
Two companion indicators complete the picture, and both are flashing the same reading. The first tracks how far the price trades above or below the middle trendline. That deviation has swung to negative 56 percent, a depth the chart explicitly labels the accumulation zone and one that aligned with the 2018 and 2022 lows. The second is the 52-week z-score of the Bitcoin-to-gold ratio, which has collapsed to around negative 100 percent, meaning Bitcoin has underperformed gold over the trailing year to a degree seen only at prior points of maximal exhaustion. Historically, readings between negative 100 and negative 120 on that gauge, recorded in late 2014, 2018, and 2022, marked the moments when relative weakness against gold had run its course.
One underappreciated property of the setup: the price does not need to fall for the test to happen. The support curve rises over time, so a market that simply goes sideways will meet the floor from above. Stagnation and decline arrive at the same destination, which is partly why Timmer frames the coming months as a period of drift along support, not a decision point with a date.
The case for the accumulation zone
The bull argument starts with base rates. A signal that has fired three times in eleven years and preceded a major recovery all three times deserves weight, especially when two independent gauges, trendline deviation and the gold ratio, corroborate each other. Markets rarely hand out cleaner historical analogies than negative 56 percent deviation, a level with exactly two precedents, both of them cycle lows.
The structural context has also improved in ways the 2018 and 2022 comparisons undersell. In those winters, Bitcoin had no spot ETF complex, no corporate treasury cohort, and no legislative framework in motion. Today the ETFs exist and, after a June that ranked as their worst month on record, just snapped a ten-day outflow streak with a 221.7 million dollar single-day inflow, their largest daily haul in two months. The corporate treasury era is wobbling but not gone: Strategy has begun selling coins for the first time, a shift in the never-sell orthodoxy that crypto.news examined in depth, yet Grayscale mounted a public defense of that very sale as rational balance sheet management, a case crypto.news also covered. And beneath the visible institutional churn, the largest private holders have leaned in: whale wallets absorbed some 16.7 billion dollars in Bitcoin during the spring drawdown even as Wall Street vehicles bled, an accumulation wave crypto.news documented while it was happening. Deep-pocketed buyers behaving exactly as the accumulation zone label predicts is not proof of a bottom, but it is the pattern the model expects to see near one.
There is also the catalyst calendar, which is not empty. The CLARITY Act’s merged draft is due imminently, with Senate floor action targeted before the August recess, and the May committee vote already showed the reflex: Bitcoin jumped to 81,449 dollars within an hour of that 15 to 9 result. Citi and Standard Chartered carry six-figure targets, 143,000 and 150,000 dollars respectively, contingent on passage. A political catalyst is not the liquidity catalyst Timmer wants, but it is a scheduled, binary event with proven price sensitivity, sitting three weeks away, a countdown crypto.news has tracked through every procedural stumble.
Finally, the model’s own asymmetry favors patience over precision. Timmer’s floor is a zone, not a tripwire, and the historical bottoms landed both slightly above and slightly below the calculated line. For an allocator with a multi-year horizon, the question the chart answers is not whether 58,000 holds to the dollar. It is whether prices 8 percent above a three-times-validated floor represent better risk-reward than prices 90 percent above it did a year ago. Framed that way, the zone does most of the work regardless of where the exact low prints.
The other side of the corridor: what the model said at the top
The power law’s credibility does not rest on bottoms alone. The framework has a symmetrical claim about tops, and its record there is what separates it from the usual gallery of bull market curve-fitting.
When Bitcoin approaches the upper boundary of the corridor, the model labels the region a distribution zone, the mirror image of the current setup. Prior cycle peaks at 1,137 dollars, 19,042 dollars, and 64,337 dollars each printed as large positive deviations above the trendline, the same gauge that now reads negative 56 percent. Last year’s run past 120,000 dollars registered as another such excursion, and the model’s framing at the time, a speculative premium stretched far above structural value, was exactly the language skeptics dismissed as premature. In hindsight, the reading was the warning. Capital that bought the upper deviation is the capital now absent, and the round trip from positive extreme to negative extreme in roughly a year is, in the model’s terms, a complete emotional cycle compressed into twelve months.
That symmetry matters for how much trust the current signal deserves. A model that only ever says buy is marketing. A model that flagged distribution near the highs and now flags accumulation near a historically validated floor has at least earned the right to be argued with seriously. Fidelity’s own 2026 Periodic Table of Investment Returns makes the discomfort concrete: alternative assets including Bitcoin, gold, and long-duration Treasuries sit at the bottom of the annual performance ranking, beneath emerging markets, small caps, and Japanese equities. The model is asking investors to accumulate the asset class the scoreboard says has been the year’s worst idea. That is what the entries at 230, 3,204, and 16,366 dollars felt like too, which is either the entire point or the oldest trap in markets, depending on which side of the argument one occupies.
There is one further nuance in how Timmer talks about the line that deserves precision. He has described the mid-60,000s and the level around 60,000 as a line in the sand for the model, language that refers to where recalibration pressure begins, not where the thesis dies. The structural version of the power law, by his framing, would only be falsified by Bitcoin trading below roughly 17,000 dollars for more than a year, an outcome no serious participant currently prices. Between the tactical line at 58,000 and the structural line at 17,000 stretches an enormous gray zone in which the model can be wrong about timing, wrong about the exact floor, and still right about the destination. Critics call that unfalsifiability. Adherents call it the difference between a trading signal and a valuation framework. Both descriptions are accurate, which is why position sizing, not conviction, is where the argument actually gets settled.
The case for the missing catalyst
The bear argument does not dispute the chart. It disputes the physics behind it, and Timmer himself supplies most of the ammunition.
His stated reason for withholding a bottom call is that the drivers of every prior recovery are absent. Global money supply growth is decelerating, not accelerating. The speculative premium, the gap between price and the model’s structural floor that expands when fast money floods in, has been almost entirely erased, and the capital that produced it has left the building in a traceable sequence: out of Bitcoin, into gold, and now out of gold into semiconductor and AI equities. In Timmer’s framing, Bitcoin does not bounce because it reaches a line. It bounces when liquidity returns, and until it does, the base case is months of sideways drift along the floor instead of a V-shaped snapback. The accumulation zones of 2015 and 2018 were not quick either; both involved long stretches of dead money before the turn.
The demand infrastructure that was supposed to make this cycle different is, at the moment, cutting the other way. The ETF complex that absorbed supply on the way up distributed it on the way down, posting its worst month ever in June and its largest quarterly outflow since launch, a reminder that regulated wrappers transmit institutional risk appetite in both directions. The treasury company cohort has moved from pure accumulation to selective distribution, with Strategy selling coins and smaller vehicles like Empery Digital liquidating roughly half a Bitcoin stack to fund a pivot toward AI data centers. Each of these flows is individually explainable; together they describe a marginal buyer that has, for now, become a marginal seller.
The macro overlay is genuinely hostile. The United States has struck Iran three times in a single week, the Strait of Hormuz has reportedly closed again, oil holds above 100 dollars, and the Federal Reserve faces inflation pressure that keeps rate cuts off the table. Risk assets broadly are contending with the same liquidity drought, which is precisely why capital rotated to semiconductors, the one sector with an earnings story strong enough to ignore it. Bitcoin’s correlation regime matters here: in liquidity droughts it trades like a high-beta risk asset, not like gold, and the negative 100 percent reading on the gold ratio is the scar tissue of that regime. The same reading bulls cite as exhaustion, bears read as reclassification: the market spent a year deciding that in this environment, gold is the hedge and Bitcoin is the trade.
And the model itself deserves a dose of humility. Power law fits are parameterization-sensitive: Fidelity’s curve puts support near 58,000, while other published fits place the floor closer to 51,000, and at least one derivation cited in coverage runs as low as 56,488. A zone that moves by 10 percent depending on who draws it is a framework, not a law of nature. The model’s own authors concede the structural version only breaks if Bitcoin spends more than a year below roughly 17,000 dollars, which means the framework can absorb a decline of 70 percent from here without being falsified. A thesis that cannot be quickly proven wrong is comfortable to hold and dangerous to size.
Anatomy of the exodus: where the fast money actually went
The rotation Timmer describes is traceable in the flow data, and following it explains both why the drawdown was so orderly and why the recovery lacks an obvious buyer.
The first leg ran from Bitcoin to gold. As the speculative premium deflated through the winter, gold absorbed the store-of-value bid, and the Bitcoin-to-gold ratio began the slide that would eventually reach its negative 100 percent extreme. The second leg ran from gold into semiconductors, as the AI capital expenditure cycle gave momentum capital an earnings-backed home that neither metal nor token could match. Institutional surveys confirm the sequence: digital assets posted three consecutive quarterly losses, the longest streak since 2022, precisely as capital rotated into AI equities, and even crypto-native corporate stories, like the treasury company that sold half its Bitcoin stack to fund data centers, bent toward the same gravity.
What remained in the crypto market redistributed internally instead of leaving entirely. Bitcoin dominance held up because altcoins fell harder, with everything outside the top two losing roughly 23 percent in six months. Stablecoin capitalization, the market’s cash position, shrank by 10 billion dollars over two months, the largest contraction since the Terra collapse, though analysts read it as cyclical de-risking, not structural exit. And the transactional economy kept consolidating into the venues with real usage, from tokenization networks to the stablecoin rails where volume actually lives, a migration visible in the flippening of trading volume toward regulated dollar tokens that crypto.news charted this month.
The composite picture is a market that de-levered without panicking: no cascade, no exchange failure, no credit event, just a year-long transfer of coins from momentum hands to patient ones at steadily lower prices. That is, almost to the letter, the textbook description of an accumulation phase. It is also, and this is the uncomfortable part, indistinguishable in real time from the early innings of a longer decline. The difference between the two is supplied later, by liquidity, which returns the analysis to Timmer’s missing ingredient.
How the two cases actually reconcile
Strip the rhetoric and the disagreement is narrower than it looks. Both sides accept the same facts: the price is near a historically validated floor, the on-chain and whale evidence shows accumulation, the liquidity backdrop shows no fuel for a rally, and the one scheduled catalyst is political rather than monetary. The dispute is about sequencing and about what an investor should do during the gap.
History offers a specific answer about the gap. In each prior visit to the accumulation zone, the market spent between several months and more than a year grinding along the floor before the recovery began, and the recovery started when an external liquidity impulse arrived: the 2015 turn preceded the 2016 halving cycle and easing conditions, the 2019 recovery tracked the Fed’s pivot, and the 2023 exit from the zone rode the turn in global money supply and the ETF approval trade. The floor identified where the low formed. Liquidity decided when. There is no example of the zone producing a durable rally without the second ingredient, which is why Timmer’s refusal to call a bottom is not hedging. It is the model applied correctly.
That reconciliation also clarifies what the CLARITY Act can and cannot do. Legislative passage would be a demand catalyst, activating allocator categories that cannot currently hold the asset, and the market’s hair-trigger response to the committee vote suggests real convexity around the outcome. But a statute does not print money. If the bill passes into a liquidity drought, the plausible result is a strong repricing that then stalls at the trendline instead of reaching a new cycle high, the difference between closing the discount and starting a bull market. If it fails, the floor gets its stress test with no cushion, and the parameterization debate, 58,000 versus 51,000, stops being academic. Elsewhere in the market, the same liquidity question is being answered asset by asset: capital that stayed in crypto has crowded into the few networks with visible usage growth, a concentration visible across the tokenization trade, leaving Bitcoin to trade almost purely on macro.
What to watch while the market drifts
Before the gauges, a word on method, because the practical difference between the two camps is not belief but execution. The accumulation zone framework, taken seriously, argues for scaling over timing: building exposure in defined tranches as price approaches the floor, sized so that a breach of 58,000 is survivable and a visit toward the alternative fits near 51,000 is a continuation of the plan, not its failure. It argues for instruments matched to a months-long horizon, since the model’s own history says the zone can persist for two to four quarters before resolving, and leveraged expressions of a patient thesis are how correct analysis produces liquidated accounts. And it argues for treating a confirmed weekly close below the floor as a thesis review trigger, a scheduled reassessment, not a panic exit, because the difference between the tactical line and the structural one is 40,000 dollars wide. The missing-catalyst framework, taken equally seriously, adds only one amendment: let the macro data, not the price, decide when the accumulation window is closing. Buying the zone is a bet that liquidity returns eventually. Watching the liquidity gauges is how eventually gets a date. Neither camp needs to convert the other for both to be useful; one supplies the map of where value lives, the other supplies the clock that says when the market will agree.
Four gauges will signal the regime change before the price does. Global money supply growth is the master variable; Timmer’s entire framework waits on its second derivative turning positive, and any coordinated easing impulse, from the Fed or elsewhere, is the starting gun the model requires. ETF weekly flows are the institutional thermometer; one 221 million dollar day means nothing, but a month of sustained net inflows through a flat tape would mark the return of the allocator bid. The Bitcoin-to-gold ratio recovering from its negative 100 percent extreme would show relative capitulation has ended even before absolute prices move. And a confirmed weekly close below the 58,000 zone would be the model’s recalibration trigger, the signal to treat the floor as broken instead of tested, with the next published fits clustering around 51,000.
The honest conclusion is that the chart and the strategist are both right, and they are answering different questions. The power law says where: Bitcoin is entering the zone where every prior cycle’s sellers ran out, with corroborating exhaustion readings that have exactly two precedents, both of them bottoms. The catalyst analysis says when: not until liquidity returns, and possibly not for months. Accumulation zones are named for what disciplined capital does inside them, quietly and without confirmation. The word was never a promise that the bell rings at the low. It is a description of who is buying while everyone else waits for one.
Disclosure: This article does not represent investment advice. The content and materials featured on this page are for educational purposes only.

Crypto World
Bitcoin Price Prediction: Saylor Teases Another Orange Dot After Strategy Trimmed Bitcoin Holdings

Bitcoin price prediction is back in focus as it is back trading above $64,000 after another quiet week. Price barely moved over the past day, but the mood certainly did. Strategy’s mNAV has dropped to one of its weakest historical readings, while Michael Saylor’s latest orange dot post has traders expecting another Bitcoin buy.
Crypto analyst Michaël van de Poppe said Strategy’s Market Net Asset Value has fallen to levels last seen during the 2022 bear market. The ratio compares the company’s enterprise value with the market value of its Bitcoin holdings. Even so, he believes Strategy is in a much stronger position because Saylor has continued adding Bitcoin instead of backing away.
That is why van de Poppe sees the recent wave of criticism as a possible contrarian signal. Saylor’s orange dot only poured more fuel on the speculation, with traders now waiting to see if another purchase announcement follows.
For now, Bitcoin remains trapped inside a familiar range after last week’s liquidation flush. Traders are watching spot Bitcoin ETF flows and upcoming macroeconomic data for the next move. If neither side takes control soon, the market could keep chopping sideways a little longer.
Discover: The Best Crypto to Diversify Your Portfolio
Bitcoin Price Prediction: Reclaim $70K or Does the Triangle Breakdown Stick?
Bitcoin price is hovering around $64,100 after several days of choppy trading, as its price prediction remains tricky because neither buyers nor sellers have taken control. The market keeps circling the same zone, like a taxi looking for a parking spot, while daily moves stay modest.
Meanwhile, the bearish setup still deserves attention. Bitcoin recently broke a multi-month symmetrical triangle below, keeping downside pressure alive. Volatility has cooled after heavy liquidations, which often set the stage for a sharper move once fresh news hits.

Support around $60,000 remains the level to watch. Bitcoin briefly dipped below it before bouncing, showing buyers still have some fight left. However, a weekly close under that mark would strengthen the bearish outlook. On the upside, bulls need to reclaim the broken trendline before aiming for the $80,000 area.
For now, the most likely outcome is continued movement between $62,000 and $66,000. A major economic release or another wave of institutional buying could finally break the stalemate. Current correction models still resemble a normal pullback instead of the deep panic that usually marks a cycle bottom.
Don’t Miss Out on Our $1,000 USDT Airdrop on ByBit
Bitcoin Hyper Targets Early-Mover Positioning as BTC Tests Key Structure
Holding Bitcoin at $64K while waiting for a triangle resolution is a valid strategy, but at this market cap, the asymmetric upside that early cycle participants captured is largely priced in. Traders looking for a different risk-reward profile within the Bitcoin ecosystem are increasingly looking at infrastructure plays that haven’t yet gone parabolic.
Bitcoin Hyper ($HYPER) is currently in presale at $0.013683, having raised $33 million to date. The project’s core proposition is structural: it’s positioned as the first Bitcoin Layer 2 integrating the Solana Virtual Machine, delivering sub-second finality and low-cost smart contract execution while remaining anchored to Bitcoin’s security model.
A Decentralized Canonical Bridge handles BTC transfers natively. The staking program is live with high APY, which gives presale participants yield exposure while price discovery plays out. That’s a meaningful differentiator from simply waiting on spot BTC.
Research Bitcoin Hyper before allocating.
Discover: The Best Token Presales
The post Bitcoin Price Prediction: Saylor Teases Another Orange Dot After Strategy Trimmed Bitcoin Holdings appeared first on Cryptonews.
Bitcoin has entered a high-risk week as fresh inflation data and renewed Federal Reserve rate concerns have intensified pressure on crypto markets.
Summary
- Bitcoin faces renewed pressure ahead of the U.S. CPI and PPI inflation reports.
- Fed Governor Christopher Waller’s hawkish comments have lifted September rate hike expectations.
- Investors are also tracking CLARITY Act developments as another key crypto market catalyst.
According to Reuters, Federal Reserve Governor Christopher Waller warned that the U.S. central bank could consider raising interest rates if inflation continues to remain above its 2% target, placing investors on alert before this week’s key economic releases.
His comments come as traders prepare for the June Consumer Price Index (CPI) report due on July 14, followed by the Producer Price Index (PPI) data on July 15.
Bitcoin has already reacted to rising macro uncertainty. The cryptocurrency slipped below $62,000 after climbing to around $64,500 earlier, with escalating tensions between the United States and Iran adding another layer of risk to global financial markets.
Higher geopolitical uncertainty has combined with growing expectations of tighter monetary policy to weaken demand for risk assets.
Inflation data could shape Fed expectations
Wall Street economists expect the June CPI report to show monthly inflation easing to 0.2% from 0.5% in May. Annual inflation is projected to slow to 3.8% from 4.2%, offering investors another measure of whether price pressures are cooling.
The inflation figures are likely to influence expectations for future Federal Reserve policy. If consumer prices rise faster than forecast, markets could strengthen their bets that policymakers may keep interest rates higher for longer or even consider another increase.
Attention will then turn to the June PPI report, which measures inflation at the wholesale level. Together, the two reports are expected to provide a clearer picture of inflation trends across the U.S. economy and could influence trading across equities, bonds and digital assets.
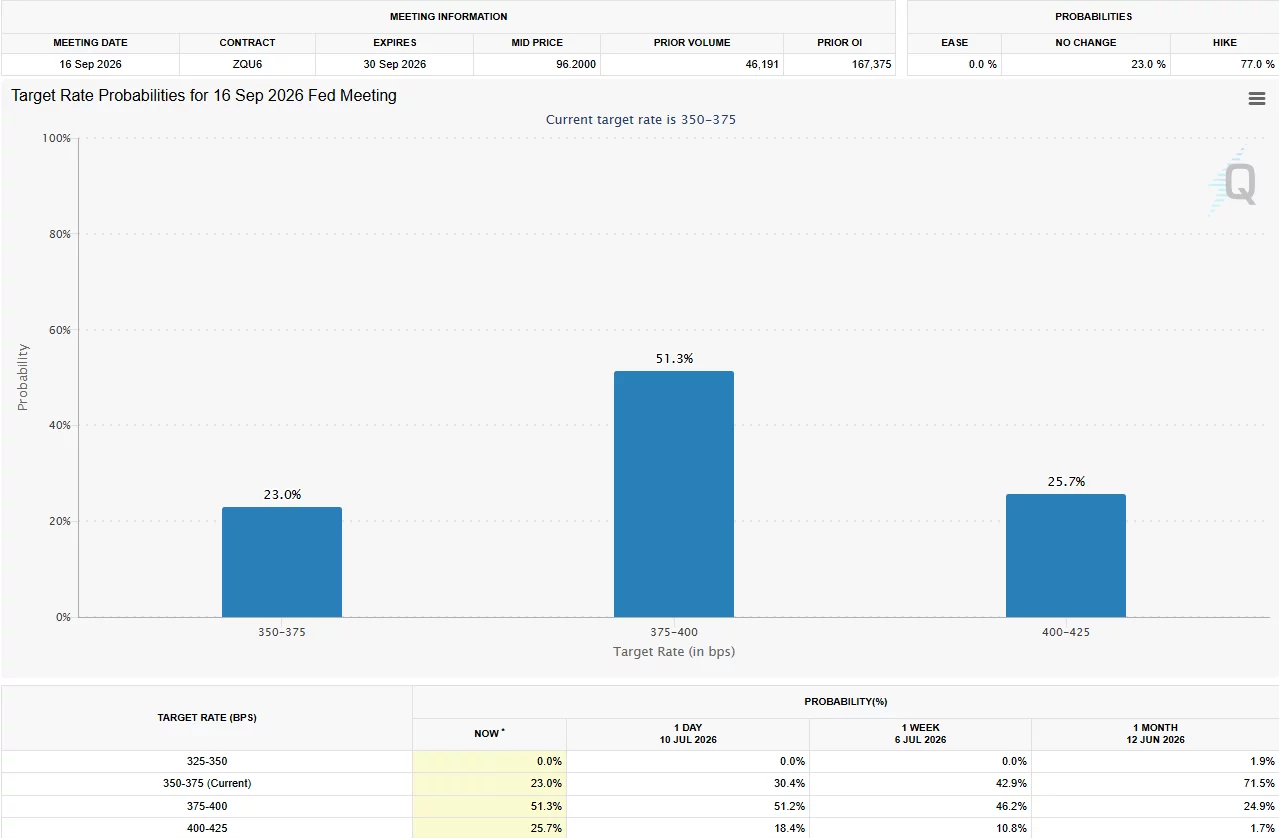
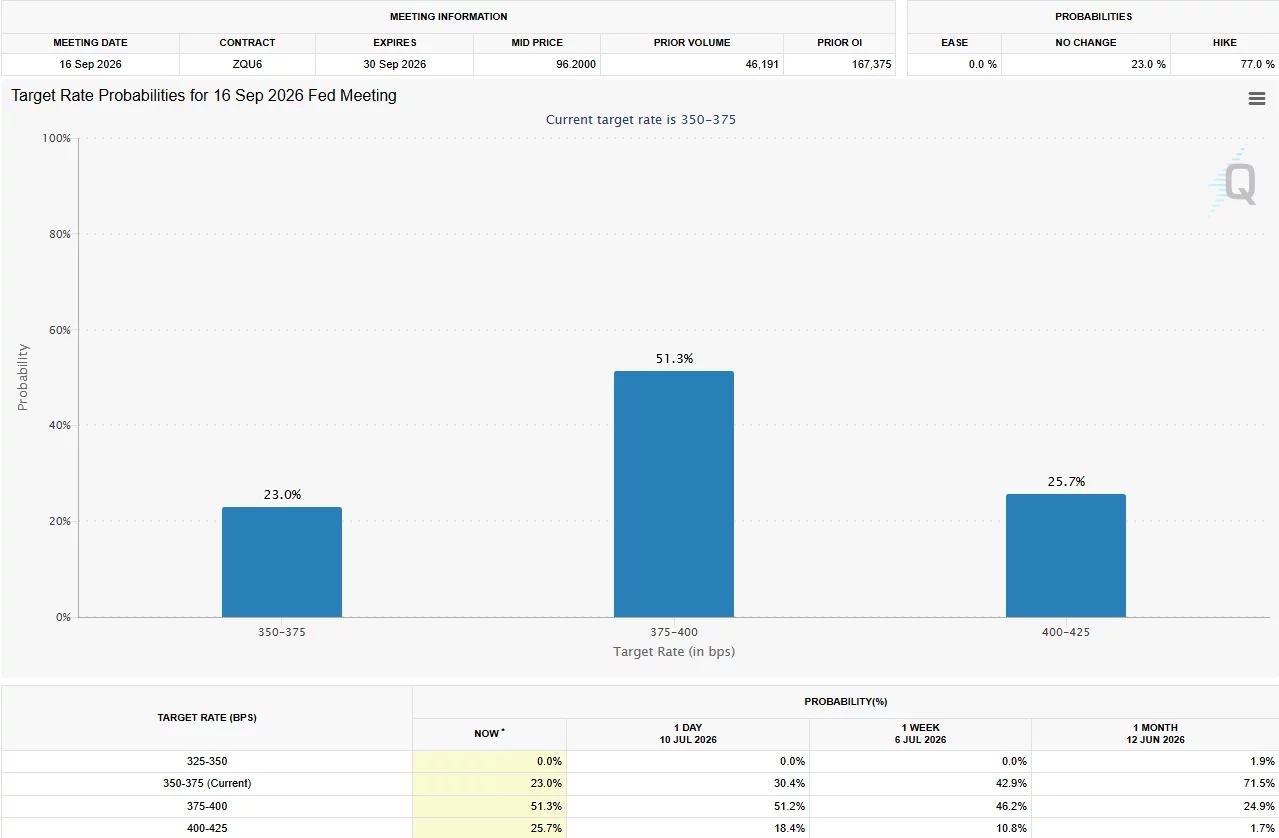
Following Waller’s remarks, the CME FedWatch Tool showed that the probability of a September Federal Reserve rate hike climbed to 51.3%. Higher borrowing costs typically reduce appetite for speculative investments, making cryptocurrencies particularly sensitive to changes in monetary policy expectations.
Recent Federal Reserve communications have already pointed to persistent inflation risks. Minutes from the central bank’s latest policy meeting noted that several officials remain concerned about inflationary pressures, including those linked to rising artificial intelligence investment and stronger-than-expected economic activity, keeping markets cautious ahead of this week’s data releases.
Crypto legislation adds another market catalyst
While inflation remains the primary focus, investors are also monitoring developments in Washington as lawmakers prepare for another important week for the CLARITY Act, one of the most closely watched crypto market structure bills.
U.S. President Donald Trump recently urged the Senate to pass the legislation in honor of Senator Lindsey Graham, who died on July 11. The bill is expected to receive renewed attention this week as lawmakers continue discussions over its final form.
The legislation seeks to establish a clearer regulatory framework for digital assets in the United States. Market participants have been watching the proposal closely because it could determine how cryptocurrencies are regulated by federal agencies and influence future institutional participation in the sector.
With inflation reports, Federal Reserve policy expectations, geopolitical tensions, and crypto legislation all converging within days, investors are preparing for another volatile trading week.
Softer-than-expected inflation could ease pressure on risk assets, while stronger readings may reinforce expectations for tighter monetary policy and keep cryptocurrencies under pressure.

[PRESS RELEASE – Dover, Delaware, USA, July 13th, 2026]
Legend Awakes has released its official cinematic reveal video, concluding the mystery-driven teaser campaign that has unfolded across X in recent weeks.
The campaign used cinematic visuals, cryptic messages, and hidden clues to introduce the world behind Legend Awakes, generating more than 300 million views across campaign content and prompting thousands of comments, reposts, and community discussions.
The reveal video brings the campaign’s clues, symbols, and hidden messages together for the first time, while introducing Alberich Token – a project inspired by Alberich, the legendary figure from Richard Wagner’s The Ring of the Nibelung, and presented as the world’s first “Musical Meme Coin.”
Without giving away the experience, the cinematic reveal introduces a narrative-driven Web3 project that blends mythology, legendary music, artificial intelligence, blockchain technology, and community into a single evolving story.
Rather than presenting a conventional token launch, Legend Awakes introduces a story-first approach that invites audiences to discover the project through its unfolding narrative before exploring the technology behind it.
The cinematic reveal marks the beginning of the next chapter. Visitors can continue the journey at LegendAwakes.com, where each step reveals another piece of the story and the expanding world surrounding Alberich Token
Watch the Official Cinematic Reveal
The full cinematic reveal is now live on the official Legend Awakes account on X.
Continue the journey:
The mystery has led to this moment. Now the legend awakens.
About Legend Awakes
Legend Awakes is the story-driven project behind Alberich Token (ALBRH), the world’s first Musical Meme Coin. Inspired by Richard Wagner’s The Ring of the Nibelung – the original Ring saga based on the legendary Nibelungenlied. The project reimagines one of history’s most enduring and influential epic legends for the Web3 era through music, artificial intelligence, blockchain technology, and immersive storytelling. Developed under the Nibelungen Foundation, Alberich Token unites mythology, culture, and innovation, creating a distinctive digital asset ecosystem for a global audience.
The post Legend Awakes Reveals the Story Behind Its Mystery-Driven Campaign appeared first on CryptoPotato.

A long-dormant Bitcoin wallet that last moved funds when BTC traded around the mid-$6,000s has re-entered the market, transferring a large amount of coins that may be nearing an eventual sale. Arkham blockchain data shows the wallet “356my” moved 2,931 BTC—worth roughly $188 million at current prices—into a new wallet address on Sunday.
The transaction stands out because it represents the whale’s first on-chain activity in seven years, and analysts link such moves to potential liquidation flows. The transfer also arrives as exchange-related inflows are being increasingly dominated by large holders rather than smaller investors.
Key takeaways
- A wallet last active near $6,500 BTC has transferred 2,931 BTC (about $188 million) for the first time in seven years, according to Arkham.
- Blockchain analytics from Onchain Lens suggests the holdings could be up nearly 10-fold, based on the wallet’s likely cost basis over the holding period.
- CryptoQuant data indicates exchange whale activity remains heavily concentrated, with whale-led deposits accounting for about 99% of BTC exchange inflows year-to-date.
- Large whale transfers into exchanges are often interpreted as sell-side preparation, potentially adding pressure to BTC while spot ETF flows remain mixed.
- Farside Investors data shows spot Bitcoin ETFs recorded net inflows leading into Friday, but June delivered $4.51 billion in net outflows—the worst month on record.
Seven-year-old Bitcoin wallet moves $188 million
Arkham’s explorer data attributes the move to a single whale wallet labeled “356my,” which sent 2,931 BTC to wallet address “bc1qn” on Sunday. The size is significant: at Bitcoin’s current trading level of around $64,000 per coin, the transfer values near $188 million.
What makes the transfer especially noteworthy is the wallet’s dormancy. The earlier activity dates back roughly seven years, when Bitcoin’s market price was around $6,500. While a dormant balance doesn’t guarantee future selling, the timing and magnitude have prompted fresh scrutiny from on-chain analysts.
Onchain Lens has framed the move as a near 10-fold gain scenario—an outcome consistent with buying or accumulating during the years when BTC traded far below today’s level. The implication for traders is straightforward: when long-held coins begin moving, it can signal a shift from accumulation to distribution, particularly if funds are routed toward exchange infrastructure.
Why exchange-linked whale inflows matter
Recent market flows suggest that whales are driving a disproportionate share of BTC entering exchange ecosystems. CryptoQuant’s exchange whale ratio chart—tracking the share of deposits tied to large transfers—stands at 0.99 at press time for the year-to-date window.
CryptoQuant interprets this high concentration as “historically a bearish signal.” The underlying logic is that whale deposits are more likely to be associated with substantial sell orders rather than routine retail behavior. In practice, when large holders move coins to exchanges, it often represents preparation for liquidity events—sometimes immediate, sometimes gradual.
Coinglass defines “whale transfers” as movements of at least $10 million, which helps contextualize why these transactions can carry more weight than smaller wallet activity. If the current pattern persists, BTC could face intermittent sell pressure even if broader demand remains steady.
ETF flows add another layer of selling pressure risk
The whale transfer also lands amid ongoing questions about spot Bitcoin ETF positioning. Farside Investors data shows US-traded spot Bitcoin ETFs registered $197 million in net weekly inflows leading up to Friday. However, the broader trend has not been supportive: Farside also reports that ETFs recorded $4.51 billion in net outflows in June, marking the worst month on record.
That mix—weekly inflows alongside a severely negative monthly performance—can translate into a more fragile price backdrop. Even when ETFs provide short bursts of buying, persistent outflows can reduce the market’s ability to absorb large sell-side catalysts.
As a result, the combination of (1) whale-led exchange inflows and (2) the lingering ETF outflow overhang may be one reason analysts keep pointing to “additional pressure” risk when large on-chain balances start to move.
What to watch next after the transfer
While the wallet-to-wallet transfer itself does not confirm a sale, the market’s next clues will likely come from whether the coins move again—especially if they transition from private wallets to major exchange addresses. Traders and investors will also want to monitor whether whale transfers continue at similar frequency and magnitude, and whether ETF flow momentum improves after June’s outflows.
For now, the key uncertainty is timing: long-dormant coins can sit for weeks or months after the first move, but repeated movements toward exchange liquidity typically strengthen the case for distribution. Readers should watch the on-chain follow-through alongside ETF flow data to gauge whether this whale activity turns into sustained selling pressure or fades into a one-off reshuffling.


Latest developments: CEO Stephen Gregory said Binance.US is focused on growth after what he described as a two-year “hibernation” tied to regulatory issues surrounding the broader Binance brand.
- Gregory said Binance.US is a separate U.S.-only entity with its own governance structure, though it shares a common beneficial owner and brand name with Binance.com.
- He said the exchange previously held roughly 20% of the U.S. crypto exchange market and is targeting a return to that level.
- Gregory said Binance.US is now licensed exclusively to serve U.S. customers.
What this means: Binance.US is trying to compete with exchanges such as Coinbase and Kraken by emphasizing lower trading costs and a broader product lineup.
- Gregory said the exchange has reduced fees to “essentially almost a no-fee exchange,” with 0% maker fees and 2-basis-point taker fees.
- He said the company has kept costs low by operating with a lean team and expects to generate revenue from services like custody alongside trading.
- Gregory said the exchange is rebuilding liquidity through incentives and direct outreach to retail customers, including personally contacting some of its top users for feedback.

A Duke University finance professor, Campbell Harvey, has said that a 51% attack on Bitcoin, long dismissed as a theoretical exercise that would only destroy value for whoever tried it, has quietly become something an attacker could profit from because of today’s derivatives markets.
However, many BTC supporters dismissed the claim made during the July 12 episode of Scott Melker’s Wolf of All Streets podcast, arguing that it ignores the practical economic barriers that would likely stop such an attack.
Derivatives Have Changed Bitcoin’s Risk Profile
According to Harvey, a 51% attack, where a single entity gains the majority control of the Bitcoin network’s hash power, has always been technically possible but made little economic sense. This is because an attacker would need to spend billions of dollars on mining hardware but would only end up destroying the value of the asset they had just compromised.
“Why would you spend billions investing in mining equipment, take over the network, but the price of Bitcoin collapses to zero?” Harvey posited. “So you spend all that money and get nothing?”
But now, he believes that equation has changed, given that derivative markets carry enough liquidity for an attacker to short BTC before launching an attack and profit as the price falls.
“The difference today is the derivatives markets,” he told Melker. “What you want to do is simultaneously during the attack take a short position on Bitcoin, and with a short the ideal outcome is if the asset goes to zero.”
The professor did point out that the trade would have to take place on offshore derivatives platforms since it amounted to blatant market manipulation. In his research paper titled “Gold and Bitcoin,” he estimated that such an operation would cost about $8 billion, which is roughly 50 basis points of BTC’s total market value, although he framed the scenario as a risk management exercise and not a prediction, arguing that investors should consider every credible threat instead of dismissing uncomfortable possibilities.
When asked the same question, Grok estimated that anyone looking to carry out such an attack would need to spend more than $10 billion on mining machines and about $1.3 million in electricity costs every hour. It also noted that any attempt would most likely be detected immediately.
Interestingly, Harvey does not think the same scenario can work on Ethereum. According to him, since Ethereum switched to proof-of-stake, an attacker has to acquire more than half of the liquid ETH supply to control one-third of all staked Ether, which would rapidly drive prices higher during the attempt and eliminate the short-selling opportunity he described for Bitcoin.
The educator’s criticism of Bitcoin went beyond its network security, as he argued that the OG cryptocurrency is too volatile to qualify as a safe haven asset or reliable store of value. He said that price swings have stayed high even after years of market growth and deeper liquidity. At the time of writing, BTC was trading near $62,000 after slipping to near $61,000 last week following the renewal of hostilities between the US and Iran.
Bitcoin Community Pushes Back
The response on X to Harvey’s interview was mostly dismissive, with market watcher David Levenson calling the professor’s take “a fundamental misunderstanding of how derivatives work.” Another listener, PrivateCoSaylor, argued that Bitcoin’s social consensus could reject blocks produced by an attacker, making the strategy economically self-defeating.
However, there were those who aired different concerns, including pseudonymous trader Toni, who noted that while the whole argument rested on profit being the motive, the same wouldn’t hold if a nation-state or short seller simply wanted Bitcoin to fail regardless of any losses they incurred.
The post Expert: Bitcoin Faces $8B Attack Risk, Ethereum More Secure appeared first on CryptoPotato.

Ripple secured full MiCA CASP authorization from Luxembourg’s CSSF last week, and the more consequential story isn’t what it achieved, but what every other crypto firm operating in Europe now has to replicate or exit.
Luxembourg’s VASP transitional period under MiCAR expired on July 1, 2026. That deadline was not a soft target, so firms that entered it without a completed CASP authorization must now stop serving EEA customers. Post-deadline, VASPs may only continue operating until they receive a final decision on their authorization, meaning the transitional buffer is gone and there is no further grace period to invoke.
The practical result is a hard bifurcation of the European crypto market. Ripple joined approximately 210 firms reported to have reached MiCA-compliant status ahead of the July 1 cutoff. The rest, exchanges, custodians, and payment processors, face an immediate choice between accelerating their authorization process and withdrawing from the region.

Don’t Miss Out on Our $1,000 USDT Airdrop on ByBit
Ripple Dual-License Architecture Every Serious Operator Needs
Ripple’s crypto compliance structure is more layered than a single authorization event. The company holds both an EMI license and the new CASP approval. That combination is not redundant; it maps directly to the two distinct regulatory tracks MiCAR creates for firms that want to offer complete crypto payment services in the EEA.
The EMI license governs fiat and e-money activity, covering the fiat on-ramp and off-ramp infrastructure that underpins any cross-border payments product. The CASP authorization covers the crypto-asset side: custody, transfers, exchange functions, and related services.
A firm offering only one without the other operates with a structural gap in its regulated product scope. Ripple’s press release described the combination as enabling “end-to-end regulated crypto payments” available to financial institutions, corporates, and businesses across all 30 EEA countries.
Cassie Craddock, Managing Director for UK and Europe at Ripple, framed the strategic logic:
“This CASP authorisation means Ripple enters the post-transitional MiCA era fully compliant and ready to scale. The institutions we work with across Europe are looking to build their digital assets services alongside regulated partners, and Ripple is licensed and ready to meet that demand.”
The Bar Is High, and the Field Is Thin

The competitive implications of the July 1 deadline are already visible. Ripple’s press release noted it is “one of a small number of digital asset firms to have full authorization under MiCA,” a description that is accurate given the reported figure of approximately 210 licensed firms out of a much larger pre-MiCA European crypto market.
Adding to a global portfolio of more than 75 regulatory licenses, Ripple brought substantial institutional compliance infrastructure to this process. That resource base is not available to most smaller operators.
The structural challenge for mid-tier exchanges and service providers is not simply the cost of licensing. It is the governance and operational depth that CSSF’s CASP regime requires: prudential capital requirements, organizational controls, senior management accountability, and ongoing supervisory obligations.
Firms that built their European presence on lighter-touch VASP registrations are now being asked to clear a substantially higher bar, and those that cannot meet it face the prospect of the kind of forced strategic contraction that reshapes competitive dynamics quickly.
— Coin Bureau (@coinbureau) July 1, 2026
 WATCH: TETHER CEO EXPLAINS WHY $184B USDT DID NOT APPLY FOR MICA
Paolo Ardoino said Tether did not apply for MiCA license because “it is very dangerous when it comes to stablecoins.”
He said the rules could force issuers to park 60% of reserves in “uninsured cash deposits” at… pic.twitter.com/hCbrNhFFhQ
The regulatory context reinforces why Europe crypto regulation is setting a global precedent. While MiCA tightens the EEA perimeter, parallel frameworks are developing elsewhere. This includes ongoing market debates about Ripple’s positioning in global payments infrastructure and, in the US, the CLARITY Act’s push toward a comparable digital asset classification framework.
Any crypto firm still operating in Europe without CASP authorization is either racing through an active application or managing a wind-down. There is no third option under MiCAR. The transitional period is closed, the CSSF has published its expectations, and the authorized-versus-unlicensed divide is now a permanent feature of the European crypto landscape.
Don’t Miss Out on Our $1,000 USDT Airdrop on ByBit
Discover: The Best Token Presales
The post Ripple CASP Approval Exposes the Compliance Gap Splitting Europe’s Crypto Market appeared first on Cryptonews.
Coinbase Ventures has completed 30 startup investments during the first half of 2026, maintaining the industry’s most active venture pace despite a sharp slowdown in overall crypto fundraising.
Summary
- Coinbase Ventures led crypto VC activity with 30 startup deals in H1 2026.
- DeFi, payments, and AI remained the top sectors attracting venture funding.
- Overall crypto fundraising stayed weak despite a modest recovery in June and July.
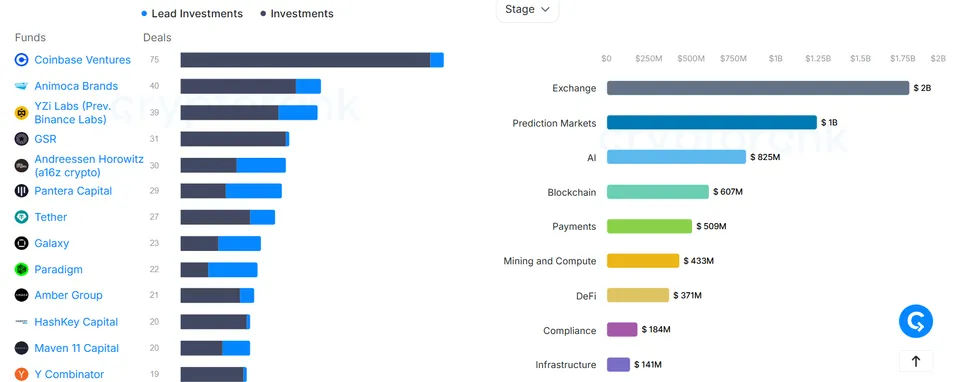
According to CryptoRank, the venture arm of Coinbase led all crypto-focused investors with 30 deals between January and June, ahead of Animoca Brands with 19 investments, venture capital firm a16z with 18, and stablecoin issuer Tether with 15. The latest rankings come as venture funding across the digital asset industry remains well below levels seen earlier this year.
Coinbase Ventures has stayed ahead despite weaker funding
CryptoRank’s data also shows Coinbase Ventures has widened its lead over a longer period. During the past 12 months, the firm completed 75 investments, compared with 40 for Animoca Brands, 39 for YZi Labs, formerly Binance Labs, 31 for GSR, and 30 for a16z.
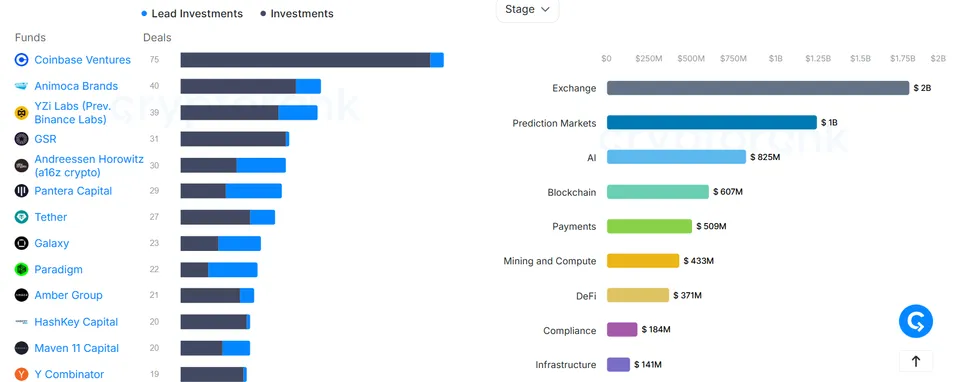
While investment activity from leading firms has remained steady, the amount of capital entering the sector has dropped sharply. CryptoRank reported that crypto companies raised $1.4 billion across 61 funding rounds in June, down from $3.8 billion in April. Fundraising rounds also declined from 89 in May to 61 in June.
Even so, June represented a modest improvement over April, when startups secured just $698 million through 71 fundraising rounds, the weakest monthly result in two years. Earlier reporting by crypto.news cited another dataset showing April funding at $659 million across 63 deals, a 74% decline from March that pushed monthly venture flows back to 2024 lows even as decentralized finance and AI projects continued attracting investors.
Early signs of recovery have appeared in July. According to CryptoRank, crypto companies have already raised $456 million through 12 funding rounds during the month.
DeFi, payments and AI continue attracting investors
Coinbase Ventures’ recent investments have centered on payment infrastructure, decentralized finance and blockchain infrastructure. CryptoRank said the firm participated in seven funding rounds involving payment protocols during the first six months of the year, alongside four DeFi investments and three rounds each focused on infrastructure and real-world asset tokenization.
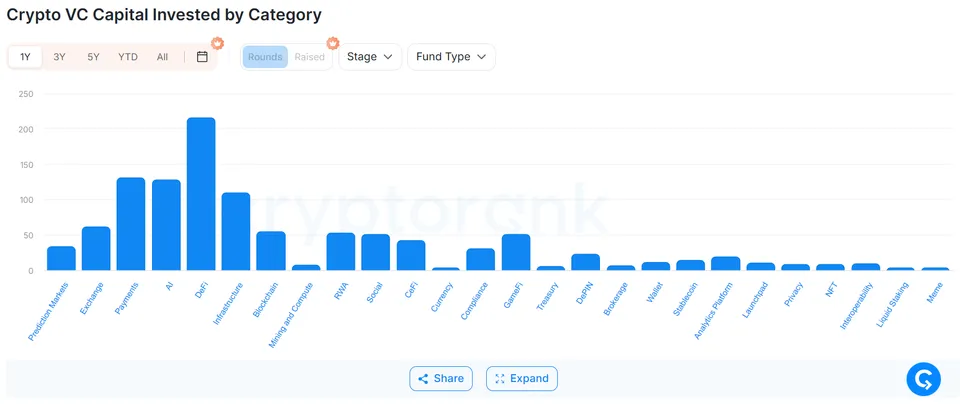
Across the broader venture market, DeFi remained the busiest category over the past year with 216 fundraising rounds, according to CryptoRank. Payment startups followed with 131 rounds, while crypto projects focused on artificial intelligence secured 128 funding rounds. Infrastructure companies completed 110 fundraising rounds, with every other sector recording fewer than 100 deals over the same period.
Investor participation has nevertheless narrowed. CryptoRank reported that the number of unique investors fell to 242 in June, compared with 452 recorded in October 2025, indicating fewer firms are actively backing new crypto startups despite continued investment from leading venture groups.
Regional data also highlights where venture money has been concentrated. According to CryptoRank, investors based in the United States deployed $5.8 billion during the past six months, while Australia-based investors contributed $3.6 billion. Another $11.6 billion of investment came from undisclosed locations, underscoring the continued role of unidentified capital sources in crypto venture funding.
Although the overall funding environment remains weaker than earlier this year, CryptoRank’s latest figures show that established venture firms, led by Coinbase Ventures, continue to back startups building payment systems, DeFi applications, AI products and blockchain infrastructure even as total capital flowing into the sector remains under pressure.
The cryptocurrency market has dipped once again over the past several hours, but Pi Network’s native token has taken this minor correction a lot worse, with a fresh dump to a new all-time low.
Moreover, nearly 130 million coins are scheduled to be unlocked in the following months, which could further worsen PI’s state.
Low After Low
It’s almost impossible to imagine now, but PI traded at $0.30 in March after its major listing on Kraken. The subsequent rejection, though, pushed it south to $0.20, where it managed to stand there for a while. Although that key support was breached briefly, the token challenged it in late April, only to be halted again.
The following few months have brought nothing but pain for the PI token holders. As the chart below will clearly demonstrate, the asset has been on a violent free-fall that has taken it to several consecutive all-time lows. The latest arrived earlier today when PI decisively lost the $0.10 support and even the $0.09 floor.
Another double-digit price dump pushed it south to $0.086, which became its new all-time low. PI is down by over 22% weekly, and a whopping 97.1% since its all-time high in February 2025.

What’s even more worrisome for investors is the fact that over 127 million coins are set to be unlocked in the next 30 days, according to data from PiScan. Such large token releases could increase the immediate selling pressure from investors who had been waiting for their coins for a long time. This is particularly true in bear markets when the distress is higher than usual.
Can New Updates and Products Help?
Although the recent price picture looks more than grim, the team behind the project has not stood still. They continue to outline new products, significant protocol updates, and celebrate the major milestones.
The latest was the Pi2Day (June 28), when the Core Team unveiled three major infrastructure products aimed at expanding the ecosystem beyond its existing user base. Namely, those were SoloHost, a framework for locally hosting AI apps and distributed computing; Pi Sign-in, which enables third-party websites and apps to authenticate users through Pi accounts; and PiVerify, a KYC and identity verification service for external businesses.
Despite the significance of some of those products, the timing remains a challenge. Such infrastructure improvements require months or even years to translate into measurable network activity and token demand. For now, the actual benefits are missing, and the protocol’s native token continues to dig new lows.
The post Pi Network’s PI Hits New ATL After 11% Crash as 130M Token Unlock Looms appeared first on CryptoPotato.


Aave has expanded its use of Chainlink’s Cross-Chain Interoperability Protocol (CCIP), making it the default infrastructure for cross-chain activity across its ecosystem.
Summary
- Aave has made Chainlink CCIP its default infrastructure for cross-chain operations.
- CCIP now powers deposits, withdrawals, Stable Vaults, GHO transfers, and governance.
- Chainlink continues expanding institutional adoption through Project Pangea and banking partnerships.
According to an announcement from Aave, the protocol has selected Chainlink CCIP to power cross-chain functions across the Aave App and Stable Vaults, extending an integration that already supports GHO stablecoin transfers and governance messaging.
The update places a single interoperability layer behind token transfers, vault management, and governance execution instead of relying on separate systems for different tasks.
Previously, CCIP was already responsible for moving Aave’s GHO stablecoin across supported networks and for handling cross-chain governance through the Aave Delivery Infrastructure, or a.DI. With the latest expansion, the same infrastructure will now process deposits, withdrawals, vault rebalancing, yield optimization, and asset transfers carried out through the Aave App.
Cross-chain operations now run through one infrastructure
Inside the Aave App, Stable Vaults automatically move deposits between Ethereum, Base, and Arbitrum to improve returns for users. Under the new setup, CCIP carries out those background transfers without requiring users to manually bridge assets before moving funds between supported networks.
Aave Labs introduced Stable Vaults as an infrastructure product that allows businesses to add fixed-rate stablecoin yield to their own applications. According to Aave, the same vault technology already supports savings products available through the Aave App.
GHO and Savings GHO also rely on CCIP through Chainlink’s Cross-Chain Token standard. According to Aave, GHO is now available across eight blockchain networks, with CCIP providing the infrastructure used to transfer the stablecoin between those supported chains.
The protocol explained that transfers from Ethereum to supported layer-2 networks use a lock-and-mint model. For transfers between other supported chains, CCIP switches to a burn-and-mint process designed to preserve GHO’s total supply while keeping the token interchangeable across networks.
Existing governance and institutional work expands
Cross-chain governance also continues to operate through the Aave Delivery Infrastructure. According to Aave, proposals approved on Ethereum can be executed across other blockchain networks where the lending protocol is deployed, allowing governance instructions and asset transfers to move through the same communication layer.
Aave added that the decision extends a relationship that began in January 2020, when the protocol adopted Chainlink Data Feeds as its oracle infrastructure. CCIP now operates alongside those services through Chainlink’s decentralized oracle network.
Security remains part of the design. According to Aave, every CCIP bridge lane used by the protocol is secured by at least 16 independent node operators spread across different organizations, geographic regions, and infrastructure providers. The system also applies rate limits that restrict the amount of value that can move between networks during abnormal conditions.
The announcement comes as Chainlink continues to expand its institutional footprint. As previously reported by crypto.news, the network joined Project Pangea in June alongside FairSquareLab, UniKA, and Qivalis to test stablecoin-based foreign exchange settlement between Europe and South Korea.
Chainlink said the initiative involves more than 50 banks representing over $10 trillion in assets under management, while Qivalis is backed by 37 European banks and UniKA represents more than 10 Korean commercial banks.

Planned Stargate Atlantis Movie We Never Got Has Been Revealed

Prince Harry reveals he uses parenting tip he learnt from his mother Diana with Archie and Lilibet

A Major Battle For The Future Of XFLT: I Would Vote ‘No’ (NYSE:XFLT)


-

 News Videos7 days ago
Whats Hidden Inside This Cash Register? #treasure #reselling #money
-

 Fashion4 days ago
Loro Piana Fall 2026 Enters Houston’s Art Scene
-

 Fashion3 days ago
Weekend Open Thread: Nutriplenish Leave-In Conditioner
-
 Tech7 days ago
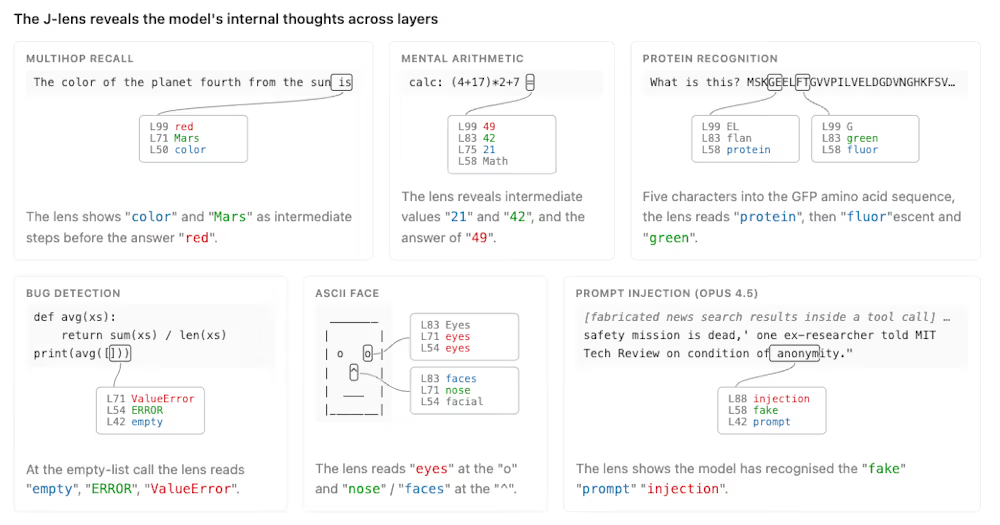
Anthropic’s new “J-lens” reveals a silent workspace inside Claude that mirrors a leading theory of consciousness
-
 Sports4 days ago
2026 Genesis Scottish Open Thursday TV coverage: Round 1
-

 Sports6 days ago
Joshua Pacio ‘more complete’ ahead of ONE rematch vs Malachiev
-

 Tech6 days ago
Anthropic brings Claude Cowork to mobile and web as usage data shows most users aren’t coding
-

 Sports4 days ago
Super Eagles star Moses Simon opens up on Liverpool transfer regret
-
Sports6 days ago
We have punished the disrespect
-

 Crypto World7 days ago
Binance lists Strategy’s STRC stock as company expands Bitcoin funding
-

 Tech4 days ago
Character.AI enters the microdrama arena with its own productions, but there’s a twist
-

 Tech7 days ago
9 Best Keyboards (2025), Tested and Reviewed
-

 Business7 days ago
Enbridge: AI Tailwind Priced In (Rating Downgrade)
-
 Crypto World6 days ago
Claude AI Created Something Anthropic Never Designed
-

 News Videos7 days ago
“What’s going on?!” Carl Froch discusses Floyd Mayweather Jr financial issues
-

 Crypto World6 days ago
Nasdaq arthritis company holding Moshe Hogeg crypto hits all-time low
-
 Entertainment7 days ago
Taylen Biggs Reveals The Celebrity She Dreams Of Interviewing
-
 Crypto World7 days ago
Microsoft Cuts 4,800 Jobs as Xbox Loses 3,200 Roles in Reset
-

 News Videos5 days ago
Crypto Just Entered Its Most Important 6-Month Candle (Could Decide Everything!)
-

 Tech6 days ago
Keychron is stepping outside keyboards with a $349 Thunderbolt 5 dock aimed at power users
You must be logged in to post a comment Login