

Crypto World
Bitcoin Price Prediction: The Hidden Timing of Daily Pump-and-Dump Cycles
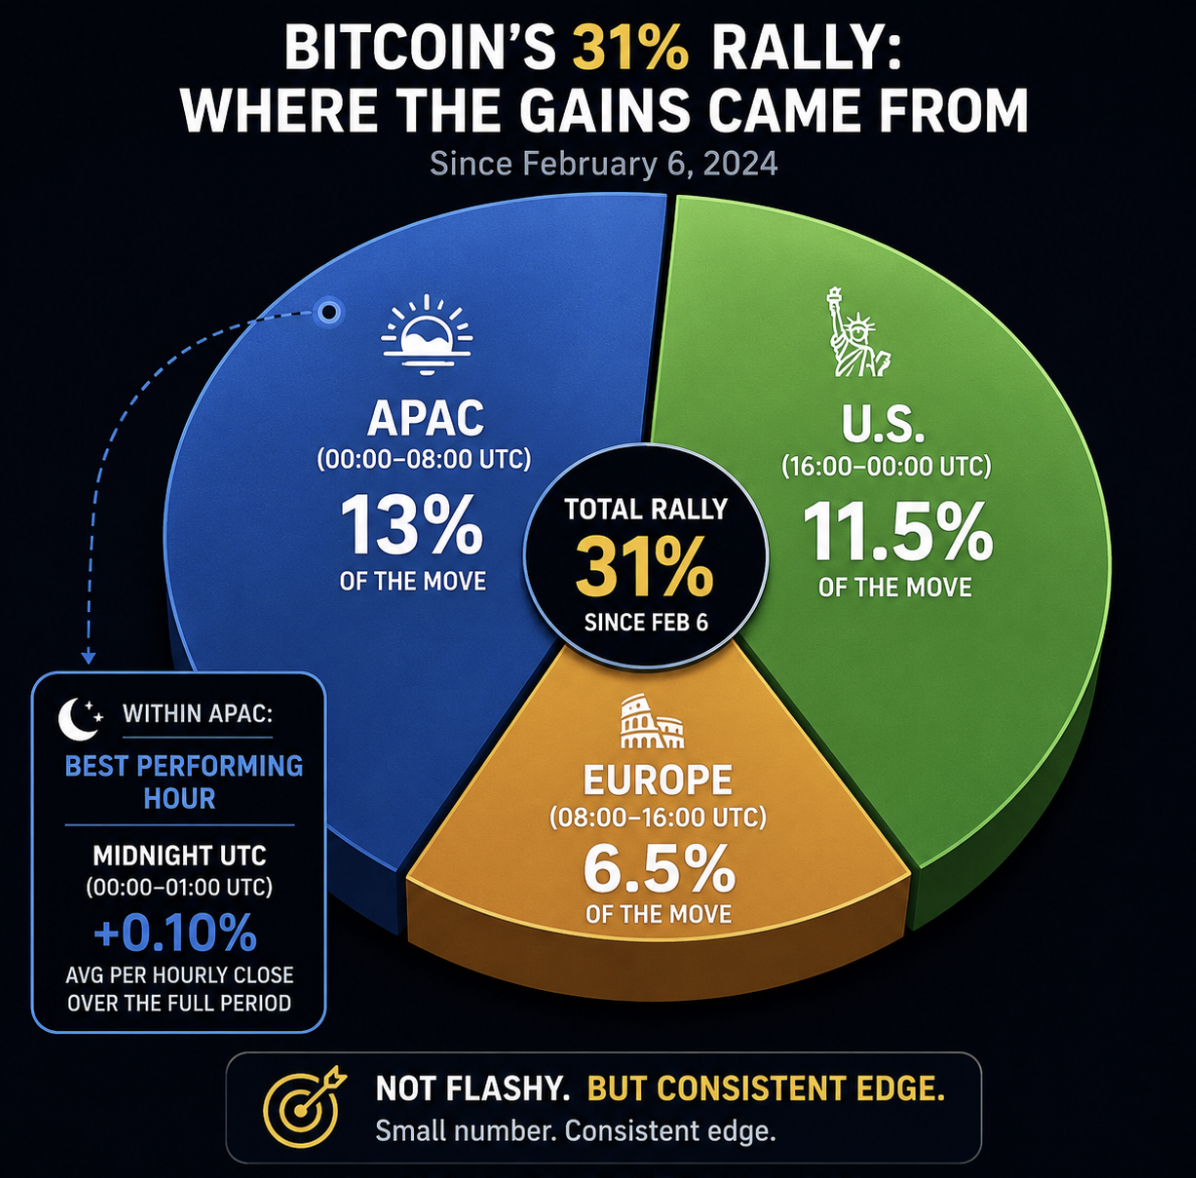
Bitcoin just broke $82,000, but the real edge isn’t the prediction of where the price is going. It’s in knowing when it moves. Three months of session data reveal a surprisingly consistent internal rhythm to BTC’s recovery that most traders are simply sleeping through.

The data from Velo shows Bitcoin’s 31% rally since February 6 has been anything but evenly distributed across the clock. APAC hours (00:00–08:00 UTC) have contributed 13% of that move. The U.S. session (16:00–00:00 UTC) added 11.5%. Europe? A comparatively muted 6.5%. And within APAC, the single best-performing hour is the midnight UTC candle, averaging 0.10% per hourly close over the full period. Small number. Consistent edge.
Discover: The best crypto to diversify your portfolio with
Bitcoin Price Prediction: Break $89,000 This Week??
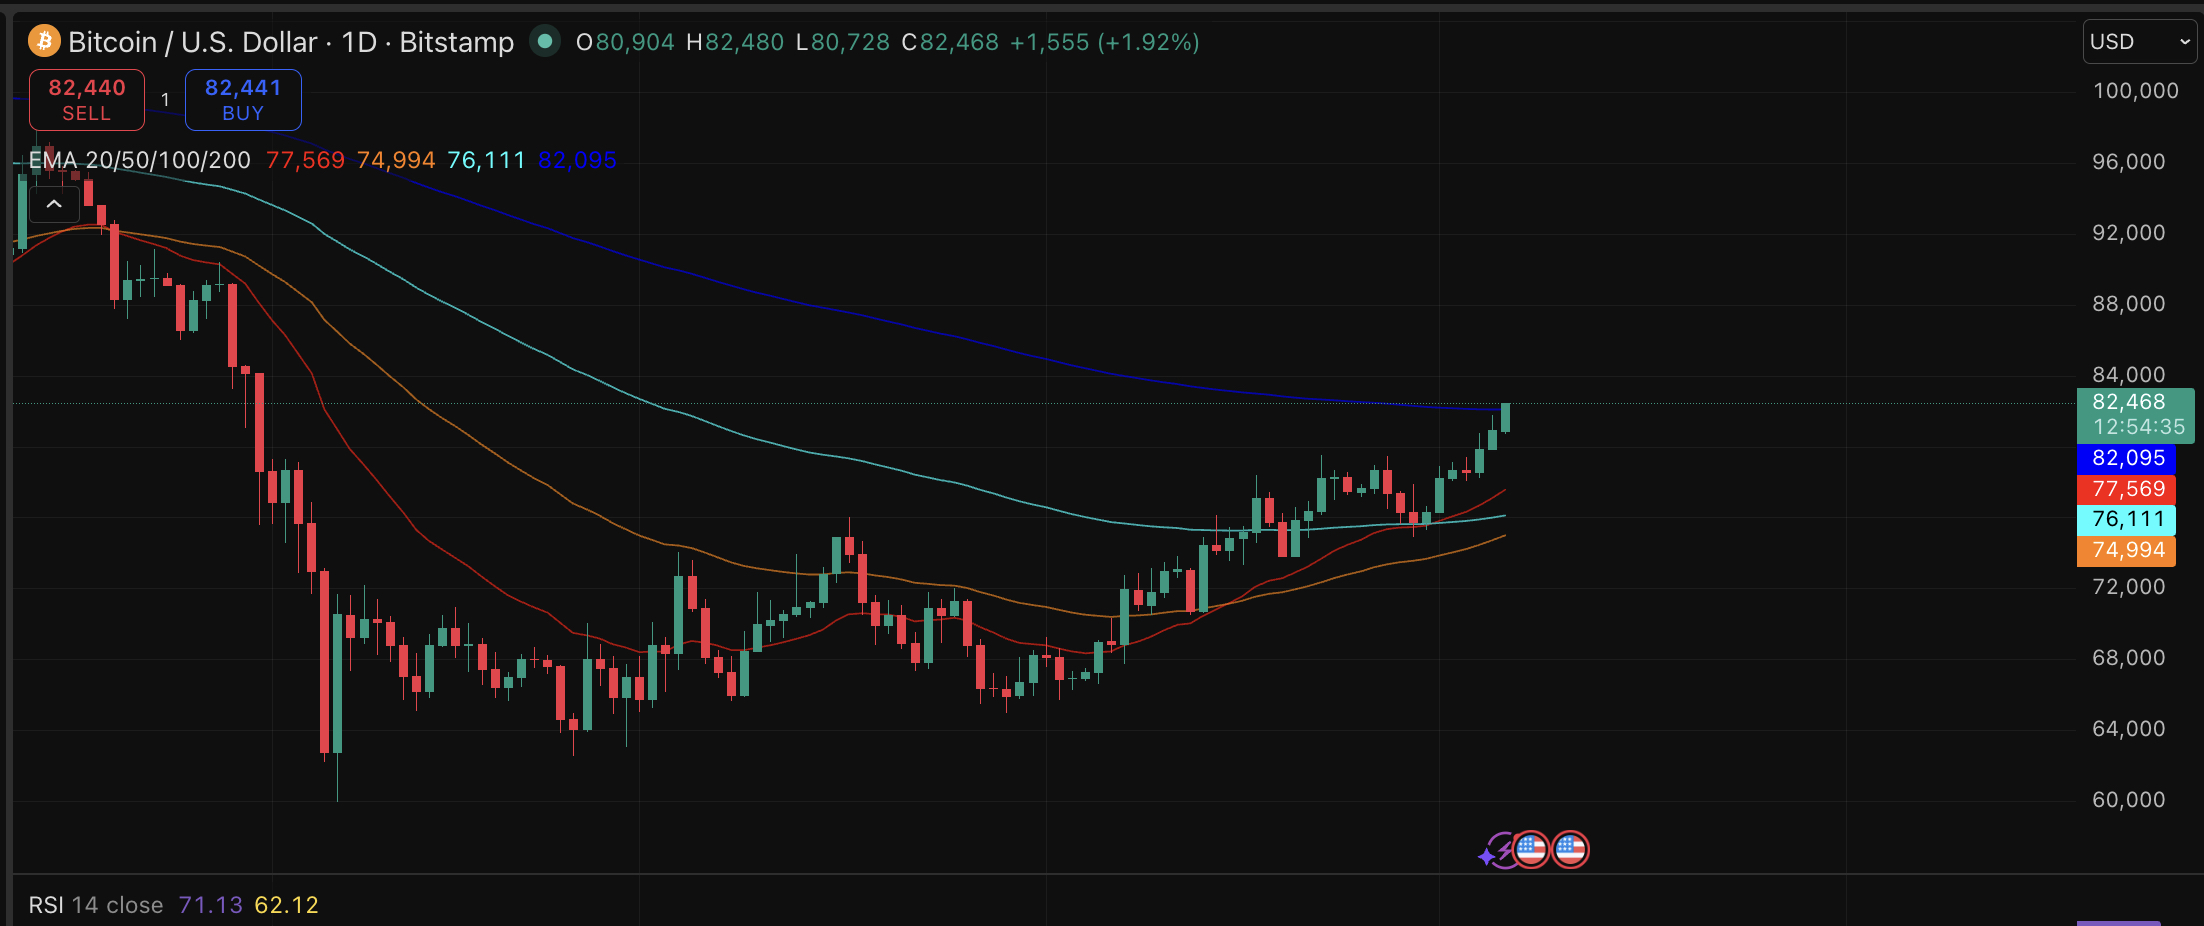
Bitcoin’s current technical setup is constructive. Price held above $80,000 support before it rallied toward $82,000 hours ago. The 24-hour range shows compression with 12 buy signals versus 7 sell signals across 23 oscillators and moving averages according to aggregated technical models.
The high of $89,000 is the resistance ceiling; a confirmed close above it would validate a renewed uptrend. If ETF inflows accelerate and the APAC session can maintain its momentum, BTC could test $89,500 in the mid-term. However, a daily close below $75,000 reopens the February lows near $63,000.
U.S. hours were flat-to-negative through most of February and March, then flipped decisively positive in early April. That pivot likely shows that institutional positioning is rotating into the New York session, which could compress the APAC edge over the coming weeks.
Discover: The best pre-launch token sales
Bitcoin Hyper Targets Early-Mover Upside as BTC Rallies
Bitcoin at $82,000 with $89,000 still uncaptured raises a fair question: how much asymmetric upside remains for spot BTC at this price? Institutional desks are already positioned. Retail is watching.
The magnitude of the next leg may disappoint latecomers relative to the risk being taken at current prices. That dynamic is exactly why some capital is rotating toward earlier-stage Bitcoin infrastructure plays.
Bitcoin Hyper ($HYPER) is positioning itself at that intersection, billing itself as the first-ever Bitcoin Layer 2 with Solana Virtual Machine (SVM) integration, targeting faster-than-Solana transaction finality while preserving Bitcoin’s security layer.
The presale has raised $32.5 million at a current price of $0.0136, with staking available for early participants. Bitcoin’s programmability problems, like slow transactions, high fees, and no smart contracts, are solved at the infrastructure level rather than patched at the application layer.
Research Bitcoin Hyper’s full presale terms before allocating capital.
The post Bitcoin Price Prediction: The Hidden Timing of Daily Pump-and-Dump Cycles appeared first on Cryptonews.


XRP price is trading at $1.33, down just a fraction of a percent today, but the chart is coiling upward. Price has compressed into the narrowest section of a symmetrical triangle on the 4-hour timeframe, and the next 48–72 hours could define XRP’s trajectory for weeks.
Volume came in at $1.57 billion over the past day, while market cap sits at $82 billion, trailing behind BNB. Some analysts have flagged a two-week 20/50 EMA death cross as a bearish technical signal, while simultaneously noting that XRP could still rally toward the EMA cluster near $1.70.
On the weekly, $XRP printed a similar deathcross back at the lower high in Jan 2026 ($2 40), and since then, we have witnessed a countertrend rally into the 20 week EMA at $1.50, and have now seen rejection in May. Confluence with the 2 week deathcross. Monitoring. https://t.co/SPp4cYiU1j pic.twitter.com/Q4yHYZxxKa
—
 ChartNerd
  (@ChartNerdTA) May 26, 2026
The weekly chart also shows an echo pattern, with a similar death cross printed at the January lower high near $2.40, followed by a countertrend surge into the 20-week EMA at $1.50 before the May rejection.
Sentiment on altcoin markets remains mixed, but compressed volatility in XRP specifically, combined with a well-defined support floor, creates a setup that precedes a violent repricing.
Discover: The Best Crypto to Diversify Your Portfolio
Will XRP Price Break $1.45 and Trigger a Fast Leg Higher?
XRP’s current structure is a war between compression and gravity. The RSI reads 40, sitting below its moving average of 44, a lower-neutral, not yet oversold, meaning buyers haven’t capitulated but haven’t committed either. The MACD remains below the signal line with a slightly negative histogram. Weak bearish pressure, not a collapse.
Key levels are surgical as XRP price sits below MA7, MA14, and MA30, all capping upside with immediate resistance stacked between $1.34–$1.38. The major trigger band is $1.40–$1.45, defined by the 100-day moving average and the descending channel’s upper boundary.
The coin is hovering at a breakout zone with a clean close above it, opening fast upside, but rejection could also send the price back toward $1.30–$1.20.
The XRP price suggests that a decision is imminent. The triangle doesn’t lie.
Discover: The Best Token Presales
LiquidChain Targets Early-Mover Upside just Like XRP Years Ago
XRP, after a 42% annual decline, offers a potential rebound, but at an $82 billion market cap, even a 30% rally means competing capital against an asset already known globally. The asymmetric upside lives elsewhere.
Traders are increasingly rotating a portion of large-cap exposure into early-stage infrastructure with structural utility before price discovery.
LiquidChain ($LIQUID) is an L3 infrastructure project built to solve one of crypto’s most persistent structural failures: fragmented liquidity across chains. Its Unified Liquidity Layer fuses Bitcoin, Ethereum, and Solana liquidity into a single execution environment.
The plan comes to fruition. — LiquidChain (@getliquidchain) May 27, 2026
The Order evolves.  ⟁https://t.co/vqvBcdSQYC pic.twitter.com/PiWBmSBRrH
Liquid boasts a deploy-once architecture with verifiable settlement and single-step cross-chain execution. This is the missing middleware layer that DeFi has needed for years.
The presale has raised more than $810K at a current token price of $0.01463. Those numbers are early, especially with 1400% APY bonus for today’s buyer. With Liquid, developers deploy once and access all three major ecosystems. It’s a value proposition that speaks directly to the builder demand driving the next cycle.
Research LiquidChain and review the full presale details.
The post XRP Price Chart Shows Incoming Violent Rebound: Next Leg Could Be Fast and Monstrous appeared first on Cryptonews.
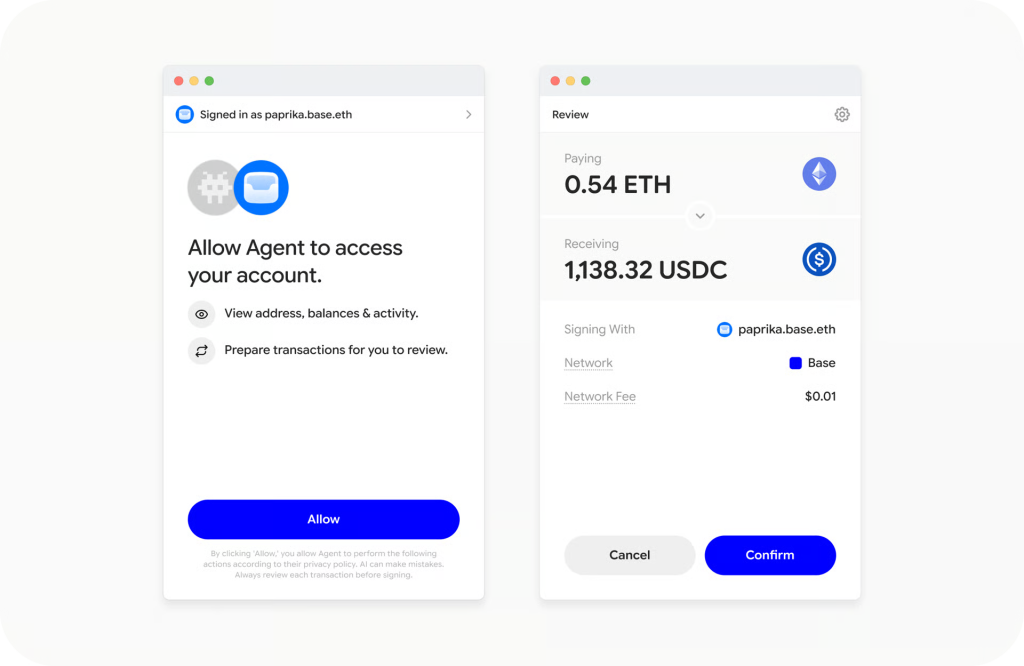
Coinbase’s Base Layer-2 has launched Base MCP, a new Model Context Protocol tool that connects Crypto wallets directly to AI agents, enabling autonomous on-chain execution without custom per-dApp integration.
The launch is the latest move in a coordinated infrastructure push from Coinbase that spans agent wallets, machine-to-machine payments, and developer tooling – all converging on Base as the execution layer.
For traders watching the AI-agent infrastructure vertical, this is not an isolated product release. It slots into a fast-expanding category of wallet-automation primitives that are drawing both developer attention and early capital across the L2 ecosystem.
Discover: The Best Crypto to Diversify Your Portfolio
What Base MCP Crypto Tool Actually Does, and Why It’s More Than a Dev Feature
The Base MCP is built on the Model Context Protocol (MCP) framework, an emerging standard that enables AI systems to communicate with external tools via a standardized interface.
Applied to crypto, that means an AI agent can check wallet balances, send funds, swap tokens, sign messages, and process payments via Coinbase’s x402 protocol, all from a Base Account, without bespoke smart contract logic per integration.
This builds directly on Coinbase’s Agentic Wallets infrastructure, unveiled in early 2025, which introduced dedicated wallet architecture for autonomous agents complete with built-in skills: Authenticate, Fund, Send, Trade, and Earn. Those wallets are gasless on Base, with USDC as the primary payment medium.

The x402 machine-to-machine payments protocol, which embeds stablecoin transfers directly in HTTP requests, had already processed approximately 50 million transactions by that point – giving Coinbase a live usage base before MCP shipped.
MCP functions as the plug-and-play interface layer sitting on top of that stack. Rather than requiring developers to wire up wallet logic per application, MCP integration makes agent-to-wallet connectivity a standard primitive.
Security is handled through trusted execution environments, where private keys are generated and stored inside a secure enclave that the AI agent never directly accesses. Per-agent spend limits and whitelisted counterparties can be enforced at the infrastructure layer – a guardrail structure aimed squarely at institutional and enterprise adoption.
Base’s position as Coinbase’s Ethereum Layer-2 gives it a specific distribution advantage here: gasless transactions and deep USDC liquidity lower the friction cost for agent-driven activity in ways that competing chains haven’t fully replicated.
Discover: The Best Token Presales
The post Base Launches Wallet-to-AI Agent Crypto Tool in Layer-2 Product Expansion appeared first on Cryptonews.
At the start of the week, the US currency continues to trade near significant levels amid ongoing uncertainty surrounding negotiations between the United States and Iran. Markets are closely monitoring reports suggesting a possible prolongation of the negotiation process and an increased US military presence in the Middle East, both of which are supporting demand for safe-haven assets, including the dollar.
Additional support for the US currency comes from rising US Treasury yields and expectations surrounding upcoming macroeconomic data releases, which could influence further market expectations regarding Federal Reserve policy.
At the same time, the dollar’s movement remains mixed. Despite the recent strengthening of USD/JPY and USD/CAD, both pairs have approached important technical resistance levels, where buying activity is beginning to slow. The market is now assessing whether the current momentum can develop into a broader continuation of dollar strength, or whether the advance in the US currency will remain merely a short-term reaction to geopolitical risks.
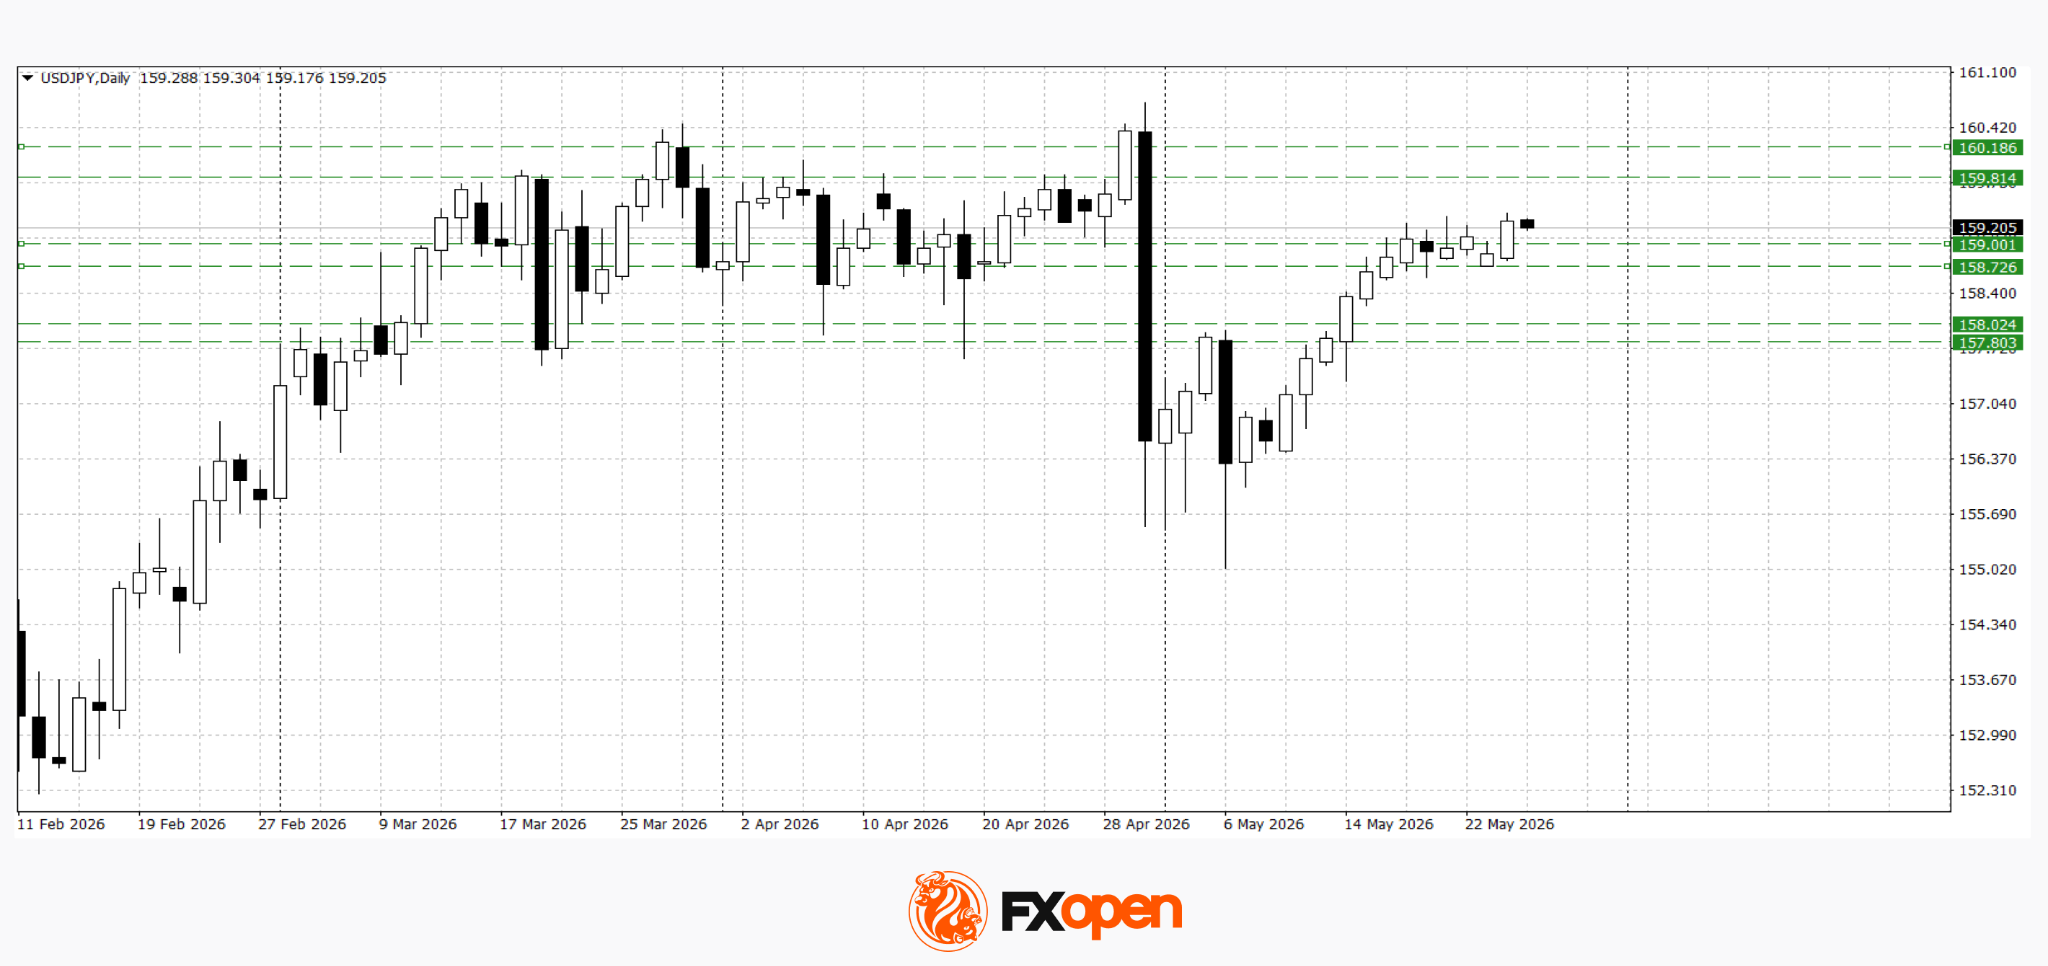
USD/JPY
Buyers in USD/JPY have managed to establish the pair above the key 159.00 level. If the 158.70–159.00 range retains its status as support, further growth towards 159.80–160.20 remains possible. A loss of this zone could trigger a downward correction towards 158.00–157.80.
Key events for USD/JPY:
- today at 11:00 (GMT+3): speech by Dallas Fed representative Lorie K. Logan;
- today at 15:15 (GMT+3): US ADP non-farm employment change;
- tomorrow at 02:50 (GMT+3): foreign investment in Japanese equities.

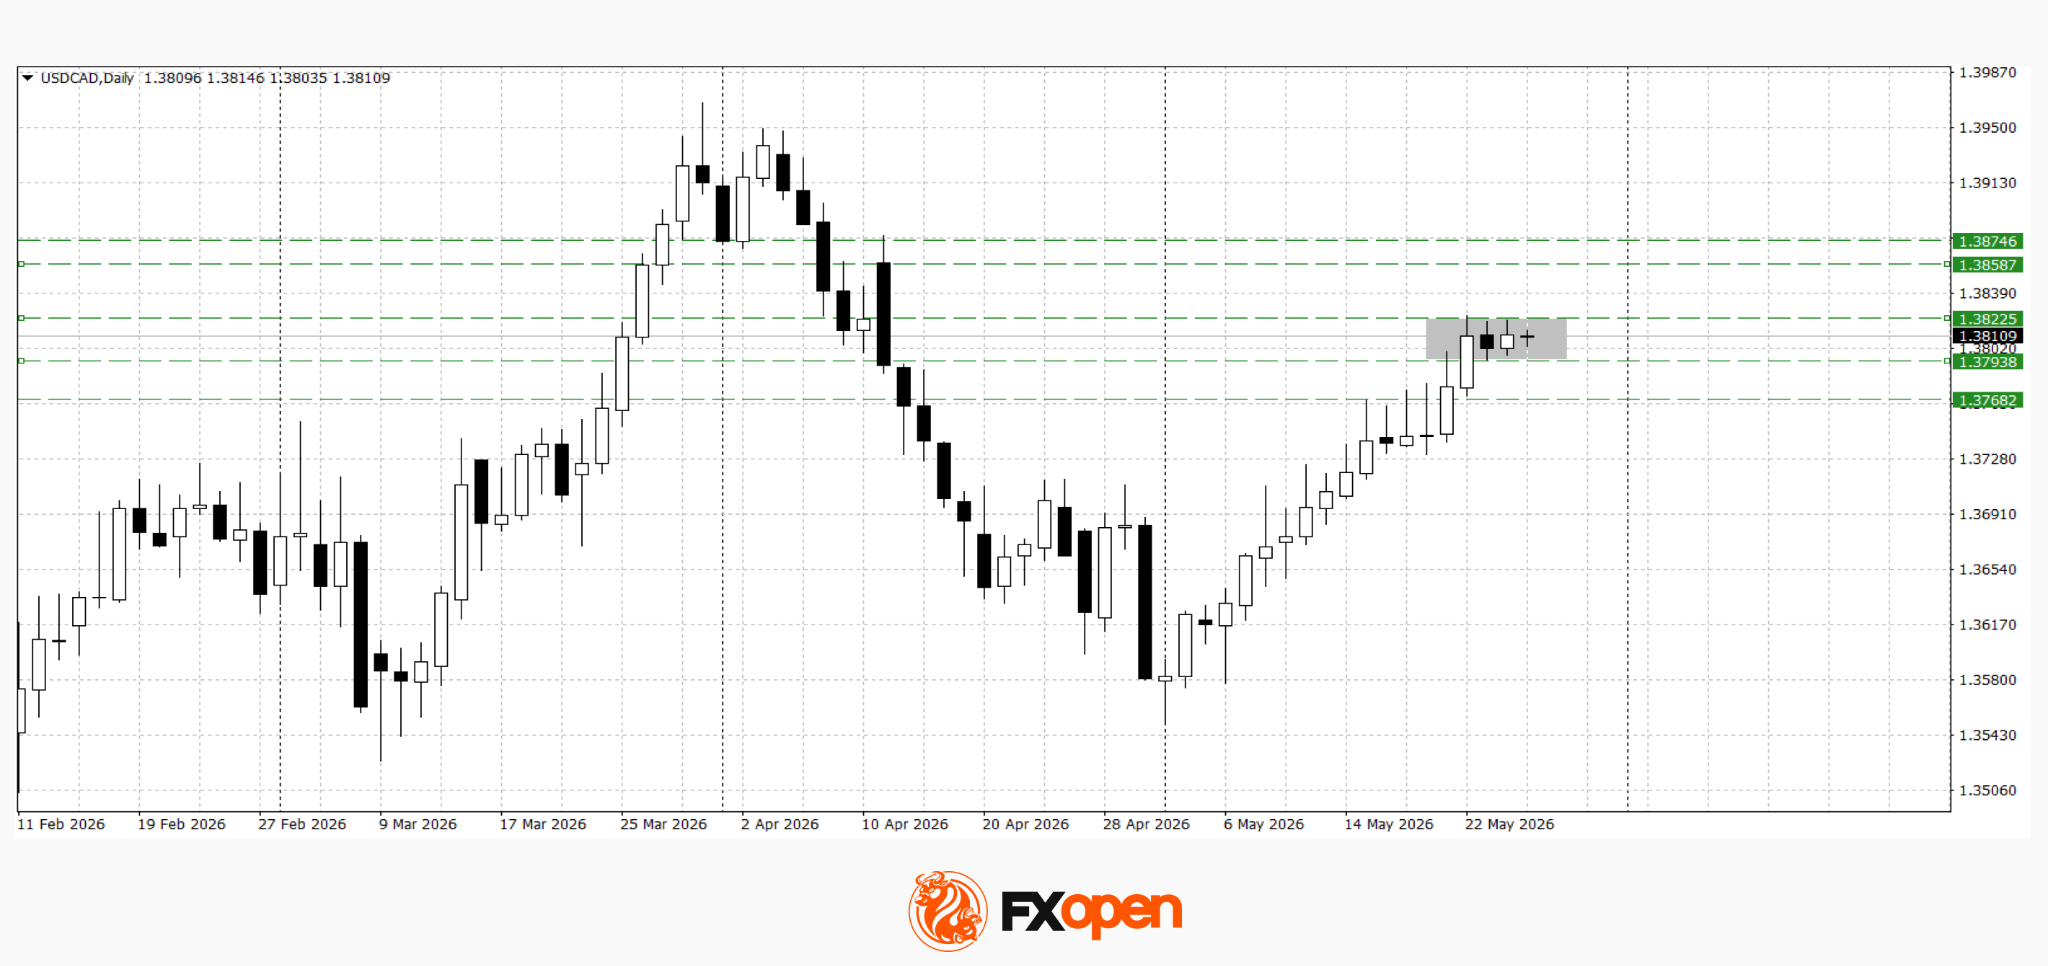
USD/CAD
USD/CAD is also trading within a range after reaching major resistance near 1.3800. Should strong US data be released or demand for the dollar remain firm, the pair may consolidate above 1.3820 and continue rising towards 1.3870. Conversely, weaker interest in the US currency could push the pair below 1.3800 and towards the 1.3750–1.3770 area.
Key events for USD/CAD:
- today at 15:30 (GMT+3): Canadian wholesale sales data;
- today at 23:30 (GMT+3): weekly US crude oil inventories from the American Petroleum Institute (API);
- tomorrow at 15:30 (GMT+3): Canada’s current account balance.
Overall, the dollar continues to retain an advantage amid geopolitical uncertainty and expectations of fresh macroeconomic signals from the United States. Nevertheless, the approach of USD/JPY and USD/CAD towards key technical resistance levels increases the likelihood of the current momentum slowing, while the next directional move will largely depend on incoming US economic data and developments surrounding negotiations between the US and Iran.
Trade over 50 forex markets 24 hours a day with FXOpen. Take advantage of low commissions, deep liquidity, and spreads from 0.0 pips (additional fees may apply). Open your FXOpen account now or learn more about trading forex with FXOpen.
This article represents the opinion of the Companies operating under the FXOpen brand only. It is not to be construed as an offer, solicitation, or recommendation with respect to products and services provided by the Companies operating under the FXOpen brand, nor is it to be considered financial advice.

EUR/USD started a downside correction from 1.1650. USD/CHF is rising and might aim for a move toward 0.7880 or 0.7900.
Important Takeaways for EUR/USD and USD/CHF Analysis Today
· The Euro struggled to clear 1.1650 and corrected gains against the US Dollar.
· There is a key bullish trend line forming with support at 1.1630 on the hourly chart of EUR/USD at FXOpen.
· USD/CHF is showing positive signs above the 0.7830 zone.
· There was a break above a connecting bearish trend line with resistance at 0.7830 on the hourly chart at FXOpen.
EUR/USD Technical Analysis
On the hourly chart of EUR/USD at FXOpen, the pair gained pace for a move above 1.1600. The Euro tested 1.1650 and recently corrected gains against the US Dollar.
The pair dipped below 1.1635 and the 38.2% Fib retracement level of the upward move from the 1.1588 swing low to the 1.1652 high. However, the bulls were active above 1.1620. There is also a key bullish trend line forming with support at 1.1630.
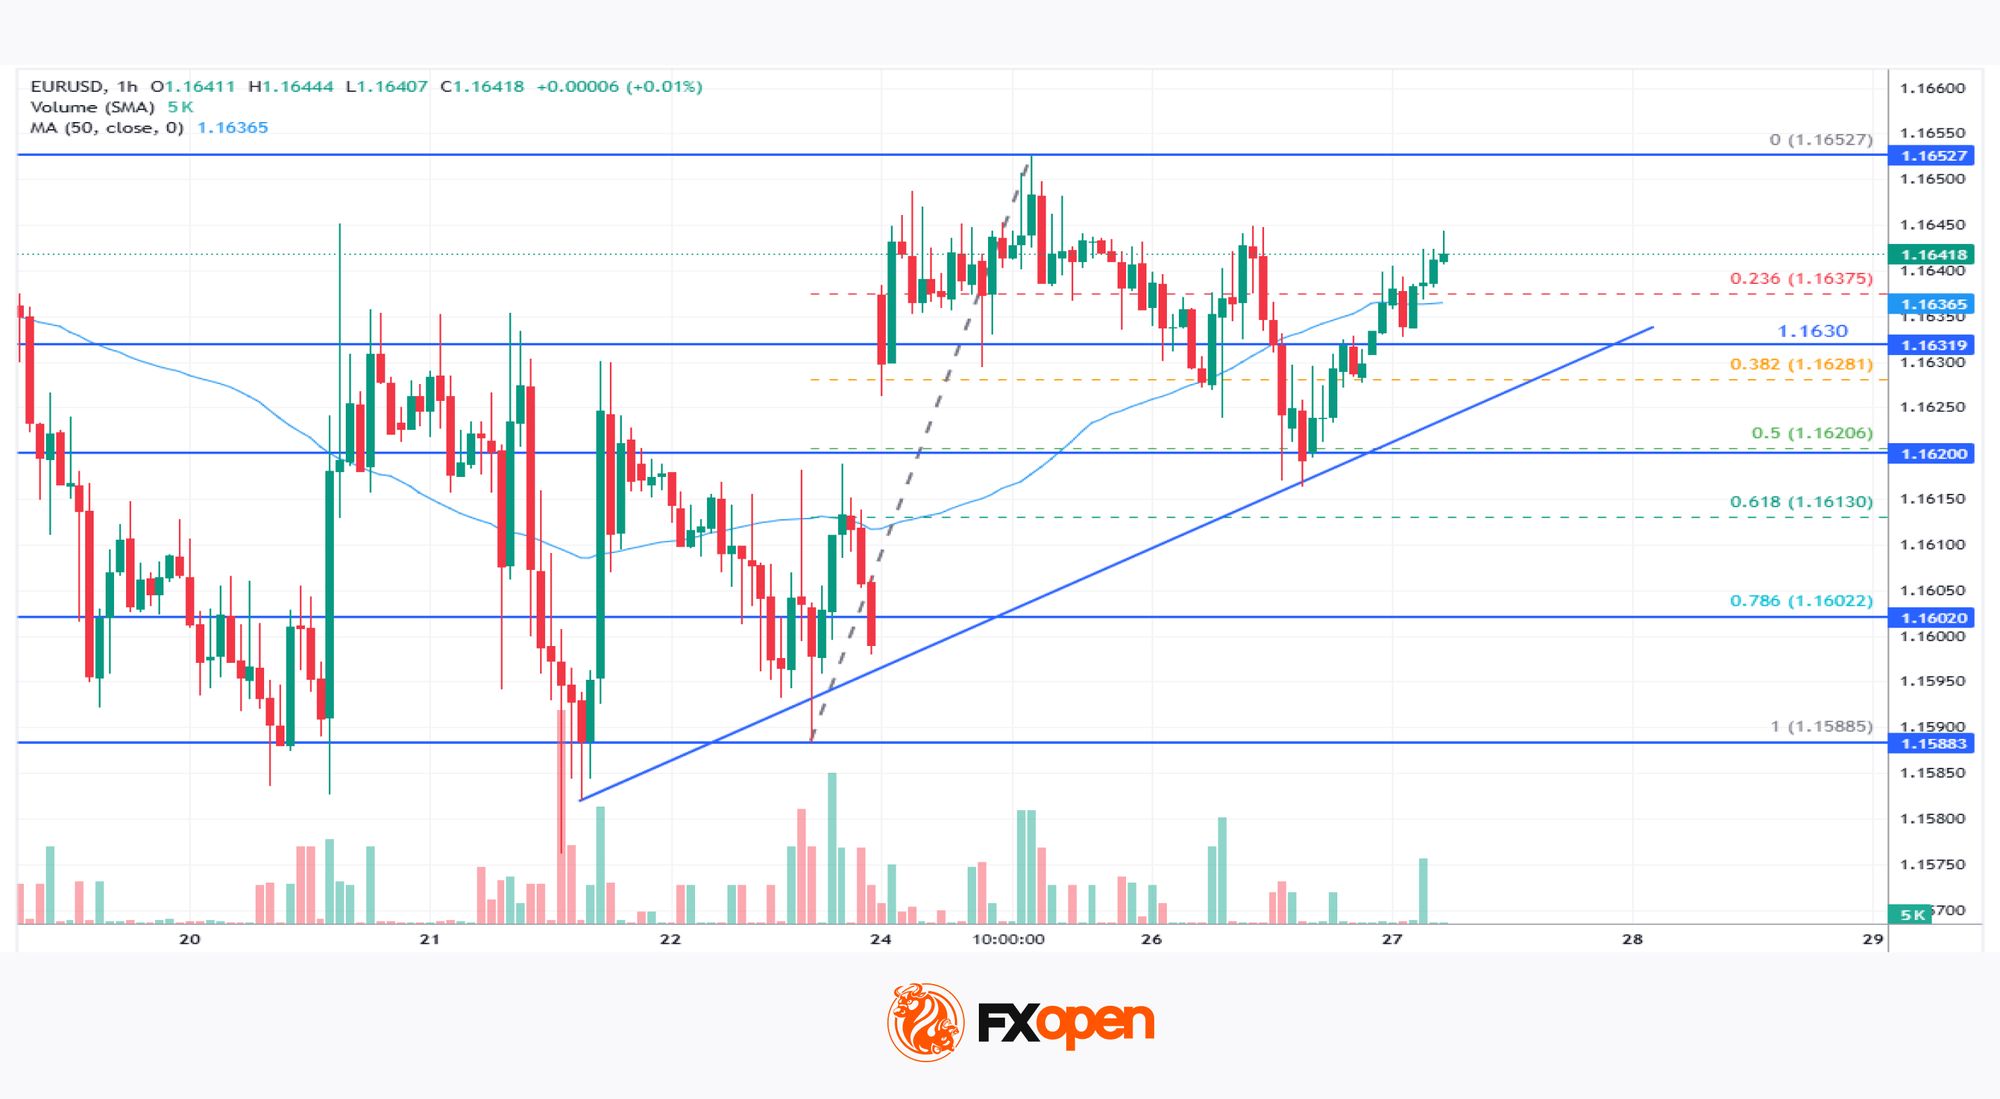
The pair is again above the 50-hour simple moving average. Immediate resistance on the upside could be 1.1650. The next key hurdle for the bulls might be 1.1675.
An upside break above 1.1675 might send the pair toward 1.1705. Any more gains might open the doors for a move toward 1.1740. If the bulls fail to push the pair above 1.1650, there could be another bearish reaction.
On the downside, immediate support on the EUR/USD chart might be near the trend line at 1.1630. The next major area of interest could be near the 50% Fib retracement level at 1.1620. A downside break below 1.1620 could send the pair toward 1.1550.
USD/CHF Technical Analysis
On the hourly chart of USD/CHF at FXOpen, the pair declined from the 0.7900 barrier and tested the 0.7810 zone. The US Dollar traded as low as 0.7808 and recently started a fresh increase against the Swiss Franc.
The pair climbed above 0.7820 and the 50-hour simple moving average. There was a break above the 50% Fib retracement level of the downward move from the 0.7903 swing high to the 0.7808 low. Besides, there was a break above a connecting bearish trend line with resistance at 0.7830.
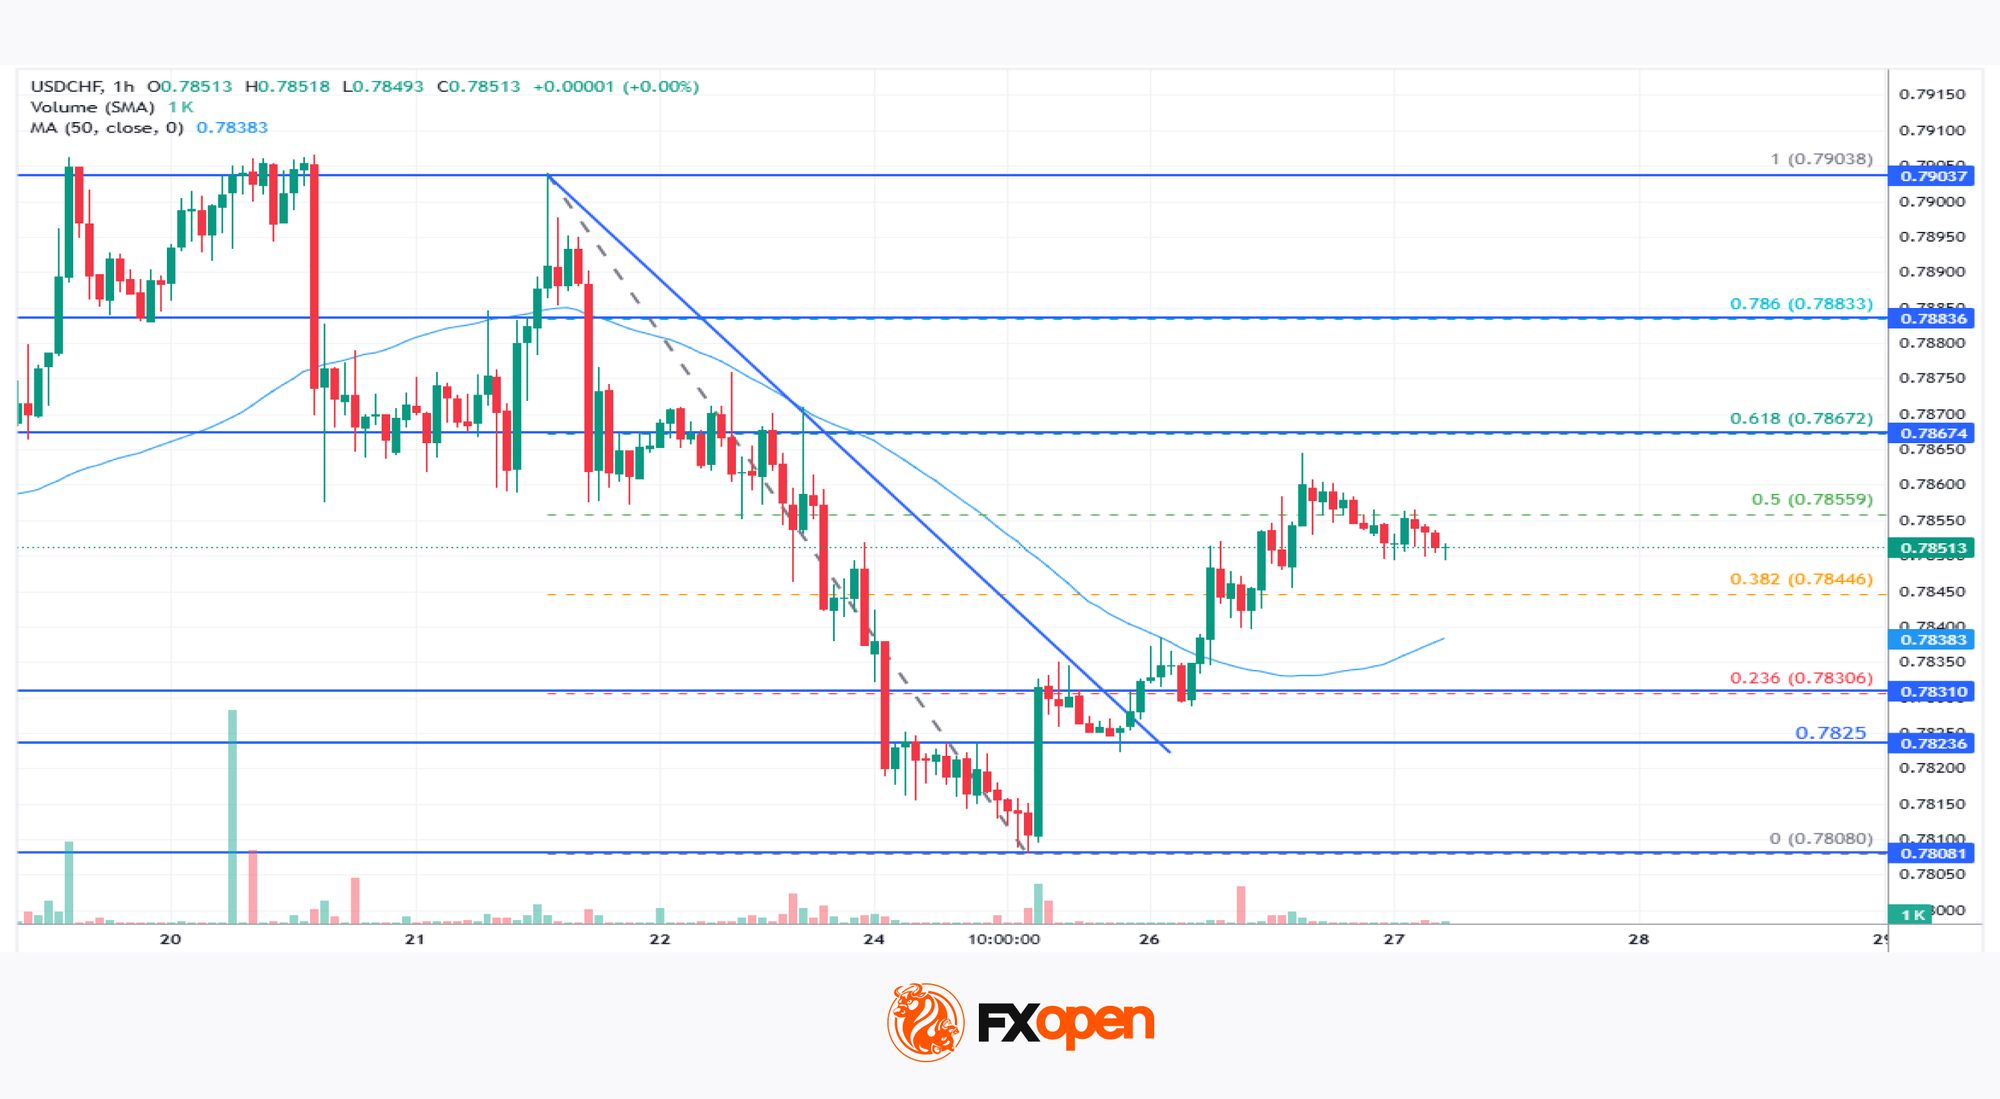
The bulls are now facing hurdles near the 61.8% Fib retracement at 0.7865. The next major area of interest could be 0.7880. The main sell region could be near 0.7900.
If there is a clear break above 0.7900, the pair could start another increase. In the stated case, it could test 0.8000. If there is another decline, the pair might test the 50-hour simple moving average at 0.7835.
The first major support on the USD/CHF chart could be 0.7830. A downside break below 0.7830 might spark bearish moves. The next major support might be 0.7800. Any more losses may possibly open the doors for a move toward 0.7765 in the near term.
Trade over 50 forex markets 24 hours a day with FXOpen. Take advantage of low commissions, deep liquidity, and spreads from 0.0 pips (additional fees may apply). Open your FXOpen account now or learn more about trading forex with FXOpen.
This article represents the opinion of the Companies operating under the FXOpen brand only. It is not to be construed as an offer, solicitation, or recommendation with respect to products and services provided by the Companies operating under the FXOpen brand, nor is it to be considered financial advice.


South Korean prosecutors have charged five people accused of running a rug pull on the Solana-based meme coin CATFI. The case marks the country’s first arrest and prosecution tied to a decentralized exchange scheme.
Prosecutors said the group made roughly 400 million won, or about $260,000, in illicit profits. The scheme caused 900 million won (~$650,000) in losses across 256 investors.
How the CATFI Scheme Worked
Investigators named the surname Park as the main suspect. Park ran the “Eth Father” social media account, posing as an unrelated third party who recommended CATFI to followers.
Park and his associates issued CATFI on Pump.fun, a Solana token launchpad, using about 10 million won in capital. The token was then listed on a decentralized exchange. The group relied on multiple wallets and circular trades to hide their control of the supply.
CATFI’s price climbed roughly 1,001 times within 26 hours of listing before the operators sold off their holdings. About 6,000 buyers entered the trade. The collapse left 256 investors with combined losses of 900 million won, prosecutors said.
The charges mark the first use of fraudulent trading provisions under Korea’s user protection law. The law took effect in July 2024. An earlier case under the same statute focused on market manipulation at a centralized exchange. This case is the first to target a decentralized exchange platform.
Two suspects were detained and indicted, and one was charged without detention. Two accomplices face separate charges for helping the main suspect evade investigators. Seoul’s new investigative crime unit for virtual assets led the case.
Solana has seen similar rug pulls before, but prosecutions tied to DEX activity have been rare. Prosecutors said they would respond firmly to schemes that erode market trust.
The post South Korea Makes First Arrest and Prosecution in Meme Coin Rug Pull Case appeared first on BeInCrypto.

TLDR
- Secretary of State Marco Rubio declared the Strait of Hormuz will be accessible again “one way or the other” after recent U.S. military operations targeting Iran
- Negotiated framework under discussion features ceasefire lasting 30-60 days with provisions for Iranian oil exports
- Administration officials forecast dramatic energy price drops upon strait’s reopening
- Energy sector experts caution about extended “Hormuz Hangover” with normalization potentially requiring multiple quarters or years
- Oil futures fluctuating in $90-$100 range amid ongoing diplomatic uncertainty
Secretary of State Marco Rubio issued a firm declaration Tuesday that the critical Strait of Hormuz shipping corridor will be restored to operation “one way or the other,” speaking after American military forces conducted strikes on Iran’s southern territory overnight. His remarks coincided with ongoing indirect diplomatic exchanges between U.S. and Iranian representatives in Qatar’s capital.
The strategic waterway has faced operational constraints since combined U.S.-Israeli military action against Iran commenced on February 28, initiating the current conflict. Tehran’s subsequent restrictions on maritime traffic have been a significant factor in escalating fuel costs worldwide.
Rubio emphasized that Washington’s position requires unrestricted, cost-free navigation through the strait. He condemned Iran’s implementation of passage fees, asserting that Tehran stands isolated internationally in supporting such a maritime toll structure.
Tehran has rejected characterizations of the fees as tolls, with foreign ministry representatives explaining the charges compensate for navigational assistance and environmental safeguards.
What a Deal Would Look Like
Emerging reports indicate the diplomatic framework being considered encompasses a ceasefire extension of either 30 or 60 days, during which maritime access would be restored and Tehran would receive authorization to sell oil. Discussions regarding nuclear capabilities would be deferred to subsequent negotiations.
Wolfe Research analysts characterized the proposal as a “skinny” agreement, observing that financial markets “won’t care one bit about the deferral of the nuclear file.” Their assessment is direct: strait accessibility alone would trigger favorable market responses.
President Trump indicated over the recent weekend that an announcement regarding a deal would come “shortly,” though he subsequently revised expectations, acknowledging negotiations require additional time.
Rubio stated Tuesday that finalizing any agreement would require “a few days,” even as fresh confrontations between American and Iranian military forces erupted near the strait. U.S. Central Command confirmed conducting strikes partially to neutralize Iranian vessels attempting to deploy naval mines.
Why Analysts Are Cautioning Against Optimism
Despite confident projections from administration officials, energy sector analysts are advocating measured expectations. Wolfe Research projected that replenishing commercial and strategic petroleum reserves “will stretch well into 2027.” Henrietta Treyz from AGF Investments introduced the concept of a “Hormuz Hangover,” arguing recovery duration should be “measured in quarters and years.”
Capital Economics assessed that any market surge following reopening would likely prove constrained because energy pricing won’t immediately normalize.
Administration officials have contested this conservative outlook. Kevin Hassett, director of the National Economic Council, stated on Fox Business that “as soon as the straits are open, energy prices are going to plummet like nothing you’ve ever seen before.” He projected refinery replenishment could occur within one to two months.
Approximately 1,500 vessels are currently stationed in the Persian Gulf awaiting clearance through the strait. Physical infrastructure damage to regional energy facilities compounds the projected recovery period.
Brent crude alongside West Texas Intermediate futures maintained trading ranges between $90 and $100 per barrel Tuesday as diplomatic discussions progressed.
Yardeni Research analysts identified an additional long-term consideration. Even following conflict resolution, equity markets will likely incorporate a “Strait of Hormuz premium” into oil valuations, reflecting the persistent possibility of future Iranian closures.
Iranian legislators introduced additional stipulations Tuesday, with the parliamentary National Security and Foreign Policy Committee chairman detailing confidence-building requirements the United States must satisfy before finalizing any accord.
As of Tuesday evening, no agreement had been concluded, and the timeline for potential announcements remained undetermined.

Bitcoin’s price rally that drove the asset to $78,000 yesterday came to a screeching halt after a painful rejection pushed it south by approximately three grand.
Most larger-cap alts are sluggish today, but RAIN has joined them in terms of market cap after a massive surge of over 40%.
BTC Halted at $78K
After peaking at over $82,000 a couple of weeks ago, bitcoin entered a more prolonged downtrend that drove it south hard. It was first pushed below $80,000 by May 16, then the bears initiated a few more leg downs that ultimately resulted in a massive decline to under $74,500 on May 23. This became the cryptocurrency’s lowest price tag in just over a month.
It rebounded almost immediately after Trump said the US and Iran are getting closer to a permanent peace deal. It jumped to $77,500 at the time and, after a brief retracement, spiked to $78,000 yesterday for the first time in several days.
However, reports emerged that the strikes between the US and Iran had resumed instead of a peace deal, and BTC dipped to $76,000. It plunged further to $75,200 earlier today as experts outlined a mind-blowing sale through BlackRock’s IBIT.
Nevertheless, it has rebounded slightly and currently trades close to $76,000 again. Its market cap has slipped to $1.520 trillion on CG, while its dominance over the alts has settled at 58%.

RAIN Outperforms
RAIN is by far the top performer from all top 100 alts today. It has skyrocketed by over 44% as of now and tapped a new all-time high at almost $0.012. ICP and UB have also rocketed by double digits, but nowhere near close – 15% and 10%, respectively.
In contrast, NEAR has plunged by over 8%, followed by ZEC’s 6% decline. CC, ONDO, and WLFI are also well in the red daily. Ethereum has slipped below $2,100, while XRP struggles beneath $1.35. HYPE is close to its all-time high after a 4% daily increase.
The total crypto market cap has defended the $2.6 trillion level and stands about $20 billion above it.

The post RAIN Skyrockets 40% to New ATH, BTC Price Dumps by $3K Daily: Market Watch appeared first on CryptoPotato.

Chainlink is drawing fresh market attention after Binance outflow data showed a sharp rise in large LINK withdrawals.
Summary
- LINK exchange outflows reached 2025 highs as investors moved tokens off Binance during May trading.
- Whale wallets holding 100,000 LINK hit a record, adding pressure to the accumulation debate now.
- LINK price remains below $9.87 midline, leaving $9.65 and $8.95 as key levels for traders.
CryptoQuant analyst Darkfost said the top 10 LINK outflow transactions on Binance have climbed to their highest level of 2025.
The analyst said the largest daily outflows averaged more than 3,600 LINK through May, with several days showing more than 5,000 LINK withdrawn. Such moves often suggest investors are moving tokens away from exchanges and into external wallets for longer holding.
The broader altcoin market has also started to recover from its February low. Darkfost noted that Total3, which tracks the total crypto market cap excluding Bitcoin, Ethereum, and stablecoins, has risen more than 15% from that local bottom.
Still, the recovery remains uneven. Some tokens have strongly outperformed, while many assets continue to trade far below previous highs.
Chainlink price trades below key recovery level
The crypto.news price page showed Chainlink trading near $9.42, down 82.13% from its all-time high of $52.70 reached on May 10, 2021. Daily trading volume stood at about $293.28 million, with LINK ranking among the most actively traded crypto assets.
The token had a market capitalization of about $6.84 billion and a circulating supply of 727.09 million LINK. Chainlink has a maximum supply of 1 billion LINK, which keeps supply data in focus for long-term investors.
Technical data showed LINK trading below the 20-day Bollinger Band midline at $9.87. The upper band sat near $10.76, while the lower band was near $8.99.
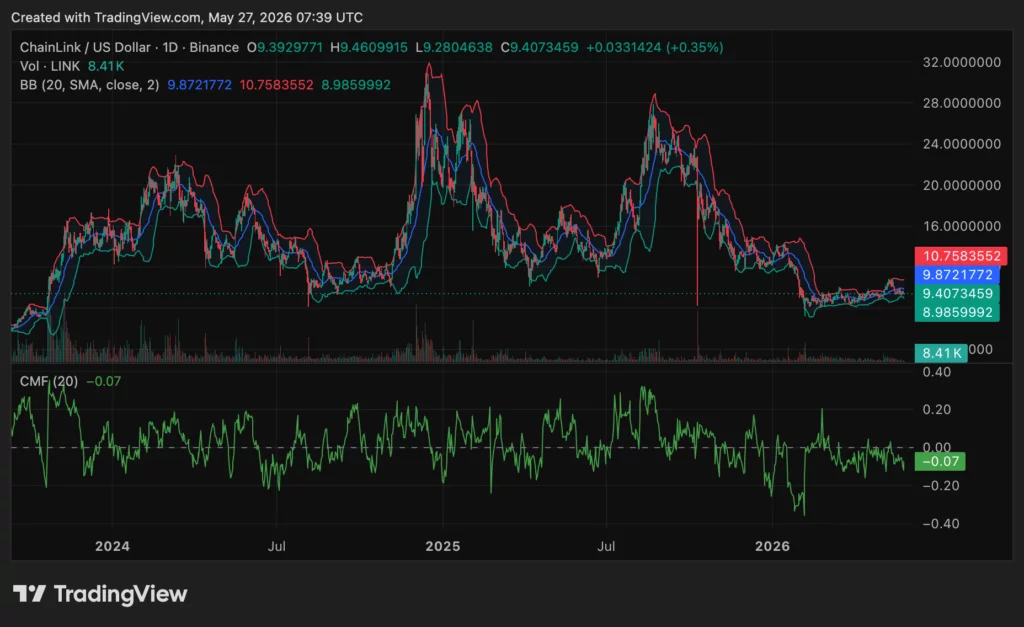
That setup shows the token is stabilizing above lower support, but buyers have not yet gained clear control. A move above $9.65, cited by CryptoWZRD as a short-term trigger, could open room for more upside. A drop below $8.95 would put support back in focus.
Whale wallets add to accumulation signal
Just 2 days ago, Santiment data also pointed to rising whale activity. The analytics platform said Chainlink now has 805 wallets holding at least 100,000 LINK, an all-time high. Those wallets have increased by 8.2% over seven weeks.
This adds weight to the exchange outflow signal. When large wallets grow while tokens leave exchanges, traders often read it as accumulation. It can suggest that large holders are preparing for a longer-term move rather than short-term selling.
However, the setup is not a confirmed reversal. Darkfost cautioned that “a single indicator alone is not enough to confirm a structural market reversal.”
That caveat matters because LINK still trades in a weak technical zone. The Chaikin Money Flow was near -0.07, showing mild negative money flow. Selling pressure remains present, even if it is not extreme.
Chainlink fundamentals remain active
Recent network data gives the price setup more context. Chainlink’s CCIP stack recently passed $110 billion in total value secured, including about $60 billion tied to cross-chain tokens and $50 billion in DeFi data feeds.
The same report noted that Chainlink had enabled $30.31 trillion in cumulative transaction value and published 19.39 billion verified on-chain messages as of late May 2026.
As earlier reported by crypto.news, Chainlink earned Deloitte SOC 2 Type 2 certification, a compliance step aimed at strengthening trust among institutional users. The report noted that CCIP had averaged about $90 million in weekly token transfers, while Chainlink infrastructure had enabled more than $28 trillion in cumulative transaction value at that time.
For now, the LINK price setup remains mixed. Exchange outflows and whale growth point to accumulation, while technical indicators show consolidation between $9 and $10. Bulls need a clean move above $9.65 and then $9.87 to show stronger recovery momentum.
Disclosure: This article does not represent investment advice. The content and materials featured on this page are for educational purposes only.
Key Highlights
- Base network from Coinbase has introduced Base MCP, enabling AI assistants such as ChatGPT and Claude to interface with cryptocurrency wallets.
- Through conversational commands, users can transfer assets, exchange tokens, view account balances and engage with decentralized finance platforms.
- Initial integration includes support for DeFi protocols such as Uniswap, Morpho, Moonwell and Avantis.
- All transactions require explicit user approval — AI assistants never gain access to private wallet keys.
- The x402 agentic payment system, which Base MCP builds upon, has recorded only $1.1 million in transaction volume during the last 30 days.
The Ethereum Layer 2 solution from Coinbase, known as Base, has unveiled Base MCP, an innovative integration that enables artificial intelligence platforms including ChatGPT and Claude to communicate directly with cryptocurrency wallets and decentralized financial applications.
This integration leverages the Model Context Protocol (MCP), an established framework designed to facilitate secure connections between AI systems and external applications.
Through simple conversational requests, users can instruct an AI agent to execute various operations including fund transfers, token swaps, balance inquiries, or transaction history reviews — all without navigating traditional cryptocurrency interfaces.
The initial release supports multiple DeFi protocols operating on Base. These encompass lending services Morpho and Moonwell, decentralized trading platform Uniswap, and derivatives exchange Avantis. Additional supported platforms include Aerodrome, Bankr and Virtuals.
Transaction Execution Process
When users submit requests, the AI assistant formulates a proposed action within the chat interface. Subsequently, the Base wallet appears in a separate window where users can either approve or reject the transaction.
Private keys remain exclusively under user control. Each operation undergoes the identical verification process used for standard Base account transactions. Additionally, asset modifications are previewed through simulation before user confirmation.
Lincoln Murr, who leads AI Product development at Coinbase, emphasized that the Base Account maintains continuity across platforms. He distinguished it from “isolated agentic wallets confined to terminal environments,” noting that trading activity, transaction records, and portfolio information remain synchronized across both the AI agent interface and the Base application.
Base positioned this release as advancing toward AI-integrated internet experiences. The organization expressed confidence that conversational agent interfaces will emerge as a primary channel for users to explore and utilize blockchain-based applications.
Development Phase and Security Considerations
Base MCP also advances the adoption of x402, an agentic AI payment framework introduced by Coinbase in May 2025. Murr characterized MCP as a “convenient wrapper” built upon existing application programming interfaces.
Combined with x402, this technology aims to facilitate small-scale cryptocurrency micropayments executed by AI agents. Nevertheless, x402 remains in nascent stages. Information from x402scan indicates the framework has handled merely $1.1 million in total volume throughout the previous 30 days.
The deployment of AI agents for cryptocurrency transactions has attracted scrutiny. Recent research from Google alongside multiple academic institutions cautioned that AI agents should be regarded as potentially untrusted system elements. Researchers emphasized that agents must maintain clear boundaries between instructions and untrusted information to prevent attackers from embedding malicious commands.
Just days ago, developer infrastructure provider Socket identified malware specifically designed to target cryptocurrency developers. This malicious software embedded concealed instructions intended to compromise AI-powered coding tools.
While Base has not addressed these particular security discoveries directly, the organization confirmed that every Base MCP transaction undergoes its established user verification protocol before any asset movement occurs.

David Hoffman, the Ethereum advocate and Bankless co-founder, disclosed last week that he sold the remaining Ether in his personal holdings. In his own words on X, Hoffman argued that the widely discussed “ETH is Money” thesis has largely run its course, and he doesn’t expect the asset to be re-rated meaningfully higher or lower by the market from here. The sale occurred on May 21, and Hoffman did not disclose the value of the tranche.
Hoffman has long been one of Ethereum’s most vocal supporters, arguing that Ethereum has earned its place in the crypto ecosystem and deserves the market capitalization it currently holds. Yet he cautioned that the window for a dramatic revaluation—either up or down—appears to be narrowing. “ETH is, to some degree, money. But not the maximally successful version that we collectively sought out to achieve,” Hoffman wrote in the post, signaling a nuanced shift in his investment stance while maintaining a bullish outlook on Ethereum’s technology and ecosystem.
“ETH is, to some degree, money. But not the maximally successful version that we collectively sought out to achieve.”
The “ETH is Money” narrative holds that Ethereum, as a decentralized blockchain with monetary properties and a built-in mechanism to resist inflation, could function as a superior store of value relative to fiat. Proponents hoped ETH would eventually command a much higher valuation, especially as the network expanded through Layer 2 solutions and tokenization use cases. In practice, however, the asset’s price history has been more ambiguous than the thesis’s sterner forecasts might have suggested.
All-time price records put Ethereum near $5,000 in August of a previous cycle, with the asset trading around the $2,000 region in recent times. This trajectory—an ascent to new highs followed by a protracted, multi-year rangebound phase—has been a source of debate among investors and builders about ETH’s role as a store of value, a currency for on-chain activity, or a utility token whose value is closely tied to network demand and use cases rather than speculative macro bets.
In his public note, Hoffman described Ethereum as “a giver, not a taker,” emphasizing that the network provides secure blockspace and supports tokenization at cost, while most fees accrue to Layer 2 networks that sit atop Ethereum. “Ethereum takes no markup for anything it does. This is the nature of open source software, and this is the power of Ethereum. Ethereum supplies its full set of incredibly important values to the world… at cost,” Hoffman stated.
Even as he pivots out of a large ETH position, Hoffman remains “massively bullish” on Ethereum’s long-term trajectory, predicting that the network will “do exceptionally well from here on out.” He contends that only a marginal portion of that success will be reflected in the token’s price, underscoring a broader dissonance between network fundamentals and market pricing in the current cycle.
The reaction among Ethereum enthusiasts and observers was mixed. Bankless co-founder Ryan Sean Adams described Hoffman’s move as the “end of an era,” highlighting the emotional and strategic shift for a community that has long treated ETH as a core political and financial asset. Former Ethereum core developer Eric Connor offered a pragmatic take, suggesting Hoffman’s sale isn’t a wholesale indictment of ETH but rather a reflection of its performance relative to broader crypto markets over recent years.
Connor argued that ETH’s lag is less about the protocol’s fundamentals and more about macro dynamics and distribution effects: a large portion of price pressure has come from the rapid creation of new wealth early in Ethereum’s bull run. “Maximalism to a single coin when it comes to portfolio management is pretty silly,” he added, hinting at a broader conversation about diversification within crypto portfolios.
Key takeaways
- Prominent Ethereum advocate David Hoffman disclosed the sale of the remaining ETH in his personal holdings, signaling a strategic repositioning rather than a wholesale rejection of Ethereum’s long-term value.
- Hoffman retains a bullish view on Ethereum’s fundamentals and network development, but says the opportunity for a significant market rerating of ETH appears to have diminished.
- The “ETH is Money” thesis remains contested: ETH’s price peaked near $5,000 in 2021, has since retreated, and currently trades in a multi-year range around $2,000, raising questions about ETH’s ability to function as a monetary store of value.
- Hoffman emphasizes Ethereum’s model of “no markup” and cost-based tokenization, with Layer 2 ecosystems absorbing most on-chain fees, a dynamic shaping perceptions of ETH’s value accrual vs. the fee capture on L2s.
- Community voices welcomed the act as a real-time reminder of portfolio diversification, with some noting that a single-asset thesis may not align with evolved market dynamics or individual risk tolerance.
Contextualizing the move amid ETH’s price narrative
Ethereum’s price journey has framed many debates about the asset’s role in crypto markets. After reaching an all-time high just below $5,000, ETH’s price retraced substantially from that peak. A prolonged period of consolidation, coupled with a burst of activity on Layer 2 networks and increasing interest in tokenization primitives, has kept ETH at the center of a wide range-bound price narrative for years. While some investors had banked on a renewed cycle of appreciation driven by macro funds and institutional demand, others argued that ETH’s on-chain activity, security guarantees, and robust development roadmap would eventually translate into outsized price gains.
Hoffman’s public liquidation and his framing of the “ETH is Money” thesis as largely realized add another data point to the ongoing discussion about what truly drives ETH value. If the market’s re-rating opportunity is indeed limited, observers will look more closely at fundamental drivers—such as Layer 2 throughput, adoption of decentralized finance and tokenized assets, and the ongoing development of Ethereum’s upgrade path—to assess whether ETH can sustain price resilience while continuing to fulfill a broad set of on-chain use cases.
Market outlook: what investors should monitor next
With Hoffman’s move, investors may watch for how ETH’s price responds to a shifting narrative about store of value versus utility. The open-source, at-cost model that Hoffman highlighted could become a focal point for discussions around value accrual in decentralized ecosystems, particularly as Layer 2 networks mature and tokenization use cases expand. As always in crypto, price behavior will reflect a blend of macro liquidity, on-chain activity, and evolving risk appetite among institutions and retail participants.
Looking ahead, readers should keep an eye on several developments: the pace of Layer 2 adoption and fee dynamics, any shifts in institutional interest in Ethereum-based products, and regulatory signals that could influence on-chain activity and tokenization initiatives. If Ethereum can demonstrate sustained growth in throughput and real-world application, it may still realize long-run value that aligns with the network’s vast developer base and user base—even if the market’s immediate re-rating potential feels constrained in the near term.
For now, Hoffman’s stance illustrates a broader theme in crypto markets: conviction can coexist with strategic adjustment. As the ecosystem evolves, investors will be watching not only price action but the health and direction of Ethereum’s driving use cases and the resilience of its decentralized governance and development model.
XRP Price Chart Shows Incoming Violent Rebound: Next Leg Could Be Fast and Monstrous

Zayn Malik Responds To Claims He Was Rude To Fans
Watch: World champion D Gukesh fails to open water bottle at Norway Chess, puts it back after epic struggle | Chess News


-

 Crypto World6 days ago
Blockchain.com files with SEC for U.S. IPO
-

 Fashion5 days ago
Holiday Weekend Open Thread – Corporette.com
-
 Crypto World5 days ago
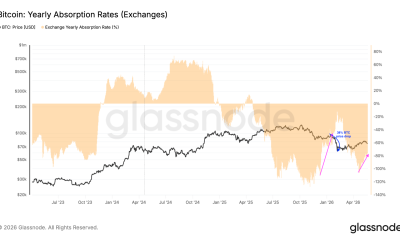
Bitcoin Accumulation Weakens as BTC Realized Losses Hit $600M
-

 Business5 days ago
Dell Technologies DELL Stock Surges 15% on AI Server Momentum and Analyst Upgrades in 2026
-

 Crypto World4 days ago
Robinhood crypto COO Tanya Denisova exits
-

 Politics5 days ago
Makerfield: a tale of two social-media histories
-
 Crypto World5 days ago
Space X IPO Is ‘Bad News’ for Tech Stocks: But What About Bitcoin?
-

 Tech2 days ago
Microsoft’s quiet Claude Code retreat and the real cost of enterprise AI
-

 Business3 days ago
NYT Strands Answers May 24 2026 Revealed for Puzzle No. 812 Theme Summer Essentials
-
 Crypto World5 days ago
MicroStrategy’s Saylor Says Miners No Longer Set Bitcoin Price, Another Force Has Taken Over
-

 Tech5 days ago
WhatsApp ads could make Irish debut after discussions with DPC
-

 Crypto World5 days ago
AI infrastructure race heats up as IREN pitches full-stack strategy, WhiteFiber lands $160M deal
-
 Tech5 days ago
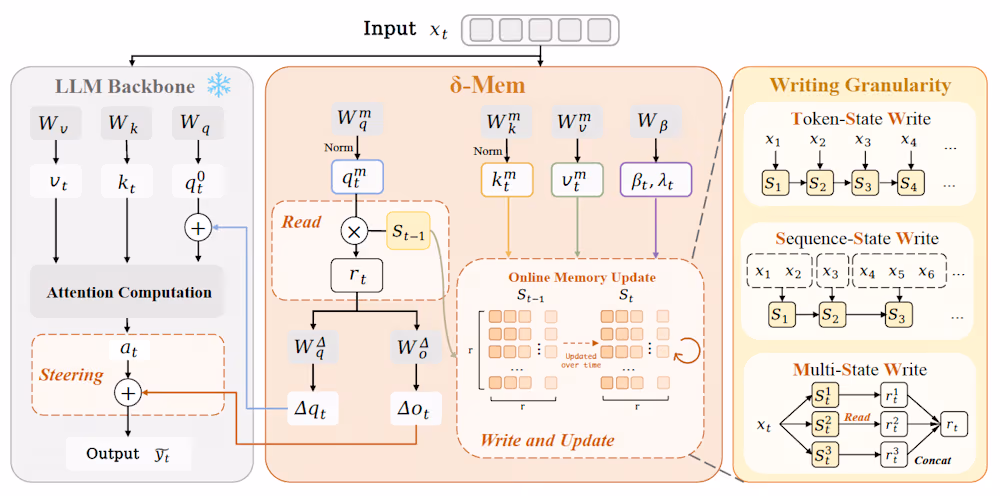
A 0.12% parameter add-on gives AI agents the working memory RAG can’t
-
 Crypto World2 days ago
Nvidia (NVDA) CEO Calls on Super Micro to Strengthen Export Controls Amid Smuggling Probe
-

 Tech5 days ago
You Can Now Add ChatGPT To PowerPoint
-
 NewsBeat6 days ago
Charity run by Reform leader Malcolm Offord accused of ‘law breaking’ over Scottish registration
-

 Tech2 days ago
Westone Audio and Etymotic Acquired by Fidelity Collective in Major IEM Market Move
-

 Business5 days ago
Trump Invests $1M-$5M in Kura Sushi USA Chain With 27 California Locations
-

 Sports5 days ago
2026 CJ Cup Byron Nelson leaderboard: Brooks Koepka finds putting stroke in Round 1
-

 Crypto World7 days ago
Exa Labs raises $250 million in funding led by a16z
You must be logged in to post a comment Login