

Crypto World
Bitcoin Whale Accumulation Expands as Exchange Balances Continue to Decline

TLDR:
- Whales match 2025 BTC buying in five months, showing accelerated absorption across 2026 cycle behavior trends
- Accumulation began near 2023 lows and extends through elevated BTC price zones without major distribution phases emerging
- Exchange reserves continue falling as ETF demand and custody flows reduce available Bitcoin liquidity across markets
- Order book depth weakens on both sides, increasing the sensitivity of the BTC price to marginal demand and supply shifts
Bitcoin whale accumulation is intensifying across on-chain markets as large holders continue absorbing available Bitcoin supply into 2026.
The trend reflects sustained structural demand from deep-pocket participants even as BTC trades within elevated but uncertain liquidity conditions.
Whale Flow Expansion and Multi-Cycle Positioning
Large holder behavior in Bitcoin has shifted sharply in 2026, with on-chain data showing a rapid increase in BTC absorption across major wallet clusters.
The pace of buying now mirrors full-year 2025 activity within only five months, signaling accelerated positioning.
This phase did not begin with recent price strength but traces back to accumulation zones formed near the 2023 cycle bottom.
Since then, inflows have remained consistent across both bullish and corrective environments, showing limited evidence of sustained distribution from high-balance wallets.
Wallet segmentation data shows participation expanding beyond traditional whale cohorts into medium-term dormant addresses.
This layered participation suggests coordinated exposure building rather than short-term trading rotations typically seen in retail-driven cycles.
Even during periods of elevated valuation, large holders have maintained exposure instead of reducing positions. This divergence from previous cycle behavior reflects a structural shift in how long-duration capital engages with Bitcoin markets.
The persistence of this flow pattern indicates that large entities are operating under extended horizon frameworks tied to macro liquidity expansion, ETF participation, and declining exchange float.
Liquidity Compression and Structural Market Tightening
Market structure data shows a continued decline in exchange-held Bitcoin reserves, pointing to ongoing migration toward custody and long-term storage.
This reduces available supply in active trading environments and strengthens the impact of marginal demand shifts.
Order book depth across major venues shows thinning liquidity on both bid and ask sides. In such conditions, price responsiveness increases, as fewer resting orders are required to move the market significantly.
ETF inflows and institutional participation continue absorbing circulating Bitcoin, reinforcing supply-side compression across multiple market layers. Sovereign-linked and corporate treasury demand further reduces freely tradable inventory.
At the same time, long-term holders show minimal distribution activity even during higher price ranges. This lack of sell-side expansion adds pressure to an already-tightening float structure across exchanges.
Within this environment, large-scale BTC absorption acts as a structural driver of liquidity reduction. As supply concentrates into fewer hands, market sensitivity increases, setting conditions where future price movement may respond sharply to demand shocks.


Crypto World
The Most Popular Cryptocurrency: BlockDAG Locks In a 21x Return on a 5,500 TPS Chain as ETH Pauses and BNB Sinks

The crypto market is keeping traders on their toes. The Ethereum price clawed back from recent lows, but heavy selling pressure on Binance suggests the road up may not be smooth. The Binance coin price slipped after a hawkish Fed meeting shook risk assets across the board.
Both moves leave buyers searching for cleaner setups. That’s where BlockDAG (BDAG) takes the floor. Its Ultimate Sale offers BDAG at just $0.000024 with a stated sell price of $0.0005, a locked 21x return paid in USDT on October 1st. Backed by a fresh 5,500 TPS blockchain upgrade, BDAG is pushing hard as the most popular cryptocurrency story of the moment.
Ethereum Price Climbs Back, But Sellers Refuse to Step Aside
The Ethereum price has pushed up from its recent low and is trading near $1740, but the bounce comes with some warning signs. Data from CryptoQuant Korea shows Binance’s CVD reading sitting at around negative 8,400 ETH. In simple terms, sellers have been more active than buyers for a while now. Since this reading and the Ethereum price have moved together closely over the past 30 days, the trend is worth watching.

Chart experts are also eyeing key resistance zones between $1,550 and $2,300, using common tools like Fibonacci and Elliott Wave to map the next move. On a brighter note, a new idea could add quantum-safe security to ETH wallets for just 7 cents each, with no hard fork needed. ETH still ranks as one of the most popular cryptocurrency picks, but the short-term path is unclear.
Binance Coin Price Slips as Fed Move Shakes the Market
The Binance coin price dropped to around $591.21 in the last 24 hours, sliding harder than the broader market. The main reason isn’t BNB itself, it’s the Federal Reserve. New Chair Kevin Warsh just held his first meeting on June 17, and instead of softening up on rates, he pushed for price stability and hinted at possible rate hikes later in 2026. That spooked traders, sent Bitcoin tumbling over $2,000, and dragged most altcoins down with it.
Long liquidations made things worse. As BNB broke below its daily pivot of $602.87, leveraged long positions worth $162K and $132K got wiped out, adding more sell pressure. The Binance coin price is now testing the $597.97 Fibonacci support. A daily close below that level could open the road toward $550. For now, BNB stays one of the most popular cryptocurrency names, but short-term traders are watching that support zone closely.
BlockDAG’s Ultimate Sale Locks In a Clean 21x Return
While ETH and BNB struggle with market pressure, BlockDAG is moving in its own lane. The Ultimate Sale keeps things simple: buy BDAG at $0.000024 and sell at $0.0005. That gap means a locked 21x return, and that’s why BDAG keeps showing up as the most popular cryptocurrency talk among buyers right now. A $1,000 buy turns into about $20,833 once the sell price kicks in. No tricky rules, conversions, or hidden steps, just direct coins at a price that won’t stick around for long.
The payout is just as straightforward. On October 1, 2026, every Ultimate Sale buyer gets their balance shown in USD and paid out directly in USDT. To make things even clearer, a fresh demo video sits inside the dashboard, walking buyers through exactly how the distribution works before the date arrives. There’s no guessing game here; the path from purchase to payout is mapped out from start to finish.
Behind the offer sits real tech muscle. The BlockDAG blockchain has been upgraded to 5,500 TPS, pushing the network to a level few chains can match. That kind of speed and transaction capacity isn’t just a flashy number; it builds the foundation for serious apps, smooth user activity, and steady ecosystem growth.

A fast chain backing a simple 21x offer is the kind of combo that pulls eyes in. With the Sale window narrowing by the day, BDAG keeps climbing as the most popular cryptocurrency move buyers are chasing right now.
Conclusion
The Ethereum price and Binance coin price both hold value, but neither offers the kind of clean profit setup that the most popular cryptocurrency hunters are after right now. ETH is stuck under heavy selling, and BNB is bleeding under Fed pressure with no fresh spark to lean on.
BlockDAG cuts through all of it with a locked 21x return buy at $0.000024, sell at $0.0005, paid in USDT on October 1, 2026. A $1,000 buy turns into roughly $20,833 with no tricky rules in the way. Backed by a 5,500 TPS blockchain, the upside is hard to ignore. Buyers are rushing in before the Ultimate Sale window snaps shut for good.

Legacy Sale: https://purchase.blockdag.network
Website: https://blockdag.network
Telegram: https://t.me/blockDAGnetworkOfficial
Discord: https://discord.gg/Q7BxghMVyu
Disclaimer: This is a Press Release provided by a third party who is responsible for the content. Please conduct your own research before taking any action based on the content.
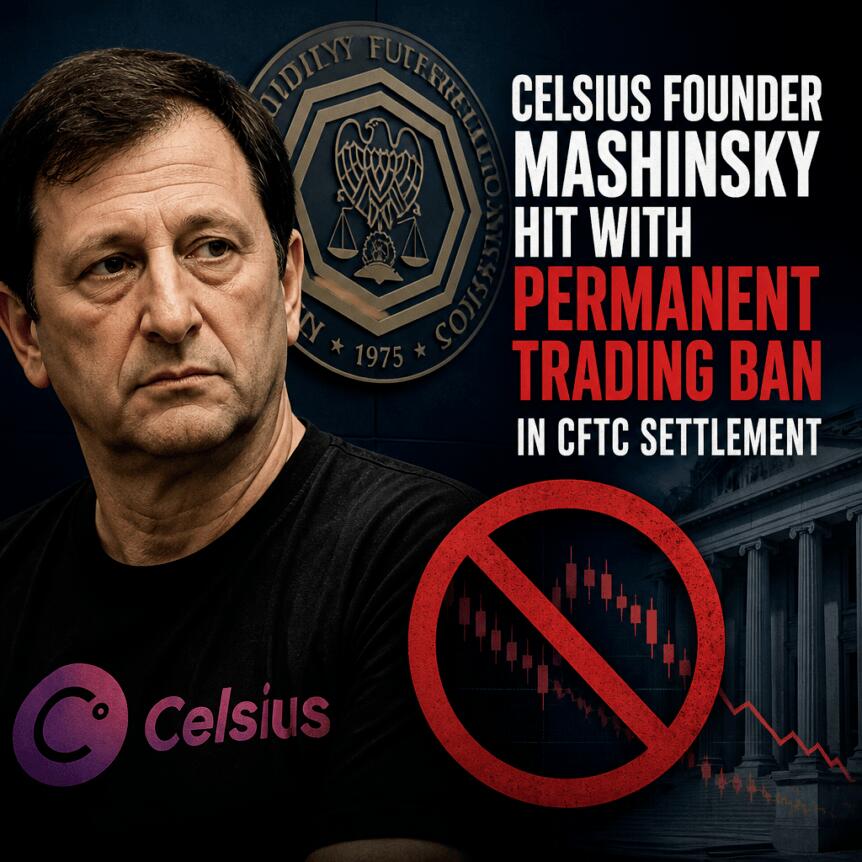
The US Commodity Futures Trading Commission (CFTC) has brought its case against Alex Mashinsky to a close, issuing an order that permanently bars the Celsius Network founder from trading in markets the agency oversees. The decision also prevents him from ever registering with the CFTC and ends the enforcement action the CFTC initiated in 2023.
In a statement issued Thursday, the CFTC said the resolution was formalized through a court consent order. The regulator stated that Mashinsky and Celsius “engaged in a scheme to defraud hundreds of thousands of customers” by allegedly misrepresenting the safety, profitability, and regulatory compliance of Celsius’ digital asset-based finance platform. The order means Mashinsky will be unable to participate in US commodities, futures, and derivatives trading subject to CFTC jurisdiction.
Key takeaways
- The CFTC permanently bars Alex Mashinsky from trading US commodities, futures, and derivatives regulated by the agency.
- The settlement also prohibits him from ever registering with the CFTC, effectively closing off a key regulatory pathway.
- The order ends the CFTC enforcement action launched in 2023 and resolves one of the last CFTC matters still pending against him.
- Mashinsky remains in ongoing legal proceedings, including a separate SEC case tied to Celsius token and business disclosures.
What the CFTC order changes for Mashinsky
The CFTC’s consent resolution is significant because it does more than stop a single activity. By permanently banning Mashinsky from trading in CFTC-regulated markets, the regulator removes his ability to engage in a wide range of derivatives and commodities-linked conduct that can intersect with crypto markets.
The agency also said the order bars him from registering with the CFTC in the future. While the practical meaning of registration requirements can vary by role, the prohibition signals the CFTC intends to permanently restrict Mashinsky’s involvement in regulated market activities tied to the commodities framework.
The CFTC’s Thursday announcement closes the book on an enforcement action that began in 2023. The regulator characterized the alleged misconduct as a broad scheme impacting a large customer base, rather than a narrow dispute about a particular instrument or disclosure.
Why the case matters for crypto regulation
This development lands at a time when the US regulatory line for crypto is increasingly shaped by distinctions between commodities and securities. Earlier in 2024, the CFTC and the US Securities and Exchange Commission (SEC) issued guidance stating they viewed most major cryptocurrencies as commodities, a position that has influenced how different parts of the crypto market are supervised.
Because Mashinsky’s ban applies to commodities-related trading, it reinforces how enforcement built on commodities jurisdiction can still lead to severe restrictions—even after other agencies’ actions. In Mashinsky’s situation, the CFTC is effectively adding another layer to a regulatory record that already limits him across multiple financial and crypto-related activities.
The CFTC also noted that the resolution marks the end of its first case against a digital asset lending platform. For market participants, that matters because lending firms have historically occupied a gray area between token trading, broker-like activities, custody-adjacent services, and interest-bearing products—areas regulators have targeted through different legal theories.
Sentencing and the alleged Celsius conduct
Separate from the CFTC settlement, Mashinsky was sentenced to 12 years in prison in May 2025 after pleading guilty to securities and commodities fraud. The plea involved allegations that he misled Celsius customers about the safety of the platform before it collapsed during the 2022 market downturn.
The CFTC’s complaint alleged that Celsius received roughly $20 billion in funds and made risky investments to meet the returns it promised. Although the CFTC’s Thursday statement focuses on the consent order’s terms, those allegations provide the backdrop for why the agency viewed the conduct as a customer-facing scheme tied to regulatory obligations and market risk.
For investors and users, Celsius remains a cautionary reference point in how yield products can be marketed and structured—and how the failure of underlying liquidity and risk controls can collide with regulatory scrutiny after a drawdown.
Other legal pressure still ongoing
The CFTC settlement does not end all of Mashinsky’s legal challenges. He is already subject to a permanent work ban connected to a Federal Trade Commission complaint filed earlier, which barred him from working with any product or service that can be used to “deposit, exchange, invest, or withdraw assets” after a settlement reported in April.
Meanwhile, the SEC’s case filed in July 2023 remains active. The SEC accused Mashinsky of making an unregistered securities offering, misrepresenting Celsius’ business and safety, and manipulating the price of Celsius (CEL) token. In late May, the SEC told a federal court that it had “engaged in substantive settlement discussions” with Mashinsky, but that no agreement had been reached. The court granted the regulators another 60 days to continue discussions.
Mashinsky has also challenged the criminal sentence. On May 26, he filed a motion seeking to vacate the 12-year term, alleging ineffective assistance of counsel, that evidence was tainted by authorities’ misconduct, and that Sam Bankman-Fried—described in the filing as the convicted fraudster and former FTX co-founder—was responsible for CEL token manipulation. A court ordered prosecutors to respond to the motion by mid-August.
Together, these proceedings show a complex enforcement footprint across multiple regulators and case tracks: CFTC sanctions closing commodities-related activity; SEC litigation over token and securities-related claims; and continued criminal review of the sentence.
As the SEC’s settlement discussions progress and the court schedules responses on Mashinsky’s bid to vacate his sentence, market participants should watch whether any resolution narrows the scope of pending claims, and what—if anything—changes in how regulators treat crypto-linked lending, customer-yield promotions, and token price conduct under different legal frameworks.

The Ethereum Foundation has lost another high-ranking contributor, amid increasing scrutiny of the research organization as the network faces ongoing questions about talent retention and governance philosophy.
In a post on X, co-executive director Hsiao-Wei Wang announced that she had stepped down from her role, effective immediately, following a recent sabbatical. Wang wrote that “Ethereum has always been bigger than any role” and indicated that she has not yet decided what she will do next.
Ethereum co-founder Vitalik Buterin commented on Wang’s an X post, acknowledging that she had taken on “the most challenging position in the Ethereum Foundation” alongside Tomasz Stanczak, who also stepped down from his leadership role earlier this year.

Source: Vitalik Buterin
The Ethereum Foundation has logged an estimated 19 layoffs and departures this year, although the loss of senior executives and core contributors has drawn the most attention. The wave of departures comes as the foundation grapples with intensifying competition, ongoing debate over Ethereum’s governance and long-term development strategy, and continued pressure on Ether’s market performance.
Buterin has also pushed back against criticism, particularly claims that the foundation should play a more active role in promoting the network. In May, he said that the foundation “is not the ‘center of Ethereum,’ rather […] ‘one node, with a defined purpose, alongside other nodes.’”
Related: Blockchain researcher defends Ethereum Foundation, says it’s doing ‘exactly’ its job
Decentralization remains Ethereum Foundation’s core mandate
In March, the Ethereum Foundation reaffirmed its role as a steward of the Ethereum ecosystem, unveiling a revised mandate that places even greater emphasis on decentralization.
“Our ultimate goal is for Ethereum to pass the walkaway test: its protocol and core application layers become robust and trustless enough that they would continue to reliably function and evolve even if the Foundation and today’s core developers disappeared tomorrow,” the foundation said.
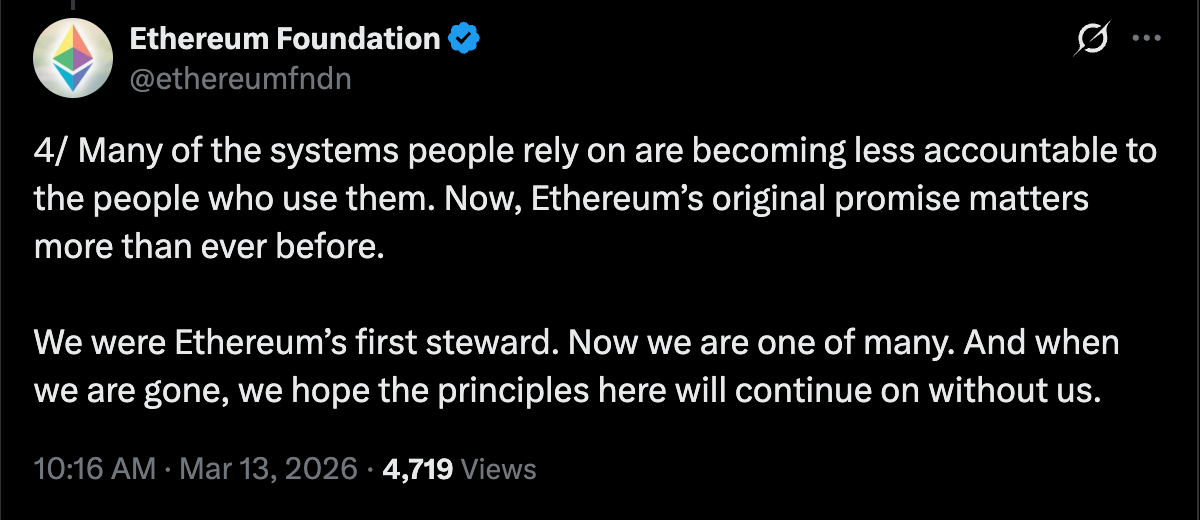
Source: Ethereum Foundation
That philosophy has also shaped Buterin’s evolving stance on Ethereum layer-2 networks — the independent blockchains built on top of Ethereum to improve scalability and reduce transaction costs.
Buterin recently stated that the original vision for layer-2s “no longer makes sense,” contending that many have failed to achieve meaningful decentralization and that improvements to the Ethereum mainnet make it a more suitable long-term scaling solution.
Magazine: Ethereum’s roadmap to 10,000 TPS using ZK tech: Dummies’ guide
TLDR
- BlackRock now ranks as the world’s third-largest Bitcoin holder, according to Arkham data.
- The asset manager reportedly holds about 764,000 BTC.
- Only Satoshi Nakamoto and Coinbase hold more Bitcoin than BlackRock.
- BlackRock moved ahead of Binance, which holds around 670,000 BTC.
- Strategy reports total Bitcoin holdings of 847,000 BTC.
BlackRock now ranks as the third-largest Bitcoin holder globally, according to data released by Arkham. The asset manager holds about 764,000 BTC, placing it behind only Satoshi Nakamoto and Coinbase. The ranking has sparked discussion because Strategy reports total Bitcoin holdings of 847,000 BTC.
BlackRock Moves Ahead of Binance in Bitcoin Rankings
Arkham’s latest data places BlackRock among the largest Bitcoin-holding entities worldwide. The report estimates that BlackRock controls around 764,000 BTC through its Bitcoin-related products and holdings. Meanwhile, Satoshi Nakamoto remains the largest holder with 1,096,000 BTC, while Coinbase holds about 970,000 BTC.
The ranking also places BlackRock ahead of Binance. According to Arkham’s figures, Binance accounts for roughly 670,000 BTC. As a result, BlackRock moved above the exchange in the latest list of major Bitcoin holders.
Discussion emerged after the report circulated across the crypto sector. Some market participants questioned BlackRock’s position because Strategy reports larger overall Bitcoin reserves. However, Arkham’s methodology focused on Bitcoin directly attributed to each entity profile.
Why BlackRock Ranked Above Strategy
Strategy remains the largest publicly traded corporate Bitcoin holder. The company reports total Bitcoin holdings of 847,000 BTC. On the surface, that figure exceeds BlackRock’s reported 764,000 BTC position.
However, Arkham explained why its ranking placed BlackRock ahead. The report stated that part of Strategy’s Bitcoin remains under custodial arrangements. Therefore, not all holdings appear directly under Strategy’s entity profile.
Arkham reported that about 184,000 BTC from Strategy’s total holdings sit with Fidelity Custody. After accounting for those custodial holdings, approximately 663,000 BTC remain directly associated with Strategy’s profile. That figure falls below BlackRock’s reported 764,000 BTC.
The distinction became central to the ranking debate. Arkham based its list on Bitcoin linked directly to entity profiles rather than total reported ownership. Consequently, BlackRock secured the third position despite Strategy’s larger disclosed Bitcoin reserves.
Arkham Details the Bitcoin Holder Breakdown
The report outlined a clear hierarchy among the largest Bitcoin holders. Satoshi Nakamoto leads with 1,096,000 BTC, while Coinbase follows with 970,000 BTC. BlackRock ranks third with approximately 764,000 BTC under Arkham’s calculations.
Binance follows BlackRock with around 670,000 BTC. Strategy appears below BlackRock when custodial holdings receive separate treatment. The ranking reflects Arkham’s tracking approach rather than publicly reported corporate ownership figures.
Arkham stated that BlackRock’s holdings exceed those directly attributed to Strategy’s profile. The data also shows BlackRock maintaining a larger Bitcoin balance than Binance. Those figures currently place the asset manager as the world’s third-largest Bitcoin holder.

The US Commodity Futures Trading Commission has resolved its action against Celsius Network founder Alex Mashinsky, permanently banning him from trading in markets the commodities regulator oversees.
The CFTC said Thursday that a court consent order also bars Mashinsky from ever registering with the regulator and ends the enforcement action it first filed in 2023.
“Mashinsky and Celsius engaged in a scheme to defraud hundreds of thousands of customers by mispresenting the safety, profitability, and regulatory compliance of Celsius’ digital asset-based finance platform,” the regulator said.
The latest order means Mashinsky will never be able to trade US commodities, futures and derivatives. Earlier this year, the CFTC and the US Securities and Exchange Commission issued guidance saying they considered most major cryptocurrencies to be commodities.
Source: CFTC
The settlement also puts an end to the CFTC’s first case against a digital asset lending platform and marks the end of one of the last remaining regulatory actions pending against Mashinsky.
Mashinsky was sentenced to 12 years in prison in May 2025 after pleading guilty to securities and commodities fraud for misleading Celsius’ customers about the safety of the crypto lending platform, which collapsed during a major market drawdown in 2022.
The CFTC alleged that Celsius received about $20 billion in funds and made risky investments to meet the returns it promised.
Related: Onchain, in court: What happened in crypto legal news this week
Mashinsky has already been banned from ever working in crypto or finance after settling a Federal Trade Commission complaint in April that permanently barred him from working with any product or service that can be used to “deposit, exchange, invest, or withdraw assets.”
Mashinsky is still facing charges filed by the SEC in July 2023, accusing him of making an unregistered securities offering, misrepresenting Celsius’ business and safety and manipulating the price of its Celsius (CEL) token.
The SEC told a federal court in late May that it has “engaged in substantive settlement discussions” with Mashinsky, but no agreement had been reached, with the court granting the regulators’ request for another 60 days to continue discussions.
Mashinsky filed on May 26 to vacate his 12-year criminal sentence, claiming his lawyers were ineffective, that evidence was tainted by authorities’ misconduct and that FTX co-founder and convicted fraudster Sam Bankman-Fried was to blame for the manipulation of the CEL token.
A court on Saturday ordered prosecutors to respond to Mashinsky’s request by mid-August.
Magazine: Big Questions: Do we really only need 2–5 cryptocurrencies?

A major bank projects XRP ETFs could draw $4 billion to $8 billion in their first year if the CLARITY Act passes, three to six times what they have managed so far. The number rests on a specific argument about who is buying XRP, who is not, and a wall of supply at $1.45.
Summary
- Standard Chartered’s $8 billion XRP ETF forecast depends on CLARITY unlocking institutional buyers.
- XRP’s $1.45 break-even wall is the mechanical ceiling that has capped rallies all year.
- Retail ETF demand has defended the price but has not been large enough to break the wall.
- The upside case depends on legislation passing and institutional inflows arriving quickly.
Standard Chartered, one of the largest banks in the world, has projected that XRP exchange-traded funds could attract $4 billion to $8 billion in inflows in their first year if the CLARITY Act passes. That is three to six times the roughly $1.44 billion that XRP ETFs have pulled in since their launch in November 2025.
It is a large number, large enough to sound like the usual analyst optimism that surrounds every crypto asset. But the projection is not a vibe.
It rests on a specific, mechanical argument about who has been buying XRP, who has been sitting on the sidelines, and a concrete wall of sell orders that has capped the price all year. Understanding that argument is the only way to judge whether $8 billion is realistic or fantasy.
The math matters because XRP has spent 2026 in a frustrating place: down roughly 40% on the year, trading around $1.13 to $1.18, stuck about 70% below its all-time high of $3.65, despite a steady drip of regulatory wins and ETF launches. The question every XRP holder is asking is why the asset will not move.
Standard Chartered’s projection contains the answer, because the same forces that explain the stuck price explain the potential for an $8 billion unlock. This piece works through the math: the break-even wall at $1.45, why retail ETF demand can defend the price but not break it, who the buyers waiting on CLARITY actually are, and where XRP could trade by the fourth quarter under different outcomes.
The wall at $1.45
The single most important number in the XRP story is not the price; it is the wall of supply sitting just above it, and the wall is specific enough to quantify.
Roughly 1.16 billion XRP sit as a wall of sell orders clustered around the $1.45 zone. This is the break-even level for a large cohort of buyers from the last cycle, people who bought XRP near $1.45, watched it fall, and want to sell to get out flat the moment the price returns to where they bought.
Every time XRP rallies toward $1.45, it runs into this accumulated supply. Holders who have waited through the drawdown are eager to exit at break-even, selling into any strength and capping the advance.
This is why XRP keeps stalling at the same level, why rallies on regulatory news, the commodity classification in March, and the committee vote in May spiked toward $1.45 to $1.52 and then faded. The wall is real, it is large, and it is the mechanical reason the price has a ceiling.
A wall of break-even sellers is a specific kind of resistance, and it behaves predictably. It is not driven by sentiment or fear; it is driven by a cohort of holders with a fixed price target, the level at which they break even, who will keep selling until that supply is exhausted.
The only way through such a wall is demand large enough to absorb all 1.16 billion XRP of it and keep buying. Retail-sized flows nibble at the wall but cannot break it.
What breaks a wall this size is institutional money, large, sustained, and indifferent to the break-even level because it is buying for reasons that have nothing to do with last cycle’s entry price. Whether that institutional money shows up is the entire question, and it is where CLARITY comes in.
Why retail demand defends but cannot break
This is the dynamic that explains the stuck price, and it is the key to the whole projection. The buying that has happened so far has been the wrong size to break the wall, and the buying that could break it has been waiting.
XRP ETFs have already drawn about $1.44 billion since launching in November 2025, and that demand has done something real: it has defended the price, providing a floor of steady buying that has kept XRP from collapsing through the drawdown. But it has not broken the price higher, because it has been retail-sized, large enough to absorb ordinary selling and hold a floor, but not large enough to overwhelm the 1.16 billion XRP wall at $1.45 and clear it.
The result is a standoff: retail ETF demand on one side defending a floor, the break-even wall on the other side capping the ceiling, and XRP trapped in the range between them. That is exactly the sideways, frustrating action that has defined the year.
Recent flow data show the point clearly. XRP ETF inflows have been strong enough to beat larger assets in some weeks, but weekly strength is different from the kind of institutional wave needed to clear a billion-token sell wall.
The buyers who could break the wall are different in kind, not just degree. They are the large institutions, the pension funds and asset managers, the entities that move capital in the size required to absorb a billion-token wall and keep buying.
And they have been explicit about why they are on the sidelines: they treat XRP as a legal question mark, an asset whose regulatory status, while improved by the agency-level commodity classification, has not been settled into law. An executive-agency classification can be reversed by the next administration with a memo; a statute cannot.
That is why institutions wait for a statute. Institutions managing fiduciary money do not commit at scale to an asset whose legal status could be reversed by a future regulator, and so they wait for the certainty that only legislation provides.
The proof of this is in who has been buying and who has not. Retail-sized ETF demand has shown up and defended the price, while the institutional money large enough to break it has stayed out, waiting for the law.
That is the standoff CLARITY would resolve.
The math behind $8 billion
Now the projection itself, because the $8 billion figure is a direct consequence of the dynamic above, not an arbitrary target.
Standard Chartered’s argument runs like this. The roughly $1.44 billion XRP ETFs have drawn so far came almost entirely from retail and smaller investors, because the large institutions have stayed out pending legal certainty.
If CLARITY passes and codifies XRP’s commodity status into law, the legal question mark that has kept institutions out is removed. The pool of eligible buyers expands dramatically to include the pension funds, asset managers, and institutional allocators who could not commit before.
That expansion is what produces the $4 billion to $8 billion first-year projection: not a multiplication of the existing retail demand, but the addition of an entirely new and far larger class of buyer that the law would unlock. Three to six times the current inflows is what you get when you add institutional capital to a flow that until now has been almost purely retail.
The mechanical beauty of the argument is how the pieces fit. The institutional money that CLARITY would unlock is precisely the large, sustained, break-even-indifferent buying required to overwhelm the 1.16 billion XRP wall at $1.45.
So CLARITY does not just add demand; it adds exactly the kind of demand that can break the ceiling that has capped XRP all year. The $8 billion is not only a flow projection; it is the force that would clear the wall and let XRP re-rate higher.
The same institutional buyers who would drive the inflows are the ones large enough to absorb the break-even supply and keep going. The projection and the price-ceiling problem are two descriptions of the same event: institutions arriving in size once the law lets them.
That is also the utility side of the same CLARITY catalyst, because the same statute that could unlock ETF flows would also give institutions more confidence in XRP-linked settlement infrastructure.
What history warns
An honest account has to weigh the projection against the cautionary pattern in XRP’s own history, because the asset has a habit of disappointing on supposedly bullish catalysts.
The warning is that XRP catalysts have repeatedly arrived already priced in. When the SEC case against Ripple settled in August 2025, a major positive event, XRP had already peaked a month earlier, and long-term holders used the resolution as an exit, selling into the news rather than buying.
The pattern recurred through 2026. The March commodity classification spiked XRP from $1.44 to $1.54 within hours, then faded as the break-even wall capped it.
The May committee vote pushed it from $1.42 to $1.52, then faded the same way. The lesson is that XRP has a tendency to run up in anticipation of a catalyst and then sell off when it arrives, because the buyers who wanted to position have already done so and the break-even sellers are waiting.
A passage of CLARITY could, in principle, follow the same script: a run-up, then a sell-the-news fade if the institutional inflows do not materialize fast enough to overwhelm the supply.
This is why the projection needs to be held with both conviction and caution. The $8 billion argument is mechanically sound, the institutional money is real and waiting, and the math of adding it to a retail-only flow produces large numbers.
But the history says the inflows have to actually show up, in size and quickly, to break the pattern of catalysts arriving pre-priced. A projection of institutional demand is not the same as institutional demand in hand.
The honest position is that the $8 billion is realistic if the institutions arrive as the argument predicts. It is also the one scenario worth wanting confirmed by actual inflows before leaning on it.
The math is strong; the execution risk is that XRP does what it has done before and sells the news.
Where XRP trades by Q4
Pulling the analysis together, the projection implies a set of scenarios for where XRP could trade by the fourth quarter, anchored to the current price near $1.13 to $1.18 and the dynamics above.
In the failure scenario, CLARITY stalls, no Senate vote happens before the August recess, and the catalyst that has been holding up the price fades. Fear of a multi-year delay creeps in, the break-even sellers keep capping any bounce, and XRP drifts back toward its lows for the year.
The $0.80 to $1.00 zone comes back into play, with the door open to lower if the broad market stays weak. That is the downside if the vote stalls, because the market would lose the one catalyst big enough to change the flow picture.
In the base case, a compromise comes together and CLARITY clears around late July or early August. Legal certainty begins removing the discount that has weighed on XRP, the $1.45 break-even wall starts to give way on rising volume, and a re-rating into the $1.60 to $2.20 range becomes realistic by the fourth quarter.
This is the outcome where the law passes and the institutional money begins to arrive, clearing the wall in an orderly way.
The strongest case requires more than the vote. If CLARITY passes, ETF inflows reaccelerate toward Standard Chartered’s billions-scale projection, and the Federal Reserve begins easing into the autumn, the money waiting on the sidelines would finally overwhelm the break-even sellers.
In that scenario, XRP could retest the $2.50 to $3.50 area, still short of the old $3.65 high. That is the scenario the $8 billion projection points toward, and it is also the one most dependent on multiple things going right at once: passage, then inflows, then a supportive macro.
The range across scenarios is wide because the outcome is binary on the legislation. From around $1.13 today, a failed vote points back toward $0.80 to $1.00, passage near the recess supports $1.60 to $2.20, and passage plus renewed inflows plus a softer Fed opens up $2.50 to $3.50.
Where XRP ends the year traces back to one thing this summer: whether the law passes and the institutions it would unlock actually arrive. That is the core of the longer-horizon outlook, where the next move depends less on retail enthusiasm than on whether institutions receive permanent legal cover.
What it means for investors
For anyone weighing XRP, the Standard Chartered projection is most useful not as a price target but as a map of the mechanism, and the mechanism is what to watch.
The $8 billion figure is worth less as a number to anchor on than as a description of how XRP could break its range: institutional money, unlocked by legal certainty, arriving in the size needed to clear the break-even wall. An investor watching XRP should track the pieces of that mechanism.
Those pieces are the progress of CLARITY through the Senate, the pace of ETF inflows and whether they show signs of shifting from retail to institutional scale, and the behavior of the price at the $1.45 wall. Those are the signals that the projection is or is not playing out.
The discipline is to treat $8 billion as the upside case that depends on a specific chain of events, not as a promise. Given XRP’s history of selling the news, the inflows should be confirmed rather than assumed.
That also means remembering why an ETF is access, not automatic demand. XRP ETFs opened the door, but the price only breaks if buyers large enough to clear the wall actually walk through.
The realistic framing is that XRP is a binary bet on a piece of legislation, with a clear mechanical upside if the bet wins and a clear downside if it loses. The break-even wall, the waiting institutions, and the $8 billion projection are all real, and together they make a coherent case that passage could drive a significant re-rating.
But the same analysis shows the downside if CLARITY fails: a drift back toward the year’s lows as the catalyst fades. An investor should size any XRP position to that binary reality, understanding that the upside depends on a law passing and the institutions it unlocks actually arriving, and that the history warns against assuming the catalyst will not be sold.
None of this is investment advice; it is the math behind a projection that is only as good as the events it depends on.
The number and the mechanism
Standard Chartered’s $8 billion projection sounds like analyst hype until you trace the math, and the math is sound.
XRP ETFs have drawn $1.44 billion almost entirely from retail, the large institutions have stayed out because XRP is a legal question mark, and CLARITY would remove that question mark. That would unlock exactly the institutional buying, three to six times the current flow, that could clear the 1.16 billion XRP wall at $1.45 and let the price re-rate.
The number is not a vibe; it is the consequence of who has been buying, who has not, and what would change if the law passed.
What the math cannot guarantee is that the institutions arrive on schedule. XRP has a history of selling its catalysts, running up before the news and fading after it, and a projection of institutional demand is not the same as institutional demand in hand.
The honest synthesis is that the $8 billion is realistic if CLARITY passes and the institutional money shows up as the argument predicts. This is the one scenario worth confirming with actual inflows before leaning on it.
From around $1.13 today, the year ends somewhere between $0.80 and $3.50 depending almost entirely on the law and what it unlocks. The wall at $1.45 is the obstacle, institutional money is the only thing big enough to break it, and CLARITY is the key that decides whether that money is allowed to arrive.
That, and not any single price target, is the math that matters.
Frequently asked questions
What did Standard Chartered project for XRP ETFs?
Standard Chartered projected that XRP exchange-traded funds could attract $4 billion to $8 billion in inflows in their first year if the CLARITY Act passes, three to six times the roughly $1.44 billion they have drawn since launching in November 2025. The projection rests on the argument that CLARITY would remove the legal uncertainty keeping large institutions out, unlocking a new and far larger class of buyer.
What is the $1.45 break-even wall?
Roughly 1.16 billion XRP sit as sell orders clustered around $1.45, the break-even level for a large group of buyers from the last cycle who bought near that price, watched it fall, and want to exit flat when it returns. Every rally toward $1.45 runs into this supply, which caps the price. It is the mechanical reason XRP keeps stalling at the same level despite regulatory wins, and clearing it requires demand large enough to absorb all of it.
Why has XRP’s price stayed stuck despite ETF inflows?
The roughly $1.44 billion in ETF inflows so far has been retail-sized, enough to defend a price floor but not to overwhelm the 1.16 billion XRP break-even wall at $1.45. This creates a standoff: retail demand holds the floor while the break-even sellers cap the ceiling, trapping XRP in a range. The buyers large enough to break the wall, big institutions, have stayed on the sidelines because they treat XRP as a legal question mark pending legislation.
Why would the CLARITY Act unlock institutional buying?
Institutions managing fiduciary money avoid assets whose legal status could be reversed. XRP currently has a commodity classification from agencies, but that can be undone by a future administration, while a statute cannot. CLARITY would codify XRP’s commodity status into law, removing the reversible-classification risk and expanding the pool of eligible buyers to include pension funds and asset managers who could not commit before. That is the demand that produces the $4 billion to $8 billion projection.
Where could XRP trade by the end of 2026?
From around $1.13 today, the scenarios are wide because the outcome is binary on the legislation. If CLARITY fails or stalls before the August recess, XRP could drift back toward $0.80 to $1.00. If it passes near the recess, a re-rating to $1.60 to $2.20 becomes realistic. If passage is followed by reaccelerating ETF inflows and a softer Federal Reserve, XRP could retest $2.50 to $3.50, still short of its $3.65 all-time high.
Is the $8 billion projection reliable?
The math is sound, but it depends on execution. The argument correctly identifies that institutional money is waiting on legal certainty and that CLARITY would unlock it. The risk is XRP’s history of selling its catalysts: major positive events like the August 2025 SEC settlement arrived already priced in, with holders exiting into the news. The $8 billion is realistic if institutions arrive in size and quickly after passage, but a projection of demand is not demand in hand, and the inflows should be confirmed rather than assumed.
As of June 18, 2026. Cryptocurrency markets and legislation are subject to change; verify current details before relying on this analysis. This article is information, not investment advice.

Solana has fallen more than 6% from its June 15 high after a rejection at a major resistance zone, combined with a hawkish Federal Reserve outlook, pushed traders into risk-off positioning.
Summary
- Solana fell more than 6% after failing to reclaim the key $75–$76 resistance zone and amid Fed-driven risk-off sentiment.
- CoinGlass data shows major liquidation clusters between $74 and $76, while support is concentrated near $65–$66.
- A break below $70 could expose June lows around $62, with the $60 area emerging as the next major downside target.
According to data from crypto.news, Solana (SOL) dropped from a recent peak of $75.60 to an intraday low of $70.70 on June 18 before stabilizing near $71. The decline followed a sharp recovery from early June lows around $62, where SOL had rallied more than 20% alongside a broader rebound across the crypto market.
The selling accelerated after the Federal Reserve kept interest rates unchanged at 3.50%–3.75% while warning that inflation risks remain elevated. Policymakers also projected the possibility of additional tightening in 2026, prompting traders to reduce exposure to high-beta assets.
Bitcoin retreated toward $64,000 following the announcement, while several large-cap altcoins posted steeper losses.
Oil markets added another layer of uncertainty. Although reports of a preliminary U.S.-Iran agreement helped crude prices retreat from recent highs, traders continued to assess whether geopolitical tensions and inflation pressures could keep monetary policy restrictive for longer than previously expected.
Solana price faces resistance at former support as liquidation risks build
The daily chart shows SOL rejecting a major resistance area between $75 and $76, a zone that previously acted as structural support before June’s breakdown. After failing to reclaim that level, price slipped back below the 61.8% Fibonacci retracement near $74.80 and now trades just above the 78.6% retracement level around $68.40.
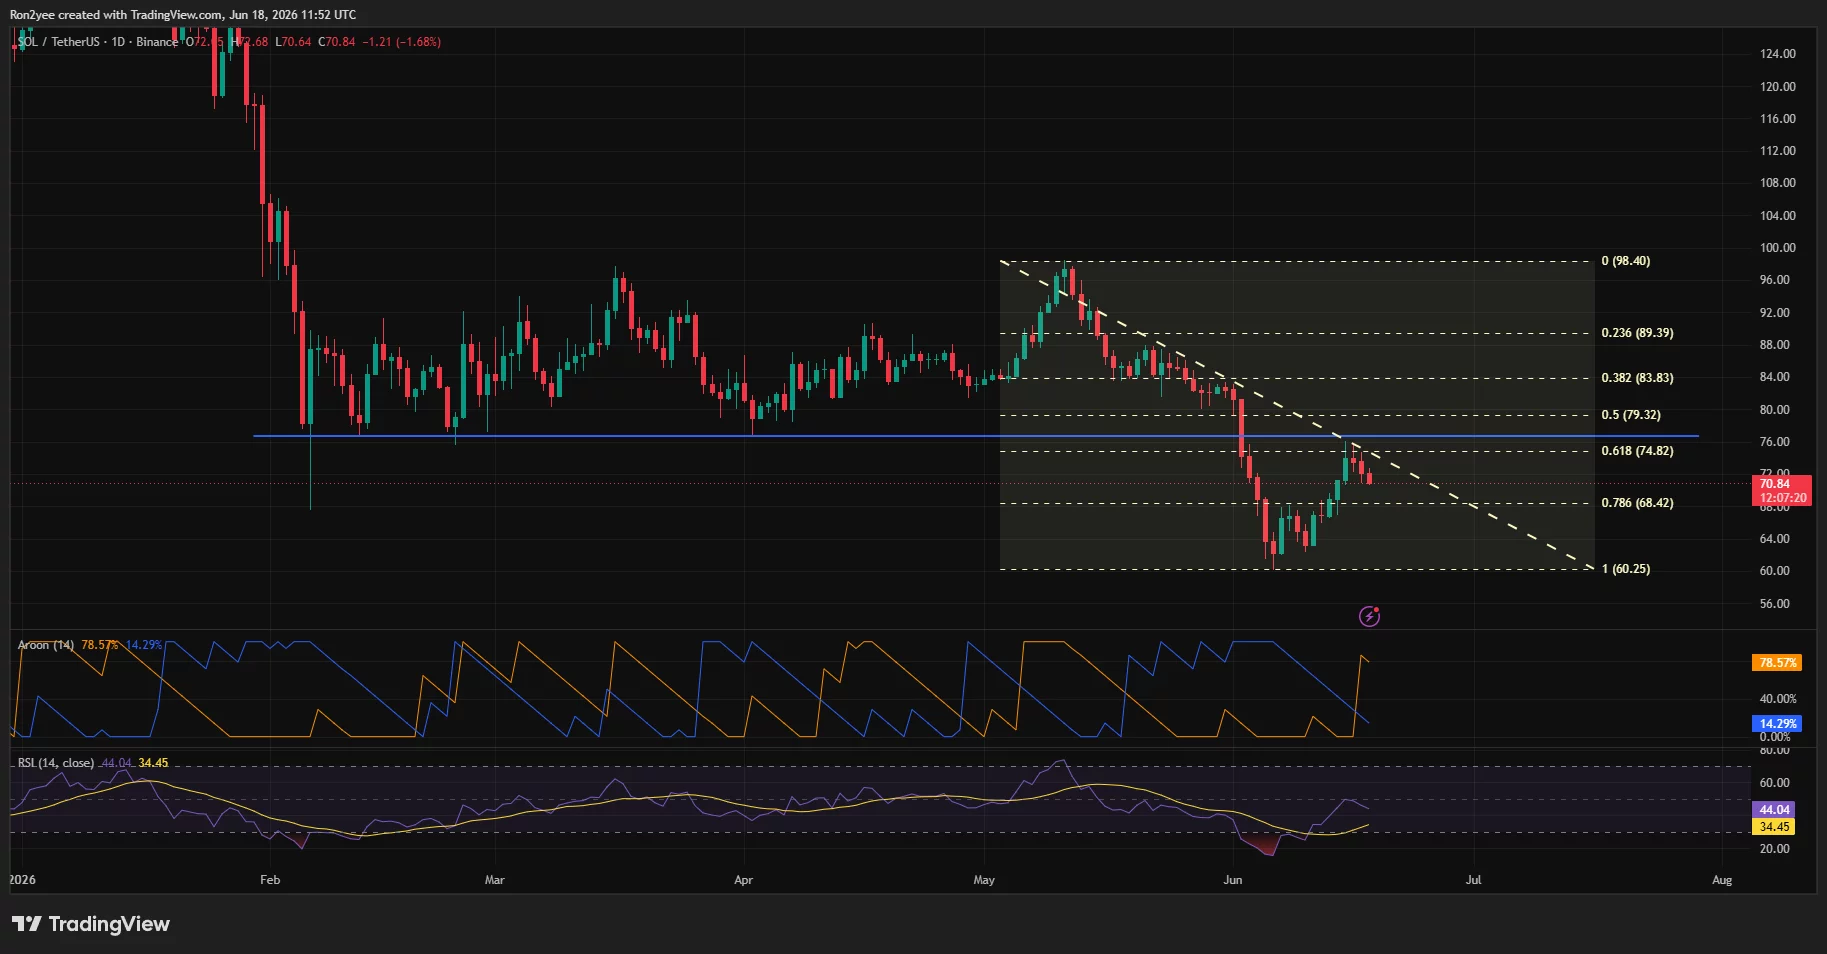
A descending trendline connecting the May and June highs remains intact, preserving the short-term bearish structure. A daily close above that trendline would expose resistance levels near $74.80 and $79.30, while a successful breakout could open the path toward the 50% retracement level near $79 and eventually the $84 area.
Momentum indicators remain mixed. The Relative Strength Index has recovered from oversold territory but remains below the neutral 50 mark, suggesting buyers have yet to regain full control. Meanwhile, the Aroon indicator continues to favor the bears, with the Aroon Down reading holding significantly above Aroon Up.
Commenting on the setup, market commentator BATMAN noted that SOL had been “rejected by its previous support level, now as resistance,” adding that the stochastic oscillator had reached the same overbought region that preceded the last major top. He argued that “there’s a big chance we’ll see further bearish continuation from here.”
Derivatives positioning presents another challenge. CoinGlass liquidation heatmap data shows a dense cluster of leveraged positions between $74 and $76, creating a significant liquidity pocket above current prices.
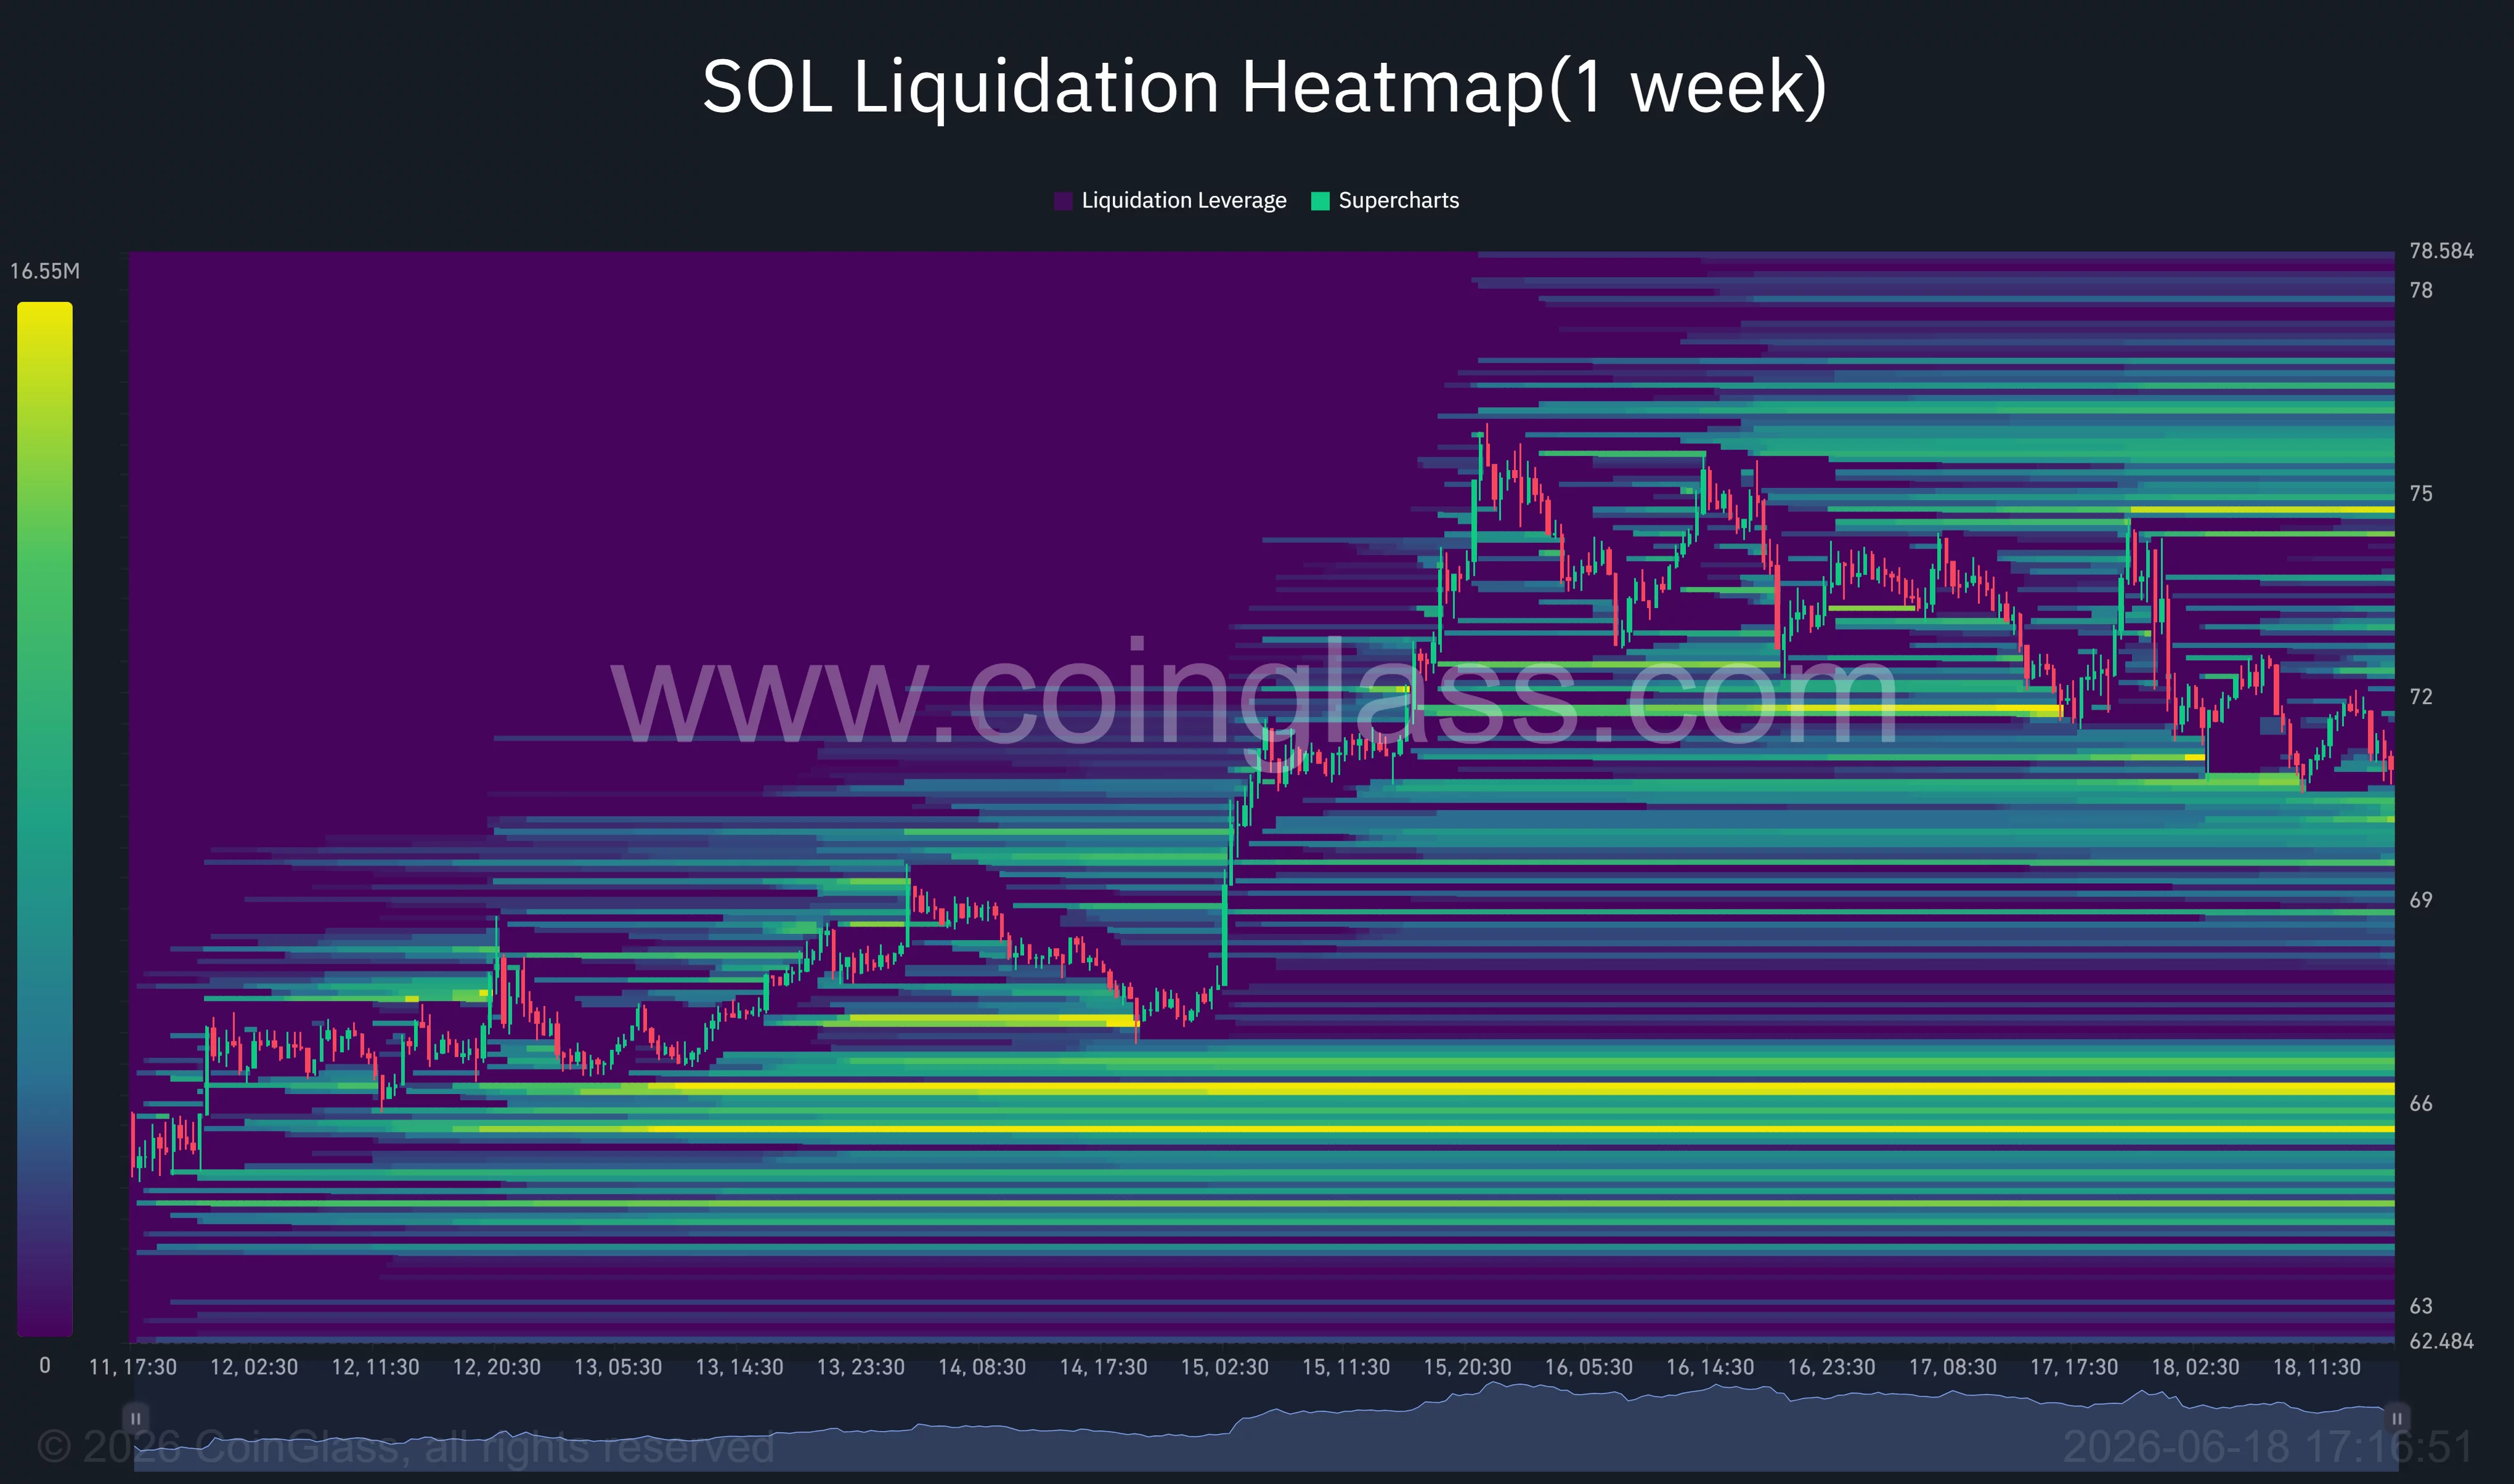
Additional liquidation interest sits near $66, while the largest concentration of liquidity remains around the $65 region. Such clusters often attract short-term price moves as market makers hunt leveraged positions.
A break below $70 could expose June lows
Beyond technical factors, Solana continues to face questions about network activity. DefiLlama data has shown weaker transaction fee generation and slower growth in total value locked compared with earlier stages of the cycle, reducing one of the key drivers behind SOL’s outperformance over the past year.
At the same time, institutional capital has increasingly gravitated toward traditional markets. Strong demand surrounding the SpaceX IPO and continued enthusiasm for artificial intelligence-linked equities have drawn liquidity away from speculative crypto assets. Digital asset investment products have also faced persistent outflows in recent weeks.
The immediate support level remains near $70. A decisive break below that threshold could bring the June low around $62 back into focus, with the Fibonacci extension projecting downside risk toward the $60 area.
On the upside, bulls must first reclaim the $74–$76 resistance band before a broader recovery thesis can regain credibility.
Disclosure: This article does not represent investment advice. The content and materials featured on this page are for educational purposes only.

South Korea’s KOSPI closed at a record 9,063.84 on June 18, crossing 9,000 for the first time in history. The index gained 2.25% on the day. Just two stocks were responsible for most of it.
Samsung Electronics and SK Hynix together account for more than 50% of the index by market value. Both hit all-time highs, and almost everything else fell.
The Catalyst Behind the Move
SK Hynix jumped again after confirming it had shipped samples of its seventh-generation high-bandwidth memory chip, HBM4E, to major AI customers. The announcement cemented its position as the leading supplier of the specialized DRAM that powers Nvidia GPU packages and large-scale AI workloads.

Samsung Electronics also spiked. Samsung Life Insurance and SK Square, both valued largely on their stakes in the two chipmakers, posted similar gains for the same reason. Outside that cluster, the session told a different story.
Of the 917 stocks traded on the Korea Exchange, 791 declined. Hyundai Motor fell 2.75%, Kia Corp dropped 4.51%, and battery maker LG Energy Solution lost 3.85%. The headline number masked a market where most participants lost ground.
Foreign Money Piled In
Foreign investors were net buyers of approximately 1.3 trillion won ($851 million) on the day. That buying pressure was a key force lifting the index, as foreign capital flowed into the names with the clearest AI earnings story.
Daishin Securities raised its 2026 KOSPI target from 8,800 to 11,500 following the close, with analyst Lee Kyung-min writing that the index’s upside should hold as long as forward earnings estimates for chipmakers continue rising. The firm called it a classic performance and policy market.
South Korea’s financial regulator issued a separate investor warning on single-stock leveraged products tied to Samsung and SK Hynix, a signal that retail leverage in Korean equities has grown sharply alongside the index. The KOSPI crossed 9,000 in 16 trading days after first clearing 8,000. How broadly the next thousand points are shared may matter more than when they arrive.
The post South Korea’s KOSPI Tops 9,000 but Samsung and SK Hynix Did the Work appeared first on BeInCrypto.
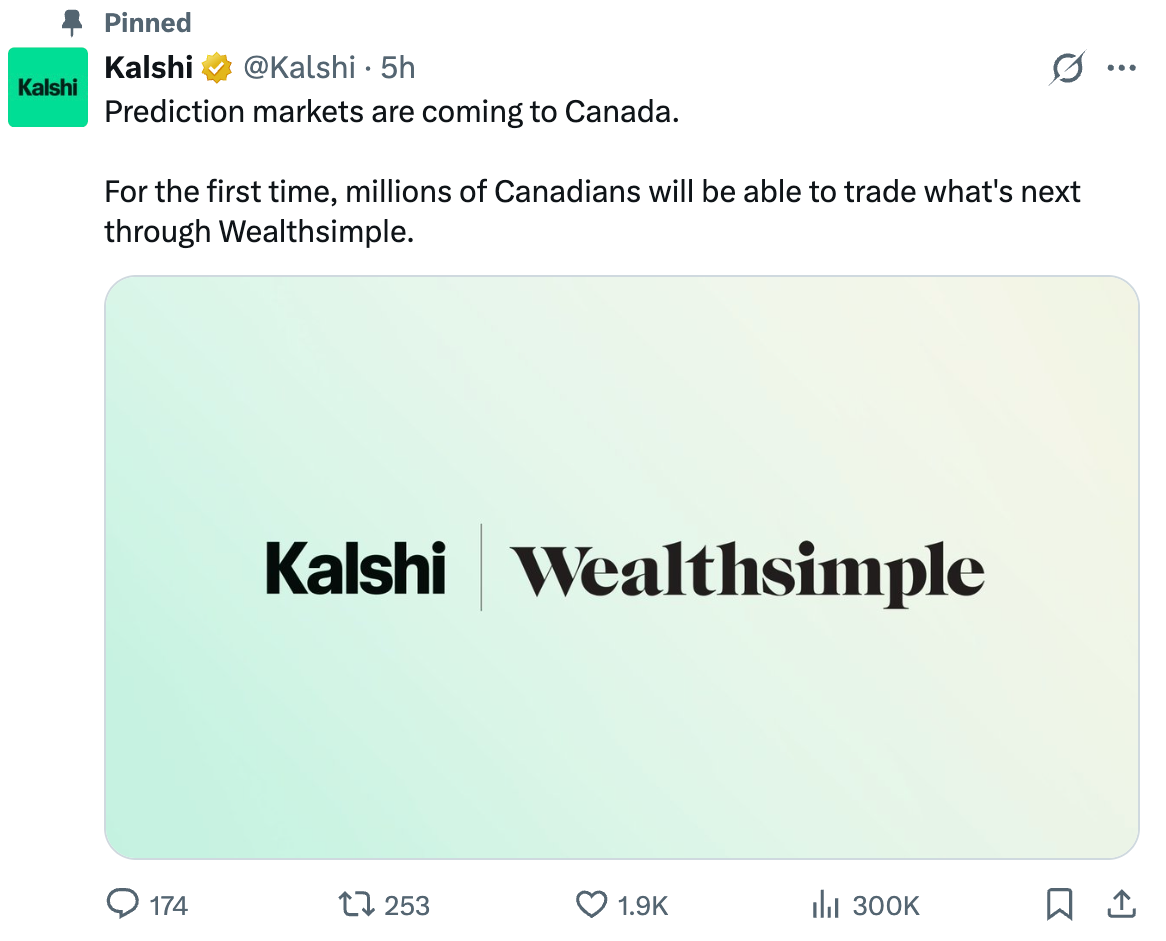
Canadian fintech Wealthsimple is launching a prediction markets app powered by Kalshi, giving that country’s retail investors access to thousands of event-based contracts following regulatory approval earlier this year.
The standalone app, called Wealthsimple Predict, is scheduled to launch this summer and will offer Canadian users access to about 4,000 event contracts listed on Kalshi across categories including financial markets, economic indicators and climate.
Source: Kalshi
The Canadian Investment Regulatory Organization (CIRO) in March authorized the firm to offer prediction market contracts tied to those categories. It is the second investment dealer authorized by CIRO to offer prediction market trading in Canada. The contracts will be regulated as derivatives and must have settlement periods of at least 30 days.
The Canadian rollout comes as Kalshi expands beyond prediction markets. On Thursday, the company said that its perpetual futures products were now live for trading, following a May 31 announcement that marked the company’s entry into the crypto perpetual futures market.
Source: Kalshi
Related: Kentucky sues Kalshi, Polymarket, joining prediction market legal battle
CME pushes back against CFTC’s crypto derivatives stance
Kalshi’s expansion beyond prediction markets is already facing pushback from established derivatives exchanges.
On Thursday, CME Group sued the US Commodity Futures Trading Commission (CFTC) over its approval of cryptocurrency perpetual futures contracts offered by Kalshi and similar products by Coinbase, arguing the regulator misclassified the products under federal law. The filing followed comments from CME CEO Terrence Duffy a day earlier that the exchange planned to challenge the approvals in court.
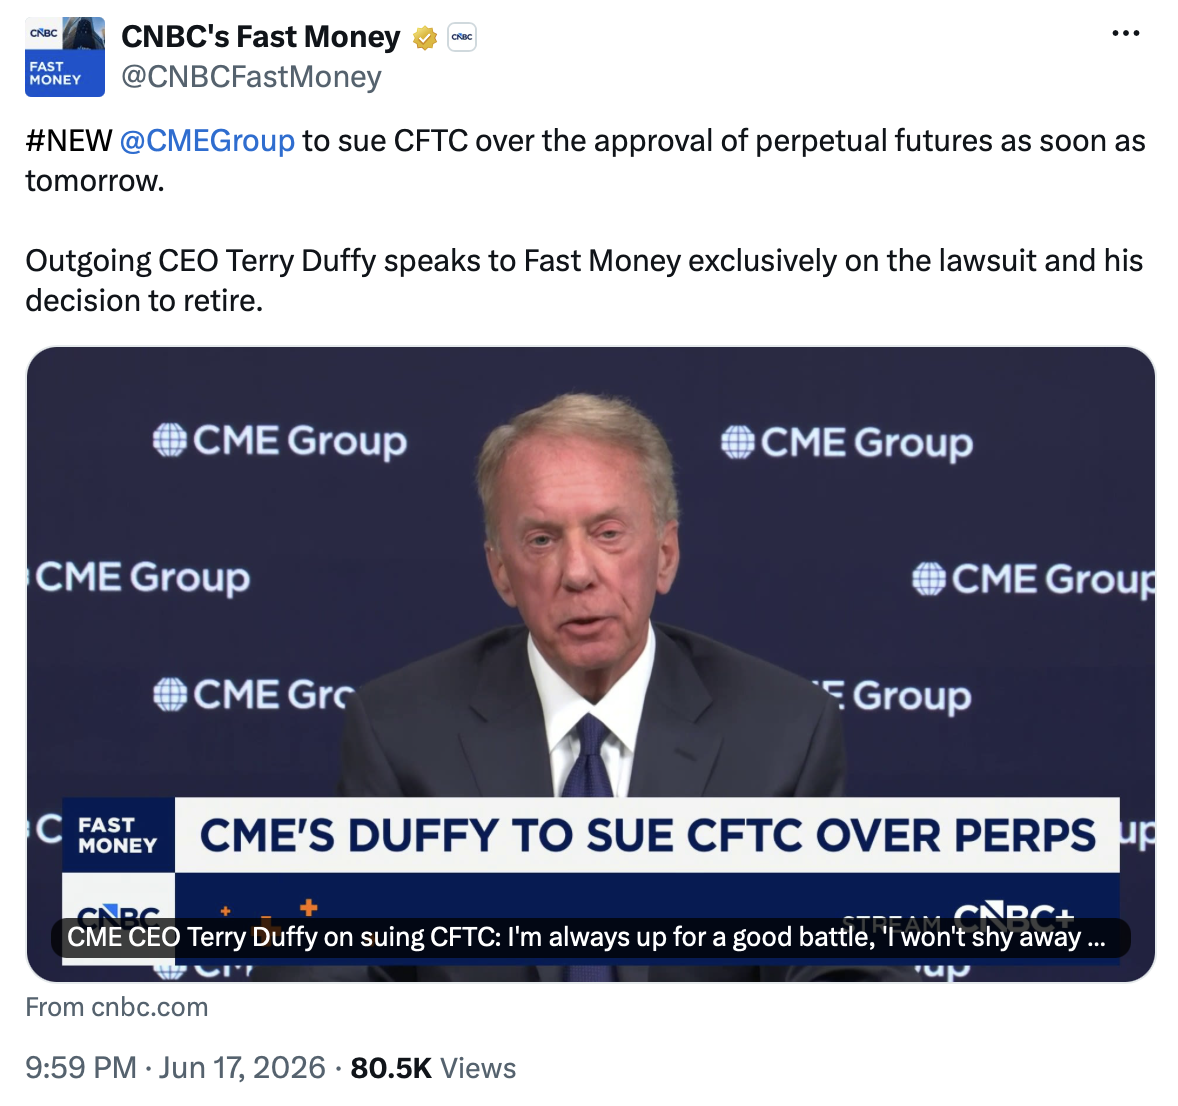
CME CEO Terry Duffy. Source: CNBC Fast Money
The lawsuit comes amid a broader push to bring crypto perpetual futures onshore. In May, the CFTC approved Bitcoin perpetual futures contracts for Kalshi and issued a no-action position allowing Coinbase to offer similar products.
Since then, Coinbase expanded US institutional access to global crypto derivatives markets, while Kraken launched perpetual futures trading this week through its CFTC-regulated Bitnomial exchange.
Related: BBB National Programs refers prediction market Kalshi to state regulators over ad inquiry
Countries push back against prediction markets
Despite gaining traction in Canada, prediction markets continue to face regulatory resistance in several jurisdictions. In May, Spanish regulators ordered internet providers to block access to Kalshi and Polymarket while investigating whether the platforms were operating in violation of national gambling regulations.
Asian regulators have also moved against prediction markets. Indonesia recently banned Polymarket after users traded contracts tied to whether President Prabowo Subianto would leave office early, while Japanese crypto exchange Bitbank warned users over Polymarket-linked transfers and South Korean police reportedly investigated local users over alleged gambling violations.
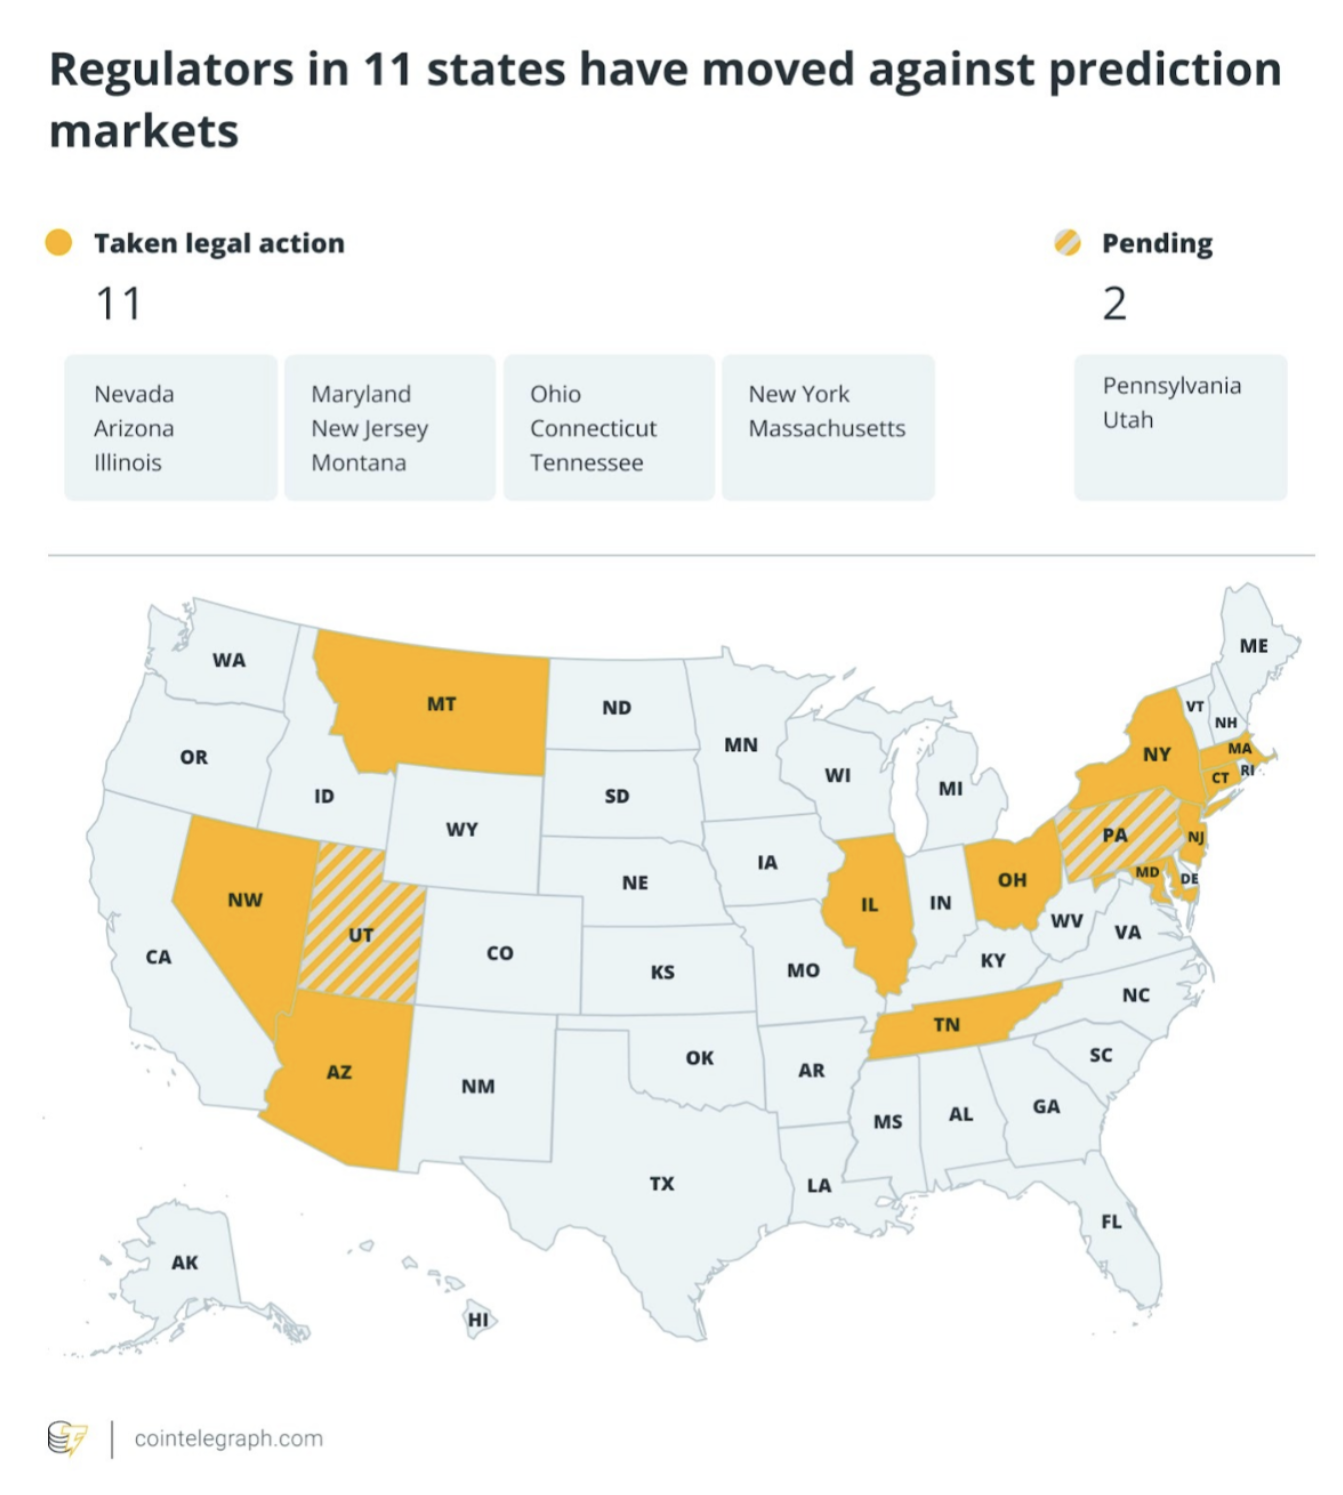
In the United States, at least 11 states have challenged prediction markets in recent months. At the center of the dispute is whether event contracts should be regulated under state gambling laws or as federally regulated derivatives overseen by the CFTC.
Speaking at Bitso’s Stablecoin Conference in Mexico City on June 16, Digital Chamber CEO Cody Carbone said the growing conflict between the CFTC and state gambling regulators is likely headed for the US Supreme Court.
Source: Cointelegraph
Magazine: The end of anon? AI could unmask crypto’s hidden identities


CME Group has filed a lawsuit against the U.S. Commodity Futures Trading Commission after the regulator approved crypto perpetual futures that have already generated more than $1 billion in trading volume.
Summary
- CME has sued the CFTC, arguing crypto perpetual futures should be regulated as swaps under Dodd-Frank.
- The exchange claims the regulator bypassed congressional requirements when approving Kalshi’s perpetual contracts.
- Legal experts say the CFTC may have authority to classify novel products, creating uncertainty around CME’s case.
According to Bloomberg, the derivatives exchange sued the CFTC and its chairman, Michael Selig, arguing that the agency improperly classified crypto perpetual contracts as futures instead of swaps.
The legal challenge comes days after several regulated perpetual products gained approval in the United States, opening a market that has long been dominated by offshore exchanges.
Earlier this week, outgoing CME Chief Executive Terrence Duffy told CNBC that the company planned to take legal action after the regulator cleared platforms including Kalshi and Coinbase to offer regulated crypto perpetual futures.
Duffy argued that perpetual contracts fall under the swap category established by the Dodd-Frank Act and should not be treated as standard futures products.
In its complaint, CME stated that the CFTC departed from its own historical approach toward similar instruments. The exchange argued that the regulator had previously viewed perpetual-style products as swaps and that the latest approvals bypassed procedures Congress established for that market segment.
The filing further alleges that the approval process did not go through formal rulemaking despite creating a new framework for perpetual contracts. According to the complaint, Chairman Selig effectively overrode statutory definitions established by Congress when authorizing the products.
CME challenges classification of crypto perpetual contracts
At the center of the dispute is Kalshi’s Bitcoin perpetual futures contract, which received CFTC approval on May 29. According to the regulator, the BTCPERP product can remain listed as long as it complies with the Commodity Exchange Act and existing CFTC regulations.
While approving the contract, the CFTC also stated that perpetual structures may not be appropriate for every asset class and indicated that products would continue to be reviewed individually.
As previously reported by crypto.news, Kalshi later expanded beyond Bitcoin-linked contracts, launching additional perpetual products tied to cryptocurrencies including Ethereum, XRP, and Hyperliquid. The exchange has since disclosed that its perpetual futures business generated more than $5.5 billion in trading volume within weeks of launch.
Separately, crypto.news reported that Coinbase secured a regulated route to offer certain crypto perpetual futures products in the U.S. through infrastructure connected to Deribit, the derivatives exchange it acquired.
CME’s complaint also references intellectual property and licensing concerns. Duffy told CNBC that CME holds exclusive agreements with benchmark providers and argued that related products should be routed through CME regardless of whether they use a perpetual structure.
Legal experts see uncertainty around CME’s claims
Responding to the lawsuit, a CFTC spokesperson told Bloomberg that CME had chosen litigation instead of competing directly in the market. The spokesperson characterized the challenge as opposition to the Trump administration’s pro-innovation regulatory approach and argued that established firms were resisting increased competition.
Legal analysis from StarkWare General Counsel Katherine Kirkpatrick suggested the outcome may not be straightforward. In a June 18 X post, she noted that the CFTC previously treated perpetual products as swaps during its enforcement case against Binance, although she added that enforcement positions do not create binding precedent.
Kirkpatrick also stated that federal law does not require the CFTC to spend 45 days reaching a decision or maintain a quorum before acting, meaning the chair may have authority to approve products independently.
Addressing CME’s competitive injury argument, she said the exchange would still need to demonstrate actual harm and noted that offshore perpetual trading venues already compete with CME regardless of the agency’s decision.
According to Kirkpatrick, perpetual contracts remain a relatively new product category in the U.S., making it unlikely that Congress specifically addressed them when passing Dodd-Frank.
“Perps are still new(ish), which means they weren’t intended to be addressed by Congress when Dodd-Frank was passed. The CFTC has discretion to categorize novel products, & its choice of future vs swap here is reasonable.”

Tom Hanks’ Viral MS NOW Dig Sparks Backlash Online
Claims of Dartmoor pony cull reignite row over how to save Britain’s moorlands

Northern Multi-Manager High Yield Opportunity Fund Q1 2026 Commentary (NMHYX)


-

 Business4 days ago
No Jackpot Winner as $257 Million Prize Rolls Over to $269 Million Monday Draw
-

 Fashion6 days ago
Weekend Open Thread: Tuckernuck – Corporette.com
-
Crypto World4 days ago
Zimbabwe Requires Crypto Businesses to Register Annually Under New FIU Regulations
-

 Crypto World6 days ago
Bitget enters Argentina’s regulated crypto market through PSAV registration
-

 Tech6 days ago
NanoClaw integrates JFrog registries to secure AI agent downloads
-

 Tech7 days ago
This Week In Security: Microsoft On Microsoft, Register Your Domains, Linux On ARM, And FreeBSD Joins The File Cache Club
-

 NewsBeat6 days ago
FBI searches office of Ohio voter registration group
-
 Entertainment4 days ago
Matt Damon’s Viral Sci-Fi Thriller Has Taken Over HBO Max
-

 Business4 days ago
Anthropic staff to meet White House officials next week, Axios reports
-

 Tech4 days ago
As AI companies race to go public, who else is along for the ride?
-
 Crypto World4 days ago
Bitcoin could crash to $48,000, if this historical pattern is triggered
-

 Politics4 days ago
“Israel’s” ban on ICRC visits ruled illegal, but Knesset moves to stop them permanently
-
Entertainment7 days ago
Ana Navarro unleashes explosive tirade on ex-Trump aide, Disney Channel star in epic on-air fight: 'Have you no shame?'
-
 NewsBeat4 days ago
Warning of disruption as Cardiff Crossrail works to start
-

 News Videos4 days ago
Financial Accounting | Last Day Revision Strategy and Booster | CMA Inter – June 2026
-
 NewsBeat4 days ago
Tributes to former deputy head teacher at Cambridge school among death and funeral notices
-
 Crypto World4 days ago
Market Preview: SpaceX (SPCX) IPO Record, Federal Reserve Meeting, and Iran Nuclear Agreement
-
 NewsBeat4 days ago
what doctors are seeing in ebike crashes
-
 Entertainment4 days ago
Kate Middleton Glare Goes Viral After Kids Booed At Royal Event
-

 Entertainment5 days ago
Deion Sanders Shares Powerful Post After Viral Advice To Deiondra
You must be logged in to post a comment Login