

Crypto World
Candlestick Wick Analysis in Trading
Candlestick wicks often contain critical information about buying and selling pressure that body patterns alone may not reveal. By analysing wick length and position, traders can understand price rejection, momentum shifts, and liquidity zones.
In forex and CFD markets, sessions run long and liquidity shifts across the day. That setup often produces rejections at session boundaries, round numbers, and structural levels. Wick analysis trading may offer a quick read on sentiment that body-only views can miss. This article explains the candle wick meaning and outlines several strategies traders may use.
What Candle Wicks Show in Price Action
Candle wicks, or shadows, are the thin lines above and below a candlestick’s body that indicate how far the price moved during a specific period. The upper wick marks the highest price reached during the candle’s period, and the lower wick marks the lowest.
Candle wicks, extending beyond the body of the candlestick, offer a deeper insight into market dynamics than open and close price levels. Their lengths and positions relative to the candle body unveil the tug-of-war between buyers and sellers within a given timeframe.
Wicks reflect rejection and volatility in a single visual. Each wick records a price the market reached but failed to hold. Longer wicks point to wider intraperiod ranges and more aggressive two-way action. Short wicks suggest price stayed close to its open and close throughout the period.
A long wick candle to the upside suggests that buyers pushed the price higher, but sellers eventually overcame, driving the price down from its peak. Conversely, a lengthy lower wick indicates sellers initially dominated, with buyers making a strong comeback.
Such patterns are not merely reflections of high volatility; they signal potential market reversals or continuations, depending on their context and the prevailing trend. For instance, a series of increasing lower wicks in a downtrend could hint at a building bullish pressure. Traders often scrutinise these subtle cues, aligning them with other technical indicators to refine entry and exit points.
The table below summarises how the three main wick patterns are commonly read:
Wick Size and Candle Body Ratio
The wick-to-body ratio sorts candles into four rough categories of candlestick patterns.
Indecision candles have a small body between two long wicks. Both sides pushed price away from the middle and neither held ground. Doji and spinning tops fall into this group.
Rejection candles have a small body at one end of the range and a single long wick at the other. One side pushed hard before the other overwhelmed them, producing a rejection candle pattern often seen at key levels.
Momentum exhaustion shows up after a strong directional run. A large body with disproportionately long wicks suggests the move stretched far enough that opposing pressure started pushing back, hinting momentum rejection is building.
Strong momentum candles usually have a large body with small or no wicks. This reflects sustained directional pressure where price closed near the session high or low with limited rejection. Marubozu candles are a common example and are often associated with strong breakout or trend continuation moves.
Reading Market Conditions with Wick Analysis
Wicks serve as a lens to view underlying market conditions, offering insights into trader sentiment, potential reversals, and the strength of current trends. This analysis predominantly focuses on the length and frequency of long wicks, as they often carry more significant information than their shorter counterparts.
Context shapes what a wick is telling traders. A long wick on a 5-minute chart in a quiet session reads differently to the same wick on the daily at a multi-month high. Traders typically check the prevailing trend, the timeframe, and nearby structural levels before drawing conclusions from any single candle.
Trend Continuation
Long lower wicks during pullbacks in an uptrend, or long upper wicks during bounces inside a downtrend, often indicate the dominant side stepped back in to defend the trend. A cluster of these wicks across consecutive candles tends to reinforce the read. Traders sometimes treat them as a trend continuation signal aligned with the existing direction.
Reversal Risk
- Long Upper Wicks: Typically indicate a rejection of higher prices by the market, showing that buyers were unable to maintain control. When observed in an uptrend, these can signal an impending reversal or a pause in momentum as sellers start to outweigh buyers at higher prices. Upper wick trading typically focuses on these setups near established resistance.
- Long Lower Wicks: Suggest a rejection of lower prices, showing that sellers couldn’t keep the price down. In a downtrend, long lower wicks can be a precursor to a reversal, indicating that buyers are beginning to dominate the price action. Lower wick trading typically focuses on these setups near established support.
- Repetition and Placement: The significance of long wicks is amplified when they occur repeatedly over several candles or near key support and resistance levels. A series of candles with long upper wicks near a resistance area, for example, could hint at a strong selling pressure, suggesting an area for a reversal.
Failed Breakout
A wick that pierces a level and closes back inside the prior range is the textbook failed breakout candle signature. One side attempted to extend the move, found no follow-through, and price snapped back. These wicks are common after consolidation breaks that lack volume or wider confluence.
Liquidity Sweep
A long wick spiking through an obvious swing high or low before reversing may indicate a liquidity sweep, where price extended just far enough to trigger clustered stop orders before reversing. Wicks of this type often appear at session highs and lows, where stops tend to accumulate.
Common Wick Signals in Forex and CFD Markets
Forex wick trading and CFD wick analysis tend to focus on a handful of repeatable settings where wicks carry more weight than usual.
- Support and Resistance: Long wicks tagging well-tested horizontal levels often reflect support and resistance rejection, where resting orders at the level absorb the move.
- Session Highs and Lows: In forex, wicks forming at the highs and lows of the Asian, London, or New York sessions tend to mark zones where liquidity changes hands as the next session takes over.
- Moving Averages: Wicks rejecting dynamic levels such as the 50, 100, or 200-period moving average may suggest the average is acting as a trend filter for the period in question.
- Volatility Spikes: Wicks during news releases or sharp volatility expansions reflect volatility rejection as much as informed flow, so they often need follow-up confirmation before being trusted.
Wick Trading Strategies
The wick analysis trading strategies below share a common foundation. Each one treats a long wick as evidence of price rejection candle behaviour at a level that already carries technical weight. Wick candle trading is usually based on the conditions when the wick lines up with prior structure, a Fibonacci level, a moving average, or another reference point that other traders are also watching.
A single candle in isolation is rarely enough for candlestick wick analysis. Traders typically wait for the candle to close, look for confirmation from surrounding price action, and check the broader trend before treating any wick as a setup.
Now, let’s explore three long-wick trading strategies. If you’d like to see how they work in practice, consider following along in FXOpen’s TickTrader platform.
Long Wick During Trend Pullbacks

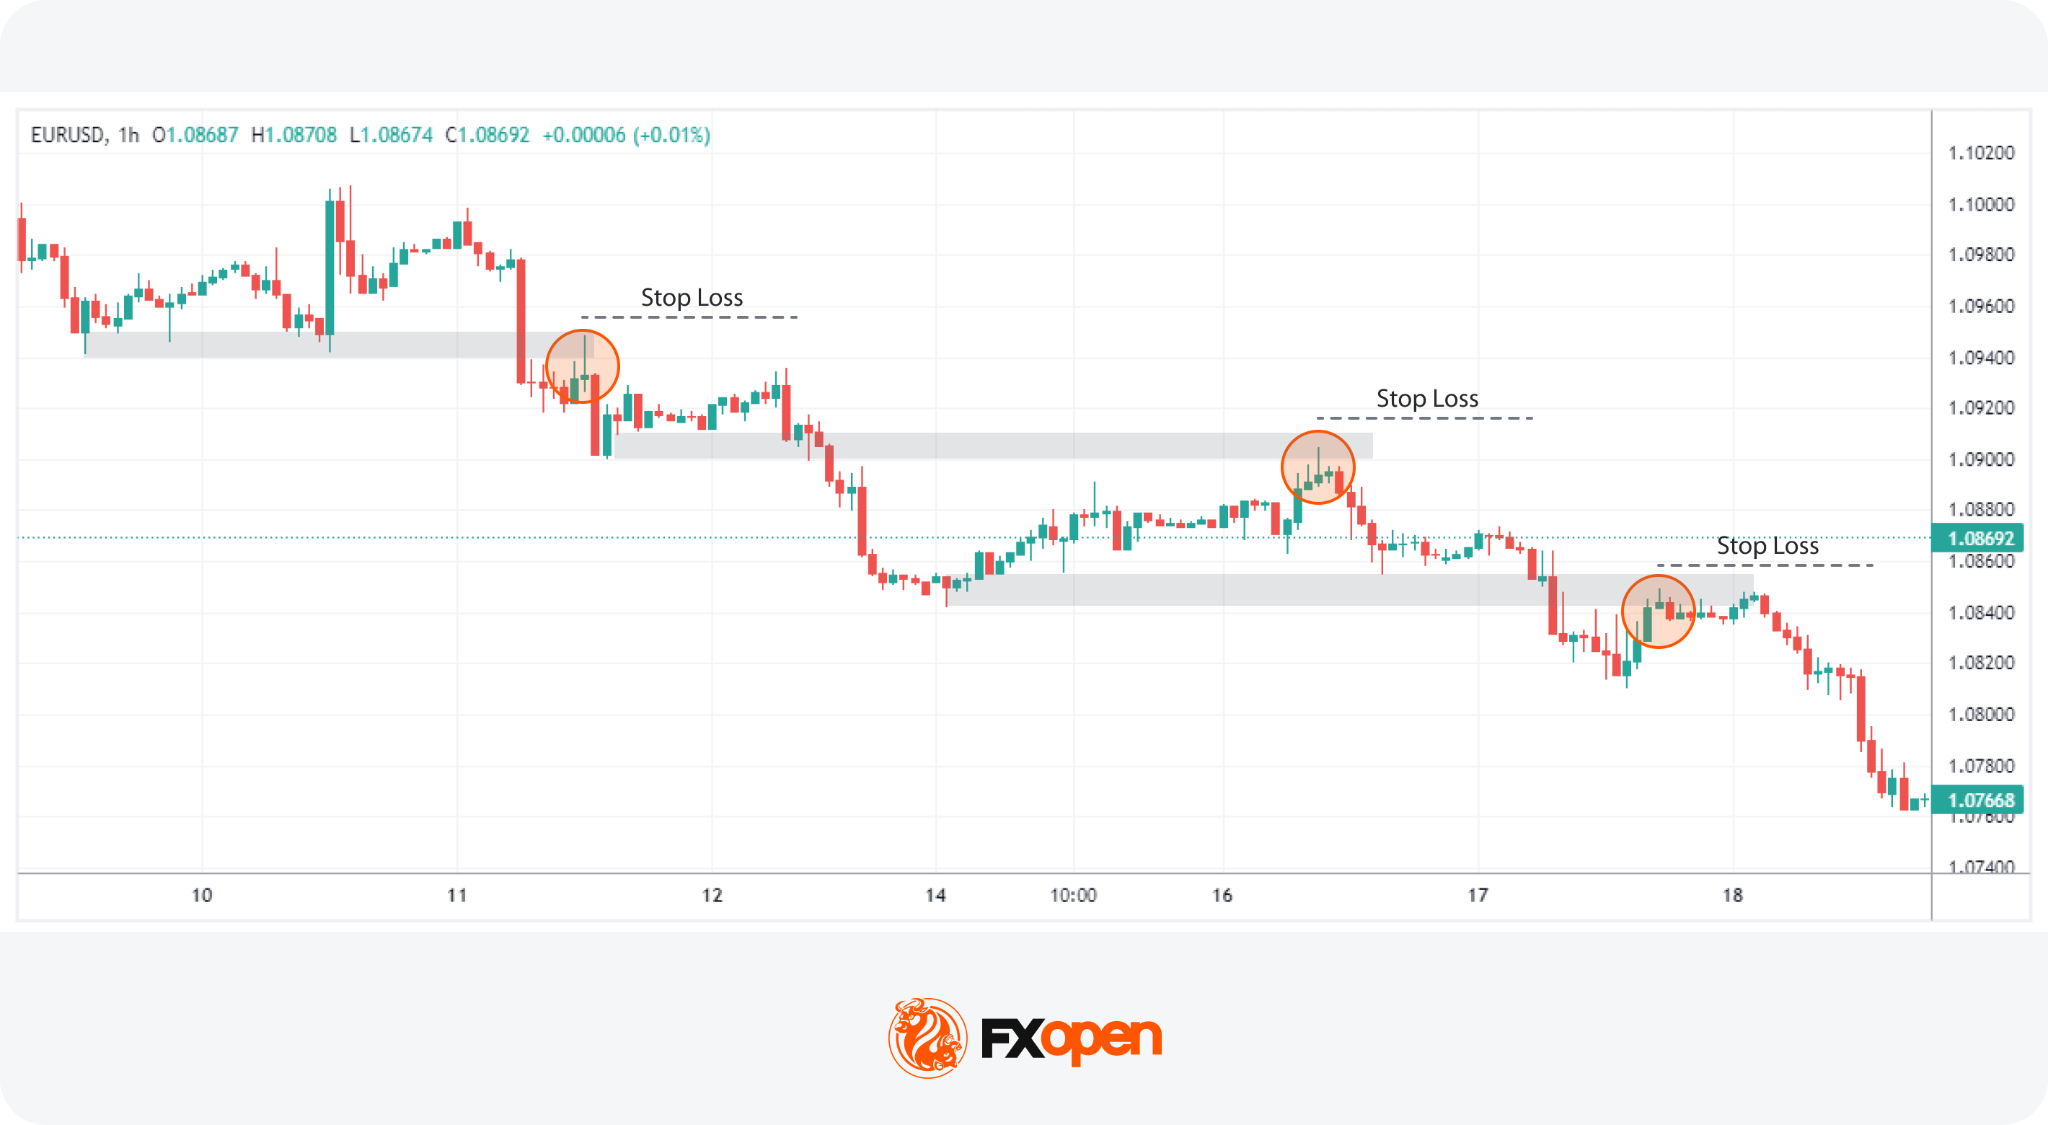
In the realm of long-wick candle trading, the strategy focusing on extended wicks during trend pullbacks may be insightful. The strategy focuses on temporary pullbacks within an established trend, using long wicks as signs of rejection and potential trend continuation.
Identifying the trend first is what separates wick candle trading from random wick-chasing. Traders typically look for a sequence of higher highs and higher lows in a bullish trend, or lower highs and lower lows in a bearish one. A 50- or 200-period moving average may also support the read on direction. On 15-minute and 1-hour charts, the trend is judged against intraday structure. On the 4-hour, traders typically take a broader swing view spanning several days.
Entry
- Traders watch for a long wick to form when the price begins to pull back to the previous range (i.e. at or above the last swing low in a bearish trend or at or below the last swing high in a bullish trend), indicating an area where the trend may continue.
- The presence of a long wick candle, usually at least a third or half its overall size, signals that market participants may be stepping in to support the overall trend.
Stop Loss
- According to the theory, a common approach is to set stop losses just beyond the entry candle for a buffer against market reversals.
- Alternatively, traders might place stop losses beyond a nearby swing point or a well-established support or resistance area.
Take Profit
- Profit targets might be identified by assessing upcoming resistance levels in a bullish scenario or support levels in a bearish scenario. Traders may also consider a fixed risk-reward ratio instead.
Wick Rejection Strategy at Support and Resistance
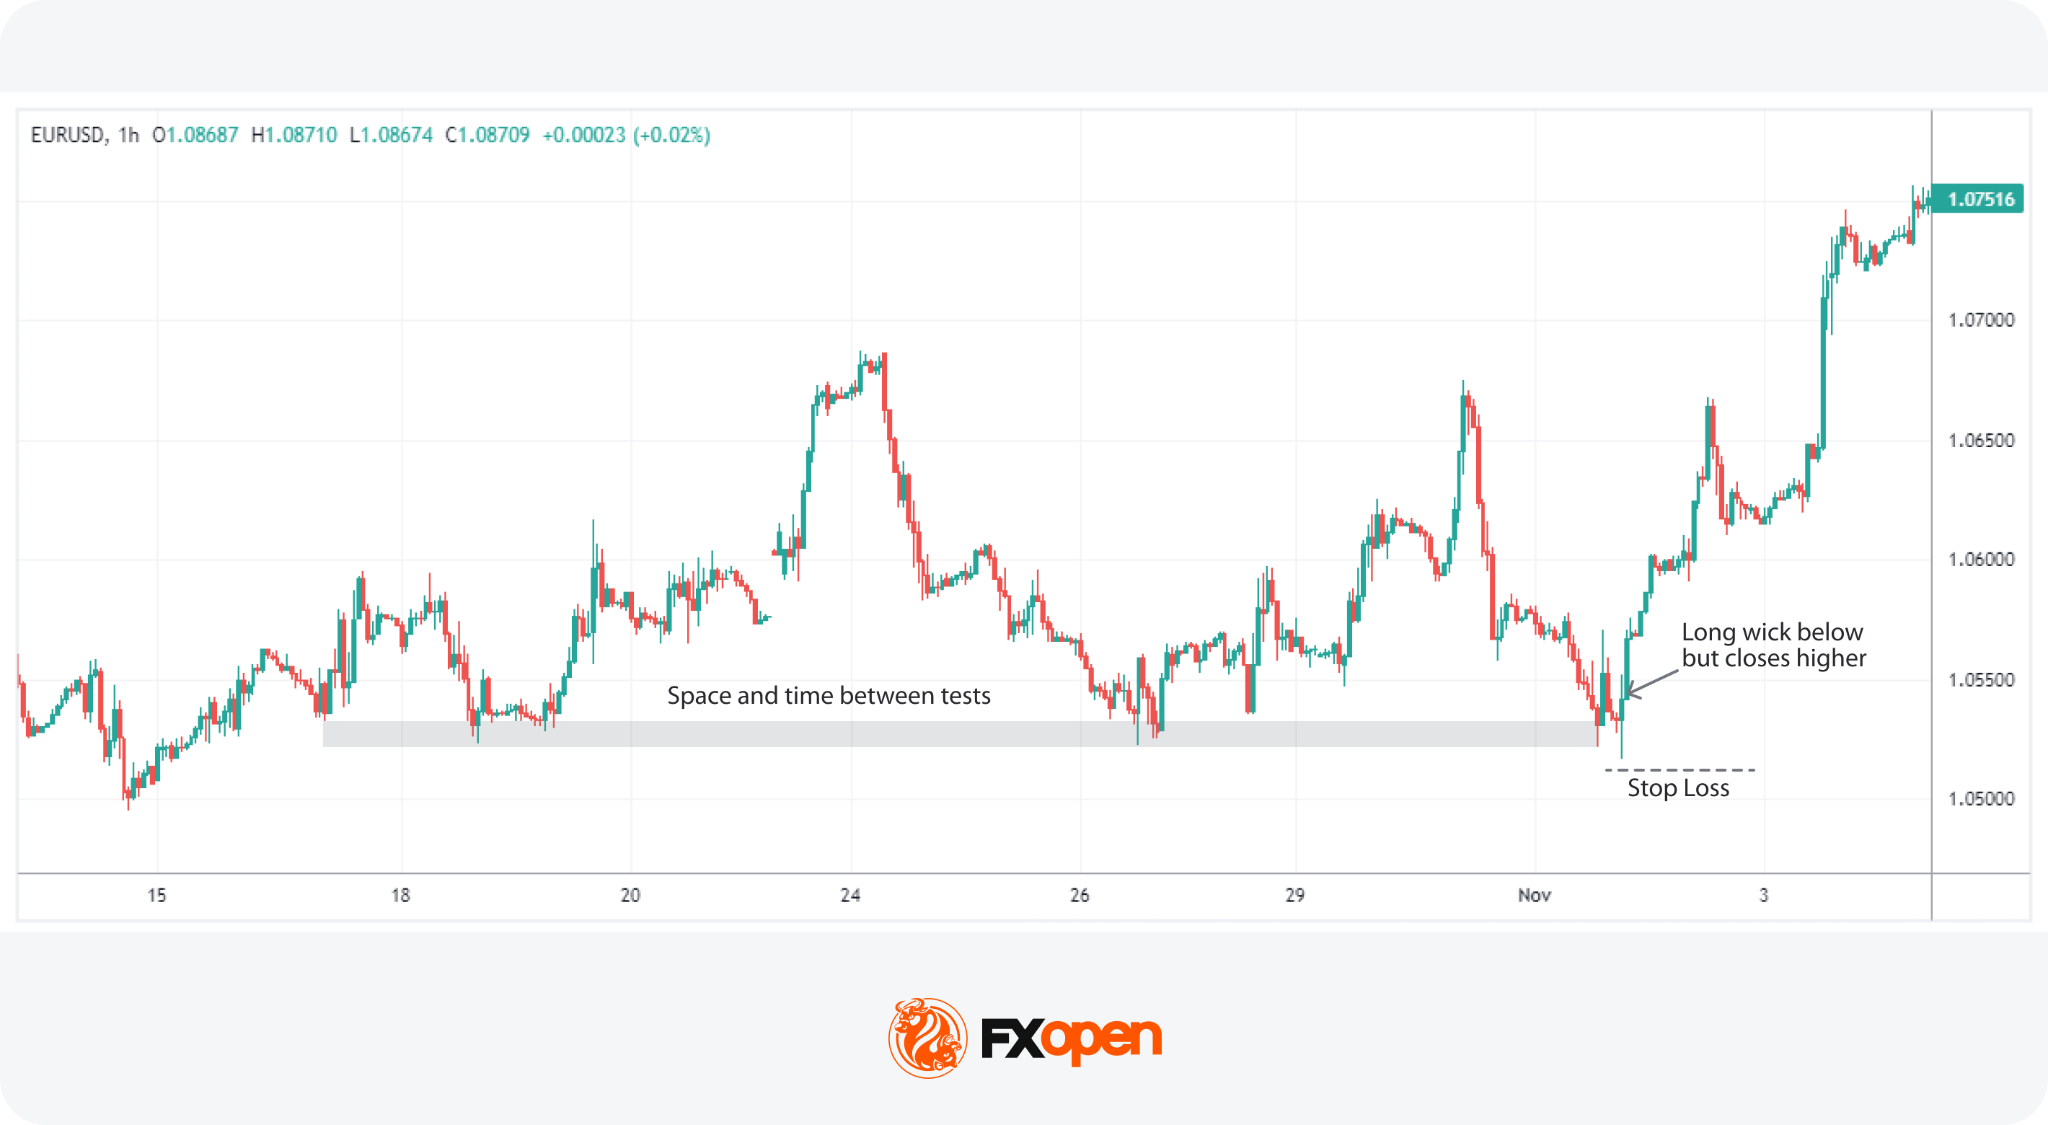
The strategy of focusing on long wicks on candlesticks at significant support or resistance levels leverages the market’s reaction to these critical areas. It’s a technique that thrives on the premise that major horizontal support or resistance, which have been tested multiple times with significant highs or lows, act as strong psychological barriers for price movements.
This method is more popular when there is clear visual space on the chart and considerable time between the tests of these areas, emphasising the significance of these levels.
When price briefly moves beyond support or resistance before quickly reversing, the resulting long wick may indicate rejection of higher or lower prices. Some traders interpret this type of move as a failed breakout, especially when the candle closes back inside the prior range.
On the risk-management side, traders often place stop losses beyond the wick high or low while keeping position size aligned with their overall risk limits.
Entry
- Traders often look for a candle that moves sharply into a major support or resistance area and then reacts away, leaving a long wick. This indicates a strong rejection of the price beyond these areas.
- A movement above or below the previous highs or lows, accompanied by a long bull wick or bear wick, adds confirmation to the trade setup.
Stop Loss
- Traders could set stop losses just beyond the candle’s high or low.
Take Profit
- Traders typically target an opposing support or resistance area for placing take-profit levels, as they expect a bounce from the tested level. However, some traders may opt for a fixed risk/reward ratio instead.
Wick Rejection Near Fibonacci Levels
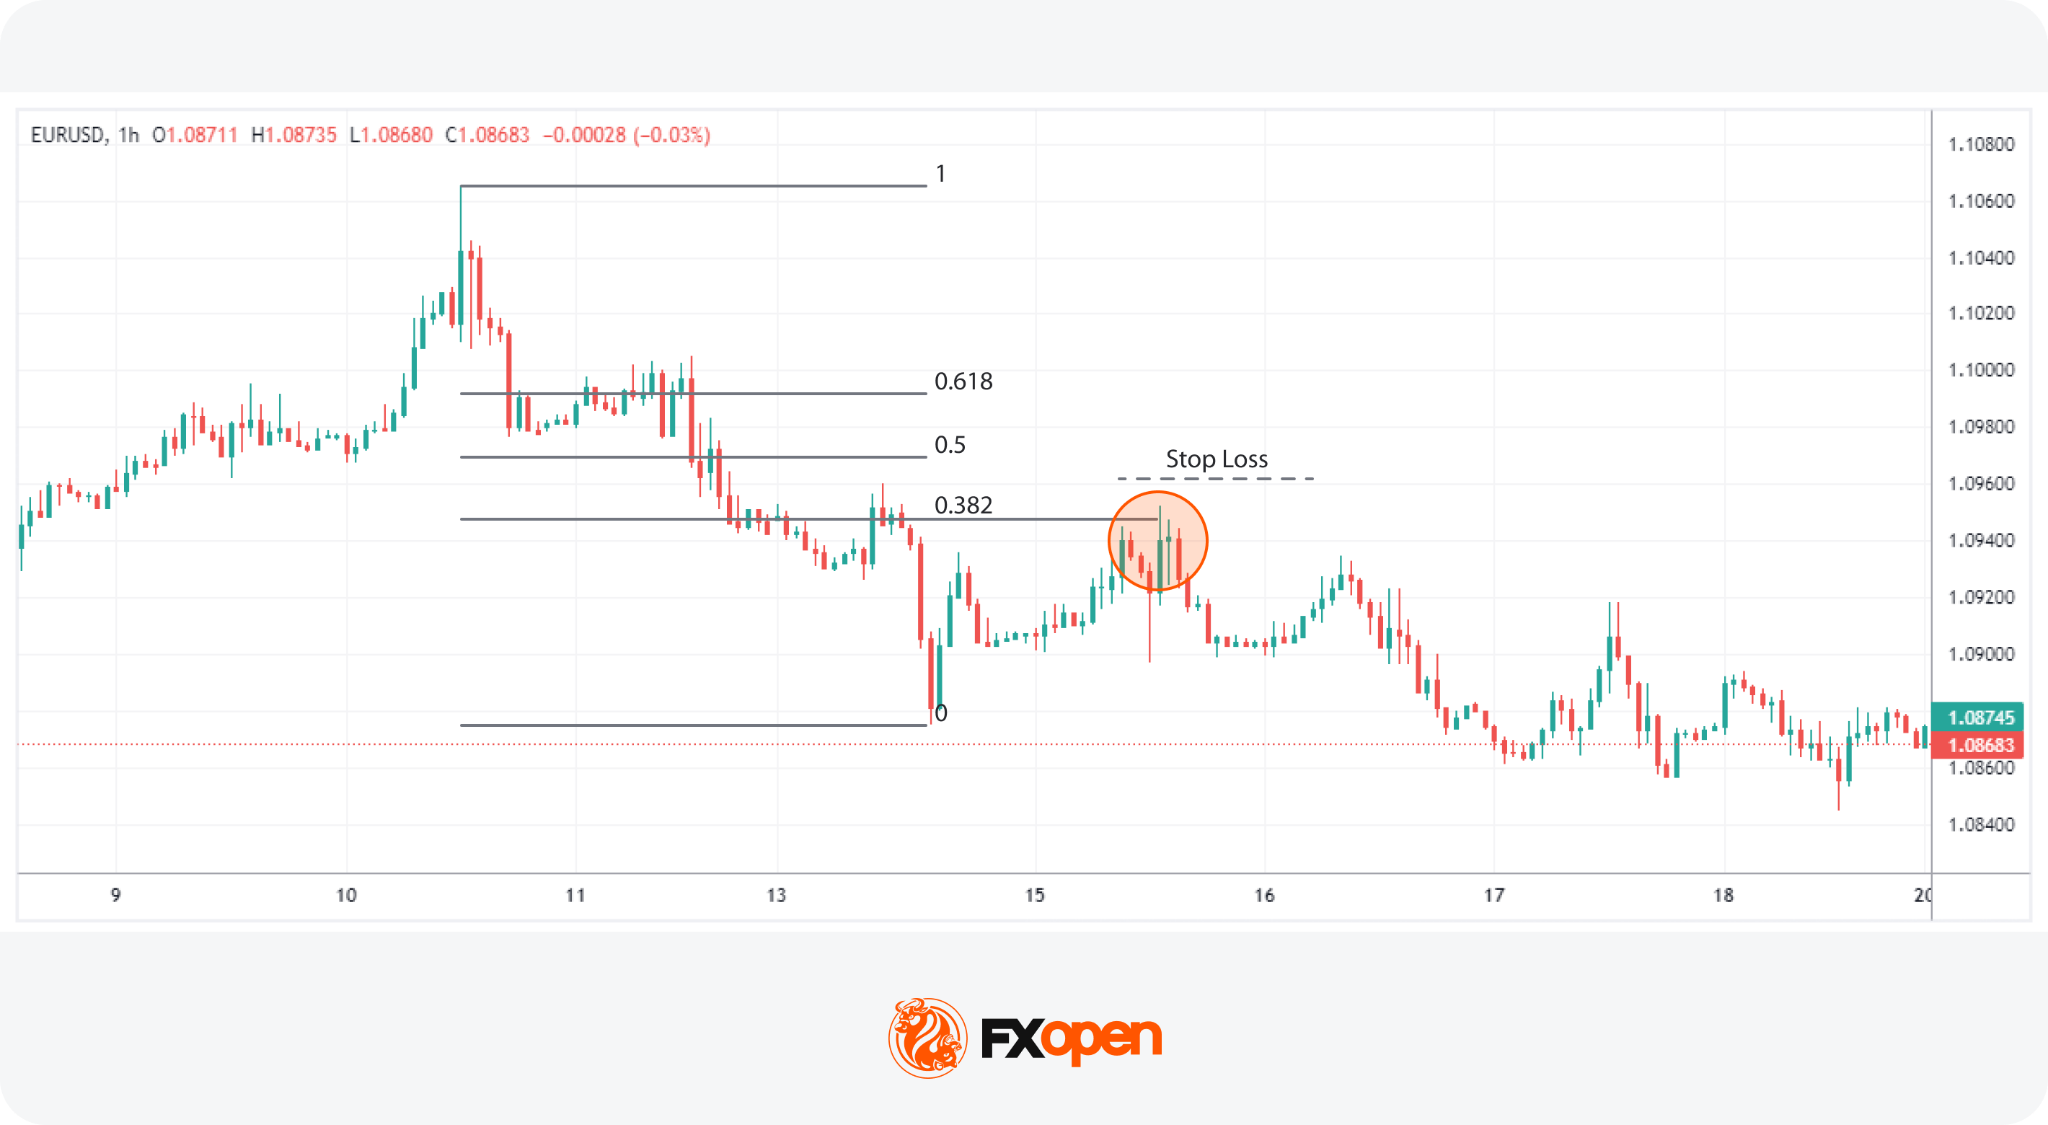
In this strategy, traders use Fibonacci retracements in tandem with candlestick analysis to anticipate trend continuations. The approach starts from a clear trend, with the retracement drawn across the most recent swing.
Fibonacci levels carry more weight when they line up with other technical reference points. Key levels of interest are the 0.382, 0.5, and 0.618 retracement levels, which act as zones of interest rather than precise lines. Traders look for them to overlap with horizontal support or resistance, a prior swing point, or a moving average. A long wick rejecting a Fibonacci level in isolation is generally read with more caution than the same wick at a Fibonacci-plus-structure confluence.
Entry
- Attention is centred on the 0.382, 0.5, and 0.618 Fibonacci retracement levels, awaiting price action that touches these zones.
- The presence of a long wick touching one of these zones reflects a strong rejection of further price movement against the trend, hinting at a potential continuation of the established trend.
- Additional confirmation is sought when these Fibonacci levels coincide with other recognised support or resistance areas, reinforcing the likelihood of a trend continuation.
Stop Loss
- Stop losses are typically positioned just beyond the wick, a nearby swing high/low, or the next Fibonacci retracement level.
Take Profit
- Profit targets might be set at the high or low used to draw the retracement, aiming to capture the full extent of the trend’s movement.
- Alternatively, traders may choose another significant support or resistance level as a profit-taking point based on the prevailing market structure.
Wick Analysis with Volume Confirmation
Candlestick wick analysis often works alongside volume. A wick that prints on noticeably higher volume than the surrounding candles tends to carry more weight than the same wick on thin participation. Relative volume, judged against an average of the prior 20 or 50 periods, is the common way traders frame this read.
Absorption is one behaviour worth watching. When price pushes into a level and the candle prints a long wick on elevated volume, it may suggest that resting orders on the defending side absorbed the move without giving ground. The wick records where buyers or sellers tried to extend the move, and the volume records how much pressure it took to push them back.
Rejection behaviour reads similarly. A long upper wick on heavy volume at resistance may indicate selling interest was meaningful rather than incidental. The same wick on light volume offers less confirmation, and traders typically treat it with more caution.
Traders using volume indicators in forex often supplement them with tools such as Volume Profile or session-based reads.
Common Considerations in Wick Trading
In the world of big wick candle trading, there are some common practices that traders may consider:
- Context: It’s common for traders to analyse wicks within the broader market context to make decisions based not only on one candlestick pattern, but also on other market factors.
- Volume Confirmation: Many traders look for volume confirmation to validate the signals provided by long wicks. A significant volume spike accompanying a considerable wick can indicate strong market interest at certain prices.
- Looking For Confluence: Likewise, seeking areas that coincide with other technical levels can add extra confirmation to a wick-based trade. Fibonacci retracements, support/resistance zones, and moving averages are commonly used.
- Practice Patience: Traders often exercise patience, waiting for the candle to close before making a move. This may help in avoiding false signals that might occur during the candle’s formation.
Avoiding Isolated Candle Analysis
A single wick says far less than the sequence around it. Traders typically zoom out before acting on any wick, checking the prior two or three candles for confirmation that rejection was sustained rather than fleeting.
A long lower wick that prints below support is one signal. The next candle closing back inside the range with a strong body is a second. Without that follow-through, the original wick can be a false alarm, especially during low-volume periods or news-driven spikes. Reading wicks alongside trend, structure, and at least one secondary signal tends to filter out the noise that catches traders acting on a single bar in isolation.
Limitations of Wick Analysis
Wick trading strategy approaches have real limits and traders typically build that into how they use them:
- Low liquidity periods: in thin sessions such as the Asia-Pacific open or late Friday trading, wicks can form on minimal flow. A wick built from a handful of ticks reflects sparse participation more than meaningful rejection.
- News spikes: economic releases and central bank announcements often produce dramatic wicks that have little to do with technical structure. These tend to revert as algorithms unwind initial reactions, so the wick can be misleading as a setup.
- Ranging conditions: in choppy, sideways markets, wicks form constantly at the range extremes and most lack predictive value. The signal-to-noise ratio drops sharply outside trending environments.
- False signals: even in clean conditions, a meaningful share of wick setups fail. Wicks are probabilistic reads on order flow, not certainties.
Wick analysis is usually used as one input in a broader technical framework that also draws on trend identification, structural levels, volume, and risk management. Treating it as a standalone system invites the limitations above to dominate the results.
Summary
While candle wicks may seem like minor visual elements, they often reveal some of the market’s most telling signals. From highlighting rejection zones to exposing failed breakouts, wicks can support traders when building a trading strategy. Many traders use wick analysis inside a broader price action trading framework, alongside trend identification, structural levels, volume, and risk management rather than in isolation.
If you would like to trade with over 1,200 tools and indicators, you can consider opening a forex trading account with FXOpen and gain access to trading in over 700 markets.
FAQ
What Do Long Wicks Mean in Trading?
Long wicks indicate a potential rejection of a given price level. A long upper wick suggests selling pressure after a price hike, while a long lower wick indicates buying support following a drop.
How May Traders Read Candle Wicks?
To read candle wicks, traders examine their length and direction. A long wick signals rejection of prices, especially if it occurs at a support or resistance area. Upper wicks denote selling pressure; lower wicks point to buying interest.
How May Traders Trade Candle Wicks?
Trading candle wicks involves analysing long wicks for potential market reversals. Traders often look for wicks at support or resistance levels as signals to enter or exit trades, using them alongside other indicators for confirmation.
What Is the Candle Wick Trading Strategy?
The candle wick trading strategy utilises the presence of long wicks as indicators for making trading decisions. This approach relies on the idea that wicks signify price rejections and potential shifts in market direction, aiding in identifying entry and exit points.
What Does a Long Upper Wick Indicate?
A long upper wick indicates that buyers pushed price higher during the period but sellers reclaimed control before the close. It typically reflects rejection of higher prices. Near resistance or after an extended rally, it may suggest weakening demand and the potential for a reversal or pause in the trend.
Can Wick Analysis Be Used in Forex Trading?
Yes. Wick analysis is widely applied across forex pairs, particularly at session highs and lows, round-number levels, and major support and resistance zones. Forex traders often combine wick reads with broader price action and risk management rather than treating any single candle as a standalone signal.
What Timeframe Is Commonly Used for Wick Analysis?
Wick analysis works across timeframes, though the read changes with each one. Day traders often watch 5-minute and 15-minute charts, swing traders favour the 1-hour and 4-hour timeframes, and position traders typically focus on daily and weekly candles. Higher timeframes generally produce wicks that carry more weight.
Are Wick Signals Reliable During News Events?
Wick signals during major news events may be weak. Sharp volatility, widened spreads, and algorithmic reactions can produce dramatic wicks that revert quickly. Many traders avoid acting on wicks formed inside news windows and wait for the market to settle before reassessing the technical picture.
This article represents the opinion of the Companies operating under the FXOpen brand only. It is not to be construed as an offer, solicitation, or recommendation with respect to products and services provided by the Companies operating under the FXOpen brand, nor is it to be considered financial advice.

Crypto investment products extended losses to three straight weeks last week amid ongoing selling pressure in markets and limited institutional demand.
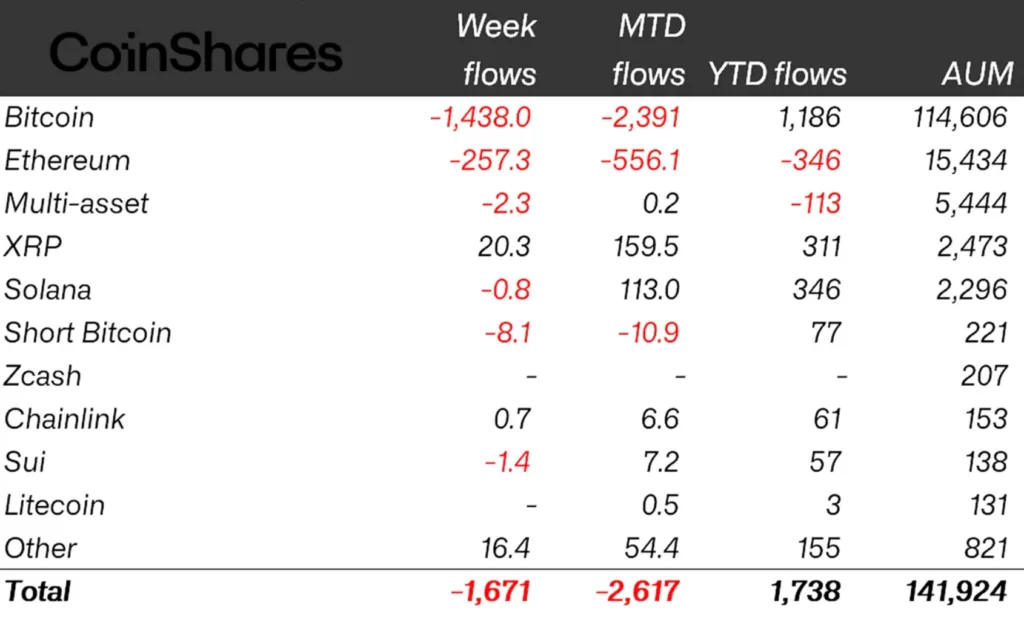
Crypto exchange-traded products (ETPs) recorded $1.67 billion in outflows last week, the second-largest weekly withdrawal of 2026, CoinShares reported on Monday.
The fresh outflows bring three-week losses to $4.21 billion, with total assets under management dropping to $141 billion, the lowest level since early April.
CoinShares head of research James Butterfill attributed surging outflows to an Iran-related risk-off move that has now overwhelmed any cushioning effect from CLARITY Act progress. “The pattern is reminiscent of the January-February episode that delivered five consecutive negative weeks,” he said.
Bitcoin sees the largest weekly outflow of 2026
Bitcoin (BTC) ETPs led weekly outflows by a wide margin, with $1.44 billion leaving the funds, marking the largest weekly outflow so far this year.
The funds were $2.4 billion down month-to-date but still had about $1.2 billion in inflows year-to-date, while assets under management fell to $114.6 billion.

Crypto ETP flows by asset (in millions of US dollars). Source: CoinShares
Ether (ETH) funds continued to see selling pressure with $257.3 million in outflows, bringing year-to-date losses to $346 million.
Altcoin participation also collapsed, CoinShares’ Butterfill said, referring to only five assets recording substantial inflows above $1 million, down from nine a week prior.
XRP (XRP) again led positive momentum with $20.3 million in inflows, while Hyperliquid (HYPE) and Near (NEAR) followed with $10.8 million and $7.6 million, respectively.
US drives losses with $1.63 billion of outflows
Regionally, the United States drove the global outflow story with $1.63 billion of outflows, aligning with $1.42 billion in outflows from US-listed spot Bitcoin exchange-traded funds (ETFs), according to SoSoValue data.
Germany joined the risk-off sentiment with $25.7 million of outflows, while Sweden and Hong Kong saw $6.6 million and $4.5 million in outflows, respectively. The Netherlands again was the only country to see inflows above $1 million, with $1.3 million in inflows, down from $6.6 million a week prior.
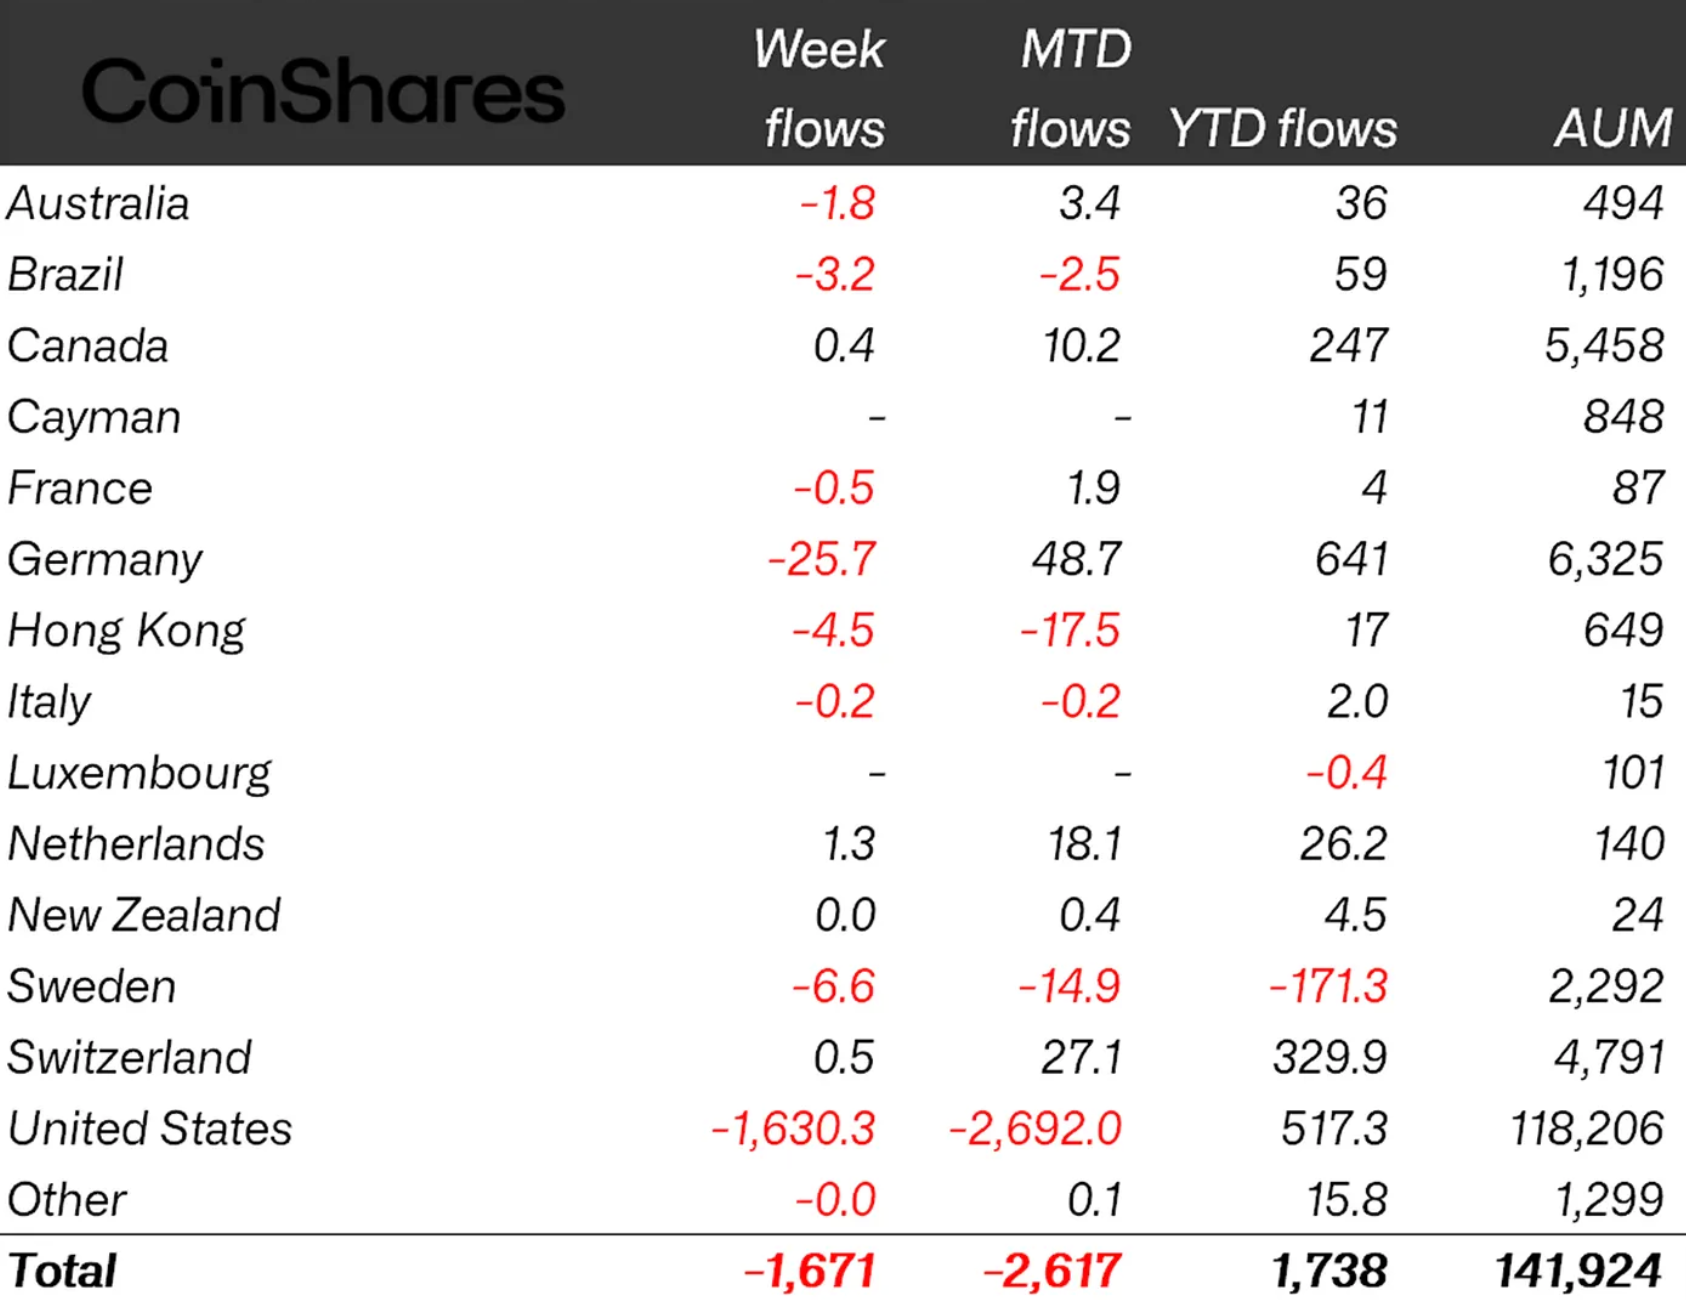
Crypto ETP flows by country (in millions of US dollars). Source: CoinShares
According to the derivatives trading desk at Laser Digital, the crypto sell-off last week came without a clear catalyst and was affected by underperforming equities.
Related: Strategy’s Michael Saylor teases BTC buy with ‘working better’ tweet
The unit cited a lack of demand, including Michael Saylor’s Strategy announcing that it did not purchase any BTC between May 18 and May 24.
“With STRC still trading below par and the continued lack of interest from retail buyers, BTC is expected to remain weak for the time being,” it said in a statement seen by Cointelegraph.
Magazine: HYPE chases $100 target, ETH could dump below $1800: Market Moves

Michael Saylor weeks ago teased that it was coming, but the news for the moment is shocking already depressed crypto markets even further.
Strategy (MSTR) in a Monday morning filing disclosed the sale of 32 bitcoin for $2.5 million. The amount is a rounding error compared to the 840,000-plus BTC held by the company, but it’s nevertheless significant, suggesting even larger sales down the road as Strategy looks to fund dividend payments on its high-yielding preferred stock STRC.
Bitcoin has slipped just below $72,000 on the news, down nearly 3% over the past 24 hours. MSTR shares are lower by 5.15% premarket. U.S. stocks, meanwhile. are set to add to record highs hit last week, with futures on all three major indices in the green.
Importantly, it’s not the first time Saylor and team have sold some of their stack. The company near the bottom of the 2022 bear market sold 704 bitcoin at about $18,000 each.
Bitcoin bulls can only hope the current sales again might be marking a significant bottoming in prices.

Key Highlights
- Kentucky Retirement Systems dramatically expanded its ServiceNow holdings by 400% during Q4, acquiring an additional 51,904 shares valued at approximately $9.94 million.
- Multiple institutional players made substantial position increases, pushing total institutional ownership to 87.18% of outstanding shares.
- Shares began Monday trading at $124.56, trading above the 200-day moving average of $123.39 despite remaining below the 52-week peak of $211.48.
- First quarter revenue surpassed expectations at $3.77 billion compared to the projected $3.75 billion, marking a 22.1% year-over-year increase.
- Analysts maintain a “Moderate Buy” rating with a collective price target of $141.85.
ServiceNow (NOW) shares are capturing significant institutional investor interest, as fourth-quarter 2025 filings reveal a substantial wave of position building and expansion among professional money managers.
Leading the charge, Kentucky Retirement Systems quadrupled its ServiceNow stake to 64,880 shares, representing approximately $9.94 million in value at filing time. This dramatic move signals strong conviction rather than a minor portfolio adjustment.
This bullish sentiment extended across multiple institutions. Peapack Gladstone Financial Corp expanded its holdings by an impressive 505.5%, Florida Financial Advisors increased exposure by 552.9%, and Waterloo Capital grew its position by 384.1%. Meanwhile, Rothschild Wealth initiated a fresh stake valued near $310,000.
Cumulatively, institutional stakeholders now control 87.18% of ServiceNow’s total shares outstanding.
NOW kicked off Monday’s session at $124.56 per share. The stock maintains a position above its 200-day moving average of $123.39, though it continues trading significantly below its 52-week high of $211.48. With a 52-week low of $81.24, the stock has achieved a meaningful rebound from its bottom levels.
The enterprise software giant carries a market capitalization of $128.42 billion alongside a price-to-earnings ratio of 74.23.
First Quarter Results Exceed Expectations
ServiceNow unveiled its Q1 performance on April 22nd, delivering revenue of $3.77 billion that topped the Street’s $3.75 billion estimate. This figure reflects a robust 22.1% year-over-year expansion.
Earnings per share reached $0.97, aligning precisely with analyst projections. The comparable quarter in the prior year produced EPS of $0.81. Looking ahead to the complete fiscal year, the analyst community currently projects earnings of $2.36 per share.
The company achieved a net margin of 12.59% coupled with an 18.16% return on equity.
Street Ratings and Executive Trading
Wall Street maintains a generally optimistic stance on ServiceNow shares. Citigroup elevated its price objective from $154 to $158 while maintaining a “Buy” rating. Evercore increased its target from $140 to $150 with an “Outperform” designation. BTIG reaffirmed its “Buy” recommendation with a $150 target. DA Davidson sustained its “Buy” rating with the most aggressive target at $190. Cantor Fitzgerald adjusted its target downward to $122 but preserved an “Overweight” rating.
Among 43 monitored analysts, the distribution stands at: two Strong Buy ratings, 35 Buy ratings, five Hold ratings, and one Sell rating. The average price target comes to $141.85.
Regarding insider transactions, Director Paul Edward Chamberlain divested 1,500 shares on May 14th at $87.23 each, trimming his stake by 3.23%. Insider Paul Fipps sold 1,048 shares on May 18th at $98.51 apiece, representing a 7.99% reduction. Both transactions occurred through predetermined Rule 10b5-1 trading plans. Fipps executed his sale specifically to satisfy tax liabilities associated with vesting equity compensation.
Collectively, company insiders disposed of 28,071 shares totaling roughly $2.53 million over the past quarter. Executive and board ownership represents merely 0.34% of the company.


Strategy (MSTR) sold 32 bitcoin between May 26 and May 31 at an average net price of $77,135 a coin, totaling $2.5 million, the company disclosed in an 8-K filing on Monday.
Bitcoin briefly dropped under the $72,000, per CoinDesk data, with over $90 million in BTC-tracked futures positions liquidated shortly on the move.
The disposal is Strategy’s first disclosed bitcoin sale and the proceeds are earmarked to fund distributions on its preferred stock, according to a footnote in the filing.
In addition, for the week, Strategy raised $128.3 million through its at-the-market (ATM) common stock program and allocated a small portion of the proceeds to increase its U.S. dollar cash reserve from $871 million to $900 million. After depleting a substantial portion of its cash holdings $1.5 billion of its 2029 convertible notes.
The company held 843,706 bitcoin at an average purchase price of $75,699 as of May 31, putting the sale price above its blended cost basis but also above where bitcoin was trading on Monday below $72,000 per CoinDesk data.

Seemingly every company is obsessed with artificial intelligence these days, whether it’s how the technology is transforming their industry or the effects it’s having on employees and customers.
But the degree to which companies are utilizing AI tools internally and adapting to a rapidly changing reality varies dramatically. A new study from AI-Driven Enterprise Institute (AIDE) breaks down how well S&P 500 companies — and their leaders — are adopting AI compared to their peers.
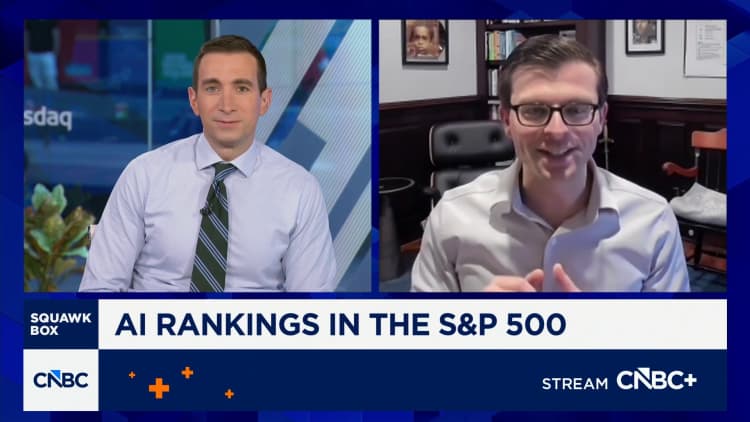
The top performers, unsurprisingly, are centered in the tech industry, according to the data, which was shared with CNBC. In looking at four areas — literacy, advocacy, orientation and implementation — AIDE gave each company a score of up to 100 in the four categories and then provided an overall index score.
In technology, the highest company score (the average of the orientation and implementation pillars) and the only 100, went to chipmaker Nvidia, which has become the world’s largest company by selling the chips and systems that have powered the development of AI models and services. Meta and Amazon also scored 100, but in the S&P 500, those companies are considered communication services and consumer discretionary names, respectively.
The only other 100 company score went to energy producer SLB, formerly Schlumberger. The next highest scorer was retailer Walmart, followed by AES and NextEra Energy, which are both classified as utilities.
The new open-source index draws from publicly available data like earnings call transcripts, job openings and patent applications to measure how much executives know and say about AI, as well as how much their companies are prioritizing the technology and bringing it into daily operations.
The data doesn’t measure whether AI is driving financial returns, but it’s meant to give leaders an objective way to compare their strategy to their peers without relying on self-reported surveys, said Paul Cheek, AIDE’s CEO and a senior lecturer at Massachusetts Institute of Technology.
“When a board asks a CEO — ‘How are we doing compared to our peer group?’ — I don’t want it to be speculative,” Cheek said in an interview. “I want there to be some data that they can use to back up what they have to share.”
Cheek said there’s “significant room for improvement” for board members and executives to increase their own AI literacy, adding that boards need to better understand AI “as it relates to the ability to manage risk and strategic investments in the organizations that create value for all of us.”
Here are the the 20 companies with the top company scores, based on their “orientation” and “implementation” scores:
- Nvidia (100)
- Schlumberger (100)
- Amazon (100)
- Meta (100)
- Walmart (95.84)
- AES (95.46)
- NextEra Energy (95.44)
- Ecolab (95)
- Digital Realty (94.74)
- Chevron (94.74)
- Alphabet (94.72)
- Equinix (94.59)
- IQVIA (93.75)
- Dow (93.34)
- Halliburton (92.83)
- Broadridge Financial Solutions (91.66)
- Microsoft (91.37)
- Block (90.91)
- Duke Energy (90.91)
- PepsiCo (90.62)
These companies were at the top of their sector based on the “AIDE Index”:
WATCH: Meta reshapes workforce as AI disrupts entry level hiring

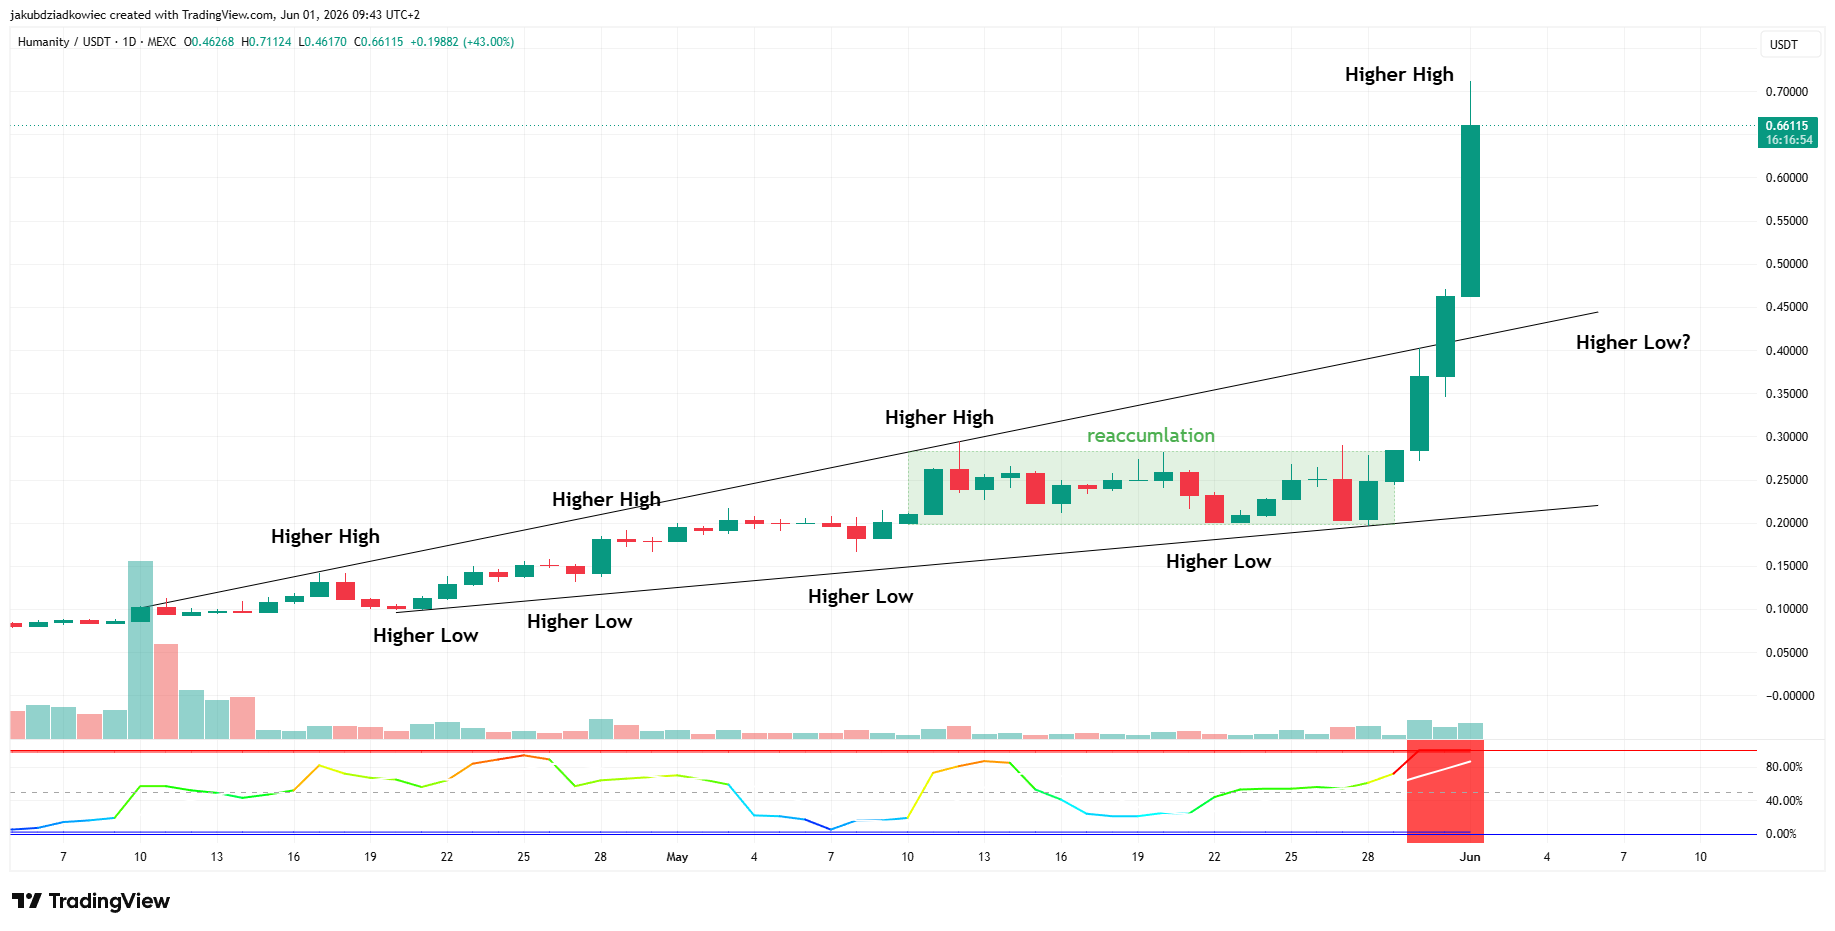
Humanity (H) price jumped more than 65% over the past 24 hours, pushing past $0.65 and setting a new all-time high above $0.68. The move added the token to a wider AI-themed rally sweeping crypto markets on June 1.
H now trades around $0.65 with a market cap of $1.18 billion, ranking 65th by capitalization. The token has gained 172% over the past week and roughly 237% over the past 30 days, based on current market data.
AI Sector Rally Lifts H Alongside Worldcoin and FET
The H rally fits inside a broader AI token move that pushed Humanity, Worldcoin (WLD), Fetch.ai (FET), and Venice Token (VVV) into the day’s top gainers list. Funds rotated into AI-linked tokens as risk appetite improved across equities.
Falling bond yields, softer oil prices, and renewed enthusiasm around upcoming AI-related tech IPOs added fuel to the speculative bid. The sector has tracked the strength of large-cap AI equities over the past 24 hours.
No project-specific catalyst surfaced from Humanity Protocol’s official channels. The move looks driven by sector rotation rather than a discrete announcement such as a listing or protocol upgrade.
Weekly Chart Shifts Into Price Discovery
H has broken cleanly above its October 2025 record high and now trades in price discovery on the weekly timeframe. The weekly Relative Strength Index (RSI) sits at 84, deep inside overbought-bullish territory.
The first two Fibonacci extension targets at 1.272 and 1.618 have already been printed. Price reached both during the current weekly candle, leaving the next upside zones open.

The 2.0 Fibonacci extension sits at $0.75, with the 2.618 target near $0.97. Both align with measured-move logic from the breakout structure.
On the downside, the 0.786 Fibonacci retracement at $0.32 marks the strongest visible support if the rally cools.
Daily Broadening Pattern Drives Volatility Expansion
The daily chart shows H trading inside a broadening formation that has produced higher highs and higher lows since mid-April 2026. The structure widens as price advances, a classic late-stage trend signature.
A roughly three-week reaccumulation phase from May 10 to the end of May built the platform for the current expansion. Price traded inside a tight range before the breakout fired.

Bollinger Band Width Percentile (BBWP) has flashed red over the past three sessions. The reading marks an extreme volatility regime and historically precedes either continuation spikes or sharp mean-reversion candles.
If sellers force a pullback, the next higher low projection sits near $0.43. That level would preserve the broadening structure on the daily timeframe.
Social Volume Spikes as Attention Floods H
Santiment data shows Humanity’s Social Volume and Social Dominance both climbing into the rally. The H/USD line accelerated steeply while social mentions hit their highest readings of the past three months.
Social Dominance reached 0.071, signaling that H captured an outsized share of crypto conversations relative to its market cap. Sentiment-tracking accounts on X assigned the token a 9 of 10 bullish confidence score.

Larger commentators have framed H as a top performer across the majors and highlighted its move past the $1 billion market cap line. That kind of attention tends to pull in short-term momentum traders and breakout chasers, much like the recent move in Worldcoin.
Humanity (H) Price Prediction Levels to Watch
The bullish path keeps H pointed at the 2.0 Fibonacci extension at $0.75 and the 2.618 extension near $0.97. Both targets sit within the current price discovery zone.
A failure to hold the daily structure shifts focus to the $0.43 higher-low projection. A deeper retracement would test the 0.786 Fibonacci support at $0.32, where buyers defended the prior breakout base.
The rally still lacks a discrete fundamental catalyst, which leaves the trade dependent on AI sector flows and chart-driven demand. Traders looking further out can weigh longer-term Humanity forecast scenarios alongside the live structure.
Whether H sustains its breakout depends on whether sector momentum and social attention hold firm through the next few daily candles.
The post Humanity (H) Surges 65% to Record High on AI Token Rally appeared first on BeInCrypto.

Crypto investment products recorded $1.67 billion in outflows last week, extending their losing streak to three weeks as Bitcoin funds saw their largest exit of 2026.
Summary
- Crypto ETPs recorded $1.67 billion in outflows, extending losses to three straight weeks globally now.
- Bitcoin funds led the selling with $1.44 billion withdrawn, their largest weekly outflow of 2026.
- XRP, Hyperliquid and Near attracted inflows, but altcoin participation narrowed sharply across markets last week.
Digital asset exchange-traded products posted their second-largest weekly withdrawal of 2026, according to CoinShares. The latest pullback took three-week outflows to $4.21 billion.
Total assets under management fell to $141 billion, the lowest level since early April. The data shows weaker demand from institutional investors after several weeks of pressure across crypto markets.
“The pattern is reminiscent of the January-February episode that delivered five consecutive negative weeks,” CoinShares head of research James Butterfill said.
Butterfill linked the selling to an Iran-related risk-off move that outweighed any support from progress around the CLARITY Act. The report said the pullback remained concentrated in major crypto investment products.
Bitcoin leads weekly selling
Bitcoin ETPs recorded $1.44 billion in outflows, the largest weekly Bitcoin withdrawal so far in 2026. Bitcoin products were down $2.4 billion month-to-date.
The asset still had about $1.2 billion in year-to-date inflows. Bitcoin fund assets under management fell to $114.6 billion after the latest withdrawals.
Ether products also stayed under pressure. ETH funds lost $257.3 million during the week, taking year-to-date outflows to $346 million.
Altcoin demand narrowed sharply. CoinShares said only five assets posted inflows above $1 million, down from nine assets a week earlier.
U.S. products drive global exits
The United States accounted for most of the selling, with $1.63 billion in outflows. That matched heavy withdrawals from U.S.-listed spot Bitcoin ETFs during the same period.
Germany recorded $25.7 million in outflows. Sweden and Hong Kong also saw withdrawals, while the Netherlands was the only market with inflows above $1 million.
XRP led the few positive assets with $20.3 million in inflows. Hyperliquid followed with $10.8 million, while Near added $7.6 million.
This showed that some investors still targeted selected altcoin products. However, the broader market remained tilted toward exits.
Earlier inflows give wider context
As previously reported by crypto.news, crypto ETFs saw strong inflows in April, with Bitcoin, Ethereum, and XRP products attracting fresh capital. That earlier rebound has now weakened.
Separate earlier coverage also showed crypto investment products drawing more than $1 billion in weekly inflows in March, when Bitcoin and Ethereum led demand.
The latest CoinShares data marks a clear change from that earlier buying. Bitcoin now accounts for most of the pressure, while Ether funds and several regional markets also remain weak.
The next weekly fund flow report will show whether the outflow streak extends toward the five-week pattern seen earlier this year or whether demand returns after the latest sell-off.
Coinbase has enabled direct rupee bank rails in India, making it easier for local customers to move money between bank accounts and crypto markets on the exchange as the company deepens its push into one of the world’s fastest-growing digital asset markets.
Indian users can now deposit and withdraw Indian rupees via the Immediate Payment Service (IMPS) instant payments network and access spot markets, perpetual futures and the company’s Advanced Trade interface through a single platform, according to a company blog post published Sunday.
The move marks Coinbase’s latest push to expand its presence in India since a troubled 2022 debut and follows the company’s registration with India’s Financial Intelligence Unit, giving it a formal regulatory footing in the market.
In 2022, Coinbase briefly supported Unified Payments Interface (UPI)-based rupee deposits before halting them days after launch, after payments authorities distanced themselves from crypto use of the network and partners stopped enabling UPI for the exchange.
Related: Coinbase brings global crypto derivatives markets to US institutional clients
Coinbase registered with India’s Financial Intelligence Unit in March 2025, a step the company said enables it to offer crypto trading services in India under the country’s Anti-Money-Laundering (AML) framework.
India first in global crypto adoption index
Coinbase is wading into a crowded but strategically important arena, where domestic platforms such as CoinDCX, CoinSwitch, ZebPay and WazirX already serve Indian traders.

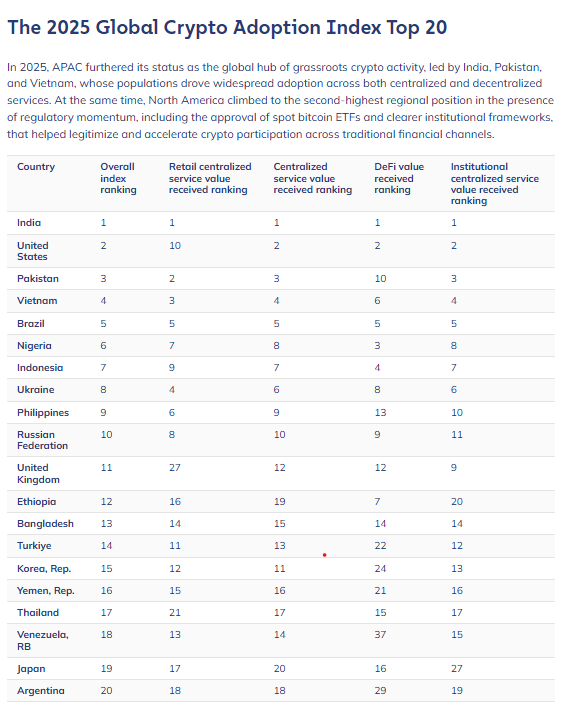
Chainalysis Global Crypto Adoption Index, 2025. Source: Chainalysis
Global exchanges such as Binance and KuCoin are also widely used, but have largely relied on crypto-only or peer-to-peer rupee access, rather than the kind of direct, IMPS-based bank rails Coinbase is now offering.
With rupee deposits and withdrawals now live, Coinbase is providing Indian users direct bank-to-crypto transfers in addition to spot trading, perpetual futures and its Advanced Trade platform, and says it has built local INR order books for concentrated domestic liquidity alongside access to its global exchange.
India has emerged as a key prize for global exchanges despite policy headwinds, including a 30% tax on many digital asset gains and a 1% tax deducted at source on certain transactions.
Chainalysis ranked India first in its 2025 Global Crypto Adoption Index, ahead of 150 other countries, based on factors such as retail onchain activity, use of centralized exchanges and decentralized finance protocols, and transaction volumes, illustrating the scale of grassroots usage that platforms like Coinbase are trying to tap.
Magazine: Guide to the top and emerging global crypto hubs — Mid-2026

Bitcoin and software stocks moved almost in lockstep for much of the past five years, with BTC treated as a high-beta technology asset.
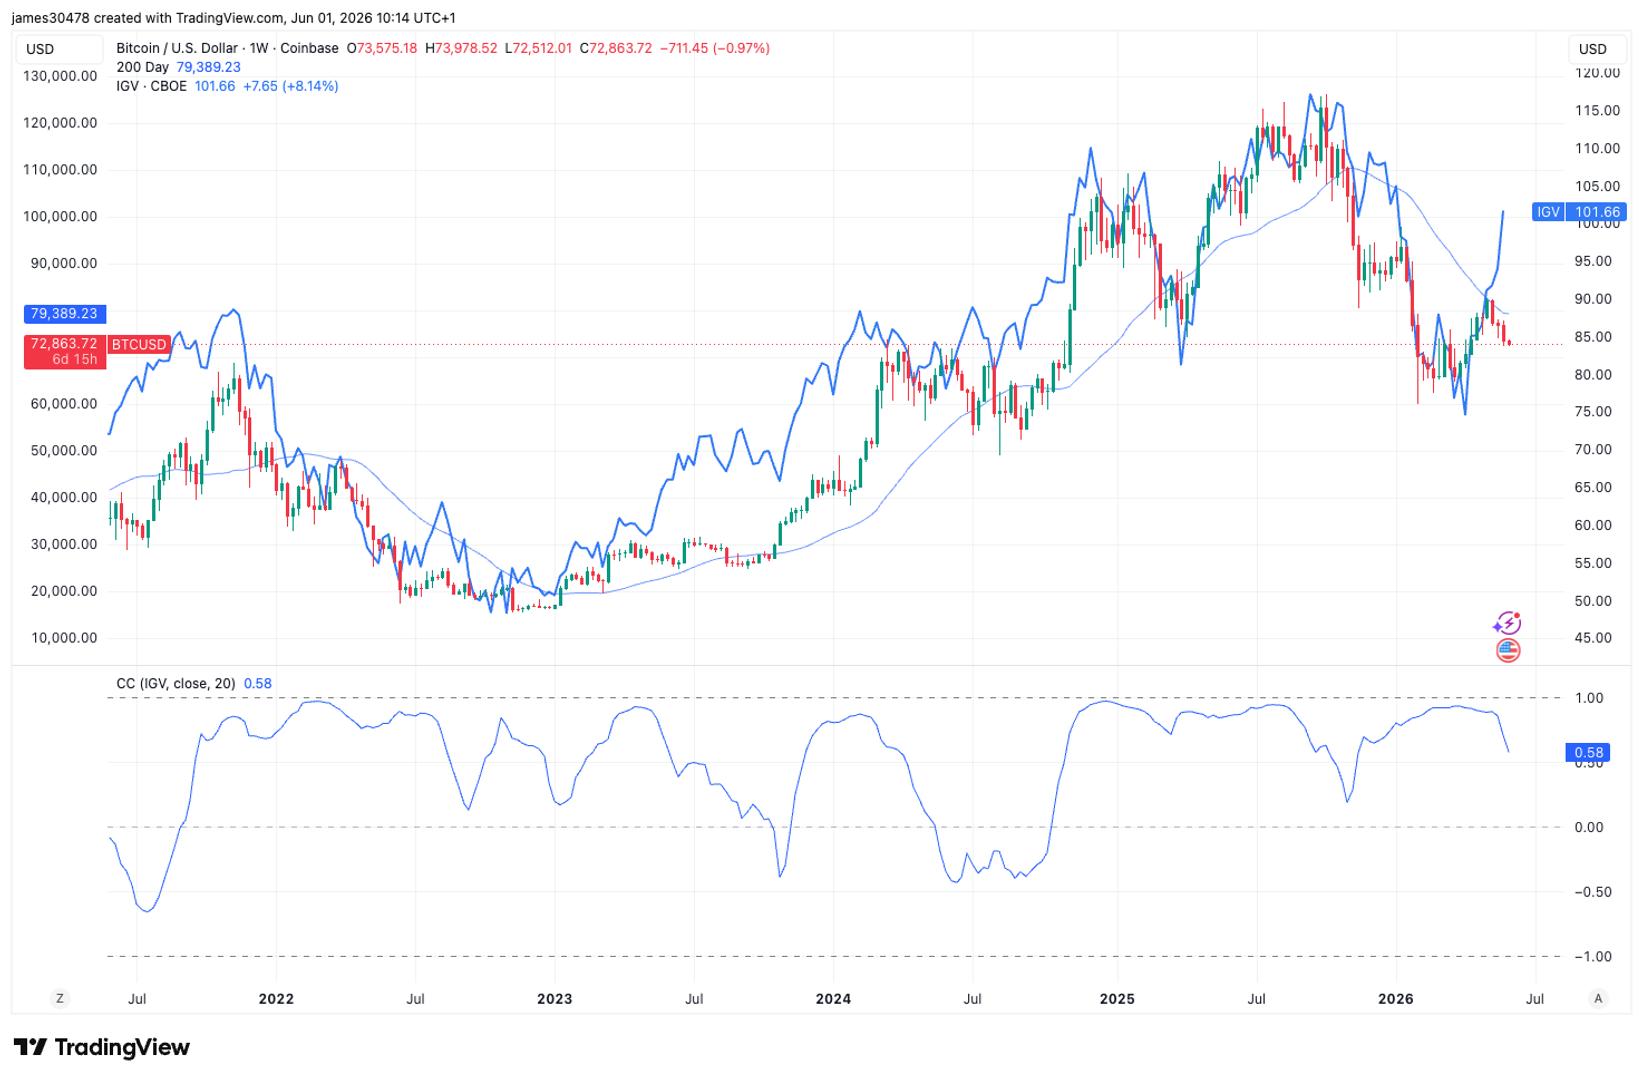
The iShares Expanded Tech-Software Sector ETF (IGV) served as one of the best proxies for the software sector. That relationship, however, appears to have broken down.
Since May 14, bitcoin and IGV have sharply diverged. IGV has gained roughly 12%, while bitcoin has fallen about 10%, marking one of the largest disconnects between the two assets in recent years.
Bitcoin and IGV reached all-time highs in October 2025 before entering significant drawdowns, with bitcoin declining roughly 50%, while IGV around 37%. The software sector’s weakness was largely driven by growing fears that artificial intelligence would disrupt traditional software business models. The “SaaS apocalypse” narrative gained traction across markets, triggering broad selling pressure in software names such as Oracle (ORCL), Microsoft (MSFT), and Palantir (PLTR).
IGV has staged an impressive recovery since early April, rallying 36% and reclaiming its 200-day moving average, a technical indicator that represents the average closing price over the previous 200 trading days and is often used to gauge a long-term trend. IGV closed on Friday near 98 and was trading around 104 in pre-market action Monday.
Bitcoin, by contrast, is trading near $73,000, nearly 10% lower than its 200-day moving average of $79,388.
The 20-day rolling correlation between bitcoin and IGV has fallen to 0.58. The last notable periods of similarly low correlation occurred in October 2023, when bitcoin was trading near $25,000 before rallying to $70,000 over the following six months, and again during the summer of 2024, shortly before bitcoin surged toward $100,000 following President Trump’s election victory.
Historically, such periods of low correlation have not lasted long. Either bitcoin eventually catches up to software stocks, or IGV’s recovery proves a fakeout. For now, the latter scenario appears less likely given IGV’s strong momentum and its move back above the 200-day moving average.

Smart contract technology is transforming online gaming by enabling trustless, transparent interactions between players and platforms. Recent advances in smart contract security are addressing longstanding vulnerabilities, supporting a more reliable experience for users. As both traditional gamers and fans of the social casino experience and sweepstakes-style entertainment explore blockchain-enabled platforms, robust smart contract protections are emerging as a crucial foundation for platform integrity and security.
Online game platforms, particularly those centered on blockchain and digital assets, now view security as a defining factor in building trust among developers, platform operators, and players, including how promotional mechanics like no deposit bonus codes are enforced through automated reward logic. In an increasingly competitive environment, many end users and operators recognize how flaws in smart contract logic can be exploited, resulting in disrupted gameplay, compromised fairness, or reputational harm. Questions such as, “How do promotions remain fair and transparent?” are common, and blockchain-based mechanisms aim to automate rewards distribution in accordance with published terms. Code-based security forms the infrastructure for modern digital entertainment, making robust protections essential.
As more free-to-play casino-style games and sweepstakes-style entertainment platforms embrace blockchain for fairness and transparency, smart contract protections can impact how incentives and rewards are managed. What does this mean for players? It typically means that both gameplay and daily rewards or bonus coins are distributed based on rules visible to everyone, increasing trust. To understand the value of trust, one must look at both transparent mechanics on the platform and the underlying automated systems that help secure gameplay integrity.
How Smart Contracts Underpin Gaming Ecosystem Logic
Smart contracts are self-executing programs that automate actions based on rules defined by platform developers. In online gaming environments, they often manage digital assets, enforce access controls, distribute rewards, and operate in-game marketplaces. What specific benefits do these contracts provide? For many platforms, the answer lies in consistent rule enforcement and minimizing the risk of human error or manipulation.
Reward distribution through smart contracts remains central to numerous gaming platforms, particularly those hosting player-versus-player contests, tournaments, or daily prize systems. By operating on-chain, smart contracts help ensure outcomes and payouts follow transparent rules, reducing manual intervention and the risk of operator bias. For users seeking a fair social casino experience, this transparency is often considered a core benefit of blockchain-mediated play.
Digital asset issuance is another area where smart contracts offer clear value. Many blockchain-enabled games allow players to earn, trade, or upgrade items as non-fungible tokens (NFTs) and in-game currencies. Smart contracts define the rules for ownership, transfer, and scarcity of assets, which supports the stability and predictability of these items within the ecosystem.
For access control and permissioning, smart contracts manage eligibility for games, tournaments, or events. This becomes particularly important for sweepstakes-style entertainment platforms, where participants’ eligibility may depend on location, activity history, or reaching certain in-game milestones. Users frequently ask, “How do platforms verify eligibility in sweepstakes scenarios?” The answer is that eligibility logic is often automated and verifiable through these smart contracts.
Deployment models for smart contracts can vary. Fully on-chain platforms process game logic and settle outcomes directly on the blockchain, which tends to maximize transparency but can affect performance. Hybrid solutions, where core outcomes settle on-chain and gameplay occurs off-chain, attempt to balance transparency and user experience.
Custodial models, in which some control remains with the platform but ownership or settlement is verifiable on-chain, are also common. In each model, ongoing security improvements aim to lower the chances of contract logic flaws negatively affecting gameplay, outcomes, or bonus rewards for players.
Beyond basic functionality, smart contracts enable sophisticated game mechanics that were previously difficult to implement with traditional server-based systems. Provably fair algorithms, for instance, allow players to independently verify that game outcomes were not manipulated after the fact. This cryptographic proof mechanism has become particularly valued in competitive gaming scenarios where prize pools are significant. Additionally, smart contracts facilitate player-to-player transactions without requiring platform intermediaries, reducing fees and settlement times. Many modern gaming platforms now leverage these contracts to create dynamic economies where supply and demand naturally regulate item values, creating more engaging and realistic virtual marketplaces that respond to actual player behavior and preferences.
The evolution of smart contract standards has also enabled interoperability between different gaming platforms and ecosystems. Standardized token interfaces allow digital assets earned in one game to potentially be recognized or utilized in another, creating interconnected gaming experiences that transcend individual platform boundaries. This cross-platform compatibility is particularly valuable for players who invest time and resources across multiple games, as it preserves asset value and utility beyond single-game lifecycles. Layer-2 scaling solutions have further enhanced smart contract capabilities by enabling faster transaction processing and lower fees while maintaining the security guarantees of underlying blockchains. These technological advances allow gaming platforms to support thousands of concurrent players and complex real-time interactions that would be prohibitively expensive on base-layer blockchains. As smart contract infrastructure continues to mature, developers gain access to increasingly sophisticated tools for creating immersive, economically sustainable gaming environments that balance decentralization with practical performance requirements.
Understanding Vulnerabilities Unique to Gaming Smart Contracts
Smart contracts offer significant benefits, but they also introduce unique vulnerabilities that can impact gaming platforms. Reentrancy attacks—where a contract is tricked into calling an external contract that then calls back into the original—have been highly publicized for enabling malicious actors to disrupt balances or logic mid-execution.
Weaknesses in access control are also widespread threats. If contract permissions are not precisely defined, unauthorized parties can sometimes assume critical roles, minting in-game assets or extracting platform funds. This is why routine security assessments are advised for both social casino and sweepstakes casino platforms to minimize such risks.
Games that use outside data sources, such as oracles for price feeds or event results, can be exposed if the oracle mechanism is insecure. Questions about how oracles influence game outcomes are common among users, and the answer is that robust oracle design is crucial to ensure integrity. Attackers may attempt to manipulate data sources, resulting in distorted or unintended contract behavior.
Other vulnerabilities include calculation errors, such as integer overflow, and issues with upgradeable contract frameworks. Contracts that mishandle calculations can sometimes produce unpredictable bonus coin rewards or item quantities, disrupting the intended gameplay experience. For platforms prioritizing a consistent social casino experience, this kind of unpredictability can impact user trust.
Upgradeability is often necessary for platforms, but if not carefully managed via multisignature confirmations, time delays, or audit logs, upgrade features may become a vector for unauthorized control or malicious changes. Predictable or insufficiently protected randomness mechanisms, often used in game outcomes, also represent a threat to fairness if not managed well.
Further risks arise with cross-chain bridges in multi-network gaming platforms. If implemented without careful validation and monitoring, these systems can potentially expose users’ assets to attacks across both connected blockchains.
Time-dependent vulnerabilities present another category of risk that gaming platforms must address carefully. Smart contracts that rely on block timestamps for critical decisions can potentially be influenced by miners who have limited ability to manipulate these values within certain ranges. This becomes especially problematic in time-sensitive gaming scenarios such as tournament deadlines, auction endings, or time-locked reward releases. Front-running attacks, where observers monitor pending transactions and submit their own with higher fees to execute first, can also disrupt fair gameplay in competitive environments. Gas limit issues may cause complex game state updates to fail unpredictably, potentially leaving players in inconsistent states. These technical challenges require developers to implement defensive coding practices and consider economic incentives that might motivate malicious behavior, ensuring that contract logic remains robust even under adversarial conditions.
Modern Security Practices Transforming Contract Protection
The industry has sharpened its technical and operational standards to address these challenges. Automated auditing tools scan code for common flaws and ensure that smart contracts adhere to best-practice security patterns. Users often ask, “How can I trust that a platform’s smart contracts are safe?” Regular audits and transparency measures help to answer this concern.
Formal verification offers additional rigor by mathematically checking contract logic against expected behaviors in various scenarios. Tools for invariant testing and fuzzing help developers uncover edge cases that could cause issues during live gameplay, supporting safer code ahead of platform launches involving free-to-play casino-style games.
Secure contract design patterns—such as checks-effects-interactions and robust access control—reduce the risk of attacks by narrowing the functions that external parties can access. Modular and role-based permissioning structures further improve security and are often used in building a trustworthy social casino experience.
Improved upgrade procedures feature governance layers, timelocks, and multisignature approvals, ensuring that updates occur only with sufficient oversight. Transparent logs allow players and third-party auditors to track and review all smart contract modifications, enhancing trust and platform accountability.
Visible change histories and immutable records provide another layer of openness, letting all participants confirm when and how important updates take place. For platforms that offer daily rewards and bonus coins or rely on sweepstakes-style entertainment, solid contract templates make it harder for distributions to be changed in ways that run contrary to players’ expectations.
As randomized events and daily rewards continue to grow popular, third-party code reviews and open security disclosures are typically considered minimum requirements for trust. These practices enhance reliability on platforms delivering a modern social casino experience intertwined with blockchain automation.
Bug bounty programs have emerged as a powerful complement to traditional security audits, incentivizing external security researchers to identify and responsibly disclose vulnerabilities before malicious actors can exploit them. Leading gaming platforms now allocate substantial rewards for critical findings, creating a collaborative security ecosystem where skilled researchers actively contribute to platform safety. Continuous integration and deployment pipelines increasingly incorporate automated security checks at every stage of development, preventing vulnerable code from reaching production environments. Simulation environments that mirror live blockchain conditions allow developers to stress-test contracts under realistic attack scenarios without risking actual user assets. These layered security approaches recognize that no single method provides complete protection, and that defense-in-depth strategies combining multiple complementary techniques offer the most reliable safeguards for platforms handling valuable digital assets and maintaining player trust.
Defensive Operations That Safeguard Platform Integrity
In addition to technical controls, daily operational procedures are instrumental in maintaining both platform and user asset security. Multisignature controls—which require agreement from several trusted parties before executing sensitive actions—reduce the risk of harm from single-person compromises.
Hardware security modules and strong key management practices are regularly used to protect access to administrative features or control high-value digital assets. When users wonder, “What happens if suspicious activity is detected?”, most leading operators maintain incident response protocols designed to pause compromised features and limit potential losses fast.
Continuous on-chain monitoring is another important defense tactic. Platforms often apply analytics and real-time alerts to quickly identify abnormal activity patterns. These tools are especially relevant within the social casino and sweepstakes casino sectors, where rapid detection helps protect daily rewards and the fairness of ongoing events.
Thorough post-incident analysis strengthens platform resilience by pinpointing what worked and what failed following a security incident. In the gaming sector, these lessons support ongoing trust, especially when disruptions could affect distribution of daily rewards, bonus coins, or influence fairness in sweepstakes-style entertainment.
Emergency pause mechanisms represent a critical operational safeguard that allows platforms to temporarily halt contract functionality when suspicious activity is detected or vulnerabilities are discovered. These circuit breakers must be carefully designed to prevent abuse while remaining accessible during genuine emergencies, often requiring consensus from multiple trusted parties before activation. Regular security drills and tabletop exercises help operational teams prepare for various incident scenarios, ensuring rapid and coordinated responses when real threats emerge. Insurance protocols and reserve funds provide additional financial protection, allowing platforms to compensate affected users even when technical safeguards fail
Doctor Who fans promised announcement about new Doctor in days

IFF to sell Food Ingredients unit for $4.3 billion

Crypto Funds Extend Sell-Off With $1.67B Weekly Outflows


-

 NewsBeat5 days ago
Israel says it has killed new Hamas military leader in Gaza City airstrikes
-

 Tech5 days ago
NASA taps Blue Origin to deliver lunar rovers for Moon Base initiative
-

 Politics7 days ago
Bridgerton Season 5: Cast, Release Date And Everything We Know So Far
-

 Sports6 days ago
2026 NBA Finals schedule, odds: Knicks await Thunder or Spurs after winning East
-

 News Videos5 days ago
XRP *JUST* SUCCEEDED!!!! CLARITY ACT EXPOSED!!! (SHE EXPOSED IT)
-

 News Videos3 days ago
This is BROKEN! INSANE 5x MONEY CAR WASH WEEK! The NEW GTA Online UPDATE Today! (GTA5 New Update)
-
Crypto World6 days ago
Micron Crosses $1 Trillion Market Cap as AI Demand Reshapes Memory Sector
-
 NewsBeat7 days ago
Hottest May day ever as London hits 34.8C in 2C leap from previous records
-

 Business5 days ago
Selena Gomez Reportedly Upset Over Benny Blanco’s Comments on Her ‘Terrible’ Diet
-
 Tech6 days ago
China assigns ID codes to 28,000+ humanoid robots
-

 Business7 days ago
Nikkei 225 Surges Past 65,000 for First Time as Iran Peace Hopes Fuel Record Rally
-

 Tech7 days ago
Microsoft’s quiet Claude Code retreat and the real cost of enterprise AI
-

 Tech3 days ago
Waymo dominates autonomous vehicle registrations as Tesla trails behind
-
 Entertainment7 days ago
‘Breaking Bad’ Star’s Easy-to-Binge 6-Part Crime Series Spin-Off Is Finally Heading to Free Streaming
-

 NewsBeat7 days ago
Crowds find riverside shade in York as temperatures soar
-
Tech5 days ago
The Samsung pay deal is the moment Korean unions changed register
-
 Tech2 days ago
SpaceX just won a second Golden Dome contract. This one is $4.16 billion.
-

 Entertainment6 days ago
Days of our Lives 2-Week Spoilers May 25-June 5: Gwen Rages, Abe Confesses & 2 Tragic Anniversaries!
-

 Tech7 days ago
Westone Audio and Etymotic Acquired by Fidelity Collective in Major IEM Market Move
-
 Entertainment6 days ago
Taylor Swift Fans Label Travis Kelce’s Beer-Chugging A ‘Red Flag
You must be logged in to post a comment Login