
Crypto World
Cardano News: Preview Network Milestone Tracking the 80% SPO Threshold for Mainnet

Cardano van Rossem hard fork news landed on the preview test network on May 5, with Intersect, the member-based organization coordinating Cardano’s technical roadmap, confirming both the governance action submission and the release of Cardano Node version 11.0.1 Pre-Release simultaneously.
The upgrade moves Protocol Version 11 one step closer to mainnet, with the critical variable now shifting entirely to SPO (Stake Pool Operator) readiness: at least 85% of stake pools by active stake must upgrade before ratification can proceed.
For ADA holders watching the Voltaire era governance machinery run in real time, this is the preview phase working exactly as designed.
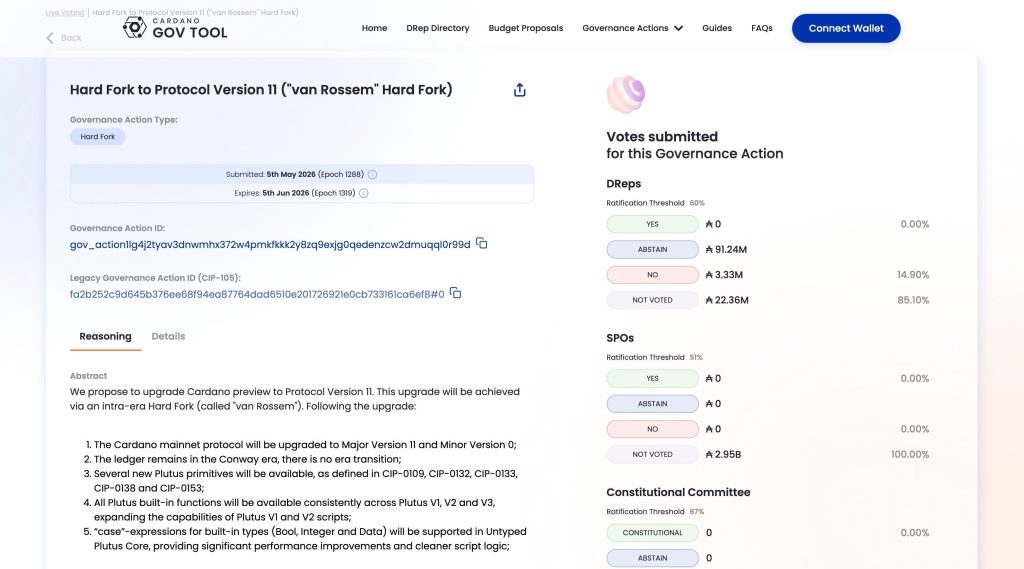
Node 11.0.1 is the first release to formally support Cardano’s intra-era hard fork mechanism – meaning the chain upgrades protocol version without triggering an era transition out of Conway.
Transaction shape doesn’t change. Ecosystem disruption is structurally minimized. The release also bumps cardano-api and cardano-cli to their 11.0 series and advances the experimental hard fork target to protocol version 12, signaling the development pipeline is already looking beyond the current upgrade.
The upgrade bundles five new Plutus primitive sets, defined in CIP-0109, CIP-0132, CIP-0133, CIP-0138, and CIP-0153, and unifies built-in functions across Plutus V1, V2, and V3. That last point matters: existing V1 and V2 scripts gain access to the full expanded built-in set after the fork, which expands DApp capabilities without requiring contract rewrites.
Discover: The best crypto to diversify your portfolio with
What are the 85% SPO Threshold News Triggers for Cardano
The 85% active-stake threshold is not a soft target; it is a constitutional requirement embedded in Cardano’s governance framework.
Under the rules established through the Voltaire era’s on-chain governance model, the hard fork governance action cannot be ratified until SPOs representing at least 85% of active stake have upgraded to a node version supporting Protocol Version 11.
DReps (Delegate Representatives) and the Constitutional Committee must also vote before the action is enacted on-chain.
The threshold logic exists to prevent a chain split. If a critical mass of block-producing nodes hasn’t upgraded, the network risks producing incompatible blocks at the fork boundary, the same failure mode that caused a mainnet chain partition in late 2025 when a malformed delegation transaction forced emergency SPO upgrades to node 10.5.3.
That incident made clear that SPO coordination isn’t procedural theater; it’s the actual security layer.
The current SPO upgrade percentage on preview is not yet publicly confirmed at a precise figure, but the historical pattern from prior Cardano hard forks, including the Chang upgrade cycle, suggests the initial wave of large, professionally run pools upgrades within the first 72 to 96 hours of a preview release.
Smaller home-hosted pools typically lag by one to two weeks. Community tracking tools, including Cardano Scan and PoolTool, are the live data sources to watch as the count climbs toward the 85% mark.
Intersect’s announcement was direct:
“ATTENTION
The van Rossem Hard Fork GA has been submitted to the Preview test network today. Cardano Node version 11.0.1 Pre-Release is also now available. This version is an essential requirement to safely cross the hard fork. SPOs, DApps, and developers are urged to upgrade immediately.”
The Chang hard fork experience – where exchange and dApp lags delayed mainnet activation even after SPOs crossed the initial threshold – means the pressure is now on the full ecosystem stack, not just pool operators.
Discover: The best pre-launch token sales
The post Cardano News: Preview Network Milestone Tracking the 80% SPO Threshold for Mainnet appeared first on Cryptonews.


Ethereum (ETH) is sitting at a crossroads that, according to a popular analyst, could define the next major chapter for the second-largest cryptocurrency.
That call landed as the asset slipped almost 4% in 24 hours, failing at the $2,400 range while facing growing pressure from short sellers betting against a near-term recovery.
What the Weekly Chart is Telling Us
Crypto analyst EGRAG CRYPTO posted a detailed breakdown on X on Thursday, arguing that ETH has spent a significant period compressing inside what he describes as a “massive Ascending Triangle structure” on the weekly timeframe.
The asset has continued to respect what he calls the macro “ETH Line,” a long-standing support level that has anchored the chart for years.
The setup is binary, at least in the near term, since a breakdown from the current structure points toward $1,600, which EGRAG labeled the “structural failure zone,” while a successful breakout would target $4,800 at the initial trigger level.
They also floated a much larger upside target of $33,000 if euphoric market conditions return, though their near-term focus stayed on the fight between support and resistance.
“$4,800 = breakout trigger. $1,600 = structural failure zone. ETH is approaching decision time,” they wrote.
The market right now is in an uncomfortable holding pattern. Fellow trader Ted Pillows posted that ETH has repeatedly failed to hold above $2,400, and that spot demand was still weak.
“Until that changes, ETH will continue to underperform the market,” he claimed.
That assessment matches up with on-chain positioning data shared by analyst CW8900 earlier today, who noted that high-leveraged long positions have decreased noticeably while short interest has risen slightly.
According to them, there’s a cluster of short positions sitting between current prices and $2,500, with a clean break above that level having the potential to trigger a quick move toward $3,000.
Why the Backdrop Is More Bullish Than Price Suggests
There are other supporting signals outside the chart that suggest ETH’s weakness may be temporary.
For example, a CryptoOnchain report from Tuesday noted a sharp rise in Ethereum staking inflows, with the seven-day average going from around 28,200 to nearly 144,000 by May 5, removing more ETH from liquid circulation and possibly reducing selling pressure in case demand holds steady.
Elsewhere, analyst Ali Martinez pointed out that ETH had rallied more than 30% since a SuperTrend buy signal flashed in mid-March.
That move brought the asset to its Realized Price, sitting around $2,380, which represents the average value at which all tokens last moved on-chain. Breaking and holding above it would shift most ETH holders from being underwater to being in profit, which on past occasions became a point where selling pressure softened.
Further, he identified $2,772 and $2,921 as the next meaningful supply concentrations above that level.
After briefly touching $2,400 yesterday, Ethereum had dropped back closer to $2,300 at the time of writing. But the drop notwithstanding, it’s still up about 11% over the past month and roughly 27% on the year.
The post Ethereum Nears Critical Breakout Point as Analyst Eyes $1.6K or $4.8K Move appeared first on CryptoPotato.
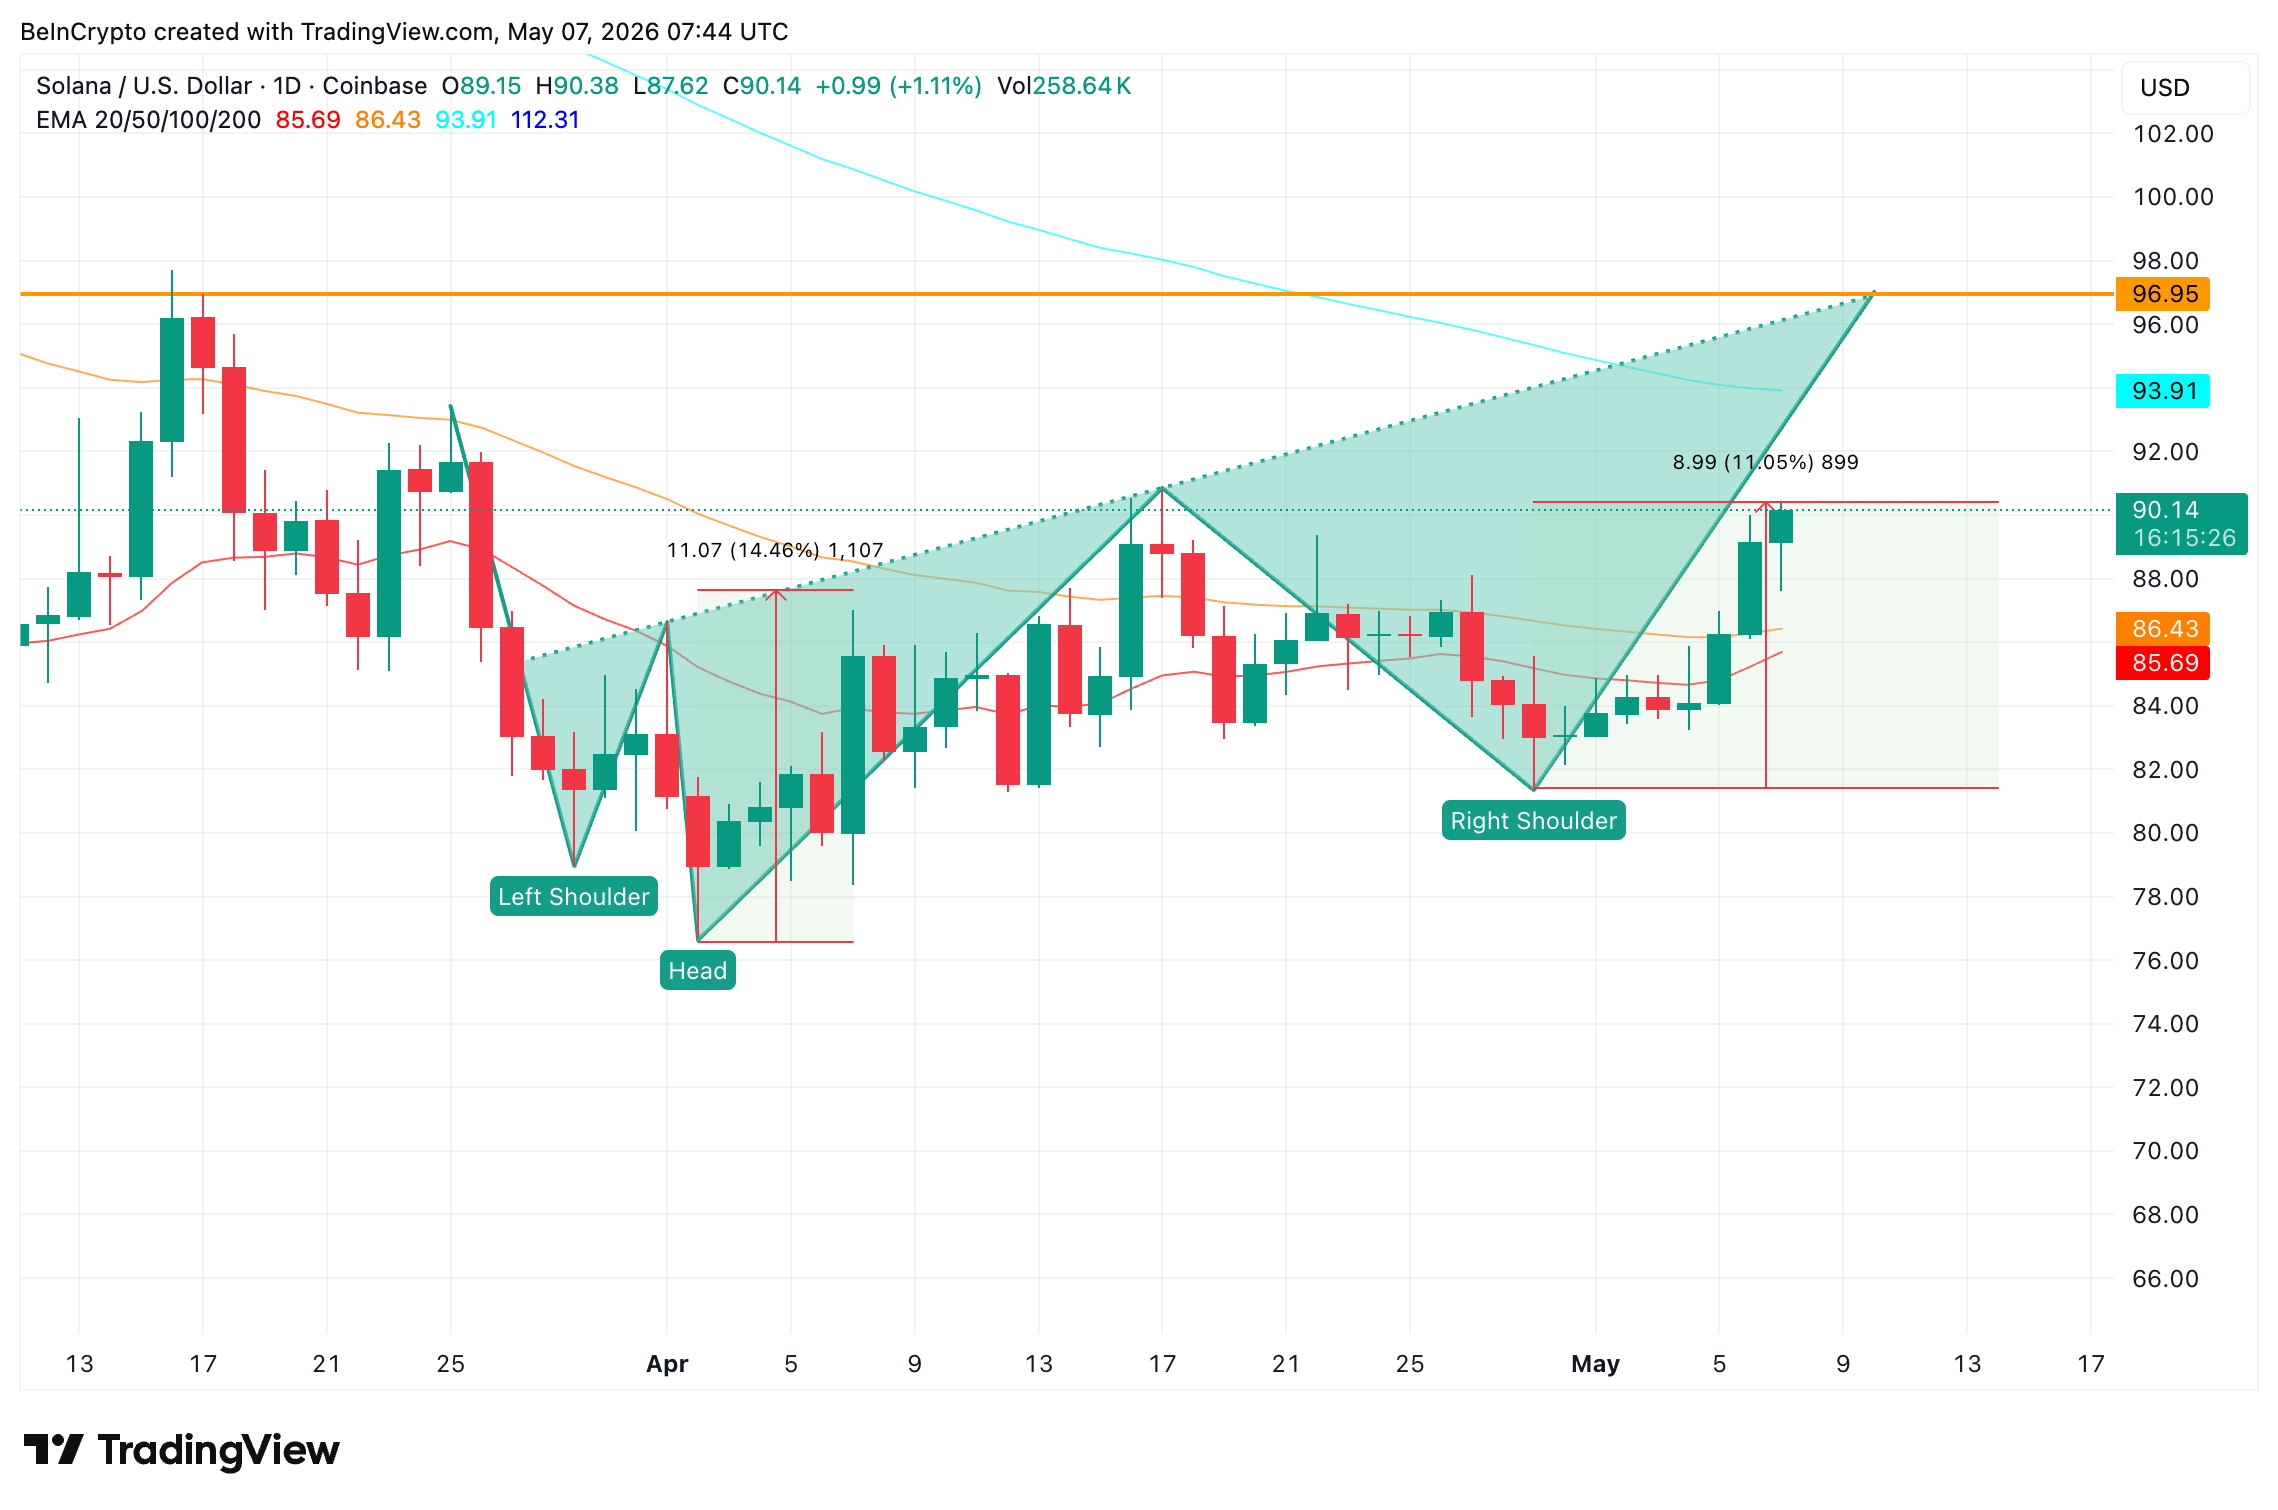
Solana (SOL) price trades near $90 with the daily chart printing a familiar bottoming structure as buyers flip exchange flow back to net outflows for five straight sessions.
The setup links an 11% rebound, a developing reversal pattern, and a fresh shift in spot demand. Whether SOL converts that into a 14% breakout depends on a heavy supply cluster sitting just above price.
Price Builds Reversal Structure on 11% Rebound
The daily chart shows Solana carving an inverse head-and-shoulders since late March. The right shoulder formed in late April. SOL has rallied roughly 11% off that floor, working back up toward the neckline that defines the breakout trigger.
Want more token insights like this? Sign up for Editor Harsh Notariya’s Daily Crypto Newsletter here.
The moving average stack adds context. The 20-day exponential moving average (EMA), a trend indicator that gives weight to recent price moves, is closing in on the 50-day for a potential bullish crossover.

Both shorter EMAs sit below the 100-day EMA, which still caps the rally from above. A confirmed bullish cross marks the first momentum signal. Also, the possible price reclaim of the 100-day EMA at around 93.91 makes the second momentum cue.
Pattern follow-through, however, still depends on flow data backing the bid.
Buyers Pull SOL Off Exchanges as a Supply Cluster Comes Into View
Glassnode data shows the exchange net position change has flipped to buying. The metric tracks SOL flowing in and out of exchanges. April 22 through May 1 ran heavy on inflows, with single-day readings reaching almost 1.4 million SOL pushed onto exchanges.
That trend reversed. For five straight sessions through May 6, SOL has been pulled OFF exchanges. The latest day printed 543,961 SOL in net outflows. The shift suggests buyers may be absorbing supply faster than sellers can place it.

A second on-chain layer reinforces the read. Glassnode’s cost basis distribution heatmap maps the price ranges where holders acquired their coins. The metric shows roughly 5.41 million SOL is concentrated in a tight band sitting just above current price.
That cluster historically acts as resistance. Holders at break-even tend to sell into strength, especially when their entry was a recent bottom.

If these holders do not sell into the strength and keep holding the stash, the 14% breakout thesis might start making sense. For now, pattern, flow, and supply distribution all line up. The price ladder now reveals where each pivot sits on the chart.
Solana Price Levels That Decide the 14% Breakout
With the pattern, flow flip, and supply cluster aligned, the focus shifts to the price ladder. Technical levels drawn from the right-shoulder low at $81.29 show that SOL is now fighting the 0.618 level at $90.03.
A clean reclaim opens $92.41 (0.786 Fibonacci). That level overlaps with the 5.41 million SOL cost basis cluster between $91.70 and $92.43. The cluster acts as the first major supply wall.
Above that sits the 100-day EMA at $93.91, the next moving average hurdle. The neckline of the inverse head-and-shoulders runs at $96.95. A clean break activates the pattern. The measured move projects 14.45% upside, taking SOL toward $111.00.

The downside ladder is just as defined. Failure to hold above $90.03 exposes $86.69 (0.382) and $84.63 (0.236). A loss of $81.29, the right-shoulder floor, weakens the entire Solana price pattern.
The flow flip and pattern setup lean toward the upside read. The 5.41 million SOL supply cluster has yet to be tested, however, and the 100-day EMA still sits above the rally. A close above $96.95 separates a 14% Solana price breakout toward $111.00 from a slide to the $81.29 invalidation floor.
The post Solana Bulls Reclaim Control After Weeks of Selling, Eye 14% Breakout appeared first on BeInCrypto.
Crypto World
Changelly report highlights growing stablecoin use in everyday spending ahead of May 15 infrastructure discussion

Changelly uncovers the main stablecoin trends for 2026, and hosts a podcast with Stablerail on stablecoin infrastructure every business must build on May 15, 2026.
May 6, 2026 — Changelly has published new findings on stablecoin usage trends, indicating a shift from trading-focused activity toward everyday payments, portfolio liquidity management, and consumer spending behavior.
The report combines Changelly platform data from 2025 with survey results conducted jointly by Changelly and Simple among more than 3,000 users. According to the findings, stablecoins are increasingly being used as active financial tools rather than solely as trading infrastructure.
To further explore these developments, Changelly will host a live discussion titled “The Rise of Stablecoins: Infrastructure Every Business Must Build” on May 15, 2026. The session will feature John Adam Khandjian, CGO at Changelly, and Alex Emelian, CEO and Co-Founder of Stablerail, discussing how stablecoin infrastructure is evolving for businesses involved in international transactions.
Stablecoin activity expands beyond trading
According to the report, stablecoin supply surpassed $300 billion in 2025, while annual on-chain transaction volume approached $46 trillion.
Changelly’s internal data showed that:
- 23.78% of completed transactions involved stablecoins
- Stablecoin transaction sizes were approximately five times larger than non-stablecoin transactions
The report also found that stablecoin swap participation increased 33% year-over-year, while flows between crypto assets and stablecoins remained relatively balanced, suggesting users increasingly treat stablecoins as an active liquidity layer rather than solely a defensive asset.
Everyday spending behavior becomes more visible
Survey data conducted by Changelly and Simple indicated broader stablecoin use in day-to-day spending activity:
- 60.6% of respondents reported spending through crypto-linked cards
- Average transaction sizes were approximately €40
- Most spending activity was concentrated in categories such as groceries and transportation
The findings suggest that stablecoin usage patterns are increasingly resembling traditional debit card behavior.
The report also identified education and user understanding as a more significant barrier than infrastructure. While 59% of crypto card users reported no technical issues, 58% of non-users cited lack of understanding as the primary obstacle to adoption.
Upcoming discussion on stablecoin infrastructure
The May 15 discussion will focus on the role of stablecoins in international payments and digital financial infrastructure.
Topics expected to be covered include:
- The role of stablecoins as an onboarding layer into crypto
- The shift from passive holding toward active spending and usage
- Why product design and user understanding are becoming increasingly important drivers of adoption
The session will include a 20-minute discussion followed by a live Q&A segment.
About Changelly
Changelly is an instant crypto exchange platform and a trusted crypto API provider serving over 600 companies and 12 million users worldwide. It offers secure crypto-to-crypto exchange, fiat on-ramp/off-ramp APIs, and crypto payment processing. Discover how businesses can enhance their crypto offerings with Changelly’s business products. Follow Changelly on LinkedIn for updates on new features and industry trends.
About Stablerail
Stablerail is the AI neobank for stablecoin-native companies moving 6–8 figures monthly. One self-custodial account to hold, swap, pay, invoice, get fiat IBANs, spend on cards, and earn yield. AI screens every payment for sanctions, taint, and policy match before anyone signs.
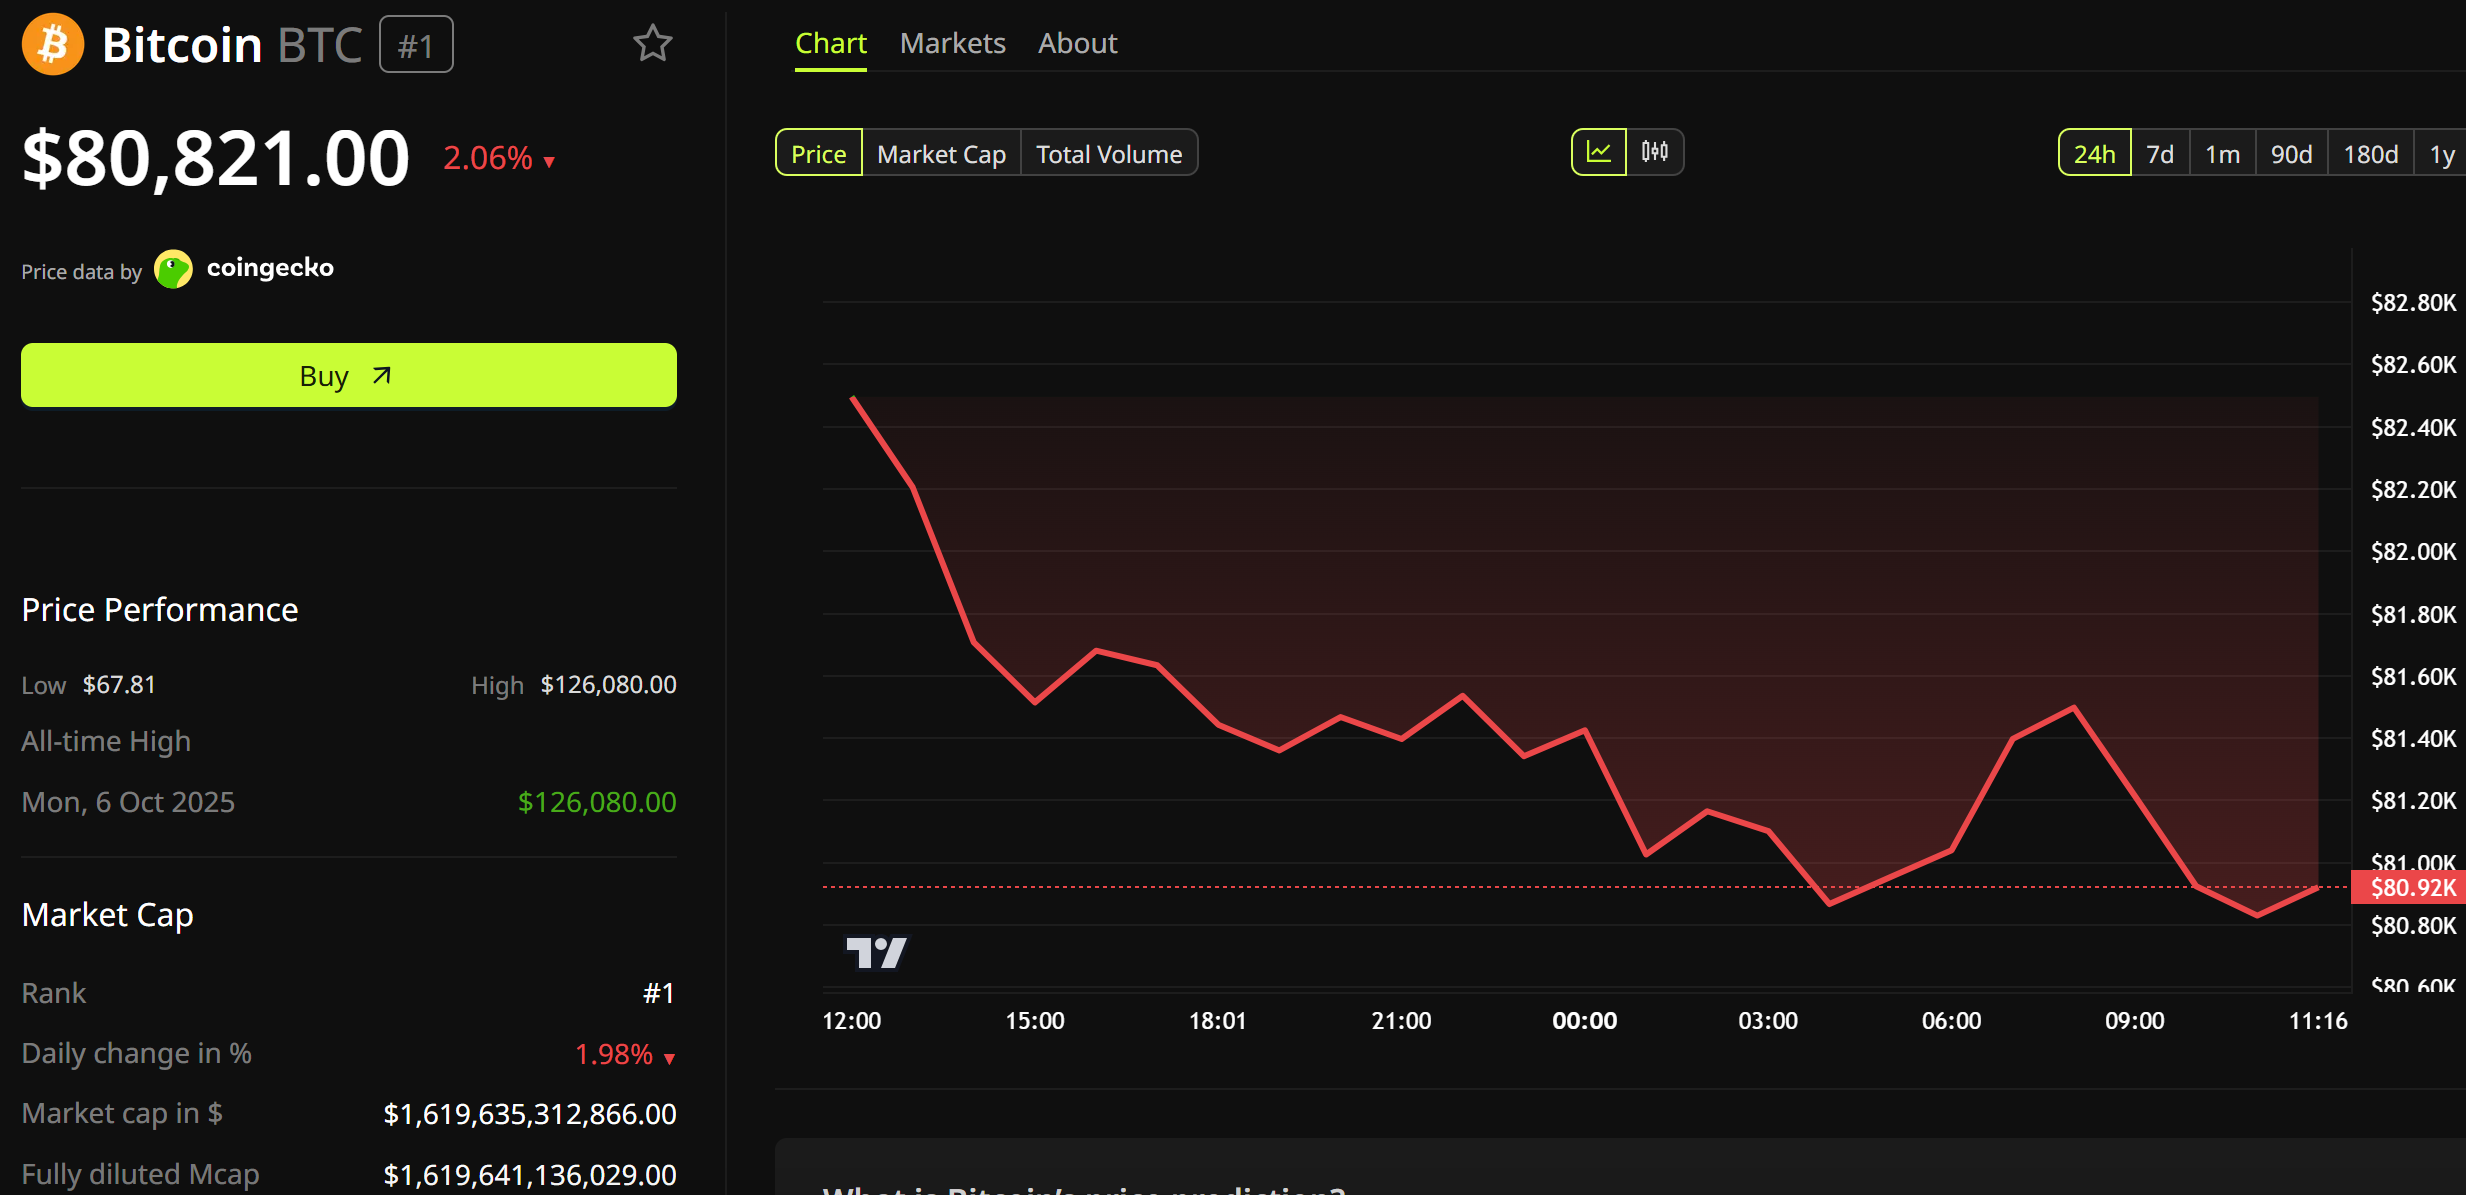
Bitcoin’s (BTC) relief rally to $82,000 appears to be cooling off, and analysts say key levels must be reclaimed for BTC price to “confirm a durable continuation higher.”
Key takeaways:
- Bitcoin must break resistance at $85,000-$88,000 to confirm that the bottom is in.
- Profit-taking on rallies must cool down for a sustained breakout in BTC price.
Bitcoin must reclaim $88,000 as support
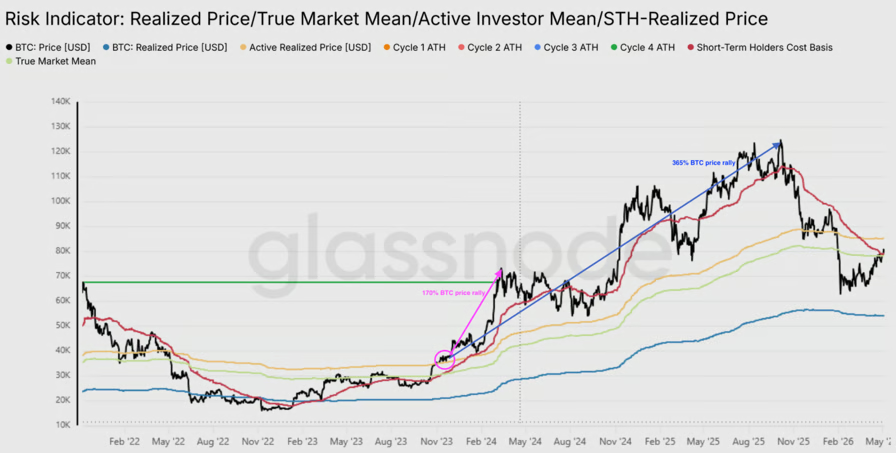
Bitcoin’s 7% climb over the last week to $81,000 saw it reclaim key levels, including the true market mean at $78,200 and short-term holder (STH) cost basis at $79,100.
If the price sustains above these two levels, the 50% drawdown from the $126,000 all-time high to sub-$60,000 levels in February “would rank among the shortest episodes of its kind in Bitcoin market history,” Glassnode said in its latest Week Onchain newsletter, adding:
“Attention now shifts to the next major resistance at the Active Realized Price near $85.2K, which tracks the cost basis of all non-dormant supply and represents the next structural threshold the market must reckon with.”
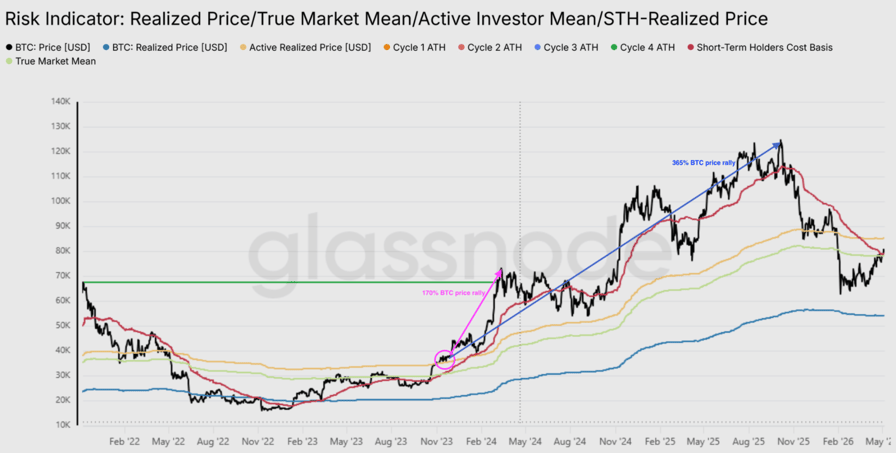
Bitcoin risk indicator. Source: Glassnode
The last time Bitcoin reclaimed its active realized price, in October 2023, it was followed by a 170% rally to its previous all-time high of $74,000 reached in March 2024. These gains increased to 365% once the price hit its current record highs above $126,000.
Related: Bitcoin Bollinger Bands push key breakout as creator acts on ‘positive’ signal
Bitcoin’s realized price by age cohorts reveals other major levels of resistance sitting higher up: the realized price of the three-to-six-month investor cohort at $88,880, the 12-month-18-month cost basis at $93,450 and the average purchase price of the six-to-12-month investor cohort at $111,850.
“For the bottom to be confirmed, price needs to clear $88.88K and hold – not wick through, not retest and fail,” CryptoQuant analyst IT Tech said in a Thursday Quicktake note, adding:
“Until then, every rally into $85K-$88K is walking straight into distribution from November 2025-Feb 2026, buyers desperate to get out flat.”
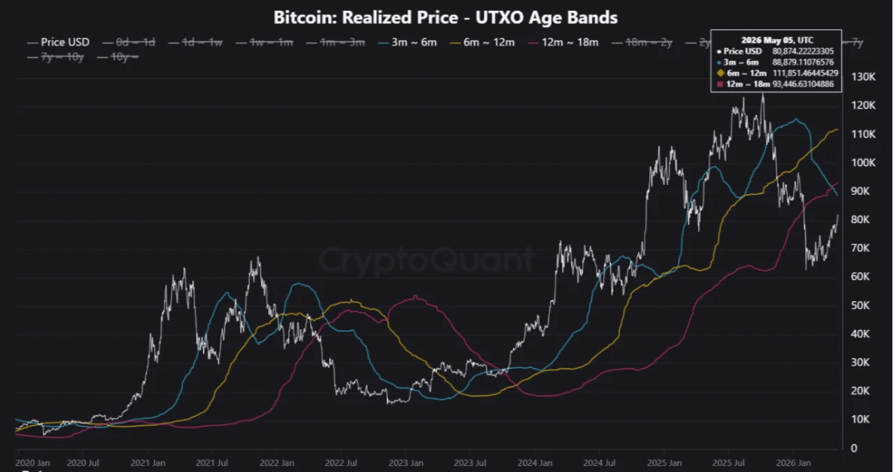
Bitcoin realized price – UTXO age bands. Source: CryptoQuant
A sustained move above that level could put recent buyers back in profit and reduce sell pressure, confirming a “durable continuation higher,” Glassnode added.
Analyst MikybullCrypto highlighted Bitcoin’s core levels of resistance before a “mega solid trend change,” including $88,000 and $92,000, based on Fibonacci level analysis.
“Overcome these resistances, then $100K is guaranteed.”
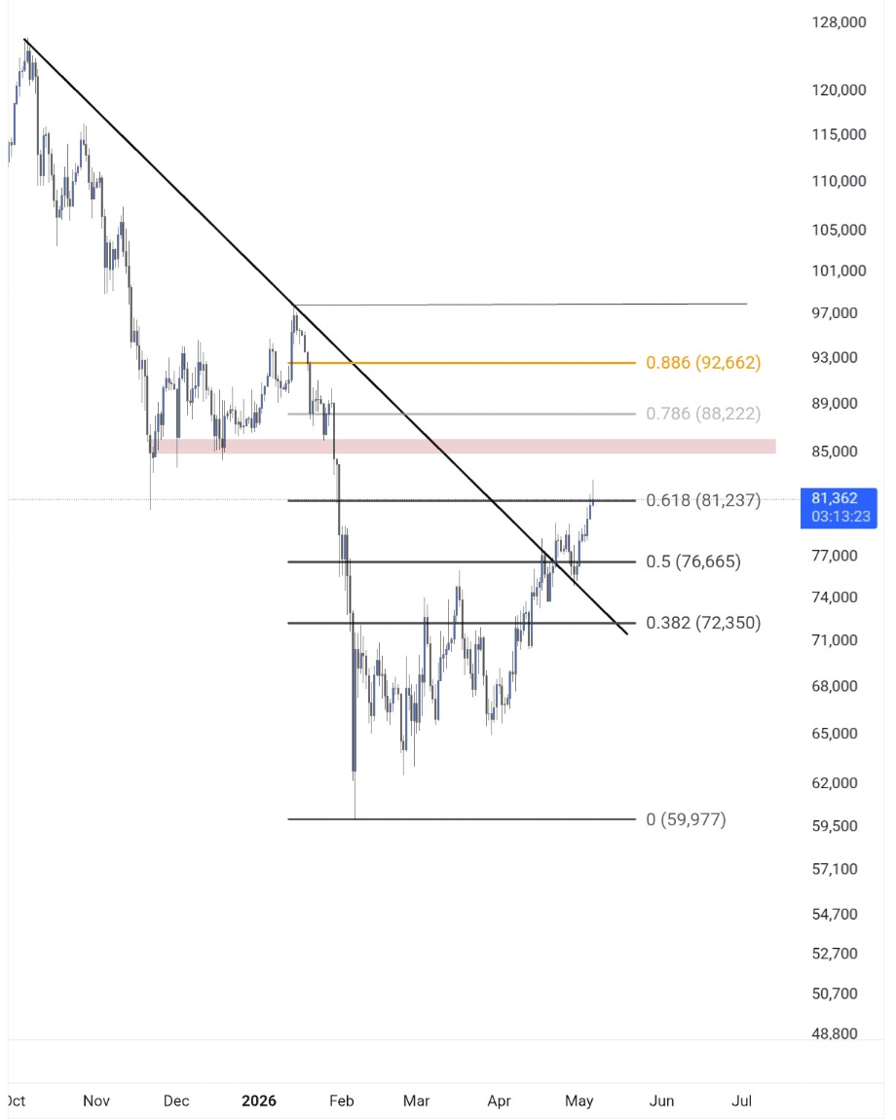
BTC/USD daily chart. Source: MikybullCrypto
Profit-taking by long-term holders could delay BTC price recovery
Bitcoin’s current pullback below $81,000 could be attributed to increased profit-taking by long-term holders.
Additionally, the 14-day simple moving average of profit realized by investors who have held BTC for more than one year has increased to about $180 million per day following the recent rally.
Should the current recovery continue, “this distribution pressure is likely to intensify,” Glassnode said, adding:
“The market’s ability to absorb this gradual increase in supply while sustaining the price above the True Market Mean will be the defining test of whether the current recovery has genuine structural legs.”
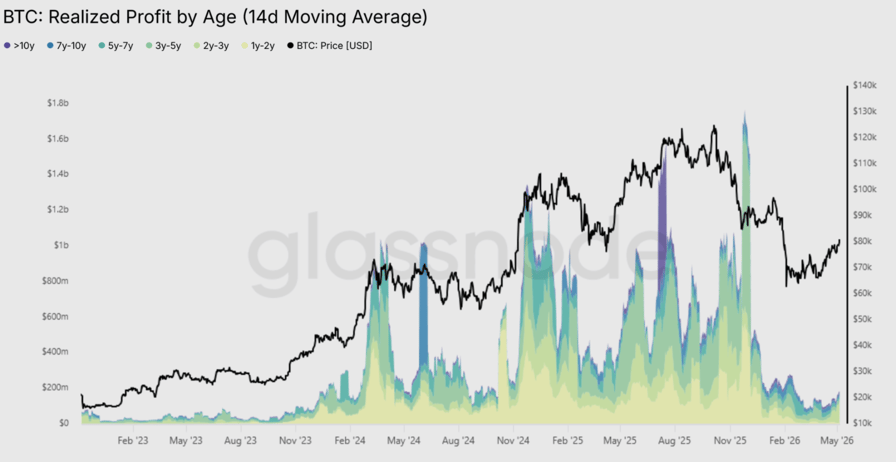
Bitcoin realized profit by age. Source: Glassnode
Meanwhile, realized losses remain elevated at $479 million per day, approximately 140% above the $200 million per day cycle baseline.
A sustained compression of this indicator below $200 million per day would serve as a strong indicator that selling exhaustion is setting in and confirm a “more durable recovery regime,” Glassnode said, adding:
“Until that threshold is reached, the dual weight of long-term holder profit taking and top-buyer distribution at thin loss margins is likely to anchor the current rally.”
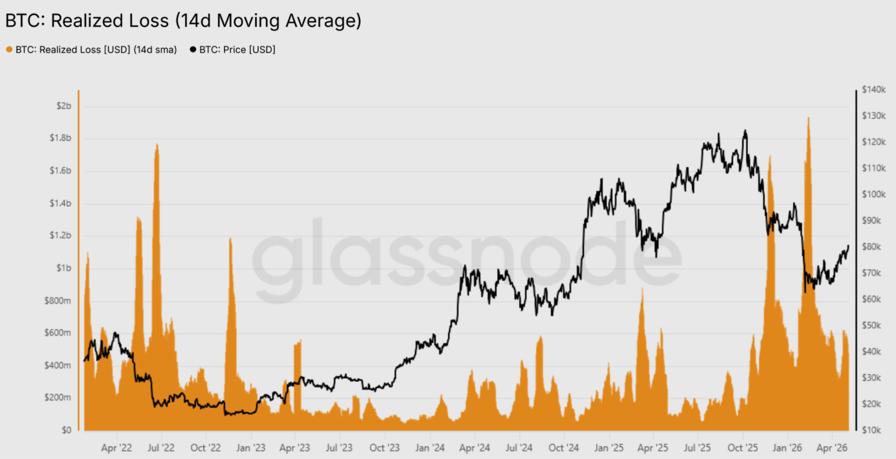
Bitcoin realized loss. Source: Glassnode
Crypto World
$202 Million Bitcoin Whale Move Ignites Supercycle Buzz as Legendary Signals Flash Bullish
A new Bitcoin (BTC) whale wallet withdrew 2,500 BTC worth $202 million from Binance in one hour Thursday. The transfer drew attention from on-chain trackers monitoring smart money flows.
The withdrawal landed alongside a cluster of bullish technical signals from named analysts. Among them, a position change from John Bollinger and a rare weekly RSI reset flagged by market quants.
Bitcoin Whale Move Tightens Exchange Liquidity
Lookonchain shows wallet bc1qhx received the funds in two transfers, 2,250 BTC and 250 BTC, plus a small test. Exchange outflows of this size often reflect accumulation or self-custody by an institutional buyer rather than retail movement.
The withdrawal lands at a moment when Bitcoin exchange reserves have tightened. Reduced sell-side liquidity on centralized venues can amplify upside moves, particularly when paired with structural demand from regulated buyers.
Bitcoin traded near the $80,000 area through the period, reflecting a partial recovery from the recent dip. Replies to the Lookonchain post leaned bullish, with traders citing accumulation rather than panic.

Bollinger and RSI Signals Add to the Bullish Cluster
John Bollinger created the Bollinger Bands indicator. His firm’s Tactica trend program flipped positive on Bitcoin and went fully invested. He flagged the position publicly on Wednesday.
Trader FinFreedom flagged the move on X, framing the indicator’s inventor going long as a contrarian bullish signal.
“The inventor of Bollinger Bands just took a position in Bitcoin…and you’re bearish,” he stated.
Quant analyst Frank cited data showing Bitcoin’s short-term holder MVRV bands breaking above the overheated zone. That marks the first such break since November 2024.
According to the analyst, the bands move with price, so the print is not automatically a top signal.
In the same tone, macro commentator Brett pointed to a separate signal on the weekly RSI. The metric dipped below 30 and crossed above 50, a pattern seen only four times before in Bitcoin’s history.

“Each time this has occurred, the bottom was in,” Brett said.
Whether the signal cluster marks a confirmed bottom remains an open question. The next weekly close will test whether the RSI cross holds.
Continued exchange outflows would add weight to the accumulation case. A failure to hold the cross could quickly cool the bullish narrative.
“Bitcoin’s rally into the mid $80ks has many bears questioning their thesis, especially as several key recovery signals are now starting to flip constructive. However, the road higher is unlikely to be smooth, and multiple major resistance zones still remain overhead,” analysts at Chokeonchain warned.
The post $202 Million Bitcoin Whale Move Ignites Supercycle Buzz as Legendary Signals Flash Bullish appeared first on BeInCrypto.
The price has entered a flat channel. Can it break away?
PI Network (PI) Price Predictions: Analysis
Key support levels: $0.16
Key resistance levels: $0.20, $0.28
PI is Stuck in a Channel
Since the price bottomed at 13 cents, PI has entered a range between 16 and 20 cents. The price has been trading between these levels since early March, and any attempt to break away was rejected.
For example, in late April, buyers tried to break above the 20-cent resistance, but the buying momentum was quickly stopped after the selling volume spiked twice. This pushed PI back towards the support at 16 cents.

Momentum is Flat
Momentum has turned flat without a clear direction since March as PI’s price bounced between the limits of its trading channel. This can also be seen across the momentum indicators that are bouncing around their mid-range.
While volume increased in late April and May, it was not enough to drive a breakout above 20 cents. However, another attempt at that key resistance could be successful. In such a case, bulls will target 28 cents next.

Daily RSI is Stuck Around 50
In the past week, the daily RSI has been hugging the midpoint at 50. This shows a lack of clear momentum, which has pushed the price to move sideways around 18 cents. Ideally, PI holds here to make a higher high which could build a bullish bias for an eventual breakout.
To build confidence in a breakout, the daily RSI will need to move above 50 points and approach 70, which would signal that buyers are returning. That can also coincide with a new attempt at breaking the $0.20 resistance.

The post Pi Network (PI) Price Predictions for This Week appeared first on CryptoPotato.
Crypto World
Whirlpool says Iran war causing ‘recession-level industry decline.’ The shares are down 20%
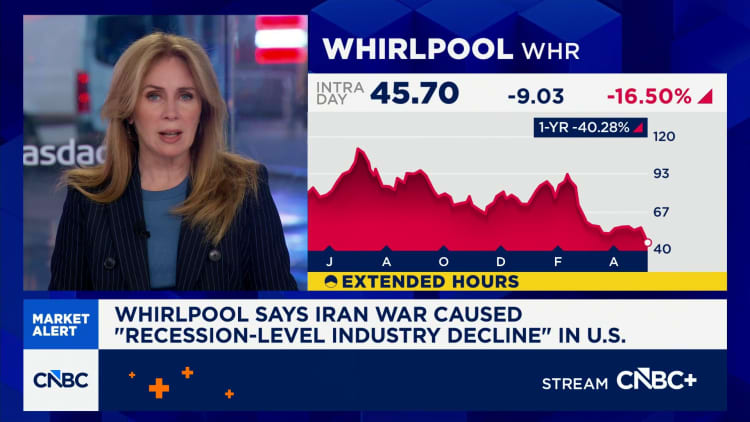

Whirlpool shares tumbled Thursday after the iconic appliance maker warned that the war in Iran triggered a severe downturn, underscoring how sharply higher fuel prices and collapsing consumer confidence are beginning to weigh on big-ticket purchases.
“War in Iran resulted in recession-level industry decline in the U.S. as consumer confidence collapsed in late February and March,” the company said in its earnings filing.
The comments marked one of the starkest corporate warnings yet about the economic fallout from the conflict and contrasted with more resilient spending trends recently highlighted by companies tied to travel and services.
Shares of Whirlpool, maker of washers, dryers, dishwashers and other home appliances, dropped a whopping 20% in premarket trading.
CEO Marc Bitzer said Whirlpool moved quickly to cut costs and adjust pricing as macroeconomic conditions deteriorated.
“We acted decisively to address pricing and costs in the face of rapid deterioration in macroeconomic conditions,” Bitzer said in a statement. “Now, with Section 232 changes in favor of domestic manufacturers, Whirlpool Corporation is structurally positioned to win with our American-made products.”
The company also slashed its full-year earnings guidance roughly in half, cutting its forecast to a range of $3 to $3.50 a share from a prior outlook of about $6 a share. Whirlpool said it would also suspend its dividend as it prioritizes paying down debt.
Analysts at JPMorgan said the lower earnings outlook was driven by higher raw material inflation, a larger net tariff impact and weaker price and product mix benefits.
While companies such as Uber and Disney have reported little evidence of consumers pulling back on travel, entertainment and convenience spending, the comments from the Maytag parent suggest strain may be emerging in bigger-ticket categories such as washers, dryers and kitchen appliances.
Consumer confidence, according to a University of Michigan survey, touched a record low at one point in April as the Iran war spiked gasoline prices. The stock market has rebounded since mid-April on hope the U.S. and Iran could come to a deal that ends the fighting. U.S. oil prices are still above $90 a barrel, however, as traders wait to see if a peace proposal can be worked out.
Toncoin price went parabolic this week, surging more than 100% after Telegram founder Pavel Durov announced a major strategic overhaul that places Telegram directly at the center of The Open Network ecosystem.
Summary
- Toncoin price surged more than 100% this week after Telegram founder Pavel Durov announced that Telegram would take direct control of TON ecosystem development.
- Telegram became the network’s largest validator and introduced the “Make TON Great Again” roadmap focused on scaling, faster transactions, and deeper Telegram integration.
- TON rallied after transaction fees were reduced to near-zero levels and the Catchain 2.0 upgrade improved block times to roughly 400 milliseconds.
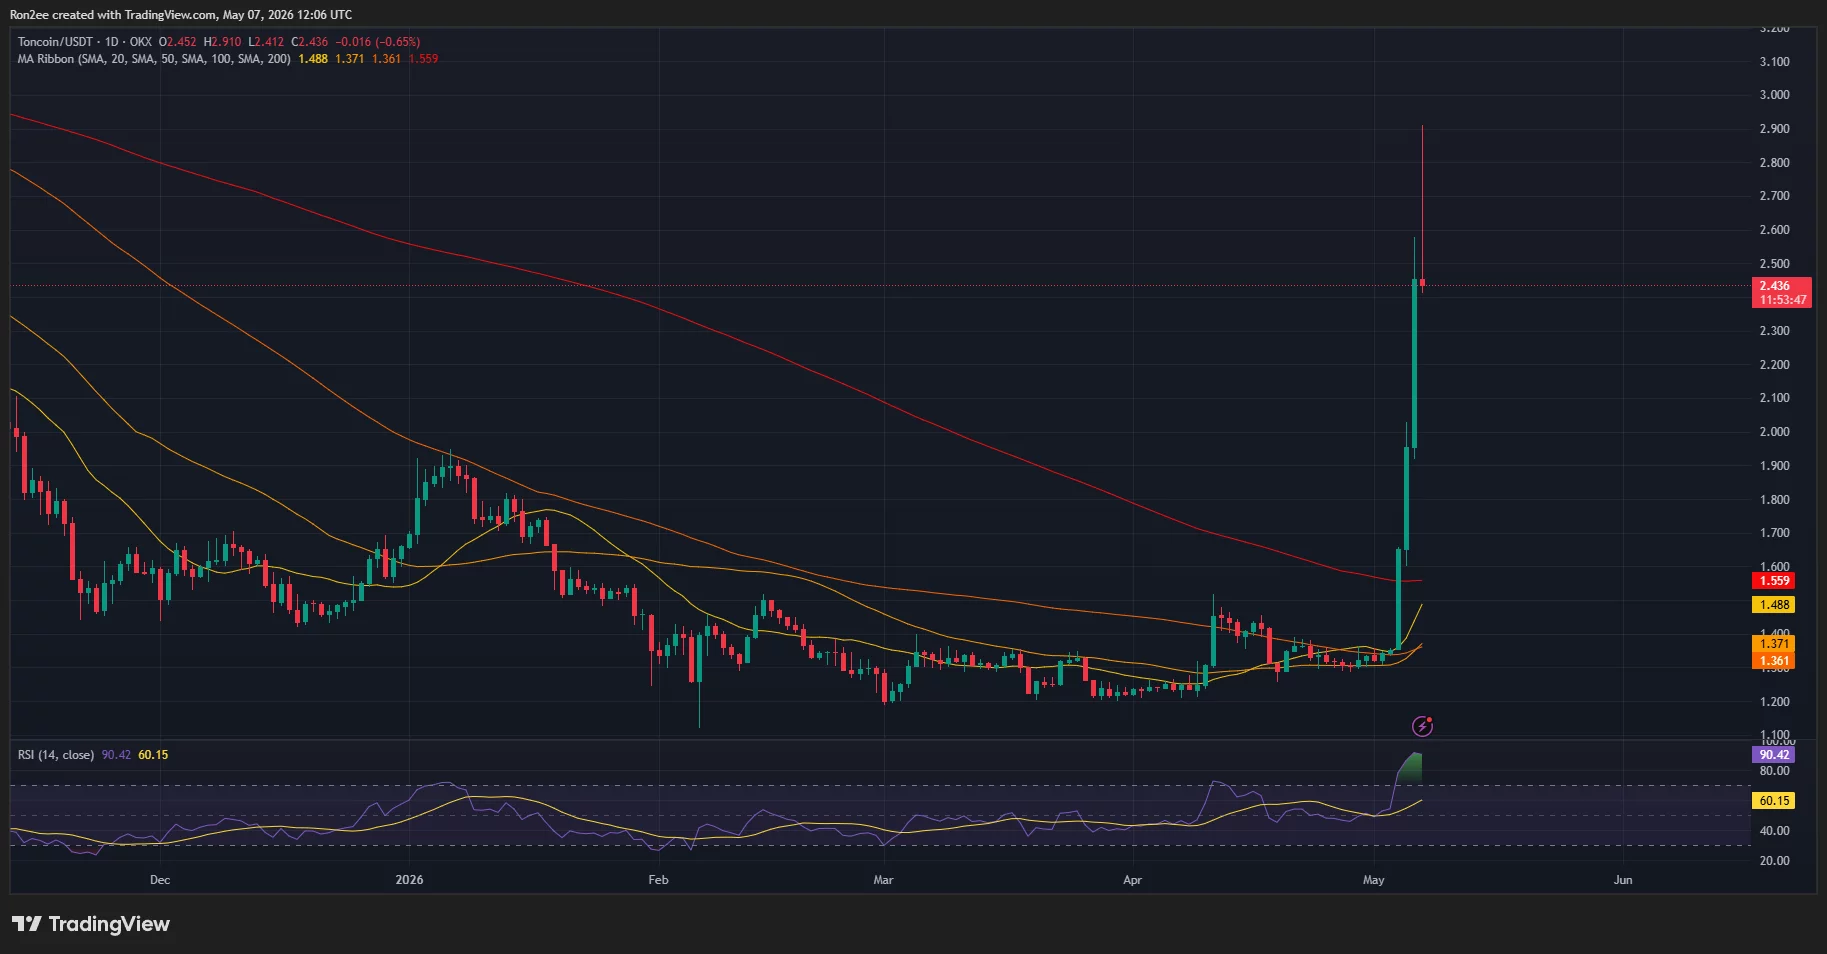
According to data from crypto.news, Toncoin (TON) climbed from below $1.20 earlier this week to as high as $2.90 on Wednesday before stabilizing near $2.43 at press time. The explosive move made TON one of the best-performing large-cap cryptocurrencies over the past seven days.
The primary catalyst behind the rally came after Durov revealed on May 4 that Telegram would replace the TON Foundation as the main force driving network development and adoption.
As part of the shift, Telegram has reportedly become the largest validator on the network after staking millions of TON tokens, aligning the company’s interests more directly with the blockchain’s long-term growth and stability.
Durov also introduced a new roadmap dubbed “Make TON Great Again,” or MTONGA, which outlines a seven-step strategy focused on scaling infrastructure, improving transaction speeds, and expanding TON’s integration across Telegram’s ecosystem of over 1 billion users.
Investor sentiment strengthened further after the network sharply reduced transaction fees by nearly sixfold to around $0.0005, a move aimed at making TON more attractive for microtransactions, mini-apps, and consumer payments.
At the same time, TON’s recent Catchain 2.0 infrastructure upgrade significantly improved network performance by lowering block times to roughly 400 milliseconds, allowing near-instant transaction finality.
The combination of deeper Telegram integration, faster infrastructure, and lower transaction costs triggered aggressive buying activity across spot and derivatives markets, while short liquidations accelerated upside momentum.
On the daily chart, Toncoin price confirmed a powerful breakout from a prolonged accumulation range after exploding above the key $1.60 resistance zone.

The rally also pushed TON above its 200-day moving average near $1.55, reinforcing bullish momentum and signaling a possible shift in long-term trend direction.
Momentum indicators suggest buyers remain firmly in control despite signs of short-term overheating.
The RSI surged above 90, reflecting extremely strong buying pressure, though such elevated levels could also signal a temporary cooling-off period or near-term volatility ahead.
At the same time, the moving average ribbon has started turning bullish, with shorter-term moving averages crossing back above longer-term averages following weeks of sideways consolidation.
If bullish momentum continues, traders could next target the psychological $3 level, followed by the broader resistance region near $3.20.
On the downside, failure to hold above the $2.00 breakout zone could trigger profit-taking and a retest of support near the $1.60–$1.70 range before another upward move.
Disclosure: This article does not represent investment advice. The content and materials featured on this page are for educational purposes only.
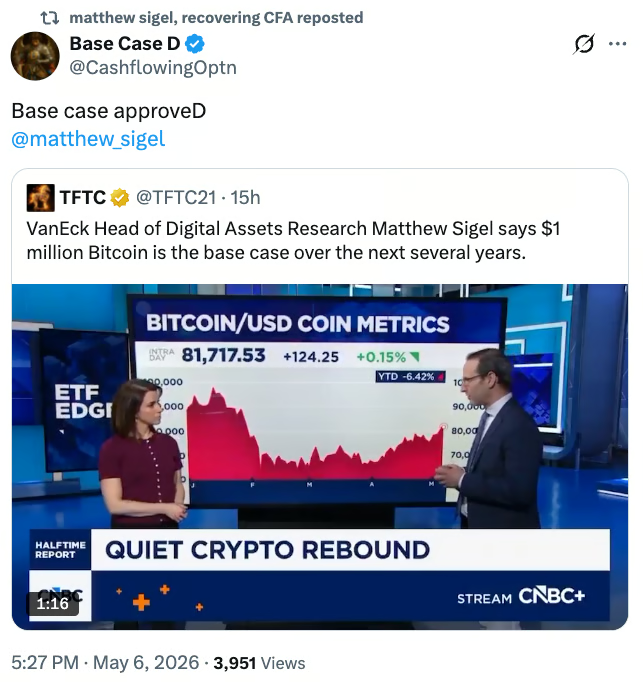
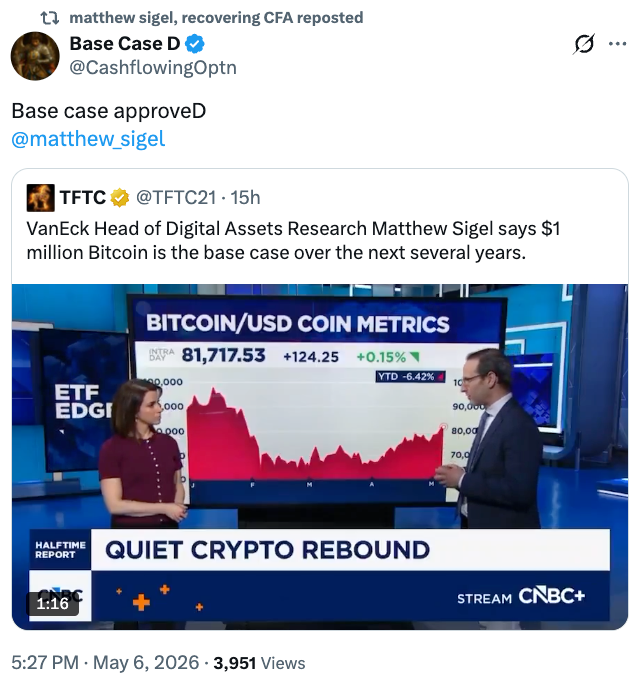
Matthew Sigel, head of digital assets research at investment manager VanEck, said he sees Bitcoin (BTC) reaching seven figures within the next five years.
“Bitcoin going up for us is the base case. We think this asset is going to reach a million dollars over the next several years,” Sigel said on CNBC’s Halftime Report on Wednesday.
Sigel later clarified that BTC is likely to reach that threshold in “half a decade,” comparing Bitcoin’s adoption to the video game industry’s, where usage has expanded across age groups after initially being limited to younger users.
“It’s going to be like the video game industry, where 30 years ago it was just kids playing video games, now Elon Musk plays video games,” he said.
Sigel’s latest projection aligns with VanEck’s base-case model, which estimates Bitcoin could reach $2.9 million by 2050, underscoring a longer-term bullish outlook despite periods of market volatility.
Bitcoin is a “mega trend,” but marked by volatility
Despite a highly bullish outlook, VanEck’s Sigel emphasized that Bitcoin is a “very cyclical asset,” saying its path toward $1 million would not be a steady upward move.
“There are no bailouts in Bitcoin, so it’s going to be cycles along the way,” Sigel said, hinting at the absence of a central authority to stabilize prices during market downturns.
Source: Matthew Sigel
“We have the first central bank buying Bitcoin for its reserves, so this is a mega trend, but it will be very volatile along the way,” Sigel added.
Near-term market positioning is negative
Addressing Bitcoin’s near-term price action, Sigel pointed to the asset’s correlation with the Nasdaq reaching its highest level in five years, suggesting the current rally is largely driven by broader macroeconomic trends.
“What keeps us encouraged even at the current levels is that we’re not seeing the froth in the derivatives markets,” he said, adding that the move appears to be driven primarily by short covering, indicating that overall positioning remains relatively bearish.
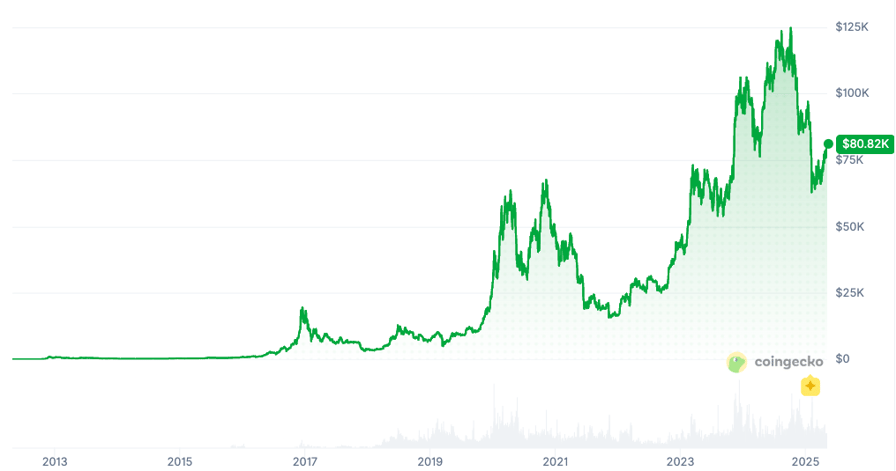
Bitcoin’s (BTC) all-time price chart. Source: CoinGecko
Sigel’s take joins several similar views on Bitcoin’s price trajectory in the coming years, including predictions from Bernstein, Bitwise chief investment officer Matt Hougan, Jan3 CEO Samson Mow and Twitter co-founder Jack Dorsey, among others.
Cathie Wood’s ARK Invest’s 2030 Bitcoin price targets range from about $300,000 in a bear case to $710,000 in a base case and $1.5 million in a bull case, according to its Big Ideas 2025 model.
Related: Bitmine’s Tom Lee says ‘crypto spring’ has already begun
Some investors are more skeptical about Bitcoin’s adoption, though. Ray Dalio has said Bitcoin could act as a store of value but questioned its ability to scale into a global reserve asset amid regulatory and sovereign currency risks. Others, including gold advocate Peter Schiff, have argued Bitcoin lacks intrinsic value and is unlikely to displace traditional safe-haven assets like gold, casting doubt on seven-figure price forecasts.
Magazine: Adam Back says current demand is ‘almost’ enough to send Bitcoin to $1M


Crypto conference attendees in Miami apparently have a deodorant problem, prompting disgusted fellow event goers to take to social media to complain about the smell.
CEO of Solana infrastructure firm Helius Labs, Mert Mumtaz, who was in Miami for Consensus 2026, one of the largest crypto summits, asked on X, “what is it with crypto mfers and not knowing what deodorant is.”
Read more: Dubai flood leaves TOKEN2049 conference goers feeling ‘liquidated’
Meanwhile, a crypto influencer known as “Liv,” who was also in Miami for events hosted by Solana, Pengu, and Tessera Lab noted, “I swear some of the men don’t use deodorant and they have like a 5 feet radius around them.”
Other crypto users echoed this sentiment, claiming that girls often complain that the “men at crypto conferences stink.”
The problem appears to be so bad that another influencer, “Bangerz,” actually praised the events held by Tessera Lab and Sophie Maxx for being free of bad odours.
“You wouldn’t believe it but i went to a web3 event and everyone was wearing deodorant and it smelt like italian pasta,” Bangerz posted.
Read more: Bitcoin 2026 opens to empty seats, protests, awkward moments
Crypto influencer “Gigi,” who has complained previously about the lack of deodorant at crypto events, attempted to nip the problem in the bud, posting, “please remember to wear deodorant.”
Some users suggested that crypto summits should offer gift packages with blockchain-themed mints and deodorant, while others joked that event bouncers should be “checking how you smell” instead of looking for weapons or contraband.
These confrences are hot
It’s no surprise that some are struggling to stay sweat-free, with temperatures in Miami already hitting over 30 degrees Celsius. In 2025, temperatures at Token2049 in Dubai reached over 40 degrees.
Many crypto users sarcastically warned attendees at the time not to wear deodorant and just enjoy the nights out deodorant-free.
Mumtaz, however, wasn’t among them, taking to X at the time to complain about deodorant use.
He jokingly asked attendees to wear deodorant, or else he would “call the police and tell them you’re in possession of several hard drugs,” adding that it’s “nothing personal.”
Got a tip? Send us an email securely via Protos Leaks. For more informed news and investigations, follow us on X, Bluesky, and Google News, or subscribe to our YouTube channel.

Cup Of Chamomile Tea Could Save Garden From Fungus
Bryson DeChambeau lays out 2 demands for PGA Tour return

Apple Watch Series 12 Rumors
Manchester United reach agreement with Casemiro over contract clause amid transfer speculation

US brings back mandatory military draft registration

Steven Gerrard disagrees with Gary Neville over ‘shock’ Chelsea and Arsenal claim | Football


-

 NewsBeat4 days ago
Channel 5 – All Creatures Great and Small series 7 new post
-

 Crypto World5 hours ago
Upbit adds B3 Korean won pair as Base token gains Korea access
-
 Tech6 days ago
Trump’s 25% EU auto tariff breaches Turnberry Agreement that also covers semiconductors and digital trade
-
 NewsBeat7 hours ago
NCP car park operator enters administration putting 340 UK sites at risk of closure
-
 Sports6 days ago
Paul Scholes issues Marcus Rashford reality check as agreement emerges over Man United star
-

 Entertainment6 days ago
Met Gala 2026 Rumored Guest List Is Turning Heads
-

 Business6 days ago
Strait of Hormuz Blockade Persists Amid US-Iran Standoff, Sending Oil Prices Soaring
-
Entertainment6 days ago
New on Prime Video in May 2026 — Full List of Movies and Shows
-

 Sports6 days ago
Cavaliers vs. Raptors Game 6 live score, updates, highlights from 2026 NBA playoffs first-round series
-

 Tech6 days ago
Meta ends Sama contract after Kenyan workers report seeing intimate footage from Ray-Ban smart glasses users
-
 Sports6 days ago
David Benavidez responds to team Canelo saying the fight will never happen
-

 Entertainment6 days ago
Kylie Jenner Hit With Second Lawsuit From Ex-Housekeeper
-

 Entertainment6 days ago
Young and the Restless Next Week: Cane Arrested & Matt’s Deadly New Scheme!
-
Entertainment5 days ago
New Netflix Movies in May 2026 — My Top 3 Picks to Stream
-

 Business4 days ago
Luka Doncic Injury Update: Doncic’s Hamstring Recovery Slows Lakers’ Hopes Against Thunder: Can He Run Yet?
-
 Sports6 days ago
IPL 2026: ‘Love you darling’- Hardik Pandya’s reaction to MS Dhoni steals the show |Watch | Cricket News
-
 Crypto World5 days ago
Pi Network Mandates Protocol 23 Upgrade for All Mainnet Nodes Before May 15 Deadline
-

 Entertainment4 days ago
Melissa Joan Hart and More Stars Attend 2026 Kentucky Derby
-

 Sports6 days ago
Bayern won’t hand bottom side Heidenheim ‘gifts’ despite PSG game
-
 Sports6 days ago
Jasprit Bumrah: What’s gone wrong? Jasprit Bumrah’s disastrous IPL 2026 – 132 Avg, 2 wickets in 8 games | Cricket News
You must be logged in to post a comment Login