
Crypto World
Ethereum Tests Key Range Support as Monthly Structure Signals Critical Turning Point

TLDR:
- Ethereum is nearing a multi-year support zone, where demand has historically driven strong price reversals.
- Monthly chart structure shows ETH moving within a defined range between $1,500 and $5,000 levels.
- Tightening volatility suggests a breakout may occur soon as price compresses near key support.
- Traders monitor for bullish confirmation signals before positioning within the current range setup.
Ethereum is approaching a critical support range on higher timeframes, as recent market structure points to a prolonged consolidation phase.
Analysts are closely watching price behavior near key levels, where risk-to-reward setups tend to favor strategic positioning within established boundaries.
Ethereum Tests Range Extremes on Higher Timeframes
Recent analysis shared by market participant Lennaert Snyder points to Ethereum revisiting a key monthly support zone.
His observations focus on a “sell-to-buy” candle that initiated the move toward the all-time high. That area now acts as a technical reference for long-term traders.
According to the tweet, price is testing the lower boundary of a multi-year range. This zone aligns with previous demand and remains a focal point for potential accumulation.
The presence of a long wick in that candle suggests liquidity remains in that region. Markets often revisit such wicks before establishing a directional move.
The broader monthly structure presents a clear cycle. Ethereum surged during 2020 and 2021, followed by a sharp decline in 2022.
Since then, price has moved sideways, forming a wide horizontal range. This structure indicates a market without a strong directional trend.
The range is defined by resistance near $4,800 to $5,000 and support between $1,500 and $1,700. These levels have repeatedly acted as turning points. Buyers tend to step in near the lower boundary, while sellers dominate near the upper limit.
Snyder’s commentary suggests that testing this lower range extreme could offer favorable setups. Traders often seek entries in such zones due to tighter risk control. However, confirmation through price action remains essential before any directional bias is established.
Consolidation Phase Signals Potential Expansion
On lower timeframes, Ethereum reflects a similar pattern of compression. After a sharp decline earlier this year, price stabilized and moved within a narrower range. This aligns with the broader monthly structure, reinforcing the idea of consolidation.
Technical indicators show reduced volatility, as Bollinger Bands have tightened. This typically precedes larger price movements, although direction remains uncertain. At the same time, momentum indicators indicate weakening bullish pressure in the short term.
Price currently trades near the middle to lower portion of its recent range. Resistance remains firm around $2,200 to $2,300, while support sits near $1,900. These levels act as immediate barriers within the broader structure.
The projected path shared in the analysis suggests a possible dip into deeper support. This move could sweep liquidity before a potential reversal. Such behavior is common in range-bound markets, where stop levels attract price action.
Two scenarios remain in focus. If Ethereum holds the lower support zone, a gradual move toward mid-range levels near $3,000 could follow. Continued strength may then push price toward the upper boundary of the range.
On the other hand, a breakdown below $1,500 on a monthly close would shift the structure. This would indicate a loss of support and open the door for further downside. Market participants continue to monitor these levels closely as price approaches a decision point.
As Ethereum trades near range extremes, attention remains on confirmation signals. The coming months are expected to provide clearer direction within this established structure.


Key Highlights
- First inflation measurements since Iran conflict began: March CPI and February PCE reports scheduled
- March employment report showed 178,000 new positions, surpassing the 65,000 forecast
- Crude prices surged more than 50% following war outbreak, pushing gasoline beyond $4 nationwide
- Delta Air Lines earnings Wednesday will reveal jet fuel expense impact on carrier profitability
- Major indices snapped five consecutive weeks of declines, climbing at minimum 3%
Investors are preparing for a pivotal week featuring critical inflation measurements, quarterly corporate results, and continued monitoring of the Iran conflict’s economic ramifications.
Last week’s trading session saw the S&P 500 advance 1.6%, while the Dow Jones climbed 1.2%, and the Nasdaq Composite surged 2.2%. The rally ended a five-week decline for all three benchmarks. Year-to-date, the S&P 500 and Dow remain lower by 3.8% and 3.2%, respectively.
Friday’s employment data for March significantly exceeded analyst projections. The report revealed 178,000 nonfarm payroll additions versus consensus estimates of 65,000. This represented a sharp reversal from February’s 92,000 job losses.
“The message here is equilibrium,” noted Gina Bolvin, president of Bolvin Wealth Management Group. “Robust employment growth diminishes pressure for immediate rate reductions, though it doesn’t alter the overall deceleration pattern.”
Michael Feroli, JPMorgan Chase’s chief US economist, indicated the figures provided “somewhat greater assurance that economic expansion can absorb the current energy cost surge without substantial lasting harm.”
Critical Inflation Measurements Approaching
Thursday delivers the February Personal Consumption Expenditures index, an inflation gauge the Federal Reserve prioritizes. Analyst consensus projects a 0.4% monthly advance and 2.8% annual growth.
Friday presents the more significant release: March’s Consumer Price Index. Forecasters anticipate a 0.9% monthly increase and 3.4% annual rise. February’s CPI registered 2.4% annually. This upcoming report represents the initial measurement incorporating Iran war-related pricing effects.
National average gasoline prices exceeded $4 per gallon last week, per AAA data. Goldman Sachs analyst Ben Shumway noted escalating costs are “contributing to further deterioration in consumer sentiment from previously depressed readings.”
Andy Schneider, senior US economist at BNP Paribas, observed that “supply disruptions in the Strait of Hormuz have materialized while tariff impacts continue spreading,” noting that “initial petroleum price transmission will be reflected in March figures.”
Goldman economist Manuel Abecasis characterized the present supply disruption as “less worrisome than previous instances that generated inflation challenges,” pointing to its constrained scope and range.
Corporate Results and Conflict Implications
Delta Air Lines releases quarterly results Wednesday morning before market open. The carrier’s performance will illuminate how elevated aviation fuel expenses are impacting airline sector margins. Constellation Brands and Levi Strauss additionally report during the period.
#earnings for the week of April 6, 2026 https://t.co/hLn2sKQhEY $APLD $STZ $AEHR $DAL $BB $SMPL $GBX $LEVI $NEOG $KRUS $SKIL $WDFC $RELL $ERGP $LOT $XELB $RPM $SLP $CLIR $EVO $IQST $BYRN $PXED pic.twitter.com/aKqX72tj9u
— Earnings Whispers (@eWhispers) April 2, 2026
Street analysts forecast earnings expansion exceeding 13% across the S&P 500 overall, per FactSet data.
Oil prices have climbed over 50% during the five weeks since hostilities commenced. Shipping activity through the Strait of Hormuz remains virtually nonexistent. Trump conducted a Monday briefing alongside military leadership as his self-established deadline for strait reopening nears.
Capital.com analyst Daniela Hathorn observed that “investors have shifted from pricing in de-escalation scenarios to assessing escalation likelihood.”
Paola Rodriguez-Masiu, Rystad Energy’s chief oil analyst, indicated the temporary cushion that initially contained price increases from pre-conflict petroleum inventories is now depleting.
The Federal Reserve’s March policy meeting minutes release Wednesday at 2 p.m. ET. Market participants broadly anticipate the Fed will maintain current interest rates at its upcoming April session.
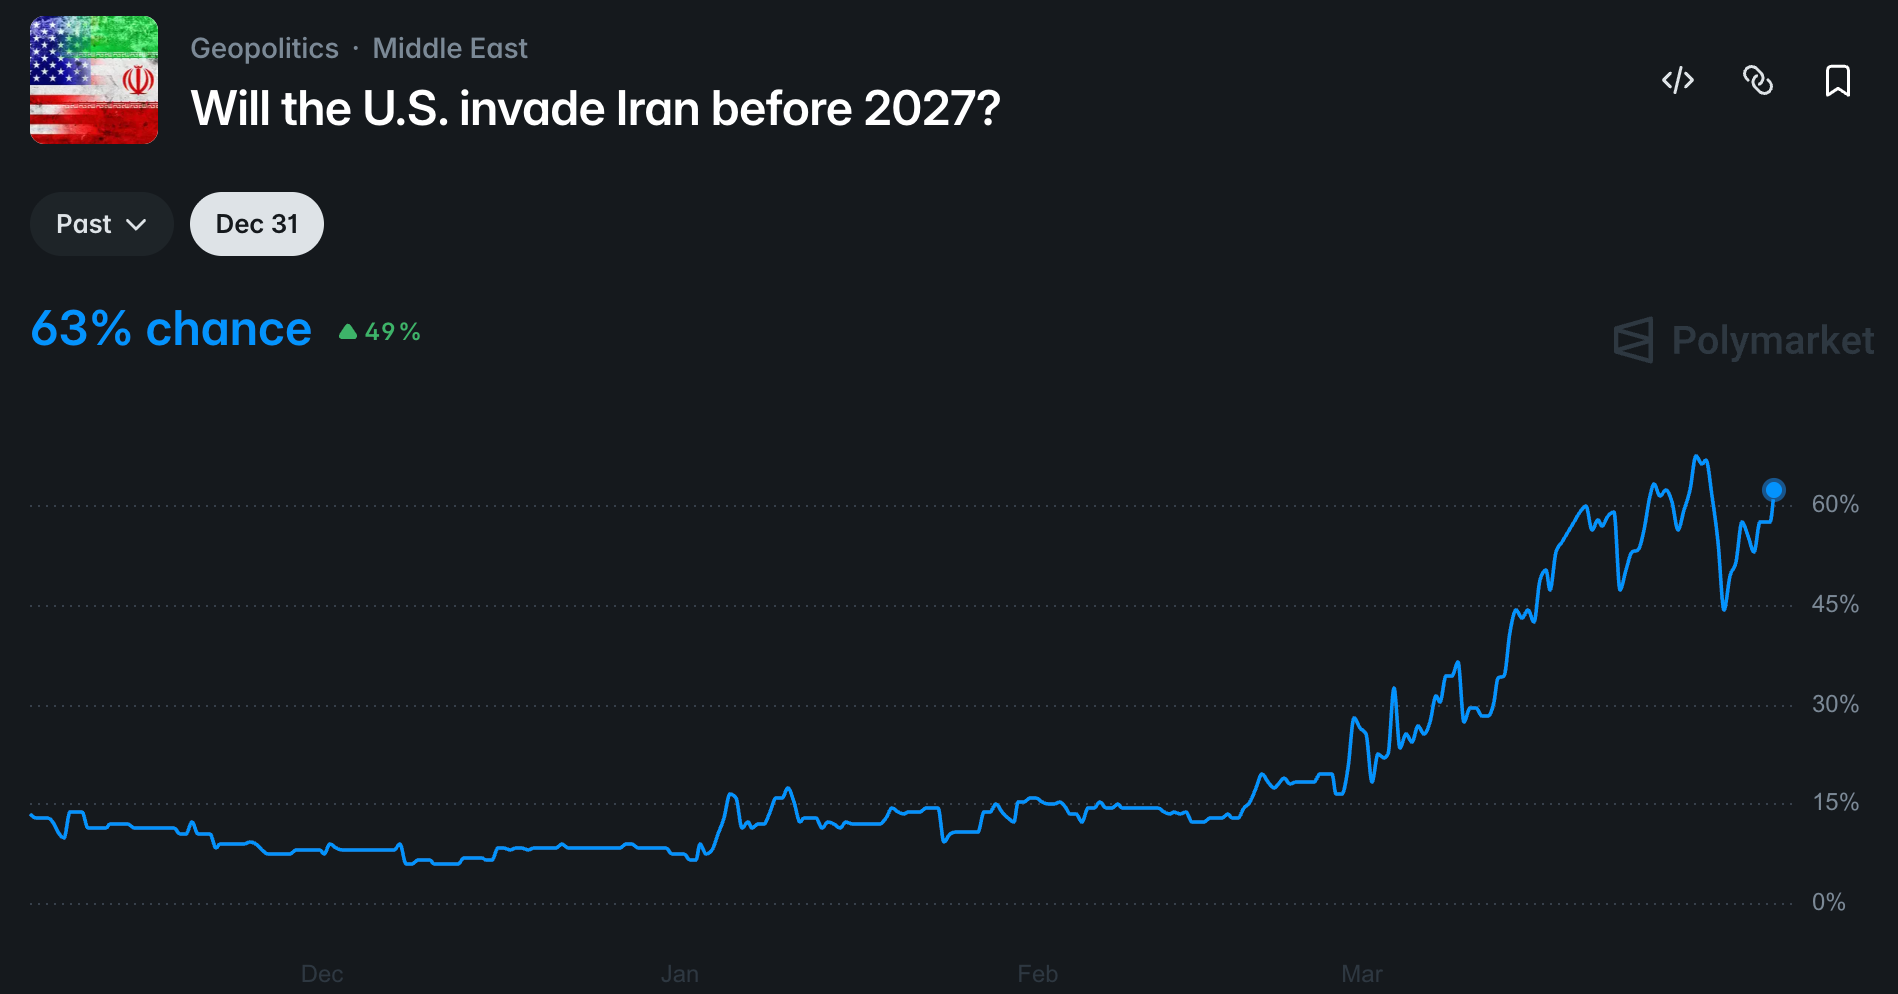
The odds of the United States invading Iran this year surged to 63% on the Polymarket prediction platform on Sunday, following comments made by US President Donald Trump on social media.
Despite the surge, the odds of an invasion before 2027 are still down from the high of 68% on March 29, due to a US troop buildup in the region and comments from the Trump administration that the United States was considering capturing Kharg Island, a major Iranian oil shipping station.
Volume on that prediction was about $3.74 million at the time of publication.

On Tuesday, after Trump signaled that the US might leave Iran in the next two to three weeks, Bitcoin (BTC) jumped by about 2.6% and the S&P 500 index to added about 2.91%. However, Trump reversed course with his latest statement on Sunday. He wrote:
“Tuesday will be power plant day, and bridge day, all wrapped up in one, in Iran. There will be nothing like it! Open the fuckin’ strait, you crazy bastards, or you’ll be living in hell.”
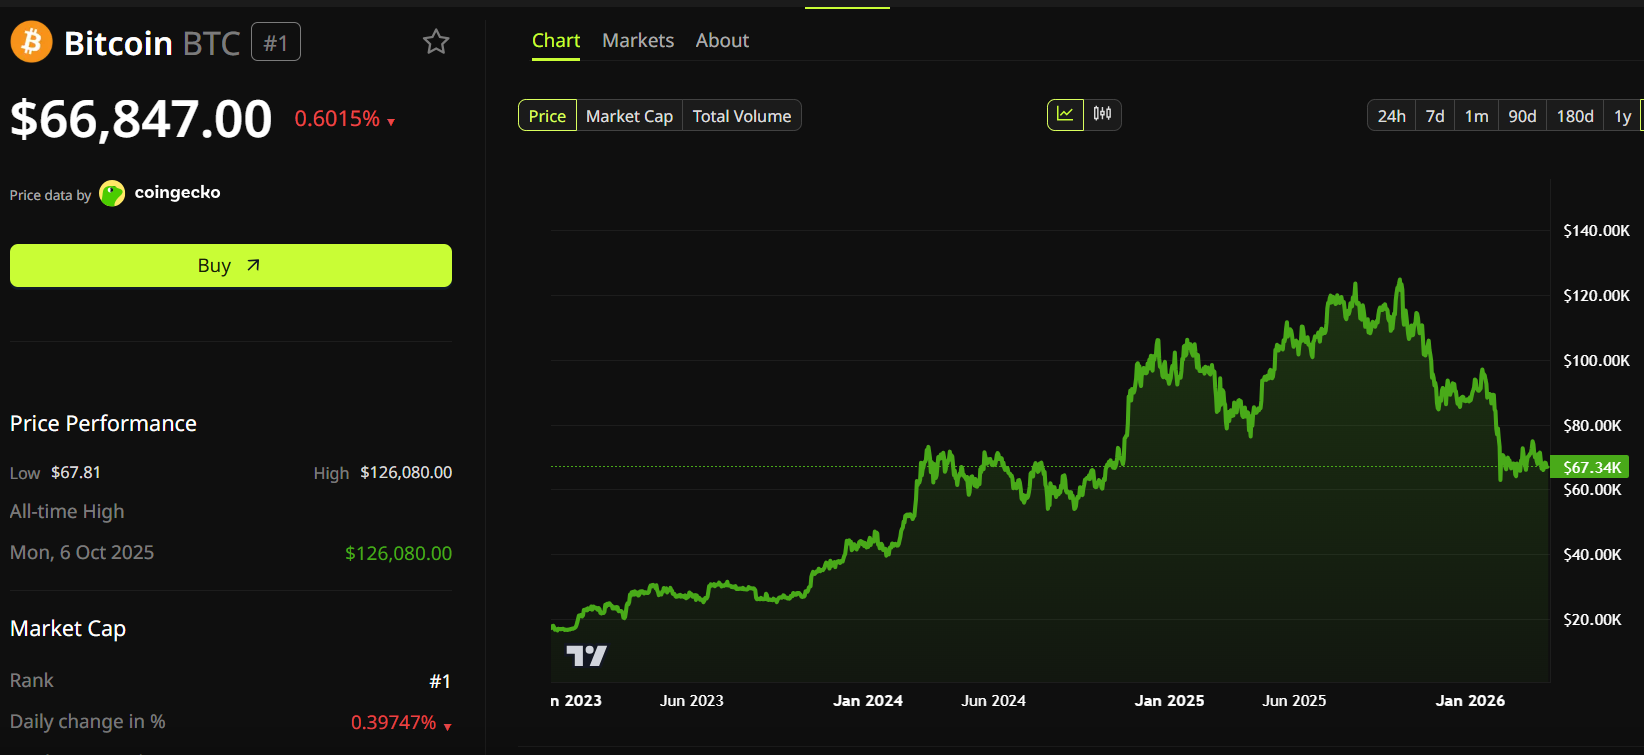
At last look, BTC was little changed, trading up less than 0.1% in the past 24 hours, remaining anchored around the $67,500 level, according to data from TradingView.
The mixed signals from the Trump administration on the war and how long it will last continue to create investor uncertainty and an impact on all risk asset prices, as market analysts, traders and economists attempt to forecast the effects of the war.

Related: Polymarket takes down market on missing US pilot after backlash
Trump’s comments draw a wave of online backlash, but asset prices barely budge
“I wish Trump would stop threatening Iranian civilian infrastructure. It’s a lose-lose for us: backing down hurts his negotiating credibility,” economist Peter Schiff said in response to Trump’s comments.
“Carrying it out escalates the war, damages US standing, generates sympathy for Iran and fuels Iranian hatred for America,” Schiff continued.
“I assumed this was a fake, it isn’t — wild,” podcaster and Bitcoin advocate Peter McCormack said.
Brent crude oil, the most widely used pricing benchmark for the international spot oil market, remains elevated, closing Thursday at more than $109 per barrel. Trading is scheduled to resume on Monday following the Easter holiday weekend.

The relationship between Bitcoin and US dollar–denominated liquidity is shaping how crypto markets behave in 2026. According to Sam Lyman, head of research at the Bitcoin Policy Institute, the coexistence of BTC with dollar-backed stablecoins like USDT has become a mutually reinforcing dynamic that benefits both sides of the ecosystem. In practice, the leading BTC trading pairs are anchored in USD, a reality that helps sustain demand for dollar liquidity even as crypto markets expand globally.
More than a simple trading pattern, the dynamic sits at the intersection of market structure, regulation, and geopolitics. Lyman argues that the BTC-dollar relationship mirrors the broader role the dollar plays in commodity and macro markets — a framework that has long been embedded in the way crypto trades are priced and settled. In his view, Bitcoin’s strongest leverage point remains its liquidity expressed in dollars, which challenges the notion that BTC could undermine the dollar system. The observation is supported by data showing the dominance of dollar-based markets for Bitcoin, a trend that Kaiko highlighted in its 2024 analyses of on-chain and off-chain activity.
Key takeaways
- Bitcoin’s liquidity core is anchored to USD trading, with BTC/USD pairs supported by stablecoins like USDT that maintain dollar-denominated rails for buyers and sellers.
- Regulatory direction in the United States — notably GENIUS Act-aligned stablecoin policy — could shape how dollar-pegged tokens operate within crypto markets without sacrificing the dollar’s role in liquidity provision.
- China’s stance remains a paradox: while Beijing reiterates a ban on permissionless crypto activity and push for a CBDC, Chinese mining pools still command a sizable share of global hashrate, underscoring control dynamics beyond formal prohibitions.
- The rise of the digital yuan and capital controls continue to influence cross-border flows, illustrating how policy choices in major economies can impact crypto market structure and risk exposure for miners and validators.
- Investor and builder attention should focus on regulatory clarity, mining geography shifts, and the evolving balance between centralized fiat rails and permissionless borderless networks.
The dollar–Bitcoin nexus in a changing regulatory and geopolitical landscape
At the heart of the current narrative is the “symbiotic” relationship between Bitcoin and dollar liquidity. Lyman notes that the largest BTC trading pair remains USD-based, a reality that makes dollar stability and regulatory certainty influential for crypto markets. Stablecoins pegged to the dollar, particularly USDT, act as a bridge for traders seeking quick exposure to BTC without stepping into traditional bank rails. This arrangement creates a feedback loop: as more capital flows into dollar-denominated BTC markets, the dollar’s role in crypto deepens, and stablecoins gain further prominence as liquidity vehicles.
The discussion around stablecoins is not purely technical; it sits squarely within a regulatory framework that currently anchors many of the market’s most important rails. Advocates of prudent regulation argue that stablecoins, if backed by robust reserves and transparent governance, can provide stable liquidity channels that bolster market depth and resilience. In this framing, policy proposals such as the GENIUS Act aim to codify oversight and guardrails for stablecoins. For observers and participants, the question is not whether stablecoins are here to stay, but how the rules of the road will shape innovation, settlement speed, and cross-border payments in the crypto economy.
On the data side, independent researchers have flagged the dollar’s dominance in BTC markets in 2024, with analyses from Kaiko illustrating the extent to which dollar-based trading pairs anchor liquidity. This backdrop matters for traders who rely on predictable settlement assets, and it informs long-term bets on infrastructure that underpins dollar-denominated trading, such as stablecoin liquidity pools, exchange markets, and on-chain custody solutions.
Policy, control, and China’s ongoing paradox
Policy tensions also extend beyond the United States. China has repeatedly framed Bitcoin and stablecoins as threats to the country’s capital controls, a central feature of its economic management. Lyman emphasizes that Beijing’s approach reflects a broader objective: to keep financial activity within the country’s regulatory perimeter while guiding capital flows through a state-backed mechanism. In 2025, China reaffirmed its stance on stablecoins even as it advances a separate digital yuan project designed to exert tighter control over foreign exchange and capital movements.
Yet regulatory bans have not eliminated crypto activity in practice. While China maintains a blanket ban on Bitcoin mining and other permissionless crypto activities, mining pools within the country continue to represent a substantial portion of the global hashrate. Hashrate Index places Chinese pools at more than 36% of the worldwide hashrate, underscoring a disconnect between formal prohibitions and actual network participation. The outcome is a nuanced mining map: a political impulse to restrict is in tension with economic incentives and cross-border capital flows that crypto miners leverage wherever policy allows.
These dynamics intersect with the broader push toward a centralized, programmable digital currency framework. The CBDC landscape, led by China’s digital yuan, is often cited as a tool for precision control over capital movements and monetary policy transmission. Proponents argue CBDCs can offer programmable features that improve settlement efficiency and cross-border interoperability, while critics warn they could erode financial privacy and curb the openness that has driven permissionless innovation in crypto markets.
What investors and builders should watch next
As policy debates evolve in the US and abroad, the crypto market stands at a crossroads where liquidity, regulatory clarity, and governance will shape momentum more than any single price move. The dollar-centered liquidity regime is likely to persist in the near term, reinforcing the role of dollar-denominated stablecoins as the primary conduit for BTC trading. For investors, the key questions relate to how changes in stablecoin regulation could affect market depth, settlement speed, and counterparty risk in major exchanges and over-the-counter desks.
From a construction and infrastructure perspective, the ongoing emphasis on stablecoin resilience, transparent reserve management, and compliance will influence which platforms gain network effects. Traders and institutions may prioritize products and services that align with GENIUS Act principles—namely, clarity around custody, reserve standards, and reporting—without compromising the efficiency that makes USD-based crypto liquidity compelling.
On the geopolitical front, observers should monitor how the CBDC push interacts with global capital flows and whether central banks will pursue interoperability initiatives that either complement or complicate existing crypto rails. The tension between centralized, programmable fiat and permissionless networks will continue to shape debates about financial sovereignty, market accessibility, and the future of cross-border payments.
For now, the market appears to be navigating a period of regulatory refinement and strategic repositioning. The next few quarters will test how well dollar-denominated liquidity and stablecoins can adapt to evolving rules and shifting mining geographies, while the ongoing CBDC experiments and capital-control policies will help illuminate the long-term balance between centralized control and decentralized finance.
Readers should watch for updates on GENIUS Act developments and any concrete regulatory guidance around stablecoins, as well as continued data on mining geography and hashrate distribution. These factors will shape liquidity availability, market depth, and the resilience of the BTC ecosystem as it matures within a complex regulatory and geopolitical landscape.

Community Banks Increase Compliance Issues
The Independent Community Bankers of America has been critical of the application and its compliance framework has been challenged. The group stated that the proposal does not meet required standards on risk management and profitability. Also, banks claimed that crypto companies must be subject to the same stringent regulations as their conventional counterparts. Bank representatives emphasized that companies cannot be given charter benefits without being regulated in full. They cautioned that unequal requirements might pose dangers to customers and the institutions. In addition, this issue is symptomatic of a broader conflict between digital asset companies and traditional financial organizations.
Nevertheless, Coinbase declared that it is not interested in being a traditional bank. The company stated that the charter of the trust would facilitate custody services and not deposits or lending. In addition, it seeks to enhance legal safeguards and facilitate financial activities that are under federal supervision. The National Community Reinvestment Coalition also protested against the approval and had concerns about the public interest. Its representatives claimed that the action would allow access to federal systems without fulfilling greater duties. They also referred to threats associated with previous enforcement measures and cybersecurity attacks.
Americans for Financial Reform Education Fund also commented on the decision and cautioned against risks to financial stability. The group raised issues related to fraud, money laundering, and market volatility in relation to crypto activities. Therefore, the charter’s revision continues to be debated in policy circles. Simultaneously, Coinbase continues to oppose regulations proposed by the US Securities and Exchange Commission concerning tokenized securities. The company argued that these restrictions could inhibit innovation and run contrary to how the market actually operates. Additionally, this conflict adds another dimension to its regulatory participation. The struggle between Coinbase and US banks underscores growing tension over crypto companies’ entry into the financial system.

James Wynn, the high-leverage crypto trader known for turning $7,600 into $25 million on PEPE, warned traders that markets will deteriorate further before recovering. Wynn outlined a multi-asset defensive strategy, shorting US equities and going long on oil while selectively buying Bitcoin (BTC) dips with spot capital.
All these is amid the US President Donald Trump’s fiery geopolitical message on Sunday against Iran and the Strait of Hormuz.
James Wynn’s Macro Bets and the Iran Factor
The trader’s positioning reflects a broader macro thesis tied to geopolitical escalation. James Wynn said he is short the S&P 500 and Nasdaq, long on WTI crude oil, and accumulating BTC on pullbacks.
He also flagged positive expected value in the Singapore dollar, Chinese yuan, euro, and British pound. He expects gold to hold its price or reach new all-time highs soon.
On real estate, Wynn acknowledged his own exposure to the sector, calling it a losing position while stressing the importance of diversification.
His strategy aligns with the current geopolitical environment. President Donald Trump gave Iran a 48-hour ultimatum on Truth Social, threatening to strike power plants and bridges if Tehran does not reopen the Strait of Hormuz by Tuesday.
Iran has kept the Strait effectively closed since the US-Israel military operation began on February 28, disrupting roughly 20% of the world’s oil supply.
Low Liquidity Wicks and Liquidation Hunts
Separately, James Wynn warned about Bitcoin price action. He flagged a Sunday manipulation wick on BTC that occurred during low trading volume, calling it further proof of what is coming next.
“Another classic low-volume manipulation wick on Bitcoin on a Sunday further proves what’s about to come,” he indicated.
Indeed, a $1,000 BTC price pump within 10 minutes on Sunday liquidated $28 million in short positions in a single hour, amid continued low-liquidity leverage hunting.
BTC is trading near $67,201 as of this writing, with the Fear and Greed Index stuck at 12, deep in extreme fear territory. The token has held a $65,000 to $73,000 range for weeks despite sustained bearish sentiment.
With Trump’s self-imposed Tuesday deadline approaching and oil prices hovering above $100 per barrel, the macro backdrop for risk assets remains volatile.
The post James Wynn Reveals His Defensive Play Amid Trump’s Fiery Iran Message appeared first on BeInCrypto.


Polymarket has removed a betting market tied to the rescue of U.S. service members in Iran, after intense backlash and criticism from lawmakers this weekend.
The market allowed users to wager on when the U.S. would confirm the rescue of two airmen after an F-15E fighter jet was shot down over Iran. The crew members have since been rescued.
Rep. Seth Moulton, a Democrat from Massachusetts, criticized the listing in a post on X, calling it “disgusting” and arguing it reduced a military rescue effort to a financial trade.
Moulton has taken a hard line on prediction markets, recently banning his staff from using platforms such as Polymarket and Kalshi over concerns that financial incentives could influence policy decisions.
A Polymarket spokesperson said the listing did not meet its integrity standards removed shortly after it appeared. The company added that it is reviewing how the market passed internal safeguards.
The incident comes as prediction markets face rising pressure in Washington. A group of congressional Democrats last month introduced legislation that would ban contracts tied to elections, war and government actions.
Separately, several senators have urged the Commodity Futures Trading Commission to prohibit markets linked to individual deaths, citing national security concerns.
Regulators are also asserting authority over the sector. The CFTC said this week it filed lawsuits against three states over efforts it believes attempt to bypass federal oversight of prediction markets.
Industry scrutiny has expanded beyond politics. The NFL has asked operators to avoid offering contracts it views as objectionable or open to manipulation, including bets tied to officiating decisions or events known in advance.
Still, the market is expanding. Kalshi has late last month secured a license to offer margin trading to institutional investors, while new players are entering the market. Among them is JPMorgan, whose CEO, Jamie Dimon, has signaled that it is looking to enter the fray.

Latest Acquisitions Drive Overall Holdings To Greater Heights
The recent purchase comes after a huge one announced last week. Bitmain has already accumulated more than 71,000 ETH, boosting total holdings to more than 4.7 million ETH. It now holds nearly 4 percent of the total Ethereum supply. The company still aims to own five percent of Ethereum’s supply in the market. In addition, the strategy signals a long-term accumulation plan that targets market positioning. The aggressive buying has, however, exposed it to price volatility.
Statistics indicate that Bitmain has a large unrealized loss on its Ethereum investment at present. The average purchase price is above current market rates, which has impacted portfolio value. This puts the firm under pressure as market conditions remain uncertain. Since the beginning of the year, Bitmain’s stock has fallen more than 30 percent. Nonetheless, it posted a small profit in the last week along with a slight uptick in Ethereum’s price. Moreover, this movement suggests a more favorable mood even amid ongoing geopolitical threats.
According to Tom Lee, the company will continue purchasing at current levels despite the unstable markets. He explained that the plan rests on optimism about the broader economic outlook. Therefore, current pricing is seen as an opportunity rather than a risk for the firm. Lee noted that present oil prices are lower than historical highs when adjusted for inflation. He compared current levels with those observed in previous market cycles. He added that this analogy supports the belief that the economy can sustain higher energy prices.
Notably, the leading cryptocurrencies have remained relatively stable even amid geopolitical tension. Both Bitcoin and Ethereum have avoided further losses during the recent conflict period. Consequently, Bitmain is still consolidating its assets in line with the long-term plan.

Bitcoin price now reflects capital inflows over halving cycles. Institutional adoption reshapes Bitcoin’s long-term market behavior. Credit systems and banks now influence Bitcoin growth trajectory. Bitcoin traded near $68,000 as market structure signals a major shift in price drivers. Michael Saylor said the four-year cycle no longer defines market behavior. He added that capital flows now guide Bitcoin’s direction across global financial systems.
For years, traders linked price growth to halving events that reduced mining rewards. Saylor now rejects that model and points to structural market evolution. As a result, Bitcoin’s role continues to expand beyond its early speculative phase.
Institutional adoption continues to reshape demand patterns across regulated financial platforms. Large firms now integrate Bitcoin into treasury strategies and financial products. Consequently, the asset reflects broader economic forces instead of isolated supply shocks.
Capital Flows Replace Halving Cycles
Saylor emphasized that capital movement now determines Bitcoin price trends in modern markets. He linked this shift to increased access through banks and digital credit systems. Liquidity conditions now influence price behavior more than programmed supply changes.
Financial institutions have expanded Bitcoin access through structured investment products. These platforms allow broader participation from corporate and traditional finance sectors. As a result, capital inflows and outflows now drive short-term and long-term price movements.
Analysts now focus on fund allocation trends rather than historical halving timelines. This shift reflects a deeper connection between Bitcoin and global financial systems. Consequently, Bitcoin responds more directly to macroeconomic conditions and liquidity cycles.
Institutional Adoption Redefines Market Structure
Traditional finance has increased its involvement in Bitcoin through custody, trading, and reserve strategies. This participation has improved liquidity while stabilizing extreme price swings over time. Institutional demand now plays a central role in shaping market direction.
Companies continue to build services that integrate Bitcoin into regulated financial ecosystems. These developments expand access and improve trust among large-scale participants. Bitcoin gains recognition as a global digital capital asset across multiple sectors.
The asset now appears in portfolios alongside traditional financial instruments. This integration reflects growing acceptance across banking and corporate environments. Consequently, Bitcoin’s valuation aligns more closely with broader capital market dynamics.
MicroStrategy Strategy Fuels Ongoing Debate
MicroStrategy remains a focal point in discussions about institutional Bitcoin accumulation strategies. The company built a large Bitcoin position through consistent and aggressive purchases. Therefore, it holds a unique position within the evolving digital asset landscape.
Market commentator Adam Livingston noted that early accumulation created a strong competitive advantage. He suggested that replicating such a strategy now requires significantly higher capital. As a result, few firms can match the company’s scale and timing.
At the same time, this approach continues to influence corporate treasury strategies worldwide. Firms now evaluate Bitcoin as a reserve asset within diversified portfolios. Consequently, MicroStrategy’s model remains central to discussions about institutional adoption.
Michael Saylor, Executive Chairman of Strategy (MicroStrategy), hit back at Peter Schiff after the goldbug posted data suggesting Bitcoin (BTC) had lagged gold, silver, and equities over five years.
The exchange reignited a long-running public feud between two of the loudest voices on opposite sides of the Bitcoin-versus-gold divide.
Schiff’s Five-Year Window and Why It Matters
Schiff highlighted Bitcoin’s measly 12% gain over the past five years, comparing that figure to the NASDAQ’s 57.4% gain, the S&P 500’s 59.4% rise, gold’s 163% surge, and silver’s 181% rally.
“If the appeal of Bitcoin is its superior long-term performance, why should anyone keep HODLing it?” posed Schiff.
The five-year window he cited begins near April 2021, when BTC traded close to its then all-time high of approximately $69,000.
That starting point captures both the 2022 crypto crash and the slower 2024-2026 recovery. As of this writing, BTC trades for $66,847.
Gold, meanwhile, has surged above $4,700 per ounce. That represents a gain of over 160% from its April 2021 level near $1,780, confirming Schiff’s figures.
The precious metal hit an all-time high of $5,602 in late January 2026 before pulling back amid broader macro volatility tied to the Iran conflict and rising inflation expectations.
Schiff followed up with a separate post targeting Strategy directly. He noted that MSTR stock had outperformed the NASDAQ, gaining 68.5% over five years, but argued the rally had nothing to do with BTC’s performance.
“It’s due to investors’ willingness to overpay for MSTR so Saylor could keep overpaying for Bitcoin. Sell MSTR before it crashes,” warned Schiff
Saylor Responds With Annualized Returns
However, according to Michael Saylor, Schiff’s analogy is flawed. Saylor measured Bitcoin’s performance from August 2020, the month Strategy began its corporate BTC treasury strategy.
With this, the Bitcoin believer highlighted BTC annualizing at 36%, compared to 16% for gold (GLD), 15% for the Nasdaq-100 (QQQ), 14% for the S&P 500 (SPY), 5% for real estate (VNQ), and negative 1% for bonds (BND).
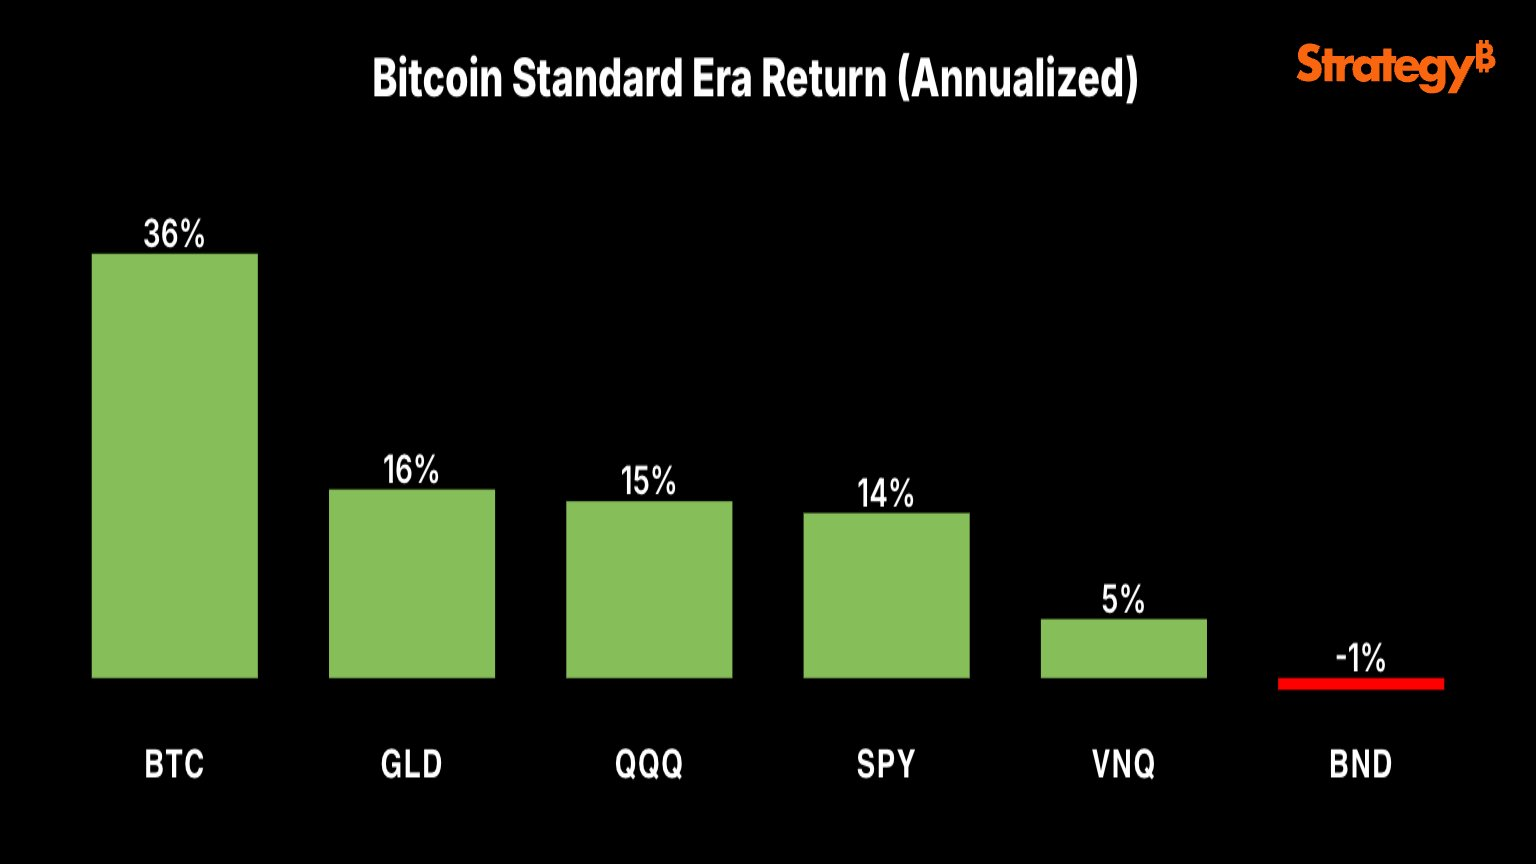
“Timeframes matter. Since Aug 2020, Bitcoin has been the top-performing major asset, and it’s not even close. Zoom out further, and the gap only widens,” Saylor challenged.
Strategy held 762,099 BTC as of this writing, making it the largest corporate holder of the cryptocurrency. The company acquired its holdings at an average price of roughly $75,699 per coin, putting its position below break-even at current spot prices.
A Familiar Feud With Higher Stakes
The Schiff-Saylor rivalry has become a recurring feature of crypto commentary. Schiff has called Strategy’s business model a “fraud” and predicted the company would eventually go bankrupt.
In December 2025, he challenged Saylor to a public debate at Binance Blockchain Week in Dubai. Saylor did not accept.
However, Schiff and CZ, the founder and former CEO of Binance, recently debated on the same topic, Bitcoin versus gold, with the outcome exposing a core divide between gold-backed stability and crypto innovation.
The post Michael Saylor Exposes the Fatal Flaw in Peter Schiff’s Anti-Bitcoin Argument appeared first on BeInCrypto.
Crypto World
Bitcoin Price Prediction: OCC Grants Crypto Bank Charter as Pepeto Targets 100x While ETH and XRP Hold

Bitcoin price prediction shifted this week after the OCC granted conditional approval for the biggest US crypto exchange to become a federally regulated trust bank, pulling digital assets deeper into the traditional banking system.
While the wider market has cooled with major coins pulling back, Pepeto stands out as the top presale entry with its Binance listing getting closer every day.
With a working exchange already live and $8.68 million raised, Pepeto combines real technology with a presale that analysts see running 100x once the listing opens, making it the play that the next rally is about to reward.
The OCC gave Coinbase conditional approval for a national trust bank charter on April 2, placing the largest US crypto exchange under direct federal oversight, according to CoinDesk.
The charter lets Coinbase handle custody services across all 50 states under one set of rules instead of juggling separate state licenses, according to Bitcoin Magazine. Pension funds and sovereign wealth funds often need bank-grade oversight before moving capital into crypto, and this approval knocks down one of the last walls.
The biggest stamp of trust in crypto history just dropped, and the presale entries set to ride that wave are where the real gains live.
Pepeto: The Presale Where 100x Lines Up as the Bitcoin Price Prediction Turns Bullish on Federal Backing
While the CLARITY Act sits stuck in committee, the direction is obvious, and sharp traders are hunting for the best entries to catch the recovery forming underneath.
Pepeto ranks near the top because a live exchange with $8.68 million committed and a Binance listing closing in gives it everything needed to stand as one of the best plays of 2026.

The math speaks for itself. At $0.0000001862, analysts see 100x once the Binance listing opens. The person who created the original Pepe token, which hit $11 billion on hype alone, built this exchange with a veteran from Binance’s listing team. Every swap runs through PepetoSwap at zero cost, every cross-chain move between ETH, BNB, and Solana lands at full value, and every token gets flagged for scam patterns before your capital touches it, all verified clean by SolidProof.
What drives Pepeto daily is real utility, and 188% APY staking grows every position while the listing window gets tighter. The entries that turned early believers into millionaires in past cycles all shared one trait: they found a working project before the crowd showed up, and Pepeto at presale pricing is that exact setup right now.
Ethereum (ETH)
ETH trades at $2,041 per CoinMarketCap, holding just above the $2,000 floor as the broader rally has not yet carried altcoins higher.
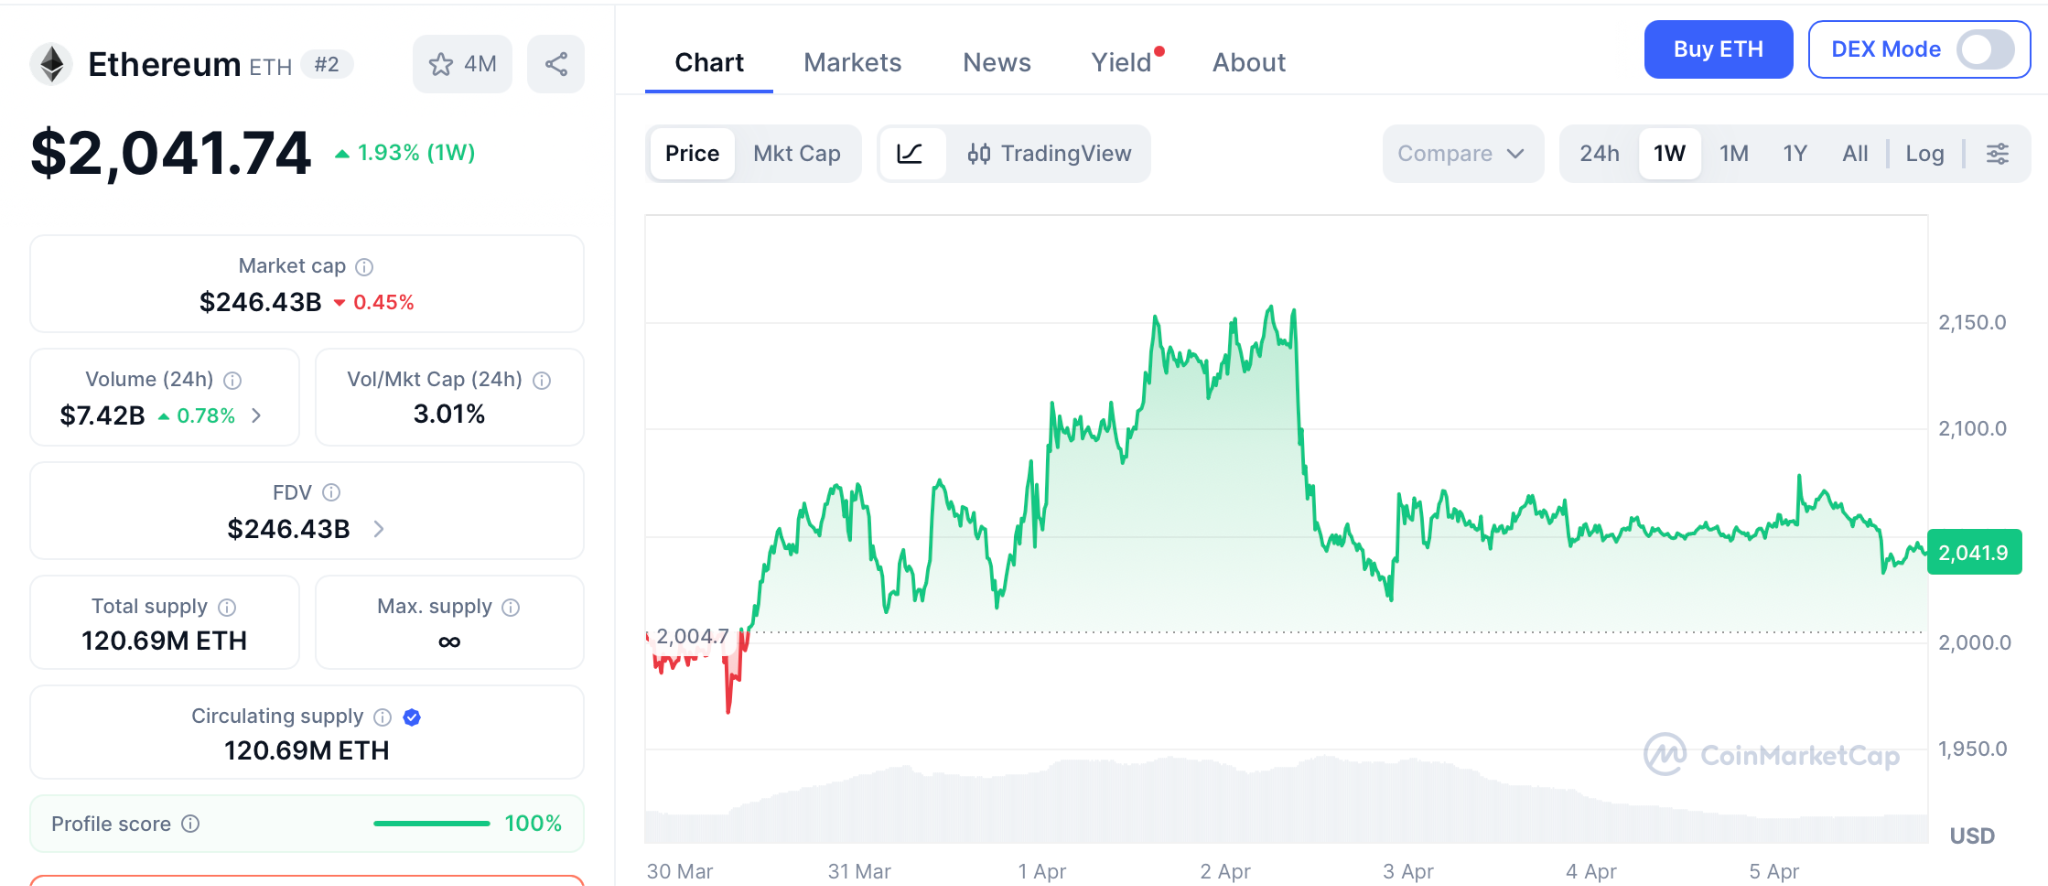
Standard Chartered keeps a $7,500 year-end target, but from here that is a 3.6x over nine months, decent for big portfolios, while Pepeto at presale pricing targets 100x from a single listing event the Binance debut is set to kick off.
XRP
XRP trades at $1.29 per CoinMarketCap, drifting below key moving averages as sellers stay in control.
Standard Chartered recently cut its year-end call to $2.80, roughly a 2x that takes patience, but presale entries grab the multiples that XRP at an $81 billion cap can no longer produce.
Conclusion
The picture is forming fast and the math is simple. The OCC handing a federal bank charter to the largest US exchange means the bitcoin price prediction just got backed by the same system that watches over Wall Street. ETH at $2,041 targets $7,500 over nine months, a 3.6x that pays patience, and the investors who grabbed ETH at $0.30 turned $1,000 into $16,000 because they spotted a working platform at early pricing and moved.
The bitcoin price prediction shows early bull signals building while the presale window gets tighter by the day. Visit the Pepeto official website and secure your spot before this chance turns into a headline you read about instead of a gain you earned, because projects with real products, viral buzz, and a Binance listing on deck do not sit at presale prices for long.
Click To Visit Pepeto Website To Enter The Presale

FAQs
What is the Coinbase OCC charter and how does it change the bitcoin price prediction?
The OCC gave Coinbase a federal trust bank charter, pulling crypto under Wall Street-grade rules. The bitcoin price prediction turns structurally bullish.
What are ETH and XRP targets next to the bitcoin price prediction?
ETH targets $7,500 by year end, XRP targets $2.80, and Pepeto targets 100x from the Binance listing. The Pepeto official website still takes entries.
Why is Pepeto the top pick as the bitcoin price prediction shifts bullish?
Pepeto has a live exchange, a SolidProof audit, $8.68 million raised, and 100x projected from the coming Binance listing.
Disclaimer: This is a Press Release provided by a third party who is responsible for the content. Please conduct your own research before taking any action based on the content.
Market Preview: CPI Inflation Reports and Delta (DAL) Earnings Amid Iran Conflict

Rob Rausch Fronts Crown Royal’s Surprising New Camo Collab

Southampton draw Man City in FA Cup semi-finals as Leeds face Chelsea in famous fixture


-

 NewsBeat3 days ago
Steven Gerrard disagrees with Gary Neville over ‘shock’ Chelsea and Arsenal claim | Football
-

 Business3 days ago
No Jackpot Winner and $194 Million Prize Rolls Over
-

 Fashion2 days ago
Weekend Open Thread: Spanx – Corporette.com
-
Entertainment6 days ago
Fans slam 'heartbreaking' Barbie Dream Fest convention debacle with 'cardboard cutout' experience
-

 Crypto World4 days ago
Gold Price Prediction: Worst Month in 17 Years fo Save Haven Rock
-

 Tech7 days ago
The Pixel 10a doesn’t have a camera bump, and it’s great
-
Crypto World5 days ago
Dems press CFTC, ethics board on prediction-market insider trades
-

 Tech7 days ago
Avatar Legends: The Fighting Game comes out in July and it looks pretty slick
-

 Sports22 hours ago
India men’s 4x400m and mixed 4x100m relay teams register big progress | Other Sports News
-

 Business4 days ago
Login and Checkout Issues Spark Merchant Frustration
-

 Tech6 days ago
Apple will hide your email address from apps and websites, but not cops
-

 Tech5 days ago
EE TV is using AI to help you find something to watch
-

 Sports5 days ago
Tallest college basketball player ever, standing at 7-foot-9, entering transfer portal
-

 Politics6 days ago
Should Trump Be Scared Strait?
-

 Tech6 days ago
Flipsnack and the shift toward motion-first business content with living visuals
-

 Fashion6 days ago
The Best Spring Trends of 2026
-

 Sports6 days ago
Women’s hockey camp eyes fitness boost, tactics ahead of WC 2026 campaign | Other Sports News
-

 Crypto World6 days ago
U.S. rule change may open trillions in 401(k) funds to crypto
-
Tech6 days ago
Daily Deal: StackSkills Premium Annual Pass
-

 Tech5 days ago
How to back up your iPhone & iPad to your Mac before something goes wrong
You must be logged in to post a comment Login