

Crypto World
Ethereum Whales Add $950 Million as Bottom Hopes Build, but the Story Has a Hole
Ethereum (ETH) price has rebounded 22% its June low and reclaimed a closely watched institutional trend line. The move lands just as spot ETF money flips back into ETH after weeks of redemptions.
Whales kept adding through the slide, and on-chain accumulation is returning. Yet rising leverage leaves one question open, whether this is a real bottom or another bounce inside a downtrend.
Ethereum Price Reclaims the Monthly VWAP Line
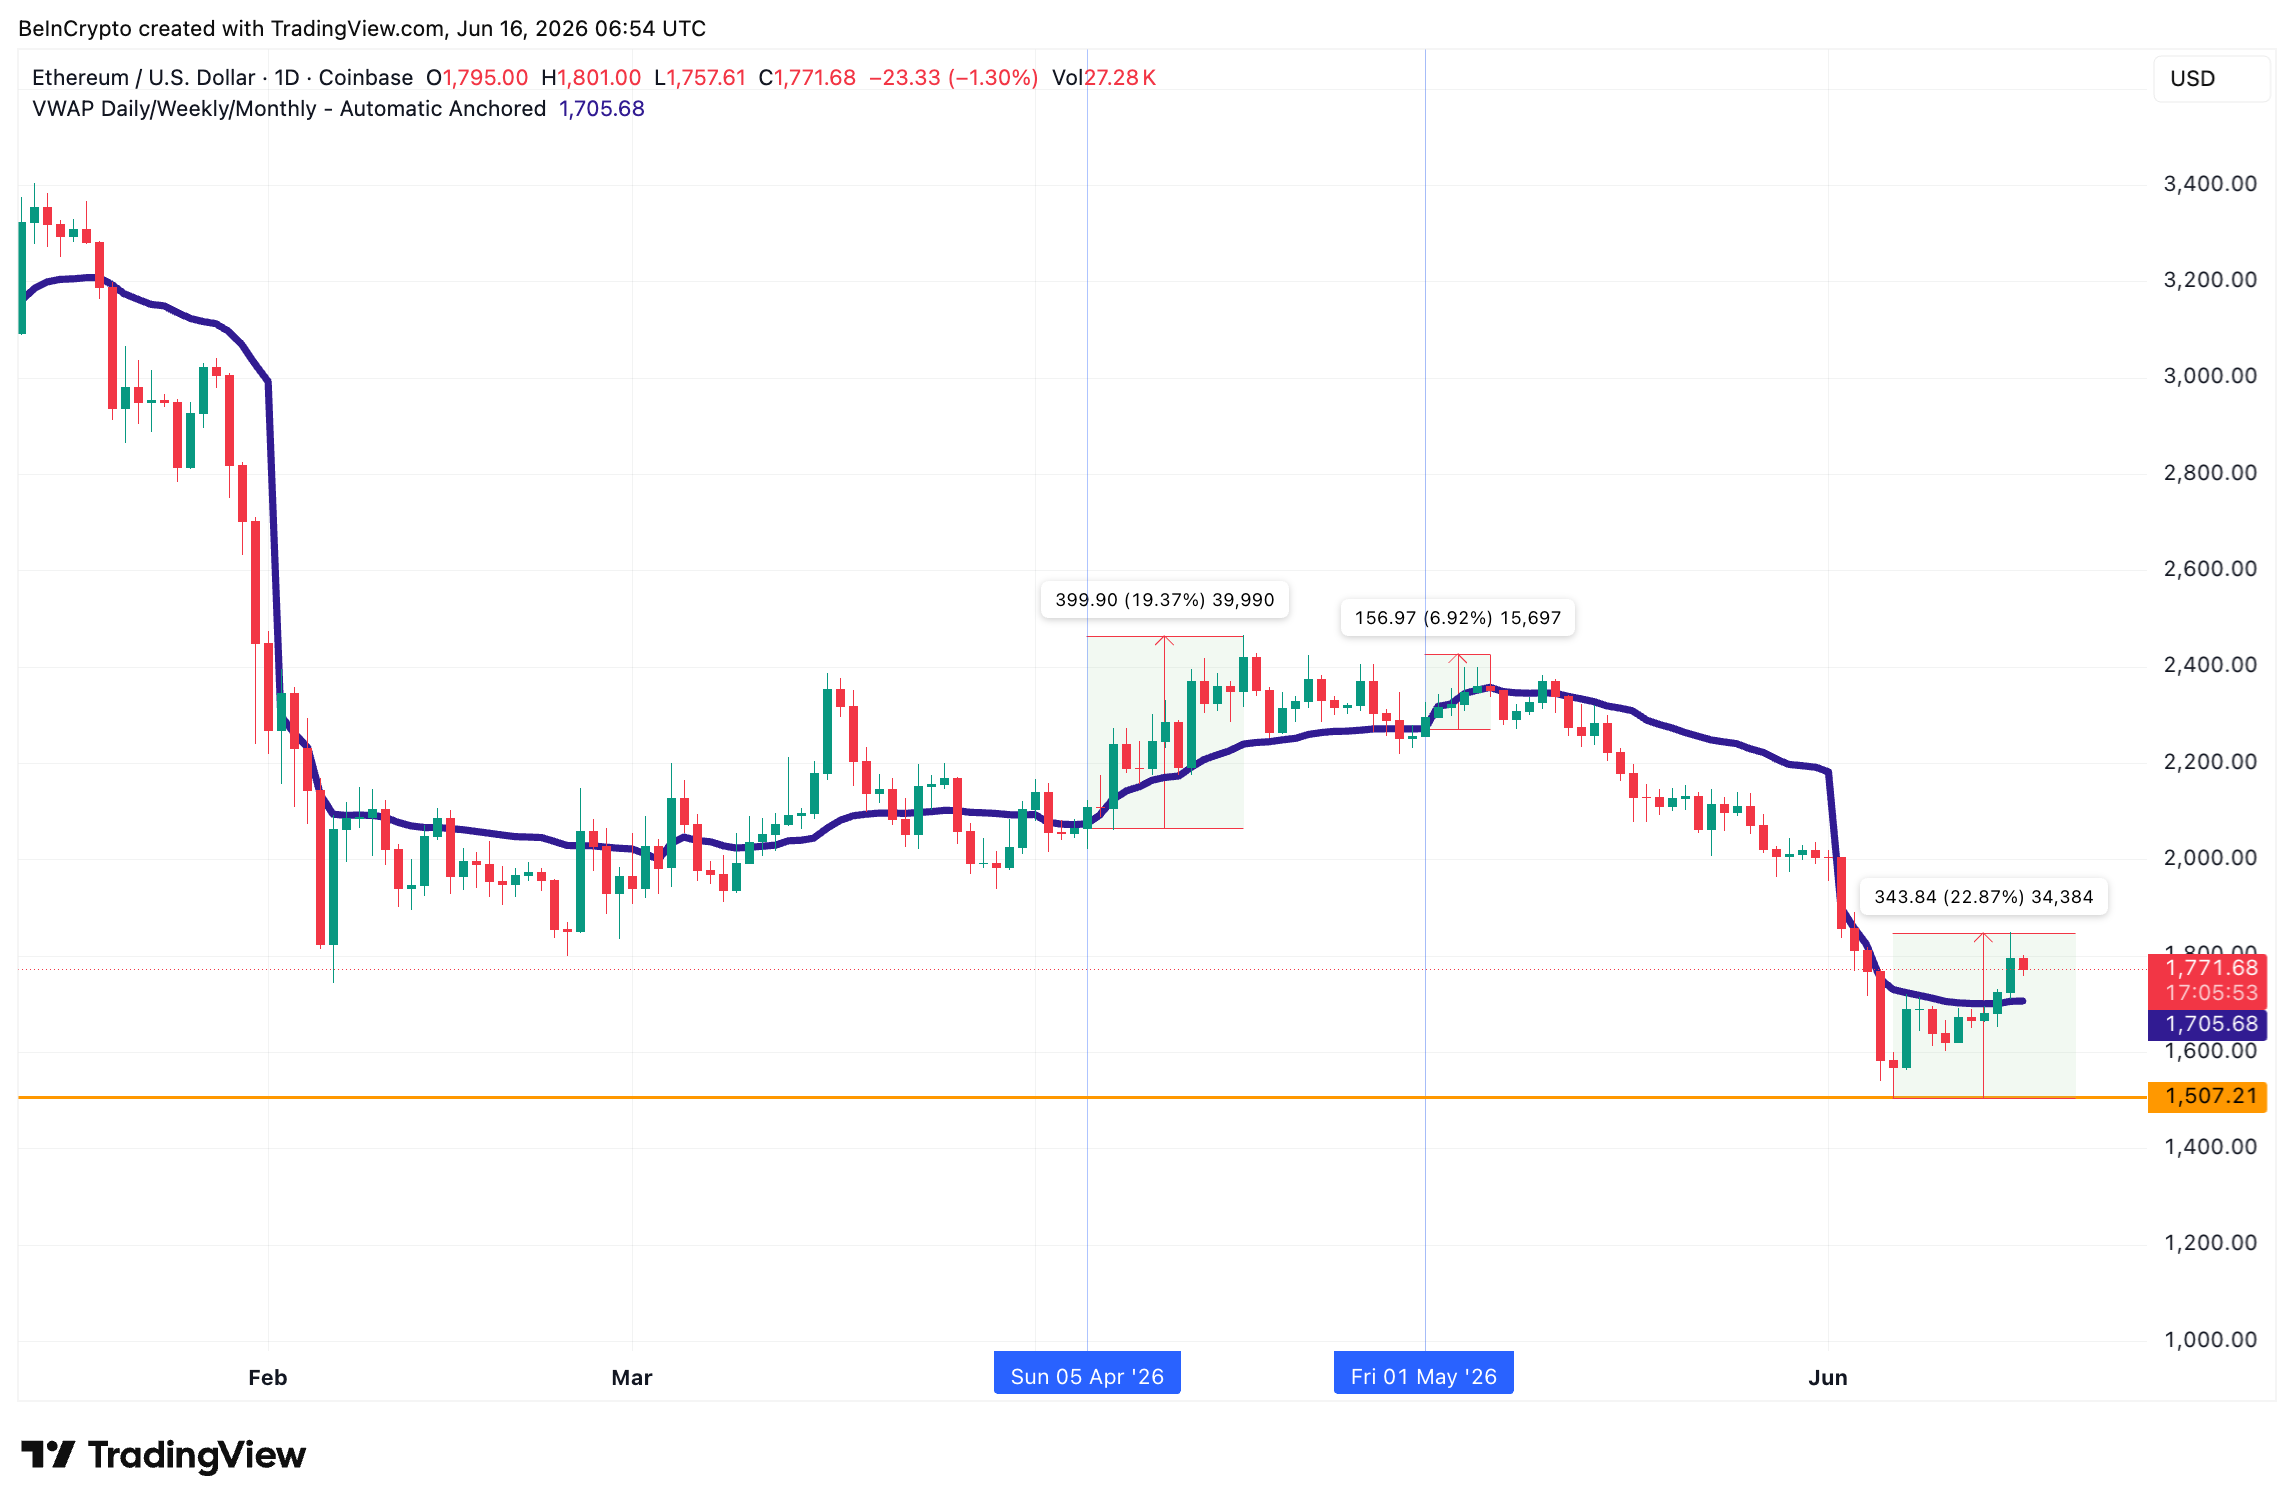
On June 14, the Ethereum price closed back above its monthly VWAP, the volume-weighted average price that many desks treat as the line between accumulation and distribution.

The reclaim matters because of what followed past crosses. When ETH cleared the same line on April 6, it ran roughly 19% before stalling. A second reclaim around May 1 produced a smaller move near 7%.

Each of those reclaims shared one trait. Spot ETF flows flipped positive within days, as if the cross pulled institutional money back in.

Whether that link is causal or simply reflects returning optimism is hard to prove. Still, the pattern has repeated.
Want more token insights like this? Sign up for Editor Harsh Notariya’s Daily Crypto Newsletter here.
That makes the latest ETF print the first thing to check.
Spot ETF Flows Turn Green After a Brutal Streak
The flip arrived on cue. ETH spot ETF products took in $22.50 million on June 15, one day after the VWAP reclaim.
That green print breaks a long run of pain. From May 11 to June 12, the funds bled on all but two trading days, a near-continuous outflow streak. The contrast with spring is sharp. Early May saw heavy inflows, including $101 million on May 1 and $98 million on May 5, before the bleed set in.

Total net assets now sit near $10.04 billion. The return to inflows, however small, mirrors what happened after the April and May reclaims. The May’s extended VWAP reclaim saw multiple inflow days, something that can be expected now, if the bottom theory holds weight.
But ETF flows alone cannot confirm a bottom. For that, the on-chain holders matter more.
Whales Keep Adding as Capitulation Shows Signs of Exhaustion
The big holders believed in ETH before it crossed the VWAP line. Whale accumulation kept climbing through the decline. Addresses tracked by Santiment lifted their balance from about 124.85 million ETH on June 10 to roughly 125.4 million now. That’s roughly worth $950 million in under a week.

On-chain flows reinforce that buying. The heavy selling appears to have run dry around June 7, one day after the price formed a local bottom. That is when the exchange net position change, a metric that tracks coins moving on and off exchanges, flipped toward net outflows.
That flip suggests holders are pulling coins into storage rather than selling. It lines up with the whale buying above, as steady accumulation absorbed the last of the supply hitting exchanges.
The result reads like seller exhaustion, the exact condition a bottom call depends on.

The backdrop fits a possible bottom. Swissblock’s Altcoin Vector report describes ETH as stuck in a long capitulation phase, the stage of deep, sustained stress that often precedes a bottom.
The firm notes that capitulation only builds bottoms once selling pressure begins to exhaust. It asks whether that exhaustion is near now. And the exchange net position change metric shows that it just might.
One factor, however, complicates the bottom call, and it sits in the derivatives market.
Key Ethereum Price Levels Surface
Here is where the levels come in. The Ethereum price trades near $1,771, back above the monthly VWAP at $1,705 that it reclaimed on June 14. Price has climbed about 22% from the June low near $1,507. A confirmed bottom, though, needs more.
The line in the sand sits at $1,851. A daily close above it would validate the rebound and open room toward the prior range.
The catch is leverage. Open interest in ETH futures, the total value of contracts left open, has climbed sharply. It rose from about $8.86 billion in early June to roughly $9.96 billion, briefly touching $10.27 billion.

A durable capitulation bottom usually forms after leverage is flushed out and stays low. Here it is doing the opposite, as open interest rebuilds while price climbs.
That points to a leverage-led bounce, not pure spot demand. Those crowded longs are fragile. A sharp dip could liquidate them and force another wave of selling. So the capitulation may not be fully done.
On the downside, $1,624 is the first floor, followed by the $1,507 low. A daily close below $1,507 would open a new-bottom hypothesis.

A reclaim of $1,851 separates a confirmed bottom from another bounce that fades back below the VWAP.
The post Ethereum Whales Add $950 Million as Bottom Hopes Build, but the Story Has a Hole appeared first on BeInCrypto.

Bitcoin (BTC) is trading roughly 48% below its October peak even as global money supply sets a record, opening a key gap between the asset and global liquidity this cycle.
The divergence has drawn attention from market analysts who treat liquidity as a leading signal for risk assets. Their core question is whether Bitcoin breaks or continues a long-standing pattern.
Bitcoin and Global Liquidity Are Diverging
Alphractal noted that the global M2 money supply, a common proxy for worldwide liquidity, recently reached a record of nearly $135 trillion. The S&P 500 has tracked that expansion, trading near its own record highs.
Bitcoin historically follows the same liquidity wave, though with higher volatility and a longer lag. That relationship held through 2024 and into early 2025 before it broke down.
“Since early 2025, BTC has diverged sharply: while M2 continued making new highs and SPX recovered to near-ATH, BTC has compressed,” the firm mentioned.
Alphractal called the current divergence the most pronounced in its dataset and described two ways to read it.
The first is the convergence reading. It holds that an asset this far below liquidity has typically closed the gap through price gains. That recovery comes from appreciation rather than shrinking liquidity.
The second is the structural reading. It treats the Bitcoin-liquidity link as non-mechanical rather than fixed. Past divergences in 2018 and 2022 were resolved over 6 to 18 months. The correlation can also weaken as the holder base changes.
“Which reading applies depends on whether the current divergence reflects a temporary dislocation or a structural shift in BTC’s correlation regime,” Alphractal said.
Analyst Martini Guy framed it the same way. He said the macro backdrop is improving, while Bitcoin has not yet reflected it. Either Bitcoin starts closing the gap, or its tie to liquidity breaks in a way “we haven’t seen for quite some time.”
Follow us on X to get the latest news as it happens
Can Bitcoin Catch Up to Liquidity?
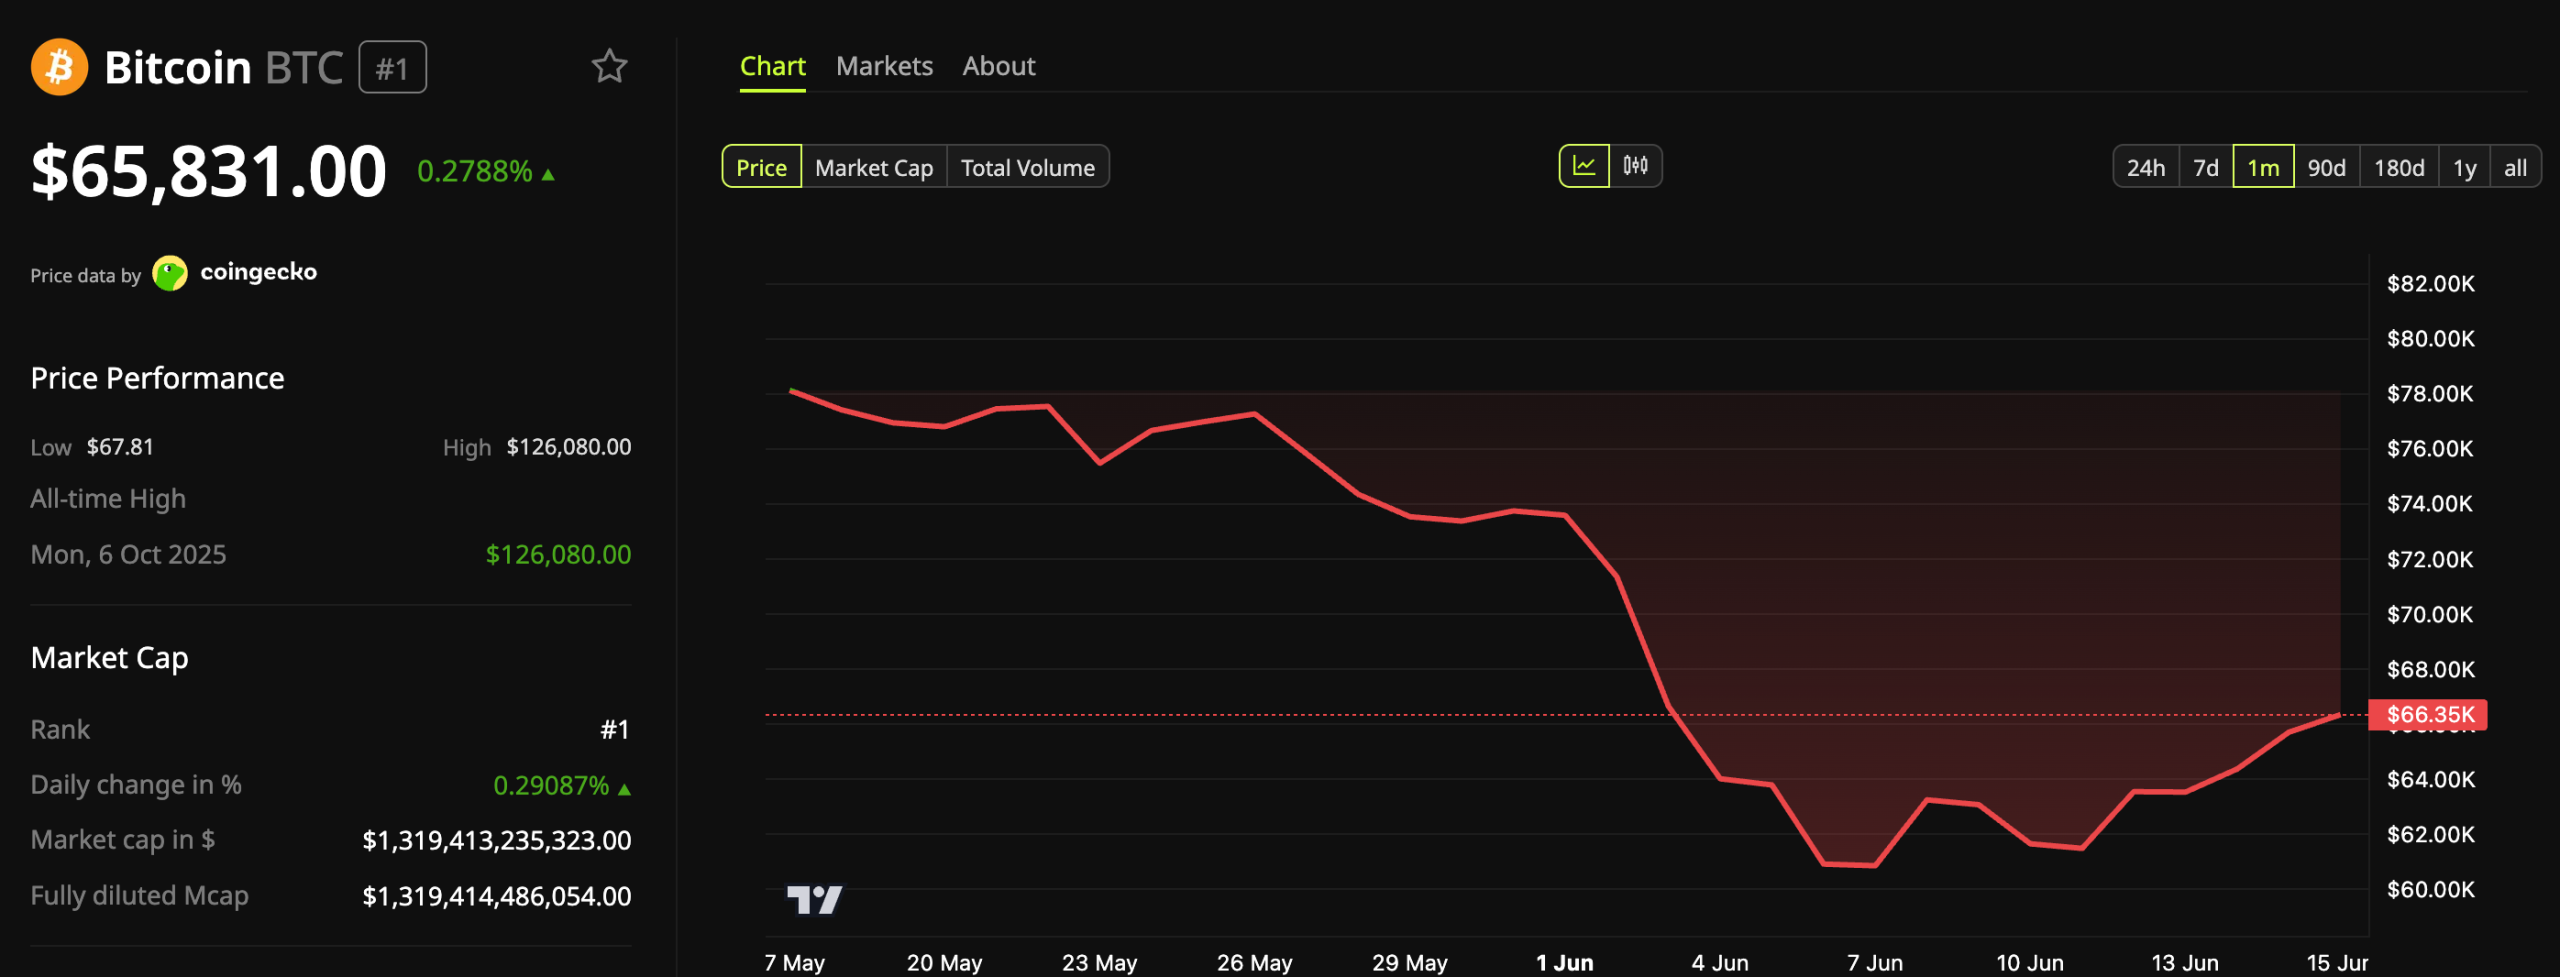
Meanwhile, Bitcoin firmed toward $66,000 this week as the US-Iran deal lifted equities and risk assets. At press time, the asset traded at $65,831, up 0.27% over the past day.

The bounce strengthens the stabilization signal but does not confirm a trend change. On-chain data supports that reading.
Glassnode described the recent move up from near $60,000 as base-building rather than a confirmed reversal.
“The recovery is happening on thin ice. Spot volume collapsed 40.4% to $5.8B and Futures Open Interest declined another 3% to $30.6B, a sign the bounce is being driven by covering rather than fresh conviction. Long-side funding payments fell 22.3% and ETF trade volume dropped 38.1% to $11.1B. The market is lighter, not healthier,” the report read.
The macro backdrop favors a recovery, but Bitcoin has not confirmed one. The coming weeks of flow and volume data should show which reading holds.
Subscribe to our YouTube channel to watch leaders and journalists provide expert insights
The post Bitcoin Lags Global Liquidity at Record Highs: Will It Catch Up? appeared first on BeInCrypto.

Strategy executive chairman Michael Saylor has renewed his argument that Bitcoin investing does not require staking, inflation, or on-chain yield schemes. In a Tuesday post on X, Saylor framed Bitcoin as “pure digital capital” and said returns should come from financial products built around BTC rather than protocol-based rewards.
At the center of his pitch was a five-layer “Digital Asset Stack,” with Bitcoin positioned as the foundation for credit, money, yield, and equity structures. The approach aligns with Strategy’s long-running thesis of treating its Bitcoin holdings as a treasury reserve and generating returns through capital-markets engineering.
Key takeaways
- Saylor argues Bitcoin should remain “pure digital capital,” rejecting the idea that it must imitate Ethereum-style yield mechanisms to attract investors.
- His “Digital Asset Stack” positions BTC as collateral for “digital credit” instruments intended to deliver more stable returns than holding BTC outright.
- Saylor describes Bitcoin’s volatility as a feature of scarce, global, 24/7-traded capital—credit structures sit “above” BTC in the risk hierarchy.
- Strategy’s perpetual preferred stock STRC is repeatedly cited as an example of how capital-market products can be built on top of Bitcoin holdings.
The “Digital Asset Stack” and why Saylor rejects staking
In his X post, Saylor laid out a five-layer framework he uses to explain how digital assets can be organized into different economic roles: credit, money, yield, and equity, all anchored by Bitcoin. The key takeaway from his remarks is philosophical as much as financial—Saylor believes Bitcoin does not need additional mechanisms like staking or inflation to become investable.
Saylor’s position is that investors should be able to access exposure to the Bitcoin ecosystem without relying on protocol-issued yield. Instead, he points toward traditional finance-style structures—securities and credit products—that use BTC holdings as underlying capital support.
The argument reinforces Strategy’s established narrative that returns can be engineered through instruments issued by the company, rather than by earning on-chain rewards. That distinction matters for investors comparing “BTC as collateral for finance” versus “BTC as a yield-bearing asset through protocol design.”
Digital credit: collateral with risk separated
Saylor’s framework emphasizes “digital credit”—financial instruments created using Strategy’s Bitcoin holdings. In this structure, Bitcoin functions as collateral, while the equity layer absorbs most of the price risk. The intent, according to Saylor’s explanation, is that credit instruments can therefore deliver returns that behave differently from spot BTC, particularly during turbulent market periods.
While the X post did not break down every product in the stack, Saylor repeatedly referred to Strategy-style securities, including STRC, as tangible examples of how “digital credit” can be packaged. In his framing, instruments like STRC are not merely corporate offerings; they are presented as illustrations of a broader asset class concept built on top of Bitcoin through capital-market structures.
For readers, the practical question is what this separation of risk means in real market stress. In Saylor’s model, credit and equity are not identical exposures: they sit at different points in the capital structure, with different drivers of returns and different sensitivity to BTC price movements.
Volatility isn’t a flaw—structures are designed to sit above BTC
Saylor also addressed Bitcoin’s volatility directly. He argued that volatility is not an inherent defect, but a natural outcome of Bitcoin being “high-energy capital”—scarce, traded globally, and moving rapidly because it is always on and always accessible.
In his view, the purpose of “digital credit” instruments is to dampen swings by placing credit claims above Bitcoin in the structure. Although Saylor did not specifically discuss STRC’s volatility dynamics in the X post itself, he said the risk profile of credit products can vary based on market stress, liquidity conditions, and investor demand.
That qualification is important: it suggests that credit instruments are not guaranteed to behave the same way in all cycles. Instead, they may introduce a different mix of risks—often less immediate sensitivity to BTC price changes, but with exposure to broader credit conditions.
Strategy’s preferred stock STRC provides a concrete reference point in Saylor’s remarks. STRC closed at $95.20 on Monday, down 1.45%, according to Nasdaq data. The shares have a $100 stated par value and are structured to trade near that level, based on Strategy’s own description of how STRC is priced.
For investors weighing these products against direct BTC exposure, the central tradeoff implied by Saylor’s framework is that price volatility is not removed—it is redistributed across layers. Credit may smooth the experience relative to holding BTC spot, but the exact behavior depends on how markets price the credit and equity components.
Product value depends on whether BTC is sold
Saylor’s argument about “digital credit” also ties back to Strategy’s policy on Bitcoin. In earlier commentary at the BTC Prague conference, he said that if a company policy prevents Bitcoin sales, then the credit structure could lose its value, because the mechanism intended to support the products would be constrained.
As he put it to Cointelegraph: “If the company’s policy is that we won’t sell the Bitcoin, then the credit won’t have value and the equity won’t have value.” That linkage—between BTC sales capacity and the functioning of the capital structure—highlights a key uncertainty readers should monitor. Even if products are designed to damp BTC swings, their resilience may depend on whether and how liquidity events can be executed.
Cointelegraph previously reported on Strategy’s Bitcoin sales in the context of product support, including coverage of a sale that offloaded 32 BTC. That broader record is relevant to Saylor’s thesis, because it suggests the company’s framework is not purely theoretical—it has required real-world actions to sustain the engineering of returns.
With Saylor again emphasizing that Bitcoin should stay “pure digital capital,” the immediate open question is how far this “digital credit” model can go without evolving assumptions about capital markets access, liquidity, and BTC management policies. Readers should watch how Strategy and similar issuers structure risk across credit and equity, and how those instruments perform through stress—especially when BTC price moves collide with liquidity and demand shifts.
Crypto World
Bitcoin, Gold Post Worst YTD Returns Among Major Assets, Challenging Their Safe Haven Status

Bitcoin (BTC) and gold are the only two major asset classes in the red so far in 2026, posting year-to-date losses of 27% and 3%, respectively, according to market analyst Charlie Bilello.
What makes it unusual is not just the losses themselves but the combination, with both assets never having finished as the two worst performers among the majors in a calendar year, going back to 2011.
Rotation Showing Up Across Markets
The backdrop makes the situation harder to explain, as Bilello pointed out in a recent market report. Data he shared showed the S&P 500 was up around 9% on the year, and small-cap stocks had gained 19% in the same period. Furthermore, he noted that value stocks have jumped 15%, and emerging market equities were outperforming expectations.
Basically, everything is in positive territory except for gold and BTC, the two assets most commonly associated with protection against uncertain times as well as monetary debasement.
The analyst’s chart, which has tracked annual returns for the last 15 years, showed just how out of character this performance is for both assets. Gold posted gains of 63.7% in 2025 and 26.7% in 2024, while Bitcoin returned 121% in 2024 and had one of its best showings in 2013 when total returns hit 5,500%.
Looking at the long-run numbers, they’re also quite impressive, with BTC’s cumulative returns since 2011 sitting at 21,000,000%, annualized at 121.6%, while gold has returned 179% in total over the same period. And while the current drawdown doesn’t erase that history, it’s certainly raising questions about what role these assets are playing in 2026.
According to Bilello, part of what’s happening is down to rotation, with the tech sector seeing a 28% outperformance vs. the S&P 500 off the March lows, which he says is the largest such move ever recorded, being even bigger than the 1999-2000 dot-com run.
Tech now accounts for close to 40% of the S&P 500, some way above the 35% peak seen at the height of the dot-com bubble, and in such an environment, the market observer says capital has opted to move to assets with earnings momentum rather than staying on stores of value with little to no yield.
Price Action in Gold and BTC
At the time of writing, the world’s foremost cryptocurrency was trading above $66,000, having touched $67,000 for the first time in two weeks earlier in the day. That uptick followed news that the United States and Iran were due to sign a peace deal later in the week in Switzerland, which briefly lifted sentiment across risk assets.
Gold, meanwhile, is trading around $4,300 per troy ounce, with a weekly range between $4,025 and $4,340, and a 3% year-to-date dip that looks modest when compared to the cryptocurrency’s, even though it still represents an unusual reversal for an asset that spent much of the last two years at or near record highs.
The post Bitcoin, Gold Post Worst YTD Returns Among Major Assets, Challenging Their Safe Haven Status appeared first on CryptoPotato.


Passage odds have fallen to a coin flip, the July 4 deadline is gone, and Senator Lummis has named the price of failure: a wait until 2030. Here are the three ways this ends, what each one is worth, and how to tell which is unfolding.
Summary
- The CLARITY Act is no longer a simple pass-or-fail trade.
- Delay into 2027 is the quiet risk the market is least prepared for.
- Passage would matter most for assets with unresolved classification risk.
- Failure would keep US crypto regulation dependent on agency interpretation for years.
For most of this year the CLARITY Act felt like a question of when, not whether. It passed the House 294 to 134, cleared the Senate Banking Committee 15 to 9 on May 14, landed on the Senate calendar on June 1, and carried prediction-market odds above 70%. The most consequential piece of crypto legislation in American history looked close enough that the industry started pricing the win.
The mood has turned. The White House targeted a July 4 signing, and that deadline is now, in the words of one Fox Business correspondent tracking the bill closely, logistically dead, because the bill still needs a full Senate vote, House reconciliation, and a presidential signature, none of which can be compressed into the time remaining.
Two negotiations have fractured at once, an ethics fight over the President’s crypto holdings and a law-enforcement fight over developer protections in Section 604. Prediction markets that priced passage near 75% in May now hover between 45% and 59% depending on the platform and the day.
Senator Cynthia Lummis, one of the bill’s chief architects, has put a number on what failure costs: a wait until 2030, because a new Congress would have to restart the entire process from scratch.
That shift turns a victory lap into a real fork, and the clearest way to think about a fork is in scenarios. This piece lays out the three realistic paths from here: passage before the August recess, delay into 2027, and outright failure to 2030, with a rough probability on each and a clear-eyed read on what each would mean for the major assets, institutional capital, and the broader market.
The goal is not to predict which happens. It is to give you the framework to recognize which one is unfolding as the next six weeks play out, and to understand what is at stake in each.
Where the bill actually stands
The scenarios only make sense against an accurate baseline, so start with the current state.
The CLARITY Act has completed five of nine steps toward becoming law. It passed the House in 2025, cleared the Senate Banking Committee in May 2026, and secured a place on the Senate Legislative Calendar on June 1.
Four steps remain: full Senate floor debate, a 60-vote passage threshold, House-Senate reconciliation to merge the chambers’ versions, and a presidential signature. Each of those four is a real obstacle, and the 60-vote threshold is the tallest, because it requires roughly seven Democrats beyond the two who crossed over in committee.
The two committee crossovers, Senators Ruben Gallego and Angela Alsobrooks, made their support explicitly conditional on further work, and the conditions have since split into the two fights that created this fork. The ethics fight turns on provisions restraining officials, the President’s family most of all, from crypto conflicts of interest, after the family generated an estimated $2.3 billion from crypto ventures.
The Section 604 fight turns on developer protections that law enforcement groups want narrowed and the crypto industry wants preserved, with Senators Mark Warner and Catherine Cortez Masto tying their votes to law enforcement’s sign-off. One stablecoin-related dispute was already settled through a Tillis-Alsobrooks deal, which proves the fights are winnable, but the two that remain are live and fractured at the same time.
Behind every scenario sits the hard constraint of the calendar. The Senate has on the order of 31 session days before the August recess, no floor date is scheduled, and the chamber is competing with surveillance reauthorization, budget work, and must-pass funding bills.
That is the board. Now the three ways the game ends.
Scenario one: passage before the recess
Probability: roughly 35% to 45%. This is the scenario the prediction markets and the research desks still treat as live, though no longer as the favorite.
For passage to happen before the recess, both poison pills have to be defused in a matter of weeks. The ethics fight would need a compromise that gives Democrats real enforcement teeth without the White House reading it as targeting the President, the precise circle that the collapsed Tuesday meeting failed to square.
The Section 604 fight would need the White House’s law-enforcement outreach to satisfy the sheriffs and prosecutors enough to release Warner and Cortez Masto, without stripping the developer protections that would cost the bill its industry support. Then the merged bill needs floor time the leadership has not yet scheduled, 60 votes, a House that accepts the reconciled text, and a signature.
It is a lot to do in six weeks, but it is not impossible. The bill has surprised skeptics before by finding last-minute deals, as the committee markup itself did.
If it passes, the outcome is the largest positive catalyst crypto has had from Washington. The framework that has been promised for years becomes statute: the SEC-CFTC jurisdiction split is settled, digital-commodity classification is written into law instead of agency interpretation, and the developer protections and market-structure rules give institutions the durable certainty they have been waiting for.
The assets with the most classification overhang re-rate first and hardest, because they have the most uncertainty to shed. XRP is the clearest beneficiary, since the statute would make permanent the commodity classification the SEC and CFTC granted by interpretation in March, the difference between a ruling the next administration can reverse and a law it cannot.
That is what the bill would unlock for the most exposed asset. Standard Chartered’s conditional $8 XRP target is built on exactly this scenario plus sustained ETF inflows.
Ethereum carries real exposure too, with one bank holding a $7,500 conditional 2026 target tied to passage. The broad market would likely read passage as the all-clear that unlocks the next wave of institutional allocation.
One catch worth remembering: much of this is already partly priced. The market spent the spring expecting passage, so a yes vote delivers the catalyst but with some of the move already pulled forward.
The cleanest gains would accrue to the specific assets whose classification the statute resolves, not to the market as a whole.
Scenario two: delay into 2027
Probability: roughly 35% to 45%. This has quietly become the most likely single outcome, and it is the one the market is least prepared for, because it is neither the win nor the catastrophe.
Delay happens when the bill does not fail outright but runs out of runway. The poison pills prove too tangled to defuse before the recess, leadership cannot find floor time amid competing priorities, the 60 votes do not materialize in the window, and the bill slips past August.
Lummis has warned that missing the pre-recess window risks pushing the bill into the political uncertainty of the midterm season, which is the mechanism that turns a short delay into a long one. A bill that does not pass before the recess does not automatically die, but it enters a far more hostile environment.
That environment includes a Senate distracted by elections, a narrowing willingness among Democrats to hand the administration a win, and a calendar that gets worse, not better, through the back half of the year.
Delay’s market consequence is a slow bleed of the premium that passage optimism built into prices, not a crash. The assets that rallied on passage hopes, XRP most visibly, give back the conditional premium as the timeline extends, and the conditional price targets get pushed out a year or revised down.
Standard Chartered already cut its near-term XRP target earlier in 2026 citing slow negotiations. Institutional capital that was waiting for statutory certainty keeps waiting, which means the larger allocation wave that passage would unlock simply does not arrive on the expected schedule.
Delay is not failure: the agency-level classifications from March stay in place, the ETFs keep trading, and the framework remains alive for a 2027 vote. But the market would spend the second half of 2026 trading without the catalyst it spent the first half anticipating, and that absence is itself a drag.
Delay is the scenario the market handles worst because it resists a clean narrative. Passage is a clear buy, failure is a clear sell, and delay is a grinding uncertainty that pulls support without offering resolution, the hardest condition to position around.
Scenario three: failure to 2030
Probability: roughly 15% to 25%. The least likely of the three, but no longer a tail risk, and the one with the largest consequences, which is why it deserves serious treatment instead of dismissal.
Outright failure means the bill does not pass in 2026 and does not get a realistic second chance until a new Congress rebuilds it from scratch. Lummis has named 2030 as the practical horizon for that reset, because a fresh Congress would have to restart the entire legislative process, reintroduce, re-markup, and re-negotiate in a political environment nobody can forecast.
Failure does not require a dramatic floor defeat. It requires only that the two poison pills stay unresolved through the recess and that the post-midterm Congress lacks the will or the composition to revive the bill.
A quiet death by calendar is more likely than a loud death by vote.
Failure’s consequences compound across the market. For the assets whose legal status the bill would settle, failure means living indefinitely with agency interpretation instead of statute, which is the reversible certainty that institutions discount.
XRP keeps its March commodity classification, but that classification stays vulnerable to a future administration, and the statutory permanence that underwrites the bull case never arrives. That would likely pull XRP back toward the bear-case range that assumes the disconnect persists, making it the asset with the most riding on the outcome.
The SEC-CFTC jurisdiction split stays unresolved, leaving the agencies to govern crypto by enforcement and interpretation, the very regime CLARITY was written to end. The developer protections of Section 604 do not become law, leaving open-source builders exposed to the money-transmitter question the bill would have settled.
ETF pipelines that depend on clear classification stall, and the institutional allocation wave that statutory certainty would unlock is deferred for years. The one bright spot is that the GENIUS Act’s stablecoin rules, already law, survive regardless, so the market is not left with nothing, just without the market-structure framework that matters most.
The deepest cost is not any single price move but the signal it sends. Even with House passage, committee approval, a supportive White House, and broad bipartisan agreement on the underlying goal, Congress could still fail to finish.
That would tell institutions that US crypto regulation remains a multi-year waiting game. It would also push the most cautious capital to keep sitting out or to deploy in friendlier jurisdictions.
That is the scenario the industry fears, and at 15% to 25%, it is real enough to plan around.
Why delay, not failure, is the underrated risk
Most coverage frames the question as pass-or-fail, which misreads the actual distribution, because the middle outcome is both the most likely and the most overlooked.
Binary framing exists because it makes a cleaner story. Either crypto gets its rulebook or it does not, either the catalyst fires or it dies.
But the calendar math points most strongly at neither extreme. The bill is too advanced and too widely supported to simply collapse, which caps the failure probability, and the poison pills are too tangled and the calendar too crowded to clear in six weeks with confidence, which caps the passage probability.
What is left in the middle, the bill surviving but not passing in the window and slipping toward an uncertain 2027, is the single fattest part of the probability distribution. It is also the outcome almost no one is positioning for.
This matters because delay and failure feel similar in the moment and resolve very differently. In both, the catalyst does not arrive on schedule and the passage premium bleeds out of prices.
But delay leaves the framework alive for a 2027 vote, while failure pushes it to 2030, and the difference between a one-year wait and a four-year reset is enormous for institutional planning and for the assets whose classification hangs in the balance. A market that lumps delay and failure together as the bear case will misprice both.
It will treat a survivable delay as a catastrophe and sell too hard, or it will dismiss the failure risk as merely delay and be unprepared if the bill truly dies. The two scenarios deserve separate handling, and the most likely path runs through the one the market is least equipped to read.
What to watch, scenario by scenario
The next six weeks will signal which path is unfolding, and a few specific markers separate the three.
A scheduled floor date is the clearest passage signal. Until leadership announces floor time, passage in the window stays aspirational, and the longer the calendar stays silent, the more probability shifts from passage toward delay.
A floor date being set, especially paired with news that one or both poison pills have a compromise, would be the strongest sign scenario one is live. That is why the full procedural map and calendar matters as much as the headline odds.
Watch also for a breakthrough on the ethics enforcement mechanism that both Democrats and the White House can accept, especially the conflict-of-interest fight in depth. The other signal is the White House’s law-enforcement outreach producing public sign-off from the police and prosecutor groups that would release Warner and Cortez Masto.
The delay signal is the absence of those things as the calendar burns. Each session day that passes without a floor date, without an ethics compromise, and without movement on Section 604 pushes probability from passage toward delay.
Any explicit acknowledgment from leadership that the bill will wait until after the recess would confirm scenario two. The failure signal is harder to spot because it arrives quietly: a recess that begins with the bill still stuck, followed by the post-midterm Congress showing no appetite to revive it, would mark the slide toward scenario three.
Lummis-style warnings about the 2030 horizon are the canary.
Above all, the prediction markets are the real-time gauge. They fell from above 70% to the high 40s and 50s as the poison pills hardened, and they will move first and fastest if either pill softens or if a floor date appears.
They are not infallible, but they aggregate the informed view better than any single headline. A sustained move back above 60% or down below 40% would tell you which scenario the smart money is converging on before the official outcome is known.
What it means for holders and traders
For holders of the assets most exposed to CLARITY, XRP above all, the practical reading is to size positions for a distribution of outcomes instead of a single bet. The bull case for these assets is real but conditional on passage, the bear case is real but conditional on failure, and the most likely path, delay, sits in between and pulls the conditional premium out without delivering the catastrophe.
A holder who has priced in passage as the base case is over-exposed to the most likely disappointment. A holder who has priced in failure is over-exposed to a deal that could still come together.
The disciplined position acknowledges all three branches and their rough weights.
For traders, the scenarios map to an event calendar with the floor date as the pivotal unknown. The passage premium can be traded on the markers above, building as a floor date and compromises appear, fading as the calendar burns silent.
The asymmetry to respect is that passage is partly priced while failure is not. That means the downside surprise of a confirmed delay or failure may move prices more than the upside surprise of a passage the market half-expects.
Between the markers, the CLARITY-exposed assets trade on the broad market and their own supply dynamics, as they have all year, with the legislative catalyst layered on top.
For institutions, the calculus is the cleanest, because it is the one the entire bill is about. The capital waiting on statutory certainty stays on the sidelines in both the delay and failure scenarios, and only passage releases it.
An institution modeling its crypto allocation around CLARITY should weight the roughly even odds of passage against the better-than-even combined odds of delay-or-failure. The most likely near-term outcome is continued waiting, not the green light.
The bill remains the single most important regulatory variable for US crypto. Its three-way fork is the dominant uncertainty for institutional capital through the back half of 2026.
The fork in the road
The CLARITY Act spent the first half of 2026 looking like a sure thing and enters its decisive stretch looking like a coin flip with a long tail. The three paths from here, passage in roughly four to five cases in ten, delay in another four to five, and failure to 2030 in perhaps two, define the most important regulatory question in US crypto.
They resolve over the next six weeks against a calendar that gives the coalition almost no room for error.
It is tempting to collapse this into hope or doom, to treat the bill as either the catalyst that lifts the market or the failure that sets it back years. The accurate picture is more uncomfortable: the single most likely outcome is the one in the middle, a delay that resolves nothing and pulls the passage premium out of prices while leaving the framework alive for a fight next year.
Passage would be the largest Washington catalyst crypto has had. Failure would push the rulebook to 2030 and tell institutions the wait is far from over.
Delay, the quiet favorite, would do neither. It would leave the market to spend the back half of the year trading without the catalyst it spent the front half expecting.
Watch the floor calendar, the two poison pills, and the prediction markets, in that order. They will tell you which fork the bill is taking before the headlines confirm it.
For a market that has waited a decade for a rulebook, the next six weeks decide whether the wait ends in 2026, extends to 2027, or stretches all the way to 2030. The odds, for now, are close enough that all three remain in play.
Frequently asked questions
What happens to crypto if the CLARITY Act fails?
If the bill fails outright, Senator Lummis has warned the next realistic chance for comprehensive crypto market-structure law is 2030, because a new Congress would have to restart the process. The practical consequences: the SEC-CFTC jurisdiction split stays unresolved, agencies keep governing crypto by enforcement and interpretation, XRP’s March commodity classification stays reversible rather than becoming permanent statute, Section 604 developer protections do not become law, and the institutional capital waiting on statutory certainty stays on the sidelines. The GENIUS Act’s stablecoin rules, already law, would survive regardless.
What are the odds the CLARITY Act passes in 2026?
Prediction markets price 2026 passage between roughly 45% and 59% as of mid-June, down from above 70% in May. Realistically the outcome splits three ways: passage before the August recess at roughly 35% to 45%, delay into 2027 at roughly 35% to 45%, and outright failure to around 2030 at roughly 15% to 25%. The July 4 signing target the White House wanted is no longer logistically possible.
Why is delay more likely than outright failure?
The bill is too advanced and too widely supported to simply collapse, which caps the failure probability. But the two unresolved fights, ethics and Section 604, are too tangled and the Senate calendar too crowded to clear with confidence in the six weeks before the recess. That leaves the middle outcome, the bill surviving but slipping past the window into an uncertain 2027, as the single most likely path. Most coverage still frames the question as a simple pass-or-fail.
Which crypto assets are most affected by the CLARITY Act?
XRP carries the most direct exposure, because the bill would convert its March 2026 commodity classification from a reversible agency interpretation into permanent statute, which underwrites bullish targets like Standard Chartered’s conditional $8. Ethereum has real exposure too, with conditional bank targets tied to passage. More broadly, any asset with classification uncertainty and the developer-dependent DeFi sector covered by Section 604 are exposed. Stablecoins are already covered by the separate GENIUS Act.
What is the difference between delay and failure for the CLARITY Act?
Delay means the bill misses the pre-recess window but stays alive for a 2027 vote, so the framework survives and the catalyst is merely postponed. Failure means the bill does not pass and does not get a realistic second chance until a new Congress rebuilds it, which Lummis has pegged at around 2030. The market often lumps the two together. A one-year delay and a four-year reset are very different for institutional planning and for the assets whose classification depends on the bill.
What should I watch to know which scenario is happening?
Three markers matter, in order. First, whether Senate leadership schedules a floor date, the clearest sign passage is live. Second, whether the two poison pills find compromises: an ethics enforcement mechanism both sides accept, and law-enforcement sign-off on Section 604 that releases the two Democratic holdouts. Third, the prediction markets, which move first and fastest: a sustained climb back above 60% signals passage, while a slide below 40% signals delay or failure.
As of June 16, 2026. Legislative status changes rapidly; verify the current state of negotiations before relying on this analysis. This article is information, not investment advice.


Locus Founder settles payments in USDC, the dollar-pegged stablecoin, directly into a non-custodial wallet that the agent controls. No bank account required. No Stripe intermediary is taking days to settle. The agent earns, holds, and spends money in real time — and the infrastructure is built so humans can audit and control exactly what it does with that money. When a sale is made, Checkout With Locus, a Stripe-style payment SDK, settles the funds directly into the agent’s Locus wallet.
“The AI agent that earns you a dollar by running your business, just by texting it. And it’s an evolution of everything we’ve built. Every Locus Founder user is a Pay With Locus user (credits run off our wallets), a Build With Locus deployment (sites deploy on BWL), and a consumer of our pay-per-use API suite. It’s the first app anyone can pick up and use, sitting on top of all of our infrastructure,” the official post said.
In other words, Locus isn’t just an AI that texts you business updates. It is a vertically integrated system where an AI agent can research, build, market, sell, and get paid, entirely autonomously, with USDC as the financial layer connecting it all.
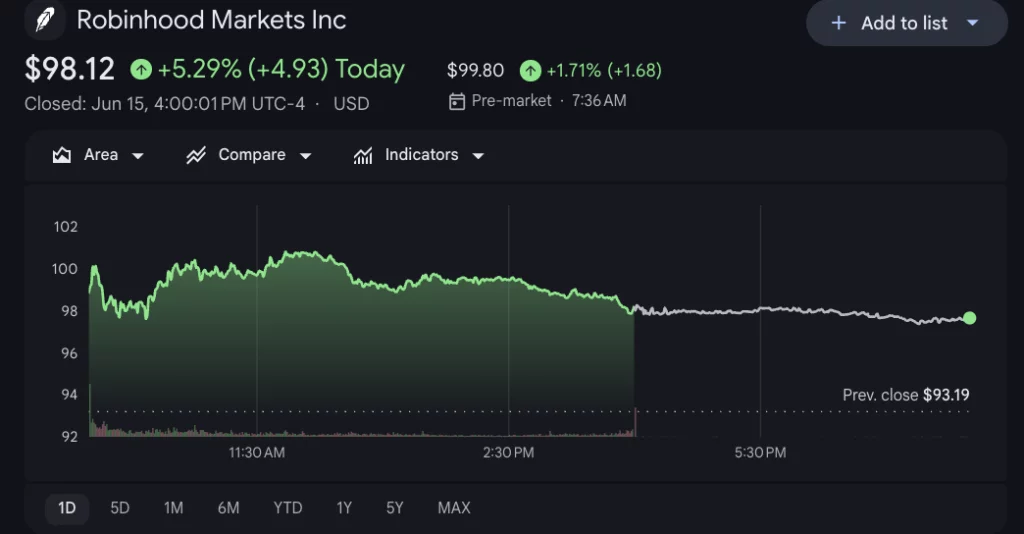
Robinhood has announced plans to cut about 290 jobs, or roughly 10% of its full-time workforce, while recording approximately $28 million in related charges as the online brokerage moves to simplify its management structure.
Summary
- Robinhood will cut about 290 jobs, or 10% of its workforce, as the company reduces management layers and closes remaining open roles.
- The trading platform expects roughly $28 million in restructuring related costs and said record June trading volumes support the move.
- The workforce reduction comes months after weaker crypto activity weighed on Robinhood’s first quarter results and profit.
According to Robinhood, the layoffs are part of an effort to operate more efficiently by reducing layers of management and creating a leaner organization. The company said it will also close the small number of remaining open positions.
In a message to employees shared on X, Robinhood Chief Executive Officer Vlad Tenev said the company was entering the restructuring from a position of strength.
“Robinhood’s business has never been stronger,” Tenev wrote, adding that the company could not continue operating as a heavily layered organization and needed to remain focused.
“Because our financial position is strong, we are making this change proactively. The goal is to maximize our talent density and ensure that our culture is defined by an absolute elite performance bar and a superlative commitment to our customers […] We will also continue hiring strategically, investing heavily in top-tier talent, and utilizing frontier technologies to push our execution even further.”
Investor reaction was positive, with Robinhood shares rising nearly 3% in premarket trading. Despite the gain, the stock had fallen 13% this year through Monday’s close.

A regulatory filing cited by the company showed Robinhood employed about 2,900 full-time workers as of Dec. 31. Management expects to book around $20 million in severance and employee benefit costs, along with roughly $8 million in share-based compensation expenses. The charges are expected to be recognized during the second quarter.
Trading activity rebounds after weak first quarter
While announcing the workforce reduction, Robinhood pointed to strong trading activity across its platform. The company said June month-to-date average daily volumes had reached record levels in equities, options, and prediction markets.
Those figures stand in contrast to conditions earlier this year. During its first-quarter earnings report in April, Robinhood missed Wall Street profit expectations as weaker cryptocurrency trading weighed on results.
Revenue from cryptocurrency trading fell 47% year over year to $134 million in the January-to-March period, while transaction-based revenue of $623 million came in below analyst estimates, according to the company’s earnings report.
Several analysts identified crypto trading as a major source of pressure during the quarter. Morningstar described the segment as a “particular pressure point,” while Raymond James analysts said trading volumes had become uneven and showed signs of retail investor fatigue.
At the time, Robinhood also faced a more difficult operating environment as cryptocurrency prices declined and retail participation slowed. Analysts at KBW noted that competition across the crypto trading industry was intensifying, with both digital asset exchanges and traditional financial firms expanding their offerings.
Market conditions have improved since then. Robinhood cited easing tensions in the Middle East and strength in equity markets as factors supporting retail trading activity in recent months.
To reduce its exposure to swings in trading volumes, the company has continued expanding beyond its core brokerage business. Retirement accounts, wealth management services, and credit card products have become part of Robinhood’s effort to build additional sources of revenue that are less dependent on market activity.
Earlier this month, Robinhood expanded its international footprint by launching stock and options trading services in Canada through its acquisition of Canadian crypto platform WonderFi. The move brought the company’s investing products to Canadian users for the first time and added to its efforts to grow beyond its core U.S. retail trading business.
Bitcoin is facing a fresh macro headwind after the Bank of Japan raised interest rates to 1.0%—its highest level since 1995—marking the latest stage of Japan’s exit from ultra-low rates. The decision has added pressure to a market already trying to hold above the $60,000 psychological level, even as local newsflow points to partial risk-on moments.
According to trading-history patterns compiled around previous Bank of Japan hikes, BTC has tended to slip over the following month. In the 30 days after the last four BoJ rate increases, Bitcoin averaged a 5.74% decline, with downside scenarios ranging from the low-$60,000s to the mid-$50,000s depending on how closely the current setup resembles earlier post-hike drawdowns.
Key takeaways
- In the 30 days after the last four BoJ rate hikes, Bitcoin averaged a 5.74% decline.
- Historical post-hike outcomes suggest BTC’s downside could cluster between about $62,700 and $56,700 if selling pressure repeats.
- Recent BoJ action comes against an environment of inflation sensitivity and policy tightening pressures, which typically weighs on risk assets.
- BoJ tightening cycles have often lined up with periods of recession in the US, with the COVID shock as a major exception.
BoJ lifts rates to the highest level in decades
The Bank of Japan raised its short-term policy rate by 25 basis points to 1.0% on June 16, according to the BoJ’s policy-rate documentation. The move represents Japan’s highest interest-rate level since 1995, and it follows a broader tightening path driven by concerns over persistent inflation risks.
In the BoJ’s rationale, policymakers pointed to higher energy costs and ongoing supply disruptions linked to the Middle East. While the rate decision is specific to Japan, the market implication tends to be global: Japan has long acted as a major source of low-cost funding for international investors.
On the day of the decision, Bitcoin was down nearly 2.5% from a local peak around $67,250, though it was still holding on to gains from earlier in June. The critical question for traders is whether this pullback stays contained or develops into a larger post-hike trend.
What past BoJ hikes have meant for Bitcoin over the next 30 days
Data drawn from prior BoJ tightening episodes suggests a recurring pattern. The compiled results show that in the 30 days after the last four rate hikes, Bitcoin averaged a 5.74% decline. The figure is not uniform, but the direction has frequently been negative.
Specifically, Bitcoin fell:
- 5.59% after the March 2024 BoJ hike;
- 10.89% after the July 2024 hike;
- 14.77% after the January 2025 hike.
The main counterexample in the dataset came after the December 2025 hike, when BTC gained 8.31% over the subsequent 30 days. However, the article notes that this rebound followed a sharp correction from an October 2025 peak, implying the market may have been positioned far more defensively heading into that decision.
Applying the average post-hike decline to the current area of roughly $66,500 produces a theoretical downside target near $62,700—just above the $59,000 to $62,000 demand range referenced in the same analysis. More severe parallels are also plausible if the current selloff behaves like earlier episodes: a drop similar to July 2024’s post-hike decline could point toward roughly $59,200, while a pattern closer to January 2025 would imply a move down toward about $56,700.
Beyond the narrower 30-day window, the same compiled view highlights that deeper drawdowns have occurred in some post-BoJ phases since March 2024, with Bitcoin losing between 26% and 38% after Japan’s rate decisions. The chart referenced in that context was shared by crypto analyst Gerla.
Why Japan tightening can reverberate through crypto markets
Japan’s low-rate regime has mattered to global markets for years because it supported a common funding strategy: when Japanese rates were near zero, traders could borrow yen cheaply and redeploy that capital into higher-yielding or higher-risk assets elsewhere, including equities and cryptocurrencies.
As Japan raises rates, that trade typically becomes less attractive. The immediate effect is usually a shift in how leveraged investors manage risk, and—critically—how quickly they unwind positions when liquidity conditions tighten.
That mechanism can be rough for assets like Bitcoin. Crypto often trades as a high-beta risk asset, so when global investors become more cautious, drawdowns can widen quickly.
It’s also worth noting that BoJ rate decisions have tended to arrive late in broader global cycles. In a post on X, André Dragosch, European Head of Research at Bitwise, argued that BoJ hiking cycles have historically coincided with US recession periods, with the COVID shock as the main exception.
Dragosch’s comparison—based on data shown against recession periods and Japan’s unsecured overnight call rate—frames a longer-running policy rhythm: Japan often tightens when inflation is still elevated and when liquidity support for risk assets is already deteriorating.
What traders should watch after the decision
The historical record summarized here does not guarantee the next month’s outcome for Bitcoin, but it does identify a market sensitivity to BoJ-driven tightening. The immediate level to monitor is whether BTC can defend the $60,000 area and, if not, whether losses remain nearer the lower-$60,000s demand band or broaden toward the low-to-mid-$50,000s scenarios implied by past post-hike drawdowns.
Next, investors should also watch whether broader risk markets tighten in tandem with Japan’s move—because the most painful post-hike periods tend to be those where global liquidity conditions worsen, not just those where Bitcoin experiences a short-term dip.


Key takeaways
- XLM is up 12% in the last 24 hours, outperforming the broader crypto market.
- The rally comes as Open Interest hits $261 million.
XLM extends weekly gains
Stellar’s XLM attracted renewed buying interest on Tuesday after posting strong gains at the start of the week. XLM surged over 11%, bringing the asset closer to key resistance levels that could determine the next phase of its price action.
Supporting the rally are improving derivatives and on-chain metrics, including rising open interest, increasing trading volumes, and positive funding rates, all of which point to growing market participation and strengthening bullish sentiment.
Data from CoinGlass shows a notable increase in derivatives activity for both cryptocurrencies.
XLM’s open interest climbed to $261 million. Rising open interest is generally viewed as a sign that new capital is entering the market and that traders are increasing exposure to the assets.
The increase suggests investors are positioning for further upside as momentum improves across the broader crypto market.
Funding rates have also shifted in favor of bulls. CoinGlass data shows that XLM’s funding rate reached 0.0061% on Tuesday.
Positive funding rates indicate that long-position holders are willing to pay a premium to maintain bullish bets, often reflecting growing confidence in higher prices.
On-chain activity provides additional support for the bullish outlook. According to Santiment, Stellar’s trading volume is climbing to $879.25 million from just $153 million over the past few days.
The sharp rise in activity suggests renewed investor interest in the XLM ecosystem as prices recover from recent lows.
Stellar technical outlook: Momentum continues to improve
XLM is trading near $0.227 on Tuesday, maintaining a constructive technical setup after rebounding from last week’s correction.
The token remains above a key support zone formed by the 61.8% Fibonacci retracement level near $0.200 and the 200-day EMA around $0.199.
Additional support comes from the 50-day and 100-day EMAs at $0.185 and $0.182, respectively.
The RSI is currently near 71, indicating healthy momentum without entering overbought territory. Meanwhile, the MACD continues to trend higher, signaling that bearish pressure is gradually weakening.
If the rally persists, immediate resistance is seen at the $0.237 level, with an additional supply zone at the $0.260 region.
However, if the bearish trend returns, immediate support is located at the $0.200 psychological level.

A daily candle break below this level could expose further demand zones at $0.185 and $0.177 in the near term.
A breakout above $0.237 could pave the way for a stronger move higher, while holding above the $0.200 support zone remains crucial to preserving the current bullish structure.

Solana price has surged more than 20% from its June low and returned to a critical support-turned-resistance level that could determine whether the token reclaims its multi-month consolidation range.
Summary
- Solana price has rebounded more than 20% from its June low and is testing the former support level of a multi-month consolidation range near $75.7.
- A breakout above the range floor could reopen a path toward $83.5, $90, and eventually the channel resistance near $98.3.
- Failure to reclaim $75 could trigger a pullback toward $71.8, $69.1, and potentially the June low around $60.
According to data from crypto.news, Solana (SOL) price traded around $75 on June 16, up more than 20% from its early June low near $60.
SOL’s recovery followed reports that the U.S. and Iran had reached a framework agreement that could reopen the Strait of Hormuz, easing concerns about energy supply disruptions and inflation. Oil prices moved lower after the announcement, while Bitcoin, Ethereum, and other risk assets posted strong gains.
The rally has also coincided with renewed institutional activity surrounding the Solana ecosystem. On June 15, Solana Company rejected a non-binding acquisition proposal from Forward Industries. The proposal valued the company at a premium to its market price and arrived amid growing competition among firms building SOL-focused treasury strategies.
Derivatives markets have reinforced the move. CoinGlass data showed open interest climbing alongside price during the rebound, while the sharp recovery forced traders holding bearish positions to unwind. Liquidation-driven buying helped accelerate the move from the low-$60 region toward current levels.
Solana is attempting to reclaim a lost multi-month support zone
The daily chart shows that Solana spent nearly four months trading inside a horizontal consolidation channel bounded by support near $75.7 and resistance around $98.3. The structure broke down in early June when sellers pushed SOL below the range floor, triggering a decline toward $60.
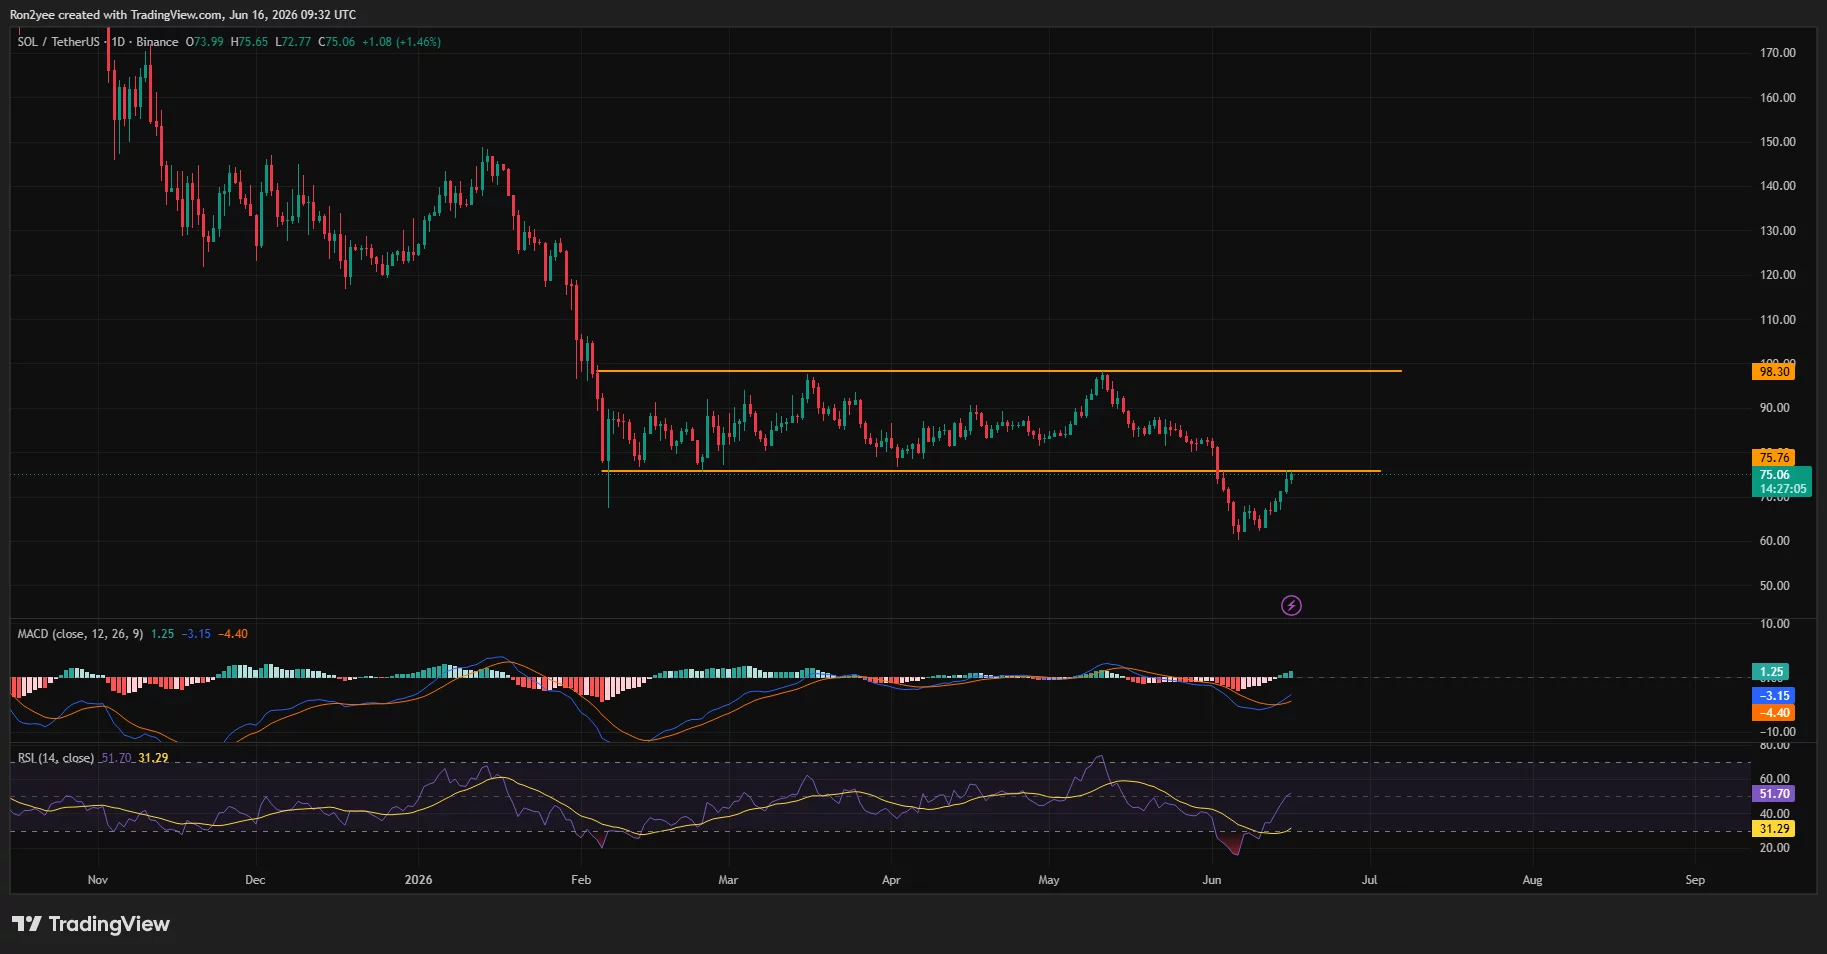
Solana has now returned to the former support zone, placing the market at a critical technical inflection point. A successful reclaim would invalidate the recent breakdown and place Solana back inside the channel that governed price action throughout much of 2026.
On the four-hour chart, SOL has already broken above a descending trendline that had capped rallies since late May. The recovery also carried price through several Fibonacci retracement levels measured from the June decline.
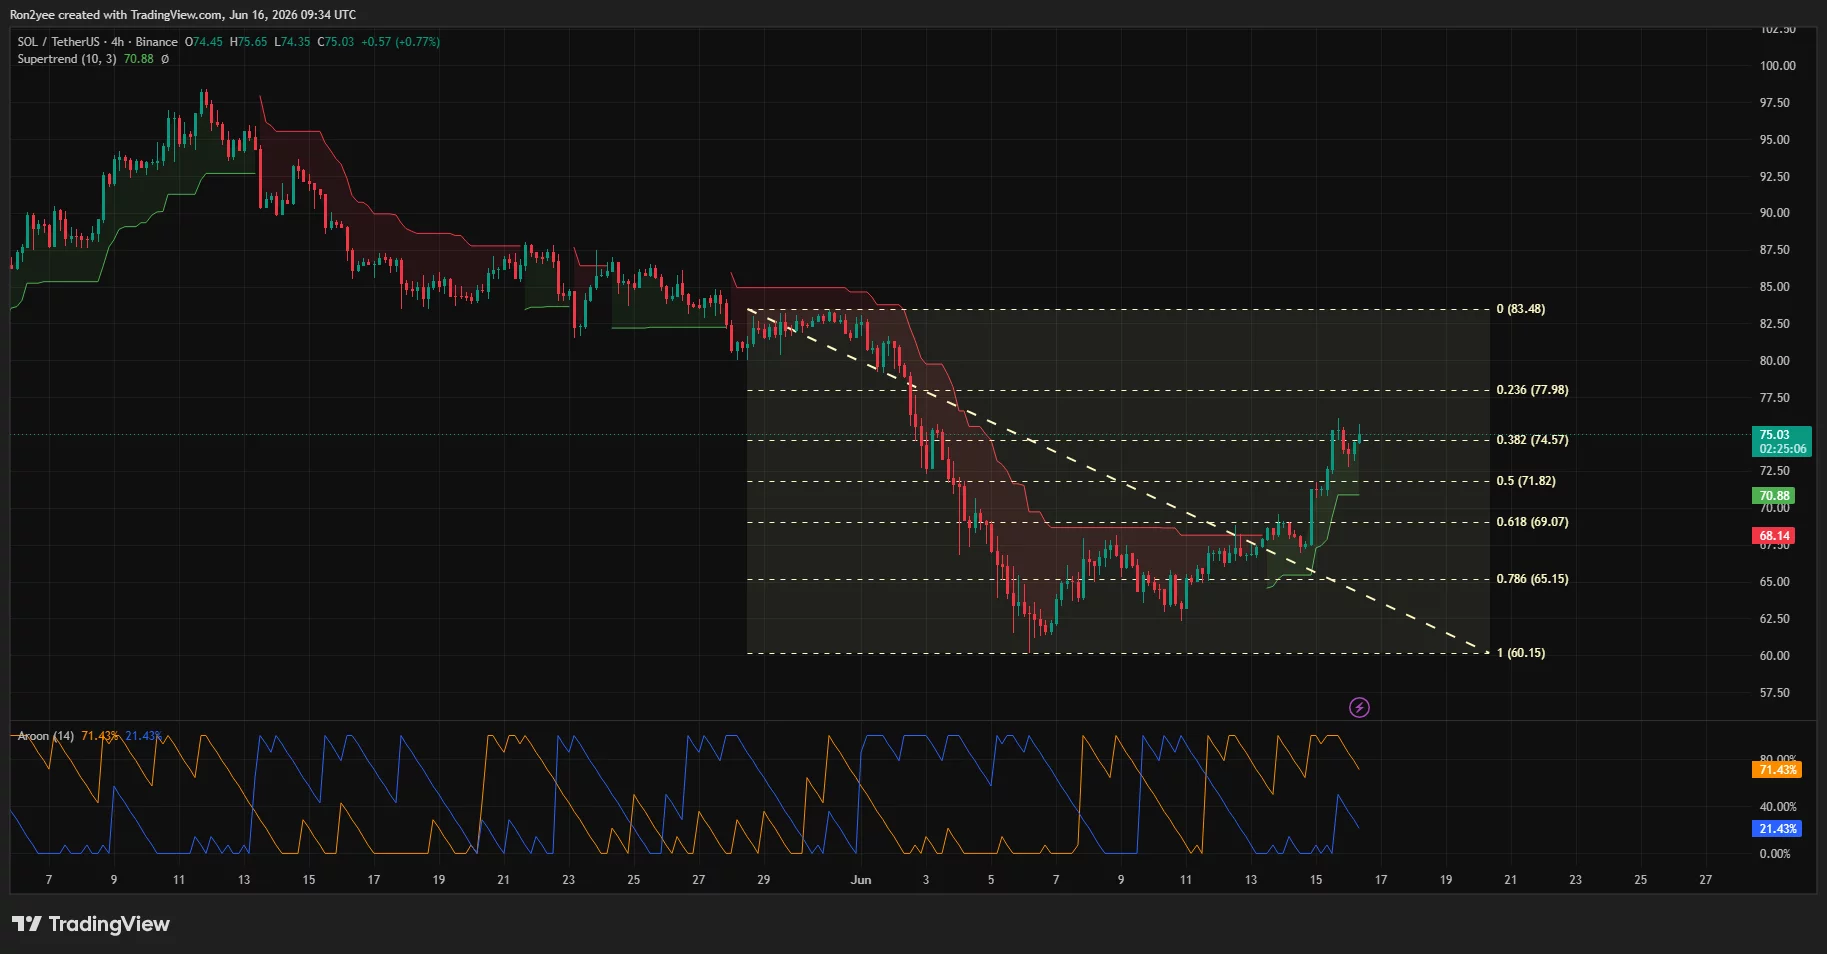
Immediate resistance sits near the 0.382 Fibonacci level at $74.6, followed by $78 and then the prior swing high around $83.5. Beyond that area, traders would likely focus on the upper half of the former consolidation range between $90 and $98.
Momentum indicators have improved alongside the price recovery. The daily RSI has moved back above 50 after briefly entering oversold territory earlier this month, while the MACD has started to turn higher after a prolonged bearish phase. On the four-hour timeframe, the Supertrend indicator remains bullish with support near $70.9.
Not all analysts are convinced the recovery is complete. In a June 16 X post, analyst Crypto Coral said Solana recently broke down from a bearish flag structure and remains near a key resistance zone.
“$SOL broke down from a bearish flag and is now retesting key resistance near the EMA. Unless bulls reclaim this level, $SOL could face another leg lower before a sustainable reversal.”
Failure at $75 could expose downside toward the June lows
A rejection near the former range floor would strengthen the case that the recent rally is merely a retest of broken support rather than the beginning of a larger trend reversal.
Under that scenario, traders would likely monitor the 50% Fibonacci retracement near $71.8 and the 61.8% level around $69.1 as the first downside targets. A break below those levels could expose support near $65 before attention shifts back to the June low around $60.
Macro risks remain present despite the latest relief rally. The market’s recent gains have been tied closely to developments surrounding the U.S.-Iran agreement and expectations that the Strait of Hormuz will remain open. Any setback in negotiations, renewed tensions in the region, or a rebound in oil prices could pressure risk assets and weaken demand for cryptocurrencies.
As such, Solana’s battle around $75 remains the key chart level. Bulls need a decisive reclaim of the former channel floor to reopen a path toward $90 and eventually $98, while sellers will look for rejection at resistance to reassert control of the trend.
Disclosure: This article does not represent investment advice. The content and materials featured on this page are for educational purposes only.

Bitcoin’s bounce appears to be running into a familiar constraint: trading momentum is improving only superficially, and market participants are still leaning heavily on whether major geopolitical risks ease. At the same time, institutional-scale buying continued, with Michael Saylor’s Strategy adding another tranche of BTC and pushing its total holdings to 846,842 Bitcoin.
On the regulatory front, the US CFTC also made a personnel move that underscores its widening use of data and blockchain analysis. In a development that links crypto enforcement and market-structure oversight, CFTC Chair Michael Selig said the agency has appointed Donald Battle—previously an adviser to the SEC’s crypto task force—as its chief data innovation officer.
Key takeaways
- Swissblock and LVRG Research both indicate Bitcoin’s recovery lacks “conviction,” pointing to weak participation and soft on-chain signals.
- Geopolitics remain a dominant driver: a potential US-Iran peace deal is expected to be signed soon, but any breakdown could raise volatility.
- The CFTC has appointed Donald Battle, an SEC crypto task force adviser with blockchain forensics experience, as chief data innovation officer.
- Strategy bought 1,587 BTC for $100 million between June 8 and 14, bringing its total holdings to 846,842 BTC.
Bitcoin’s rebound depends on peace odds, but on-chain signals stay subdued
Bitcoin’s price strength has been notable—especially after it reclaimed the $67,000 level on Monday—but analysts caution that the underlying flow of activity is not strong enough to confirm a durable trend. According to reporting that cites Swissblock and LVRG Research director Nick Ruck, the market is still operating in a “weak momentum” environment.
Ruck told Cointelegraph that while Bitcoin reclaimed $67,000, “momentum remains weak,” citing declining volume and on-chain metrics that appear stagnant. His view is that the rebound could fade quickly if confirmation doesn’t show up in participation and network data.
Swissblock echoed the same theme, stating that Bitcoin’s price-momentum measures and on-balance volume (OBV)—a commonly used gauge of buying versus selling pressure—are stuck in a “weak momentum and participation regime.” In other words, price is rising, but the market behavior around that move has not fully shifted into a sustained accumulation phase.
The timing of the next test may be geopolitical. Ruck warned that if the US-Iran peace framework fails, spillover effects—ranging from renewed instability to potential oil-market shocks—could put Bitcoin on a “volatile path.” In that scenario, geopolitical catalysts would continue to dominate crypto price action rather than technical recovery signals.
US President Donald Trump said Sunday that the US has completed a peace deal with Iran to end months of conflict, with the expectation that it would be signed on Friday. Trump also said the arrangement would reopen the Strait of Hormuz and lead the US to lift its blockade—though the details remain largely unknown, and uncertainty itself can keep risk assets sensitive.
The CFTC appoints a data-and-forensics specialist from the SEC crypto task force
The US futures regulator’s staffing move is likely to matter beyond headlines because it ties together enforcement capability, data innovation, and crypto market oversight. The CFTC announced that Donald Battle—described as an adviser to the SEC’s crypto task force—will become the agency’s chief data innovation officer.
According to a CFTC notice quoted via Cointelegraph, CFTC Chair Michael Selig said the appointment reflects Battle’s experience in “data science, blockchain forensics, programming interfaces, and cutting-edge AI solutions.” Battle previously served as a blockchain data adviser for the CFTC and worked as a crypto enforcement specialist with the Treasury Department’s Financial Crimes Enforcement Network.
The key implication for market participants is that the CFTC is positioning itself to process and act on blockchain-related information more systematically. While the agency’s broader approach to crypto regulation has been evolving for years, appointments like this suggest an internal emphasis on analytics and investigative tooling—areas that can influence how quickly regulators can identify risks, trace activity, and respond to misconduct.
The move also arrives as Congress continues to discuss changes to the roles of the CFTC and SEC in digital asset market structure. In particular, the CLARITY Act—referenced in the same coverage—would reshape aspects of responsibilities across agencies. In that context, a chief data innovation officer with forensics experience can be read as a signal that the CFTC wants to be technically prepared for whatever additional responsibilities—or compliance burdens—follow legislative change.
Strategy continues its BTC buying streak, lowering average cost basis
While technical analysts debate whether Bitcoin’s rebound has enough support, the largest publicly known buyer continues to accumulate. Strategy, the company controlled by Michael Saylor, purchased 1,587 BTC for $100 million between June 8 and 14, according to an SEC 8-K filing referenced in Cointelegraph’s report.
The filing indicates an average acquisition price of $63,024 per Bitcoin. That purchase lowered Strategy’s overall average cost basis slightly, bringing it to about $75,656. Strategy’s reported position after the transaction is 846,842 BTC accumulated at a total cost of $64.07 billion.
CoinGecko data cited in the coverage places the current BTC price around $66,216, which the article estimates values Strategy’s holdings at roughly $56.1 billion. The gap between acquisition cost and current price highlights that—even amid recovery—Strategy’s entries are still largely underwater relative to today’s market level.
Funding mechanics also remain consistent with prior activity. As noted in the report, Strategy financed the latest purchase through sales of its Class A common stock (MSTR). The structure matters for investors because it can introduce additional dilution risk even when BTC supply dynamics are supportive—particularly during periods when the BTC market isn’t yet moving with full momentum.
What to watch next for BTC and crypto markets
For traders and long-term holders, the near-term watchlist should center on whether Bitcoin’s recovery earns stronger participation signals—something Swissblock and LVRG’s commentary suggest is still missing—and on whether the US-Iran deal proceeds without disruption. On the policy side, keep an eye on how the CFTC uses its new data leadership to tighten analysis and enforcement, especially as Congress continues to work through proposals like the CLARITY Act.

Goldman Sachs BDC: Why The Worst May Not Be Over For Income Investors (NYSE:GSBD)

Bitcoin Lags Global Liquidity at Record Highs: Will It Catch Up?
Tom Holland confirms he and Zendaya secretly got married: 'I found my person'


-

 Business2 days ago
No Jackpot Winner as $257 Million Prize Rolls Over to $269 Million Monday Draw
-

 Crypto World5 days ago
Oppenheimer backs SpaceX as $70 billion retail frenzy builds
-

 Fashion4 days ago
Weekend Open Thread: Tuckernuck – Corporette.com
-

 Crypto World5 days ago
Markets Rally as SpaceX IPO Looms Amid Iran Tensions and Inflation Surge
-
 Crypto World2 days ago
Zimbabwe Requires Crypto Businesses to Register Annually Under New FIU Regulations
-

 Tech3 days ago
NanoClaw integrates JFrog registries to secure AI agent downloads
-
 Sports7 days ago
Bangladesh beat Australia after 20 years in ODIs, register only their second win over six-time world champions | Cricket News
-

 Tech4 days ago
This Week In Security: Microsoft On Microsoft, Register Your Domains, Linux On ARM, And FreeBSD Joins The File Cache Club
-

 Crypto World3 days ago
Bitget enters Argentina’s regulated crypto market through PSAV registration
-
 Tech5 days ago
Dutton Ranch star claims they ‘didn’t see any disruption’ on set following Chad Feehan’s exit from Yellowstone spinoff fueled by Taylor Sheridan clash rumors
-

 NewsBeat5 days ago
El Nino has formed in the Pacific and could set records, forecasters say
-

 Business6 days ago
Thailand Ranks Second Worldwide for AI Adoption Growth, Microsoft Reports
-

 Tech6 days ago
‘This is Seattle’s position on AI’: City Council votes unanimously to pause big new data centers
-

 Politics5 days ago
Politics Home | Healey Resignation Is “Colossal Failure Of Government”, Says Former Labour Defence Secretary
-
 Entertainment5 days ago
Donnie Wahlberg & More Heat Up Las Vegas at Circa’s Barry’s Downtown Prime
-

 Sports5 days ago
First Time Since 1971: Australia Register Historic Low In ODI Cricket
-
 Tech5 days ago
Opendoor Ends India Operations, Fueling a Bigger Conversation About AI and Outsourcing
-

 Politics5 days ago
Belfast burns, while Met chief points finger at Iran and Russia
-

 NewsBeat4 days ago
FBI searches office of Ohio voter registration group
-

 Business5 days ago
AT&T: Verizon's 27% Outperformance Sets Up A Solid Entry Point
You must be logged in to post a comment Login