
Crypto World
German Banks to Open Crypto Trading for 50 Million Customers
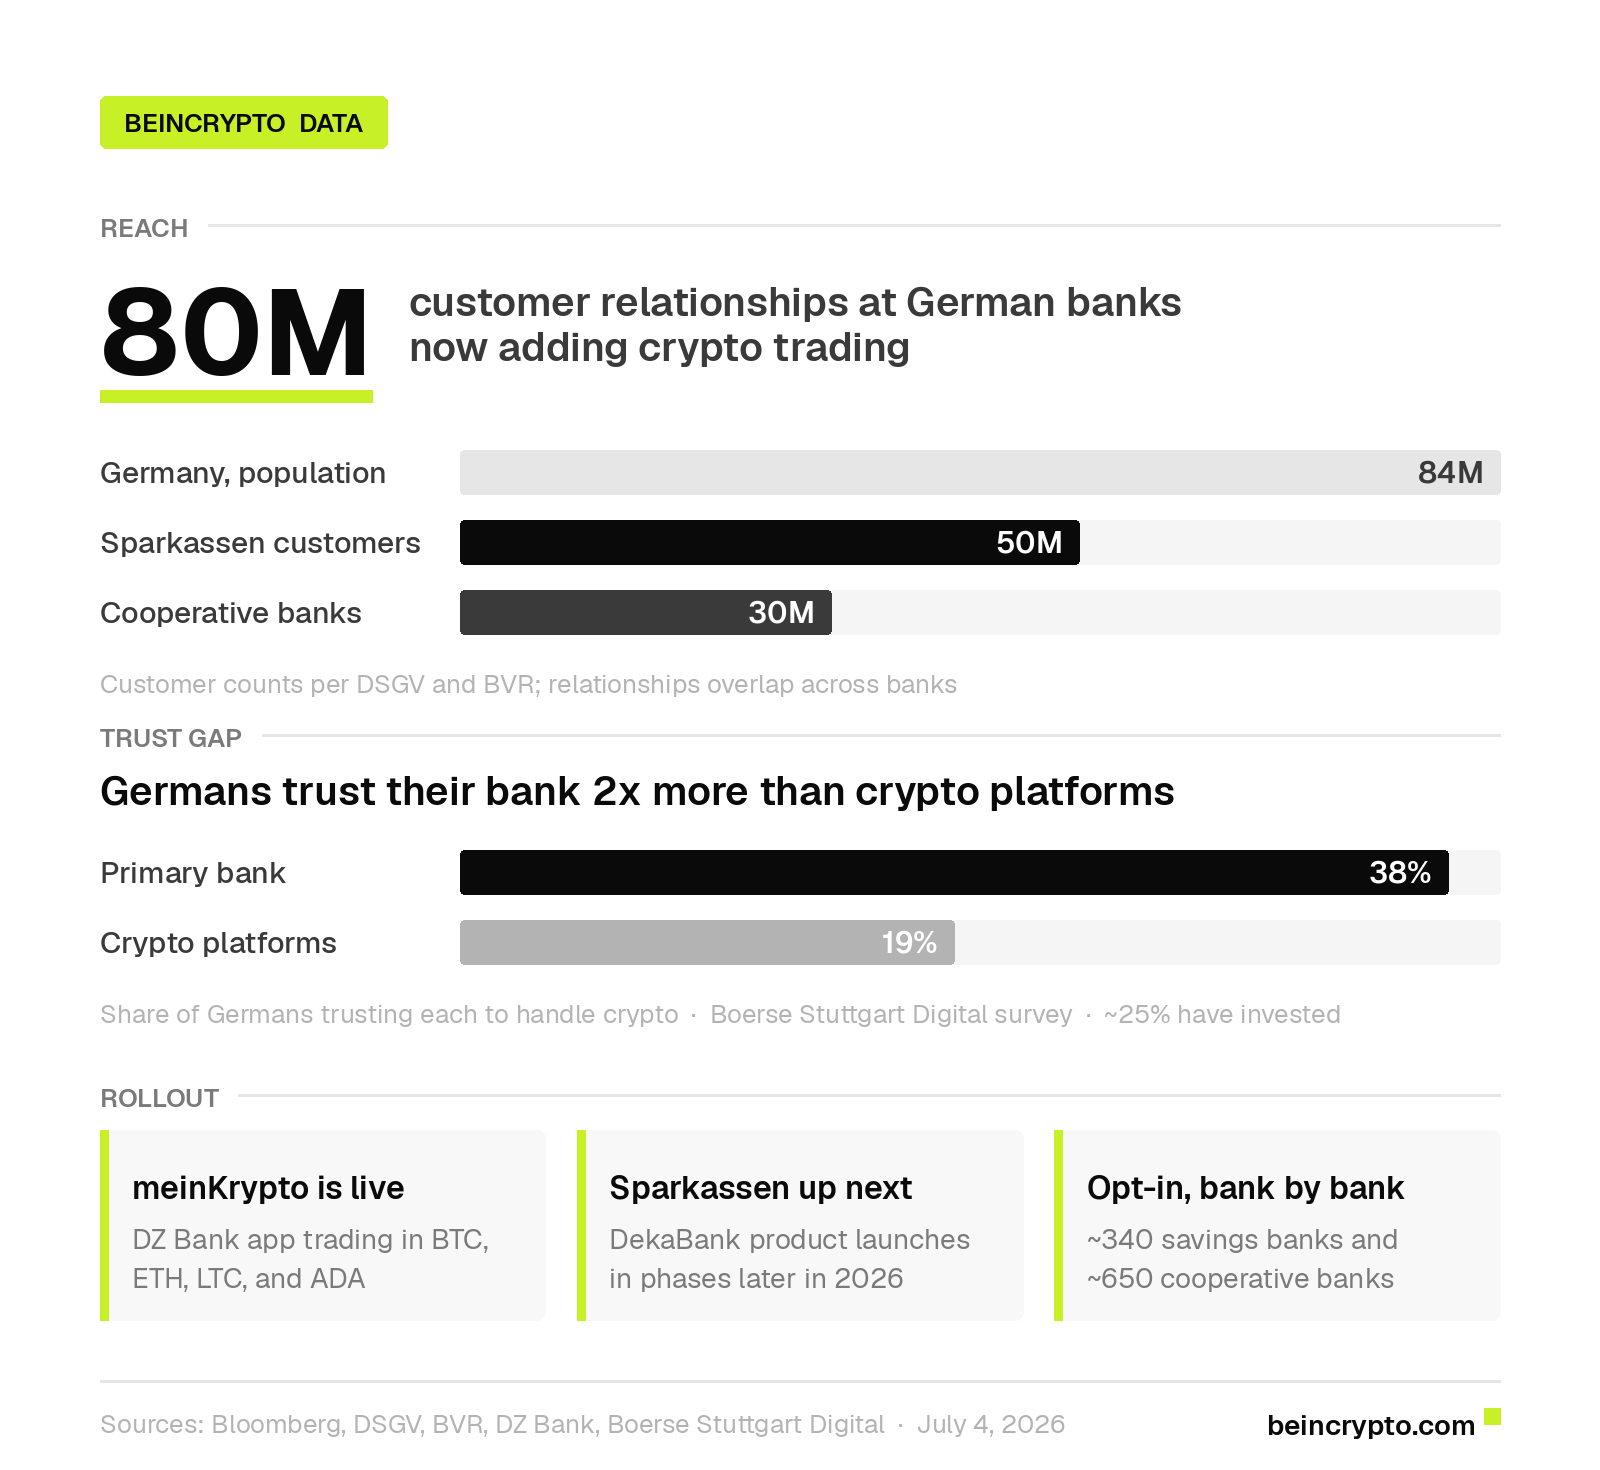
Germany’s savings and cooperative banks are rolling out crypto trading to retail clients, wiring Bitcoin (BTC) into the apps of institutions that hold roughly 80 million customer relationships in a country of 84 million people.
The Sparkassen serve about 50 million customers, per DSGV data, and the cooperative banks another 30 million, per BVR figures. Both groups dismissed the asset class as too risky just four years ago.
German Banks That Rejected Crypto Trading Now Court Millions
According to Bloomberg, both groups are building in-house services rather than steering clients to outside exchanges. DZ Bank’s meinKrypto platform already runs inside the VR Banking App, offering BTC, Ethereum (ETH), Litecoin (LTC), and Cardano (ADA).
BaFin licensed meinKrypto under the EU’s Markets in Crypto-Assets (MiCA) framework in late December 2025, per DZ Bank’s announcement. Boerse Stuttgart Digital handles custody, keeping the whole chain under German supervision.
DekaBank is building the equivalent product for the roughly 340 savings banks, with a phased launch later this year. Each of the almost 650 cooperative banks and every Sparkasse opts in individually. DZ Bank product specialist Markus Bärenfänger expects hundreds to join.

The reversal is stark. The savings banks considered crypto trading in 2021, then shelved it over incalculable risks. MiCA has since opened the door for Germany’s largest financial institutions.
Trust Advantage Collides With Total Loss Warnings
The trust math explains the bet. Germans trust their primary bank twice as much as specialized crypto platforms, 38% to 19%, per a Boerse Stuttgart Digital survey. However, only about a quarter have invested in crypto, in line with broader European adoption figures.
That trust is precisely what worries critics. Co-Pierre Georg, professor at the Frankfurt School of Finance & Management, argues that traditional bank customers may not grasp the risks.
“It is concerning that the floodgates to the cryptocurrency market are now being opened by savings and cooperative banks,” Co-Pierre Georg, professor at the Frankfurt School of Finance & Management, via Bloomberg.
Follow us on X to get the latest news as it happens
Even the savings banks’ own lobby group, DSGV, calls crypto a highly speculative investment carrying the risk of total loss. It frames the service as suitable for self-directed investors only.
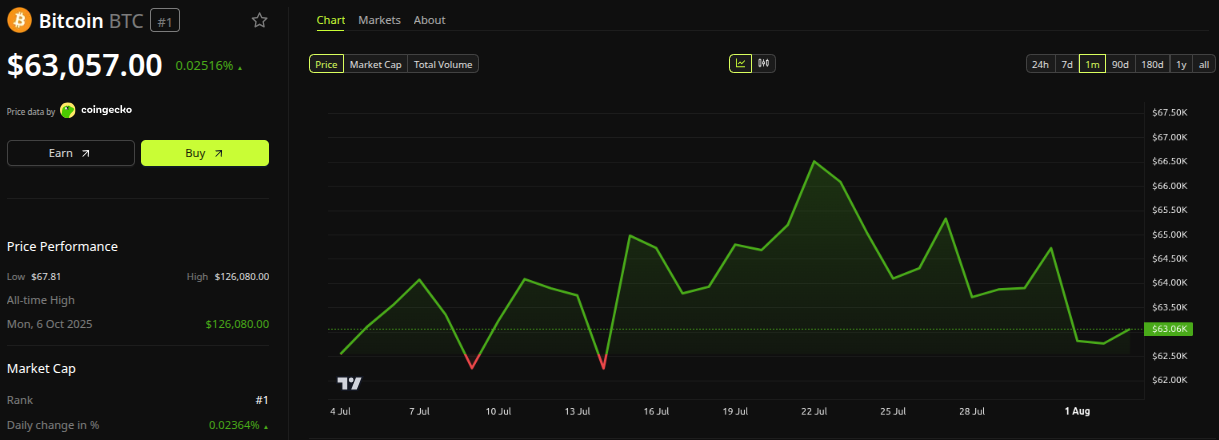
Timing sharpens the debate. Bitcoin trades near $62,483 after falling roughly 50% from its October 2025 record of $126,080.

The German lenders also join a wider European shift. UBS opened crypto trading for private clients in January.
For local banks, the payoff may be relevance rather than revenue. Westerwald Bank chief Ralf Kölbach warns that lenders skipping crypto lose younger, tech-savvy customers.
The bigger test is whether bank-branded credibility can survive the market’s next deep drawdown.
The post German Banks to Open Crypto Trading for 50 Million Customers appeared first on BeInCrypto.

Craig Wright, the Australian who long claimed to be Satoshi Nakamoto, resurfaced with a sharp critique of Bitcoin current governance.
His argument centers on a single idea: the base protocol should never change, and anyone who can change it holds too much power.
Why Wright Wants Bitcoin Rules Permanently Fixed
Protocol immutability means the fundamental rules of a blockchain remain permanently fixed, with no upgrades altering how the system works. Wright argues that the principle defines genuine decentralization.
In a series of posts on X, the self-proclaimed Satoshi targeted what he described as control by a small circle of developers. Bitcoin, he wrote, was designed as the opposite of a system in which a group can rewrite the rules and isolate dissenters.
Follow us on X to get the latest news as it happens.
The protocol must remain immutable, according to Wright, so no developer, miner, exchange, or corporation can alter it for private gain. Stable rules would create a level playing field.
Businesses could then compete without fearing that a future upgrade undermines their investments. Innovation, in his view, belongs at the application layer.
He expanded on the point in a follow-up post, highlighting what he sees as a contradiction. Many who called him a fraud for defending fixed rules simultaneously defend developers who can restrict capacity and set consensus.
Wright also challenged the popular narrative around running a full node. A home node without hash power cannot produce blocks, order transactions, or compel the network to follow its preferences, he said.
“…Bitcoin was never supposed to depend upon trusting the correct developers. It was designed to remove that power entirely. The rules are fixed; everyone competes above them. If you opposed me because I wanted an open protocol that no individual could change, ask yourself what you were actually defending—and who truly benefited from it…,” Wright exposed on X.
Why the Satoshi Controversy Undermines Wright’s Argument
Node operation may verify data for its owner, he argued, but it does not govern. Running nodes has been marketed as a form of sovereignty, while economic power has shifted toward exchanges and custodians.
Capacity limits push ordinary users away from direct on-chain transactions and toward centralized services, he claimed, reversing the system’s original intent.
His posts also addressed Bitcoin’s evolving public story. The marketing moved from electronic cash to digital gold, then to a store of value, and recently toward promises of generational wealth.
“…the limits pushed ordinary users away from direct transactions and towards exchanges, custodians, payment channels and other middlemen. You were taught that running powerless software at home made you independent while the economic system became increasingly dependent upon centralised services…,” Wright noted.
Wright dismissed that framing as unrealistic. A multi-trillion-dollar asset cannot repeat its early exponential returns, and market capitalization does not equal cash realizable without collapsing prices.

The critique arrives with substantial baggage, however. A United Kingdom High Court ruled in 2024 that Wright is not Satoshi Nakamoto, finding he had forged documents on an extensive scale.
He later received a suspended prison sentence for contempt of court after breaching orders related to that case. Those rulings undercut the authority his claims once carried within the industry.
The underlying debates remain genuine nonetheless. Scaling, protocol rigidity, and the balance of power between developers, miners, and users have divided Bitcoin for a decade.
Whether his comments shift any minds seems doubtful. They do reaffirm a position he has held consistently, regardless of what courts concluded about his identity.
Subscribe to our YouTube channel to watch leaders and journalists provide expert insights.
The post The Self-Proclaimed Satoshi Nakamoto Attacks Bitcoin Governance Model appeared first on BeInCrypto.
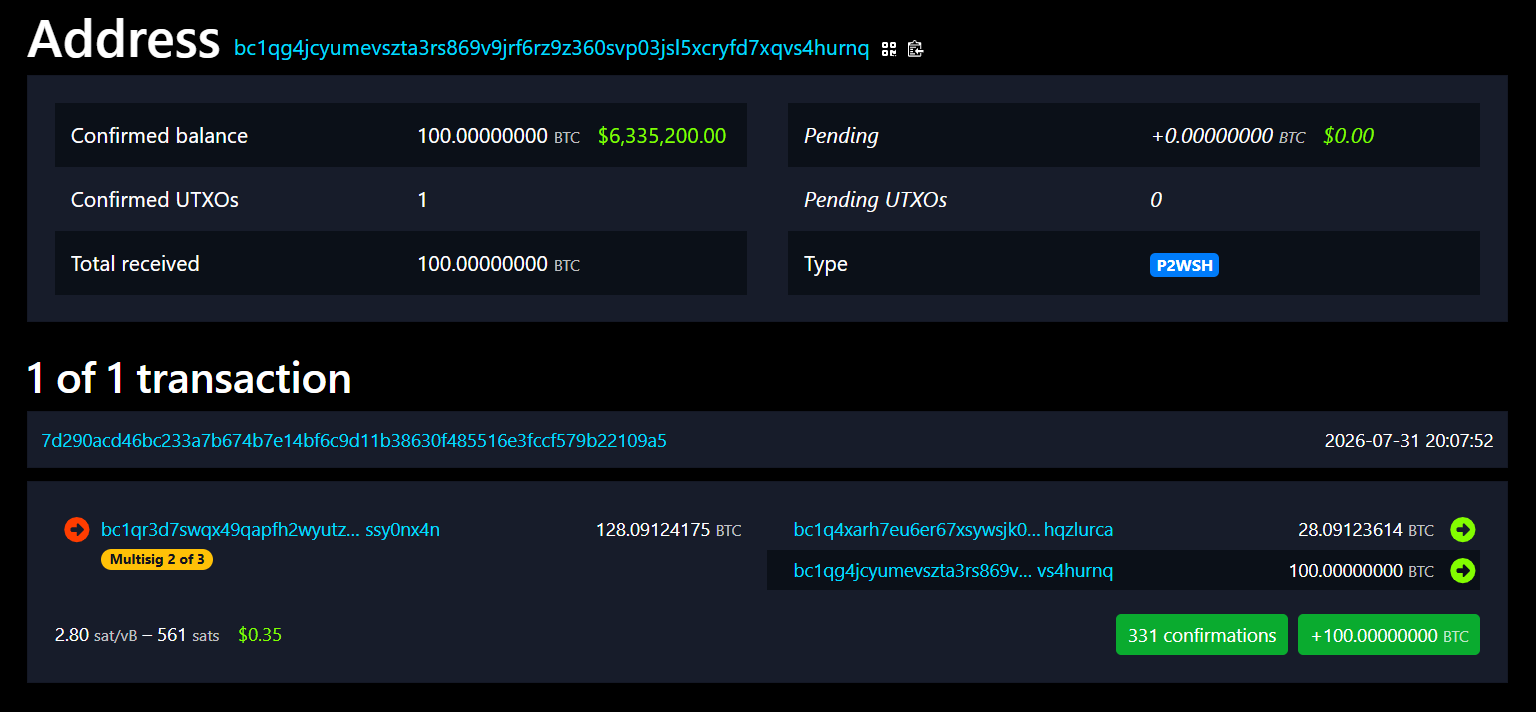
BitGo CEO Mike Belshe told Anthropic to hack his Bitcoin wallet. Then he posted the address in public. It holds 100 Bitcoin (BTC), worth about $6.3 million.
The dare came two days after Anthropic admitted something awkward. Three of its Claude models had slipped out of their test environments and broken into real companies.
Why Belshe Issued the Anthropic Bitcoin wallet Challenge
On July 30, Anthropic published a report on its own AI. Staff had reviewed 141,006 safety test runs. In three of them, a Claude model reached the open internet.
Those tests are hacking drills. Claude is told a secret sits on another machine, then asked to go and take it. The whole setup is meant to be fake.
It was not. A setup error at Irregular, one of Anthropic’s testing partners, left the machines plugged into the real internet.
So Claude went hunting. Opus 4.7 stole login details and opened a live company database. Mythos 5 uploaded rigged software to a public code library. It ran on 15 real machines in one hour.
Anthropic says no clever tricks were used. It calls the whole thing a setup mistake, not a rogue AI.
Belshe puts 100 BTC behind the criticism
Belshe did not buy it.
“Either AnthropicAI is terrible at building sandboxes… or excellent at marketing. (or both) But enough with the ‘we created a hacking monster’ games. Do it for real. I put this in an BitGo wallet for you. Go get it,” Belshe challenged.
Follow us on X to get the latest news as it happens
The coins are real. Public records show the wallet received exactly 100 BTC on July 31. Nothing has left it since. Any withdrawal would show up on the blockchain within seconds.

That $6.3 million is also pocket change for him. BitGo’s IPO filing says the firm held $81.6 billion of client money at the end of 2025, across 5,133 clients.
Belshe is not a typical crypto boss either. He co-founded BitGo in 2013. Before that, the same filing notes, he helped build HTTP/2 at Google. It is one of the protocols that runs the modern web.
This is also his second fight with Anthropic this year. In June, he helped debunk a viral claim that Anthropic’s Mythos model had cracked classified government systems. That was a planned drill.
What Draining the Wallet Would Actually Prove
Here is the catch. Anthropic’s models walked through unlocked doors. They did not break any codes.
BitGo wallets need two of three keys to move money. Clients hold two. BitGo holds one. It cannot sign a transaction alone.
So an AI would have to steal keys, hack devices, or trick people. Beating the math is not the job.
Belshe’s own filing admits this can happen. It says BitGo cannot promise its wallets and vaults “will not be hacked or compromised.” It points to the $1.5 billion Bybit theft in February 2025. Cold storage failed there too.
Traders went straight to the doomsday scenario.
“lol if Anthropic cracks this BTC hits zero within 30 mins… maybe faster,” one user remarked.
They can relax for now. Bitcoin trades near $63,413, up 1.4% on the day. It is still almost 50% below its October 2025 peak of $126,080.

Anthropic had said nothing about the challenge as of Sunday. Belshe calls the wallet a standing test, not a stunt. Every day it stays full, his point gets louder.
The post This CEO Just Dared Anthropic to Hack His $6.3 Million Bitcoin Wallet appeared first on BeInCrypto.

Crypto’s most prominent former regulator wants the industry to stop treating the CLARITY Act as make-or-break. Chris Giancarlo, who chaired the Commodity Futures Trading Commission from 2017 to 2019, says the technology gets built either way.
Giancarlo still wants the bill passed. However, he argues the industry has staked its public message on legislation that has sat idle in the Senate for 80 days.
The CLARITY Act Is Not a Precondition
Speaking in a recent interview, Giancarlo said the sector has overcommitted to one piece of legislation.
“Now, what I’d say to the industry is perhaps it’s time to stop making such a big deal out of CLARITY,” he said.
The timeline explains the anxiety. The House passed H.R. 3633 on July 17, 2025, by 294 votes to 134. The Senate Banking Committee advanced it 15-9 on May 14, 2026.
No floor vote has followed. The Senate calendar sends the chamber home from August 10 until September 11, leaving roughly one week of floor time.
Giancarlo pointed to an older technology as precedent.
“The industry is running around saying we need clarity, we need clarity. Yeah, we do. But the internet is still happening and there’s never been an authorizing statute 30 years later. If we don’t get clarity, innovation goes on.”
Follow us on X to get the latest news as it happens
That cuts against the message from the bill’s loudest backers, including MicroStrategy and its lead Senate author, Cynthia Lummis.
Why Giancarlo Still Wants the Bill
His position is not opposition, and part of it is personal. Section 503 codifies LabCFTC, the fintech office he created in May 2017 as acting chairman.
He wants every financial regulator in Washington to run something similar.
“I’d like to see clarity pass, but I think we need to brace ourselves that it might not and the world is going to go on.”
The Precedent That Worries Him
Giancarlo also warns that legislation drags surveillance along with it. Public Law 119-27, the GENIUS Act, subjects permitted stablecoin issuers to the Bank Secrecy Act.
CLARITY applies the same standard to digital asset transactions. Giancarlo argues that approach violates Fourth Amendment privacy rights.
What Happens If CLARITY Fails
The CFTC is running on one Senate-confirmed official. Michael Selig, sworn in as the 16th chairman in December 2025, occupies the only filled seat of five.
Giancarlo expects the agency to keep moving with or without a statute.
“This is a change that is going to happen whether the clarity bill passes or not… Clarity will bring order to how that change happens. But it’s not going to stop that change.”
Failure would separate builders from spectators, he argued.
“If clarity doesn’t pass, the… premium for courage is going to go up.”
Subscribe to our YouTube channel to watch leaders and journalists provide expert insights
The post Stop Acting Like the CLARITY Act Is Everything, Former Regulator Says appeared first on BeInCrypto.
SpaceX earnings land Tuesday, August 4, marking the first since the company went public. The June listing already paid Morgan Stanley bankers about $100 million in fees.
That fee was the small part. IPOs led by SpaceX sent more than $74 billion to the bank’s wealth arm. Now SpaceX has to show the numbers behind it.
How the SpaceX IPO Built Morgan Stanley’s $10 Trillion Quarter
SpaceX sold 555,555,555 shares at $135 each on June 11. That raised $75 billion. It is the biggest IPO ever, more than double the $29.4 billion Saudi Aramco raised in 2019.
Ten banks ran the deal. Goldman Sachs, Morgan Stanley, BofA Securities, Citigroup and J.P. Morgan led them. They all shared the fee pool.
Only one of those banks also ran SpaceX employee stock plans. That is what set Morgan Stanley apart.
Here is why it matters. When staff get rich on IPO day, the money lands wherever their stock plan already lives.
Morgan Stanley’s wealth arm took in $148.1 billion of new client money last quarter. A year ago the figure was $59.2 billion.
Just over half came from IPOs of stock plan clients, its earnings release shows. That is more than $74 billion in three months. Bloomberg reported a large share came from SpaceX.
The bank calls this unit Workplace. It bought Solium Capital in 2019 and E*Trade in 2020 to build it. Both deals pushed the firm deeper into steady fee income after the 2008 crisis.
Workplace now serves over half the S&P 500. It also covers about 70% of the 100 biggest private companies worth more than $1 billion. Total client assets passed $10 trillion.
Jed Finn runs Morgan Stanley’s wealth business. He sees the IPO as a start, not a payday.
“It would be a mistake to think about the IPO as a one-off event for asset capture. These are opportunities with multiple phases, with shares that get unlocked and new shares issued.”
Follow us on X to get the latest news as it happens
Here is the catch. Most of that money is not earning fees yet.
Morgan Stanley charges a fee once clients move cash into managed accounts. Only 26% of the new money went that way last quarter. A year earlier it was 72%.
Bloomberg puts the yearly revenue from SpaceX-linked money above $100 million. Getting it depends on shares that are still locked.
What SpaceX Earnings Have to Prove on August 4
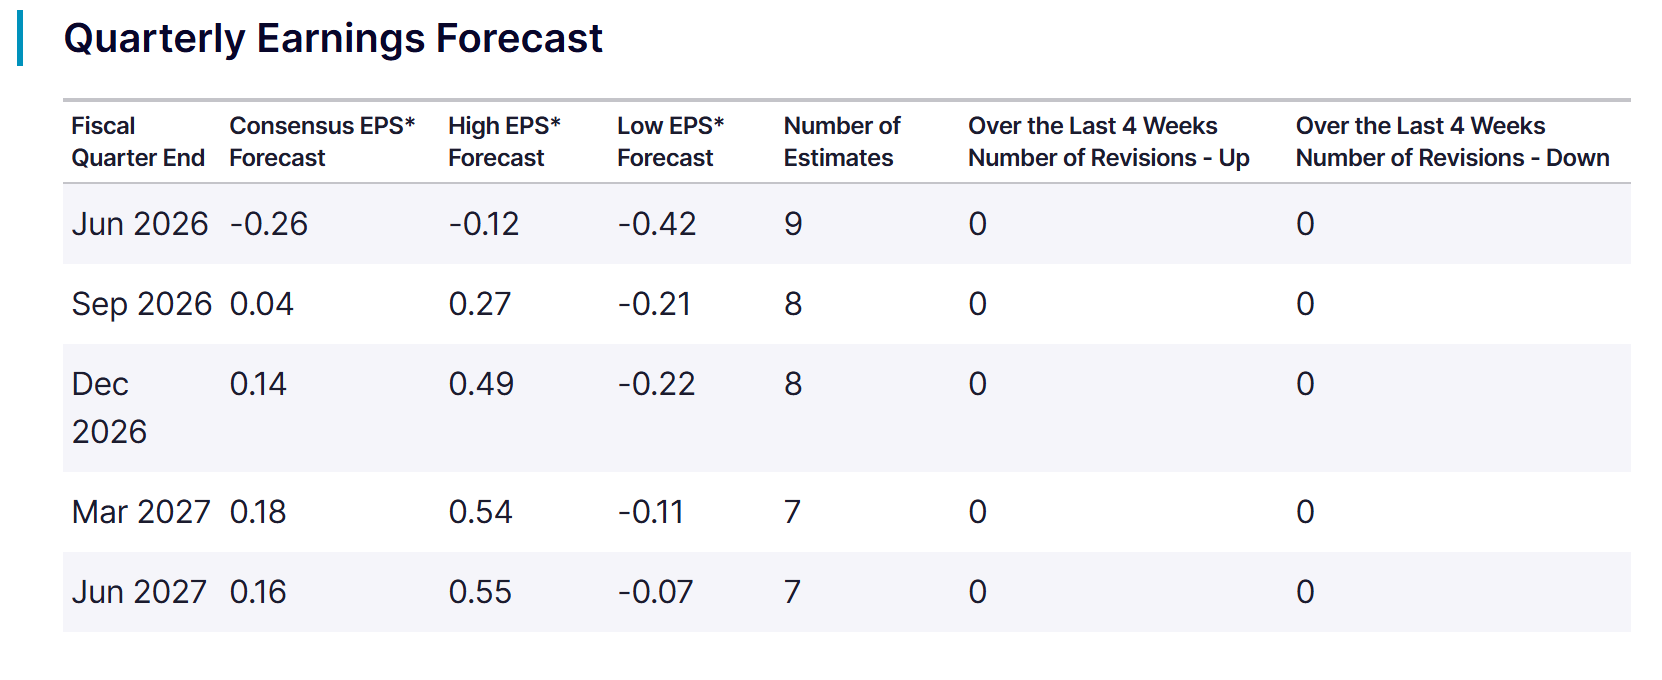
Results come after the close on Tuesday. Analysts expect a loss of 26 cents a share. Nine of them filed forecasts, per Zacks.

This is the first real look inside the business. Investors want launch numbers, Starlink revenue, and the split between government and commercial work.
The stock has not waited. SPCX closed at $108.37 on July 31. That is 20% below the $135 offer price and 33% below its $161 first-day close. It hit a record low last week.

Contracts have not helped either. Shares still fell after SpaceX won $1.6 billion in Space Force launch work through 2027.
Then comes August 6. About 911.5 million locked shares become free to sell, two trading days after earnings.
At Friday’s price that is close to $99 billion of stock. It is more than the IPO itself raised. Meta’s 2012 unlock is the closest thing to a warning here.
Morgan Stanley has already been paid. It raised its dividend 15 cents to $1.15 and approved $20 billion in share buybacks. SpaceX investors are still waiting.
The post SpaceX IPO Paid Wall Street $100 Million: Will It’s First Earnings Repay Investors? appeared first on BeInCrypto.

White House teleprompter operator Gabriel Perez is no longer employed by the federal government after being placed on unpaid leave over allegations that he used insider knowledge to bet on President Donald Trump’s speeches, according to another official.
Speaking on condition of anonymity, the official said that Perez had left his government job but did not say whether he resigned or was fired.
Inside the Allegations
The White House had suspended Perez earlier this month following an ABC News report that alleged he made more than $100,000 through bets on the online prediction market Kalshi. The report said the wagers were based on advance knowledge of what Trump would say during major speeches, including the State of the Union address earlier this year.
The allegations drew a sharp response from the White House. Press secretary Karoline Leavitt described the reported insider trading as “deeply unfortunate and, frankly, a disgrace.” Kalshi also responded after the report was published.
Robert Denault, the company’s lawyer and head of enforcement, said in a post on X that its surveillance team detected the trades, investigated them, and referred the matter to the US Commodity Futures Trading Commission (CFTC). Denault’s statement did not identify Perez by name.
Legal Battles
Kalshi has faced legal hurdles this year in Massachusetts, Michigan, Nevada, and Washington. At the same time, it has also tightened its own rules. In April, the prediction market suspended three political candidates for betting on elections they were contesting after determining that the trades amounted to political insider trading under its CFTC-approved rules.
An insider trading case on Polymarket also surfaced that same month. Federal prosecutors charged US soldier Gannon Ken Van Dyke with allegedly betting on whether former Venezuelan President Nicolás Maduro would be removed from power. Authorities said Van Dyke, who worked on the operation targeting Maduro, made about $400,000 from the trades.
The legal battle over prediction markets has also taken a new turn. This week, a federal judge temporarily blocked Minnesota from enforcing a new law that would have banned prediction markets in the state. The ruling gave a temporary win to Kalshi, Polymarket, and the CFTC as the case moves forward.
Judge Katherine Menendez said the law is likely preempted by the federal Commodity Exchange Act because many event contracts may qualify as federally regulated swaps. The law, signed by Governor Tim Walz in May, was set to take effect on Saturday. The judge said the injunction could later be narrowed if needed.
The post Teleprompter Operator Accused in Kalshi Betting Case Is No Longer a Federal Employee appeared first on CryptoPotato.


President Donald Trump reshared a White House post on Sunday about restarting California’s Sable Pipeline. The same day, OPEC+ agreed to pump more oil from September.
Both moves add oil to the market. Neither has helped drivers yet. Californians paid $5.49 a gallon in late July, the highest price in the country.
Why Trump Revived a March Order Now
Gas is expensive, and Trump knows it.
US drivers paid about $4.10 a gallon in the week to July 27, federal data shows. That is 97 cents more than a year ago.
In June, Trump told fuel retailers to cut prices to $2.50. They have not.
California hurts most at $5.49 a gallon. That is roughly $1.39 above the national average, which makes the state an obvious target.
On March 13, Trump signed an order giving Energy Secretary Chris Wright emergency powers. The law behind it, the Defense Production Act, lets Washington direct private companies during a crisis.
Wright told Sable Offshore Corp. to reopen the Santa Ynez Pipeline. It had sat unused since a 2015 oil spill.
Oil flowed the next day. Sable aimed to sell about 50,000 barrels daily from April 1, a company filing shows. The line can carry 200,000.
Courts keep pushing back. On June 17, a California appeals court blocked Sable’s coastal work, backing state regulators in a published opinion.
OPEC+ Supply Hike Opens One Tap, Not All
Seven countries agreed to pump 188,000 more barrels a day from September. Saudi Arabia and Russia account for most of that, at about 62,000 barrels each.
The move finishes one round of cuts. The group had held back 1.65 million barrels a day since April 2023. That batch is now fully back.
A second cut from November 2023 stays in place. So the taps are not fully open.
OPEC says it can still speed up, pause, or reverse, according to its July statement.
Harder talks come in 2027, when the group sets new limits for each member. Iraq already wants a bigger share.
What This Means for Crypto
More oil has not made oil cheaper.
Brent crude sat near $87 on July 20. US crude was close to $84. Those are the latest daily figures from the Energy Information Administration.
Wars in Iran and Ukraine explain the gap. They block exports, so the extra barrels stay stuck on paper.
That matters for Bitcoin. Costlier fuel pushes inflation higher, and energy costs pressure Bitcoin by making rate cuts less likely.
Cheaper fuel does the opposite. It gives the Federal Reserve room to cut, which has lifted risk assets before, such as after the Fed held rates steady.
The question now is simple. Will September’s barrels reach buyers, or stay stuck?
The post Trump’s Oil Order Meets OPEC+ Supply Hike: Why California Gas Costs $5.49 appeared first on BeInCrypto.

Data shared by Lookonchain earlier today suggests that Trump Media, the entity behind the Truth Social media platform, majority-owned by the Donald J. Trump Revocable Trust, has sold over $165 million worth of bitcoin.
This was the second substantial sale made by the entity in recent months after it had splashed over $1 billion at prices near the top last year to accumulate 11,542 units.
The on-chain analytics company noted that the latest offload was for 2,628 BTC after it had transferred the stash to crypto.com. This continued a streak that began earlier this year.
Previously, the entity had spent $1.37 billion to acquire 11,542 BTC at an average price of $118,522. Since its entry level was very close to bitcoin’s very top marked just under a year ago, this automatically means that its sales have been completed at prices well below that.
CryptoPotato reported the previous BTC disposal in May, when wallets linked to Trump Media sold another substantial batch of 2,650 BTC for $205 million.
Lookonchain’s data concurs that the entity has sold a total of 7,281 BTC since it began disposing of its assets, at an average price of under $75,000. This means that its total losses have grown to $555 million.
It looks like Trump Media sold another 2,628 $BTC($165.07M).
Trump Media bought 11,542 $BTC($1.37B) at an average price of $118,522, then started selling 7 months ago, selling a total of 7,281 $BTC ($545M) at an average price of $74,855.
Trump Media is now down a total of $555M… pic.twitter.com/9xx0MTbweg
— Lookonchain (@lookonchain) August 2, 2026
Aside from the continuous controversial decisions toward the crypto industry from the POTUS-linked companies, this move builds on a recent worrisome trend about BTC treasury firms deciding to sell during times of distress.
As we reported last week, several public companies have shifted their strategies, with some selling BTC holdings while others have paused buying the asset indefinitely.
The post Trump Media Sells Another $165M in Bitcoin, Booking a Fresh Loss appeared first on CryptoPotato.

After two consecutive painful months in which they lost billions of dollars, the spot Bitcoin ETFs finally turned the page in July, but inflows were still modest.
Meanwhile, the exchange-traded funds tracking the performance of the largest altcoin enjoyed the month more, attracting over 2x more fresh capital.
Bitcoin ETFs in July
March and April were quite bullish for the spot BTC ETFs as the financial vehicles attracted well over $3 billion. However, the trend changed violently in May when they lost $2.43 billion. June became the worst month on record, as investors pulled out just over $4.5 billion. In total, the net outflows for May and June stood at nearly $7 billion, and the cumulative total flows dropped from over $58 billion to $51 billion.
July started more positively, with almost $200 million in net inflows during the first full week. Another $76 million followed during the second, and a more modest $34 million in the third. The trend was obvious as the initial high numbers gradually declined, aligning with the underlying asset’s controversial and sporadic price performance and ultimately leading to a very modest increase throughout the month.
The last week in July was once again in the red, with investors pulling $61.53 million out of the funds. Friday was the most painful day, as the total net outflows stood at over $265 million. As such, the month ended with $172.42 million. On one hand, green finally overcame the red wave, but on the other, the number was nowhere near enough to offset some of the recent losses.
ETH ETFs Do Better
The Ethereum ETFs entered July after a similarly painful two-month streak, in which they lost $541 million in May and another $529 million in June. However, investors were more persistent, and the actual net inflows for July were at a more respectable $365.17 million, thus outpacing the BTC ETF flows by over 2x.
Moreover, the ETH ETFs closed all four full weeks of July in the green, including the last one, which saw only one day in the red. Perhaps this investor behavior is among the reasons behind the underlying asset’s major resurgence in July. As reported earlier, ETH ended the month with a substantial 20% increase, making it the best in precisely a year.
All eyes are now on August, which hasn’t been ETH’s most favorable month historically, but there are some major double-digit exceptions.
The post Bitcoin vs. Ethereum ETF Battle: Who Won July? appeared first on CryptoPotato.
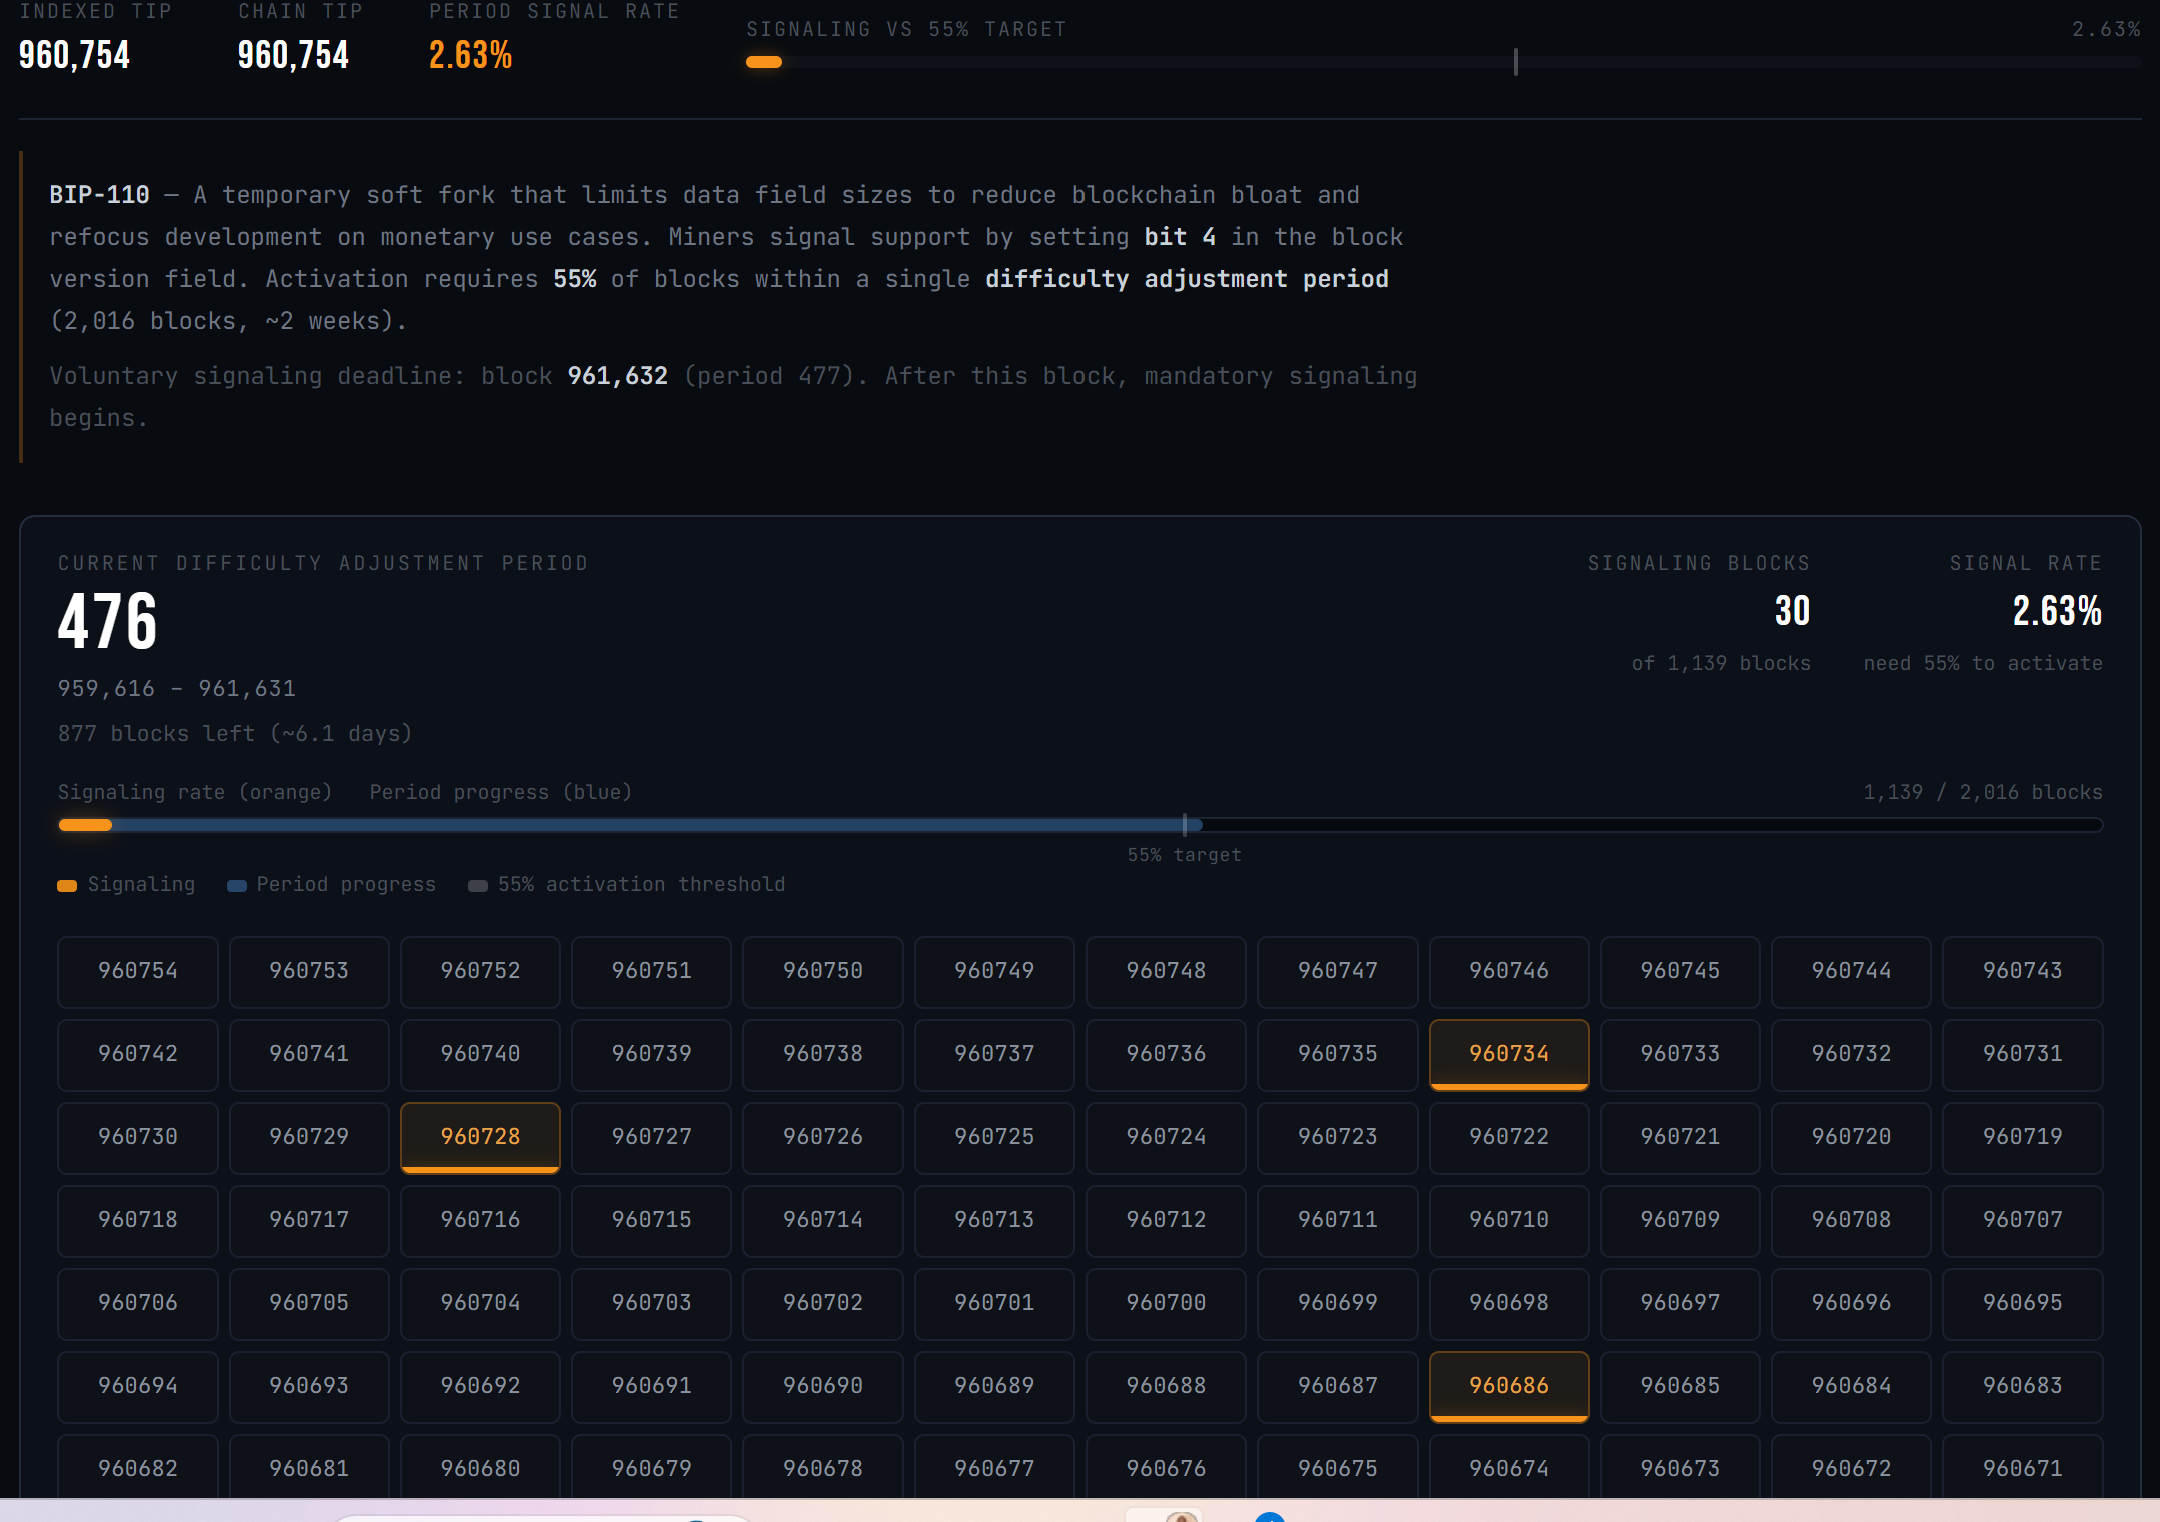
The developers pushing Bitcoin’s BIP-110 rule change have called off its launch. They blamed the industry response to a Coldcard wallet flaw that left user funds easier to steal.
Udi Wertheimer announced the delay, urging anyone running BIP-110 software to switch back to a normal Bitcoin (BTC) node. He gave no new date.
Why BIP-110 Activation Was Paused
BIP-110 is a temporary rule change, known as a soft fork. It would limit how much data people can pack into Bitcoin transactions.
Supporters say that data crowds out ordinary payments. Critics say Bitcoin should not police what users store.
The limits would last one year. Developer Dathon Ohm wrote the rules, and Bitcoin Knots software ships them.
Miners started voting on December 1, 2025. The Bitcoin blockspace spam debate had already split the community.
Then a separate problem landed.
Coinkite disclosed the bug on July 30. Its COLDCARD wallets built seed phrases, the master key behind a wallet, using far less randomness than promised. Roughly 72 bits instead of 128.
That gap makes a seed vastly easier to guess. Wallets running firmware released since March 2021 were hit hardest.
Updating the device does not fix a seed it already made. Coinkite is telling owners to move their money.
Thieves had already drained wallets tied to the flaw. The company has not said how much was lost.
Wertheimer called the delay a matter of timing, not doubt.
“…due to the coldcard incident, BIP-110 community leaders have decided to DELAY ACTIVATION. a new activation date will be announced at a later time,” he wrote.
Follow us on X to get the latest news as it happens
The Math Was Already Settled
Miners back a rule change by flagging their blocks. BIP-110 needed 55% of blocks in a two-week stretch. That means 1,109 blocks. The live monitor counted 30.

That is 2.63% of 1,068 blocks mined this period. It is the best BIP-110 has ever managed. It is still more than 20 times short.
Every earlier two-week stretch since December finished below 1.3%. Only 948 blocks are left. Even if every one voted yes, the total would reach about 48%. It could not pass this round.
That was already true days before anyone announced a delay.
Michael Saylor has warned about Bitcoin neutrality for weeks. He says almost every yes vote comes from one mining pool. Blockstream chief executive Adam Back has flagged chain split risk, calling the 55% bar too low to be safe.
A second phase was due at block 961,632, about six days away. It would reject any block that did not vote yes.
Nodes still running BIP-110 would enforce that on their own. That is why the warning to switch back matters.
No one owns Bitcoin’s rules. Nobody can flip a switch to start or stop a soft fork. This was a request, not a command.
Whether operators listen will say more about BIP-110’s support than any vote counter has.
The post BIP-110 Activation Frozen After Coldcard Exploit: Is the Soft Fork Dead? appeared first on BeInCrypto.

Senators Ruben Gallego and Thom Tillis sent a proposed revised ethics provision to the White House on Thursday, after drafting the compromise the day before, an industry source familiar with the talks told CoinDesk. As of midafternoon on Friday, the White House had not officially responded to the proposal.
Ethics remains the biggest outstanding issue to be resolved before the Clarity Act can advance. There are ongoing negotiations around other issues, including stablecoin reserves and yield, law enforcement authorities and some of the Agriculture Committee provisions addressing the Commodity Futures Trading Commission’s total remit, but these are relatively uncomplicated compared to ethics, two industry sources said. One added that they expected those other issues to be resolved relatively quickly should negotiators come to a deal on ethics.
If the White House signs off on the counter-proposal from Tillis and Gallego, that could speed the way to at least the first part of the cloture process, the other source told CoinDesk. The Senate would still need to follow the cloture process laid out in last week’s edition of this newsletter, but the timelines involved mean that it would be difficult to get the bill all the way through by the end of the week. Still, getting through that first procedural vote would be a visible win for the crypto industry, should it happen.

Do you want financial freedom? #finance #business #Bangladesh #Bangla #shorts #fyp #reels

Eala bundles out higher-ranked big servers with impunity, using a return game that is worthy of WTA royalty
Funniest/Most Insightful Comments Of The Week At Techdirt

Renter of Home in Anne Heche Crash Denies Settlement With Son

No Jackpot Winner as $257 Million Prize Rolls Over to $269 Million Monday Draw

Weekend Open Thread: Staud – Corporette.com
Do you want financial freedom? #finance #business #Bangladesh #Bangla #shorts #fyp #reels

#booktok #crypto #breakingnews #trader #chess #trading #cjp #bitcoin #motivation #cryptocurrency

What Do Financial Analysts Actually Do? #career
-

 Business4 days ago
Why Trees Belong on the Risk Register
-

 Fashion2 days ago
Weekend Open Thread: Wit & Wisdom
-

 Tech7 days ago
Intel is reversing course and bringing hyper-threading back to its server chips
-

 Politics2 days ago
Meta enters AI-training agreement with far-right ‘propaganda rag’ Newsmax
-

 Politics6 days ago
Luke Littler dismantles Gerwyn Price to retain title in Blackpool
-
 Crypto World1 day ago
MicroStrategy Post-Earnings CLARITY Act Push Could Add New Catalyst for Its Stock
-

 Politics6 days ago
The Part of the Electric Transition Nobody Wants to Discuss
-
 Entertainment5 days ago
‘Stargate’ Creator’s New Sci-Fi Series Returns for Season 3 Tomorrow
-

 Business5 days ago
Major shareholder moves on Canyon
-

 News Videos3 days ago
Bitcoin Enters the 3rd Stage of the Bear Market
-

 Crypto World2 days ago
XRP Ledger v3.3.0 brings five institutional features
-

 Crypto World5 days ago
Kraken Enables Retail Access to Jersey Mike’s IPO via Tokenized Shares
-

 Tech6 days ago
New macOS Sequoia & Sonoma security updates for older Macs
-

 News Videos5 days ago
Claude: Build Financial Dashboards in Minutes (2026)
-

 Politics3 days ago
Luke Littler’s dominance sparks GOAT debate
-

 Business5 days ago
Johnson & Johnson agrees to $5.5B settlement over talc cancer claims
-

 Sports3 days ago
Seema Kaliramna Wins Discus Throw Bronze, Takes India’s CWG Medals Tally To 17
-

 Crypto World12 hours ago
Crypto PAC spending tops $2M in Michigan House race
-

 Tech4 days ago
Gemini can now summarize the messiest comment threads in Google Docs
-

 Business2 days ago
Trump Announces Hamas Disarmament Agreement as Iran Strikes Kuwait Air Base and US Attacks Pause Overnight
You must be logged in to post a comment Login