
Crypto World
How Circle settled $68M in minutes using its own USDC rails


Circle Internet Group has begun using its own stablecoin infrastructure to handle internal treasury operations, settling $68 million in intercompany transfers across eight corporate entities in under 30 minutes.
Summary
- Circle Internet Group settled $68 million in intercompany transfers across eight entities in under 30 minutes using its USDC stablecoin and the Circle Mint treasury platform.
- The transactions replaced traditional bank wires that typically take one to three days to settle.
- Circle says the workflow helped complete about 90% of internal transfer pricing settlements in a single day, highlighting stablecoins’ potential for corporate treasury operations.
Jeremy Allaire says Circle settled $68M using USDC as firm “eats its own dog food”
The development was revealed by Circle CEO Jeremy Allaire in a recent post on X, where he said the company had started using USDC and the Circle Mint platform to replace traditional bank wires for internal settlements.
According to Allaire, the company’s treasury team processed the transfers across multiple internal entities in a single workflow that operated continuously, allowing funds to move at any time rather than during banking hours.
The process settled the $68 million in less than half an hour while maintaining full controls and auditability.
The stablecoin-based settlement replaces traditional fiat wire transfers that typically take one to three days to complete through conventional banking rails.
Circle said the move reflects how blockchain-based payments can streamline corporate treasury management. Through Circle Mint, the company’s platform that enables businesses to mint and redeem stablecoins and move funds, treasury staff can initiate transfers, apply role-based approvals, and confirm receipt of funds in near real time.
The company’s treasury case study describes the workflow as a way to reduce the “cash-in-transit” gap common in traditional banking systems, where funds may be debited from one entity but not immediately confirmed at another due to settlement delays.
With USDC settlement, confirmations occur within minutes rather than days.
Circle said the new system has also accelerated accounting operations. Approximately 90% of the company’s intercompany transfer-pricing settlements were completed in a single day, significantly compressing the month-end close process.
The firm plans to expand the workflow as additional updates to Circle Mint roll out, with Allaire suggesting the model could eventually enable other businesses to adopt stablecoin-based treasury settlement systems.

Wall Street’s crypto footprint has never been larger. BlackRock alone reported nearly $150 billion in digital asset-linked AUM in its 2026 chairman’s letter. Public companies hold over 1.1 million BTC on their balance sheets. Institutions disclose more than 513,000 BTC through ETF wrappers.
Yet aggregate numbers obscure the question that matters most. Who actually holds what, through which infrastructure, and why?
This article maps Wall Street’s crypto ownership across five layers.
It starts with SEC 13F filings, moves through corporate balance sheets, follows the money into tokenized fund rails, traces the custodial chokepoints where keys concentrate, and ends where filings go dark, with on-chain OTC flows that reveal holders no quarterly report captures.
SEC 13F Filings Reveal Secrets About Wall Street Crypto ETF Holdings
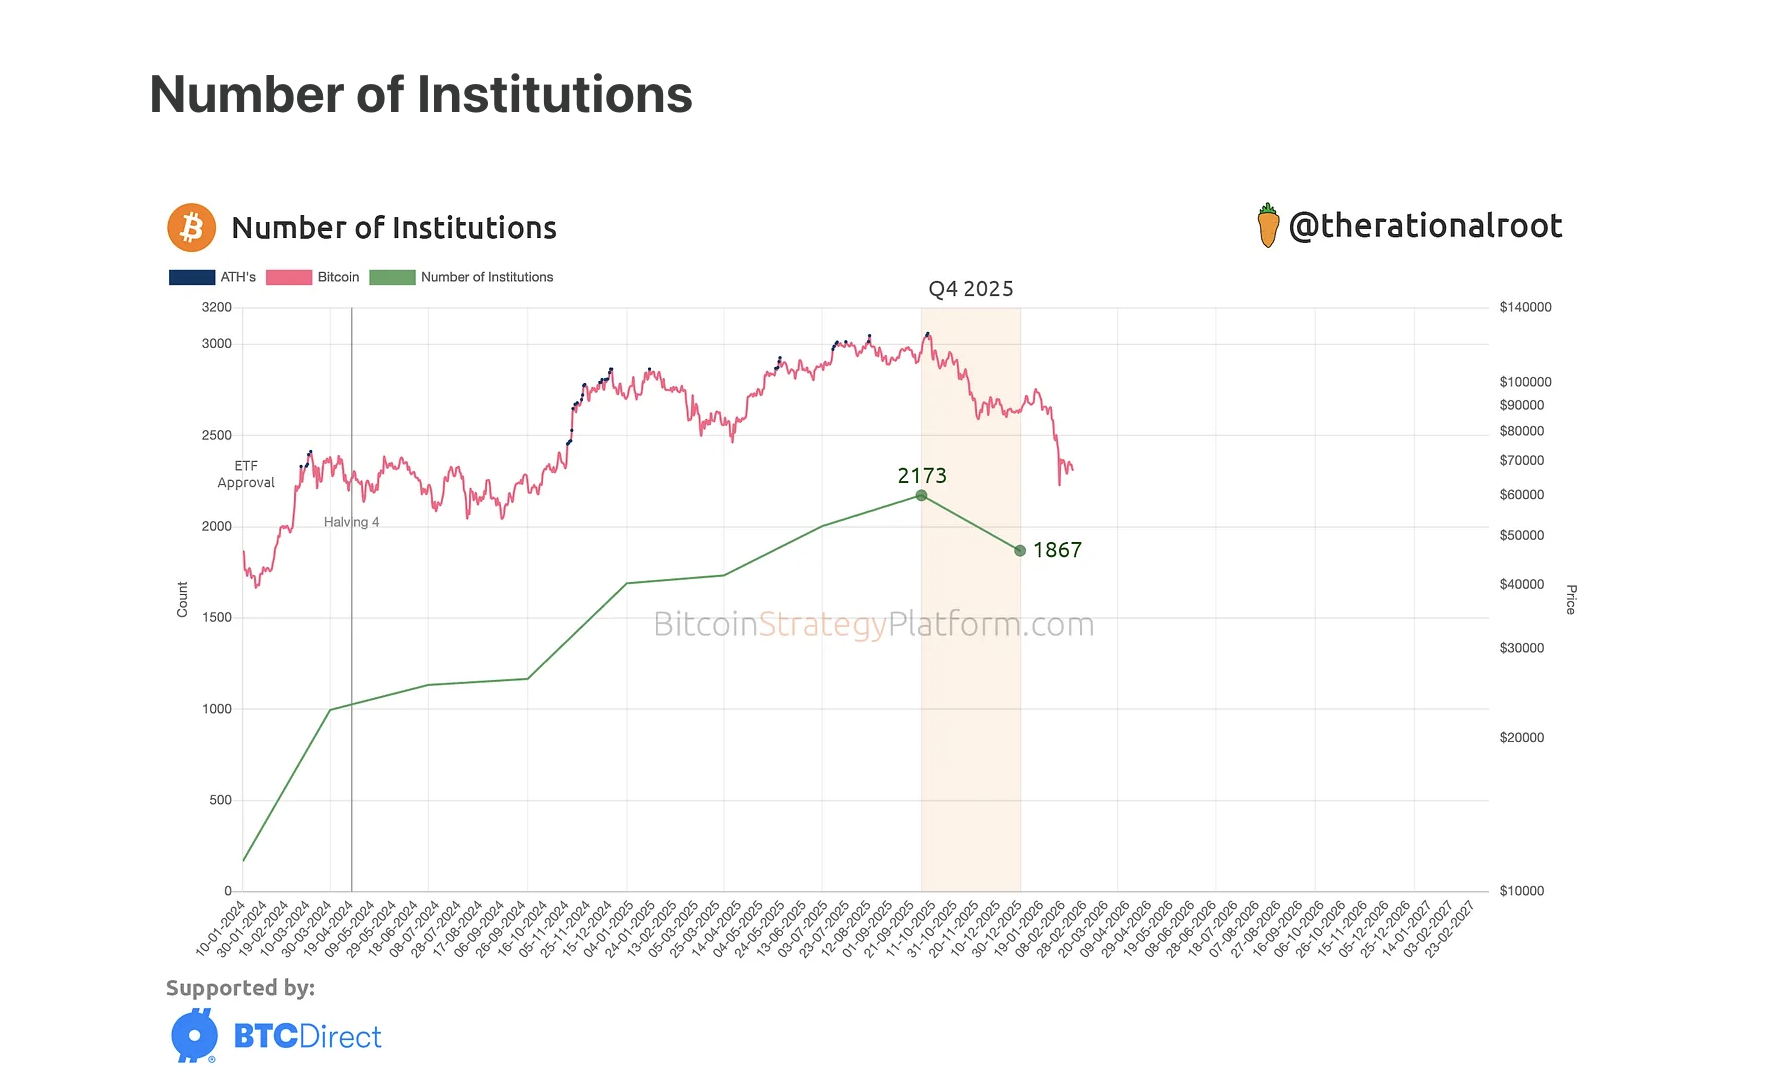
Despite a 23% price decline in Q4 2025, global Bitcoin ETF flows remained positive at $3.7 billion. Full-year professional ETF ownership grew 32% versus 18% for the broader ETF investor base.
Institutions still held over 513,000 BTC through ETFs, though filer count declined from 2,173 to 1,867.
Not all of this is conviction capital. The basis trade, a strategy involving a long spot ETF position paired with a short CME futures position, has been a primary institutional strategy since ETF approval.
Hedge fund exposure declined nearly 10% in Q4, as leverage unwound and the basis spread narrowed.
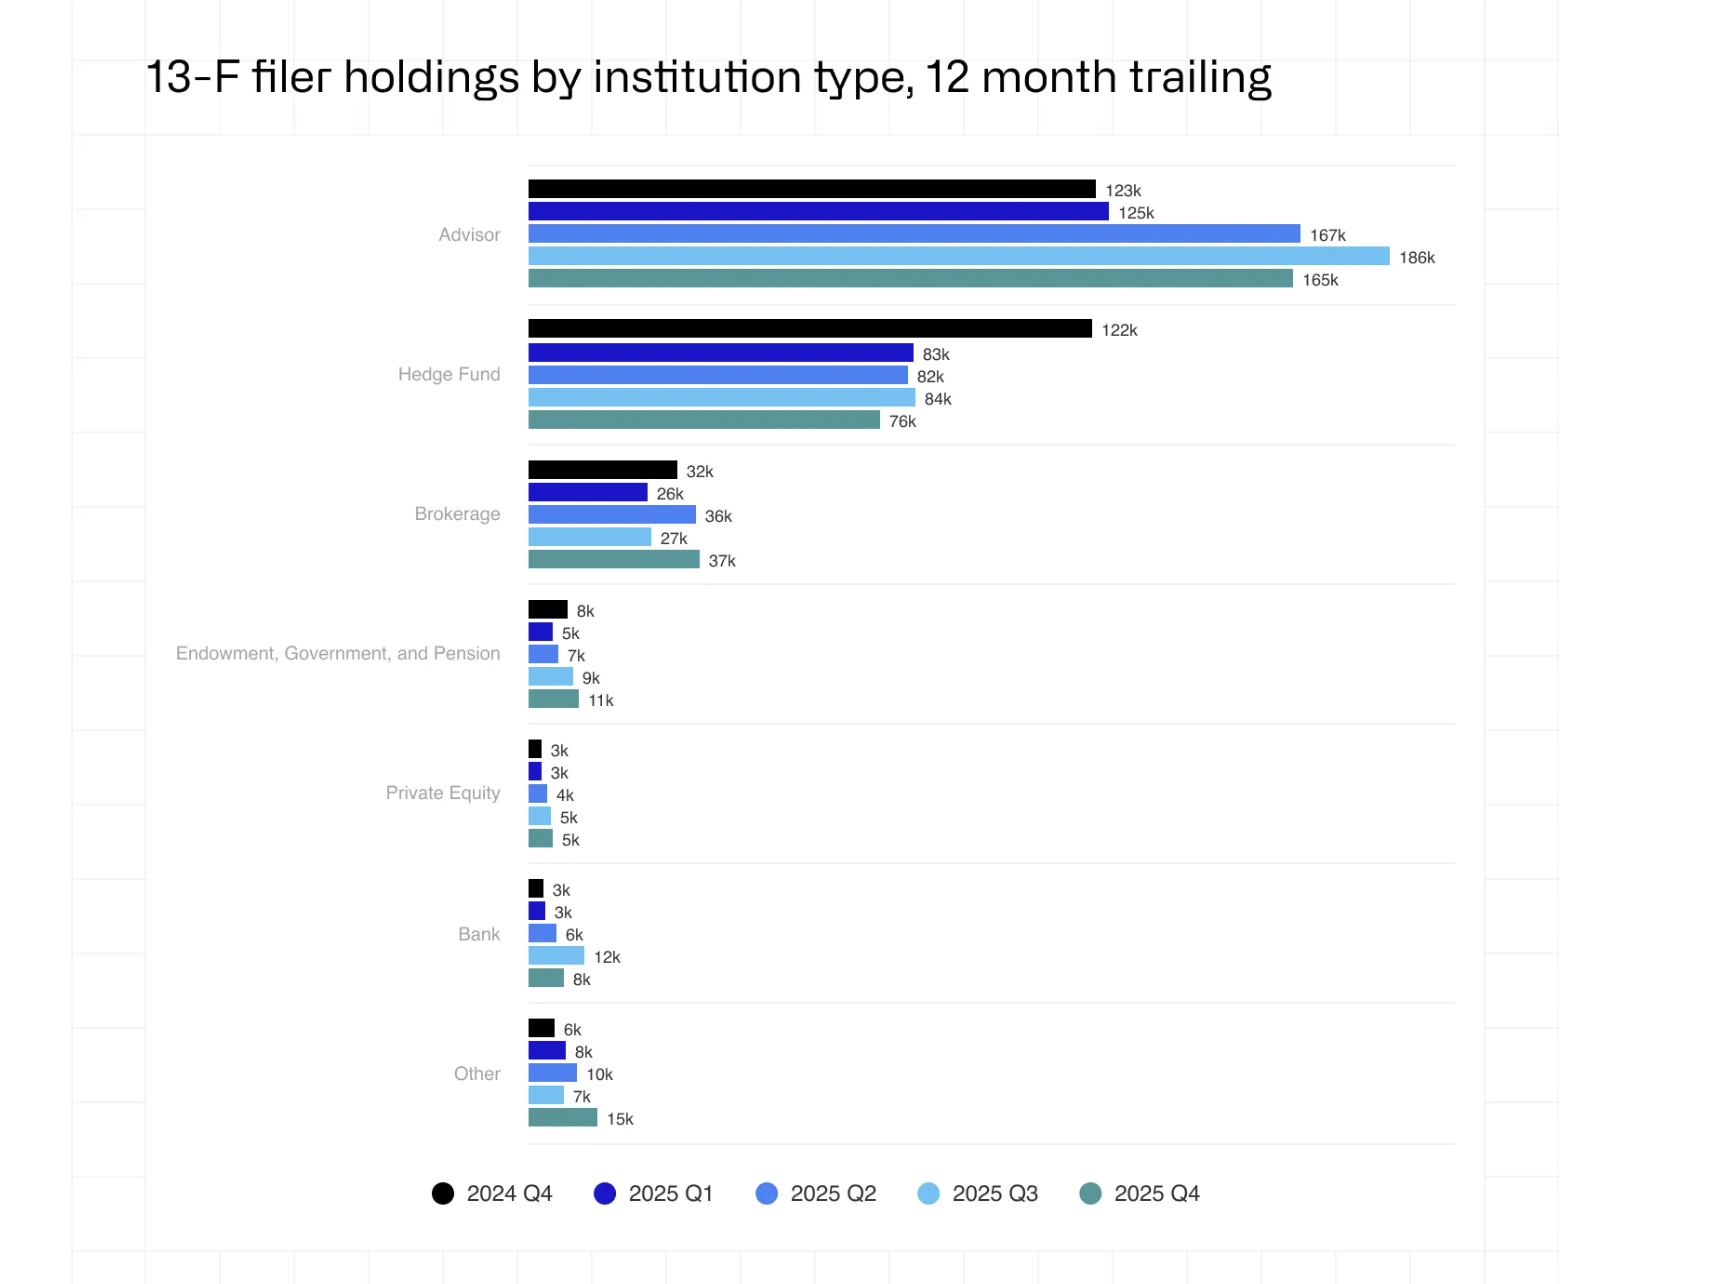
Cohort rotation, not capitulation, defined Q4. Millennium added 8,100 BTC. Abu Dhabi’s Mubadala added 2,300 BTC. Morgan Stanley added 1,900 BTC. Dartmouth became the fourth Ivy League endowment to enter.
On the other hand, Brevan Howard cut 17,700 BTC, Harvard trimmed roughly 20%, and Royal Bank of Canada fully exited, all of which are mentioned in the CoinShares Q4 2025 report.
Aggregate pension fund and endowment crypto holdings peaked at $1.48 billion in Q3 2025, then declined to $965 million in Q4.
However, ETFs only reveal who is buying the wrapper. For those who are holding the asset itself, the balance sheets tell a different story.
Corporate Treasuries Show Who Holds Bitcoin Directly on the Balance Sheet
Beyond ETFs, a growing number of public companies hold Bitcoin directly as a treasury reserve asset. As of March 31, 2026, publicly traded companies report a combined 1,134,324 BTC on their balance sheets.
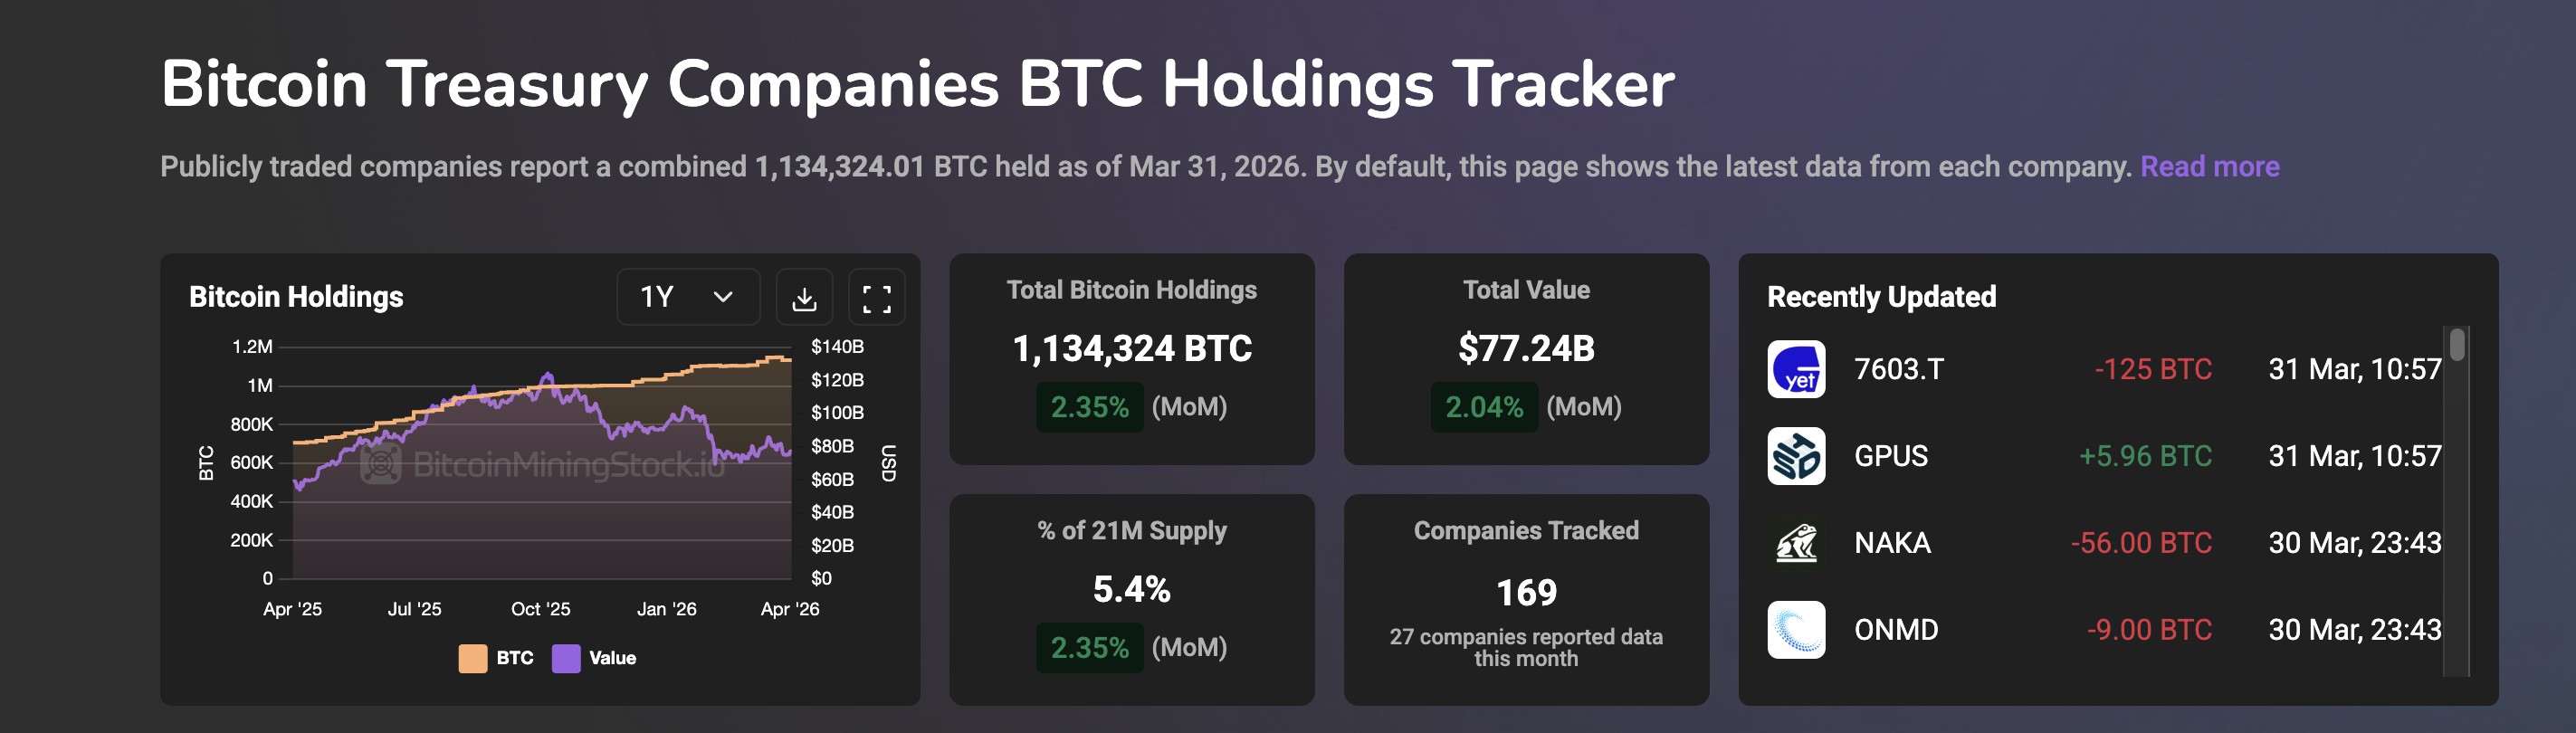
The concentration is extreme. Strategy Inc, formerly MicroStrategy, held 762,000 BTC as of April 2, 2026. Other big names in the space include Twenty One Capital, MARA Holdings, Japan’s Metaplanet, and more.

New entrants are reshaping the picture. Trump Media (DJT) held 11,542 BTC before pledging 2,000 BTC as collateral under a hedge arrangement with rehypothecation rights, reducing on-balance-sheet holdings to 9,542 BTC. MARA sold 15,133 BTC in March 2026 at a loss to service debt.
Yet corporate treasuries only account for direct spot ownership. Wall Street’s largest players are building crypto exposure through an entirely different mechanism, one that does not require holding a single Bitcoin.
Tokenized Funds and RWA Holdings Show Where On-Chain Meets TradFi
Some of Wall Street’s largest firms now build crypto exposure without holding a single token. Instead, they put traditional assets on-chain through tokenization.
BlackRock’s BUIDL fund, a tokenized US Treasury money market product, reached $2.85 billion in total assets ($2.17 billion at press time).
In February 2026, BlackRock began trading BUIDL on Uniswap’s decentralized exchange and purchased UNI governance tokens. That marked its first direct engagement with DeFi trading infrastructure.
The firm’s 2026 chairman’s letter reported $65 billion in stablecoin reserves, $80 billion in digital-asset ETPs, and nearly $150 billion in total digital asset-linked AUM.
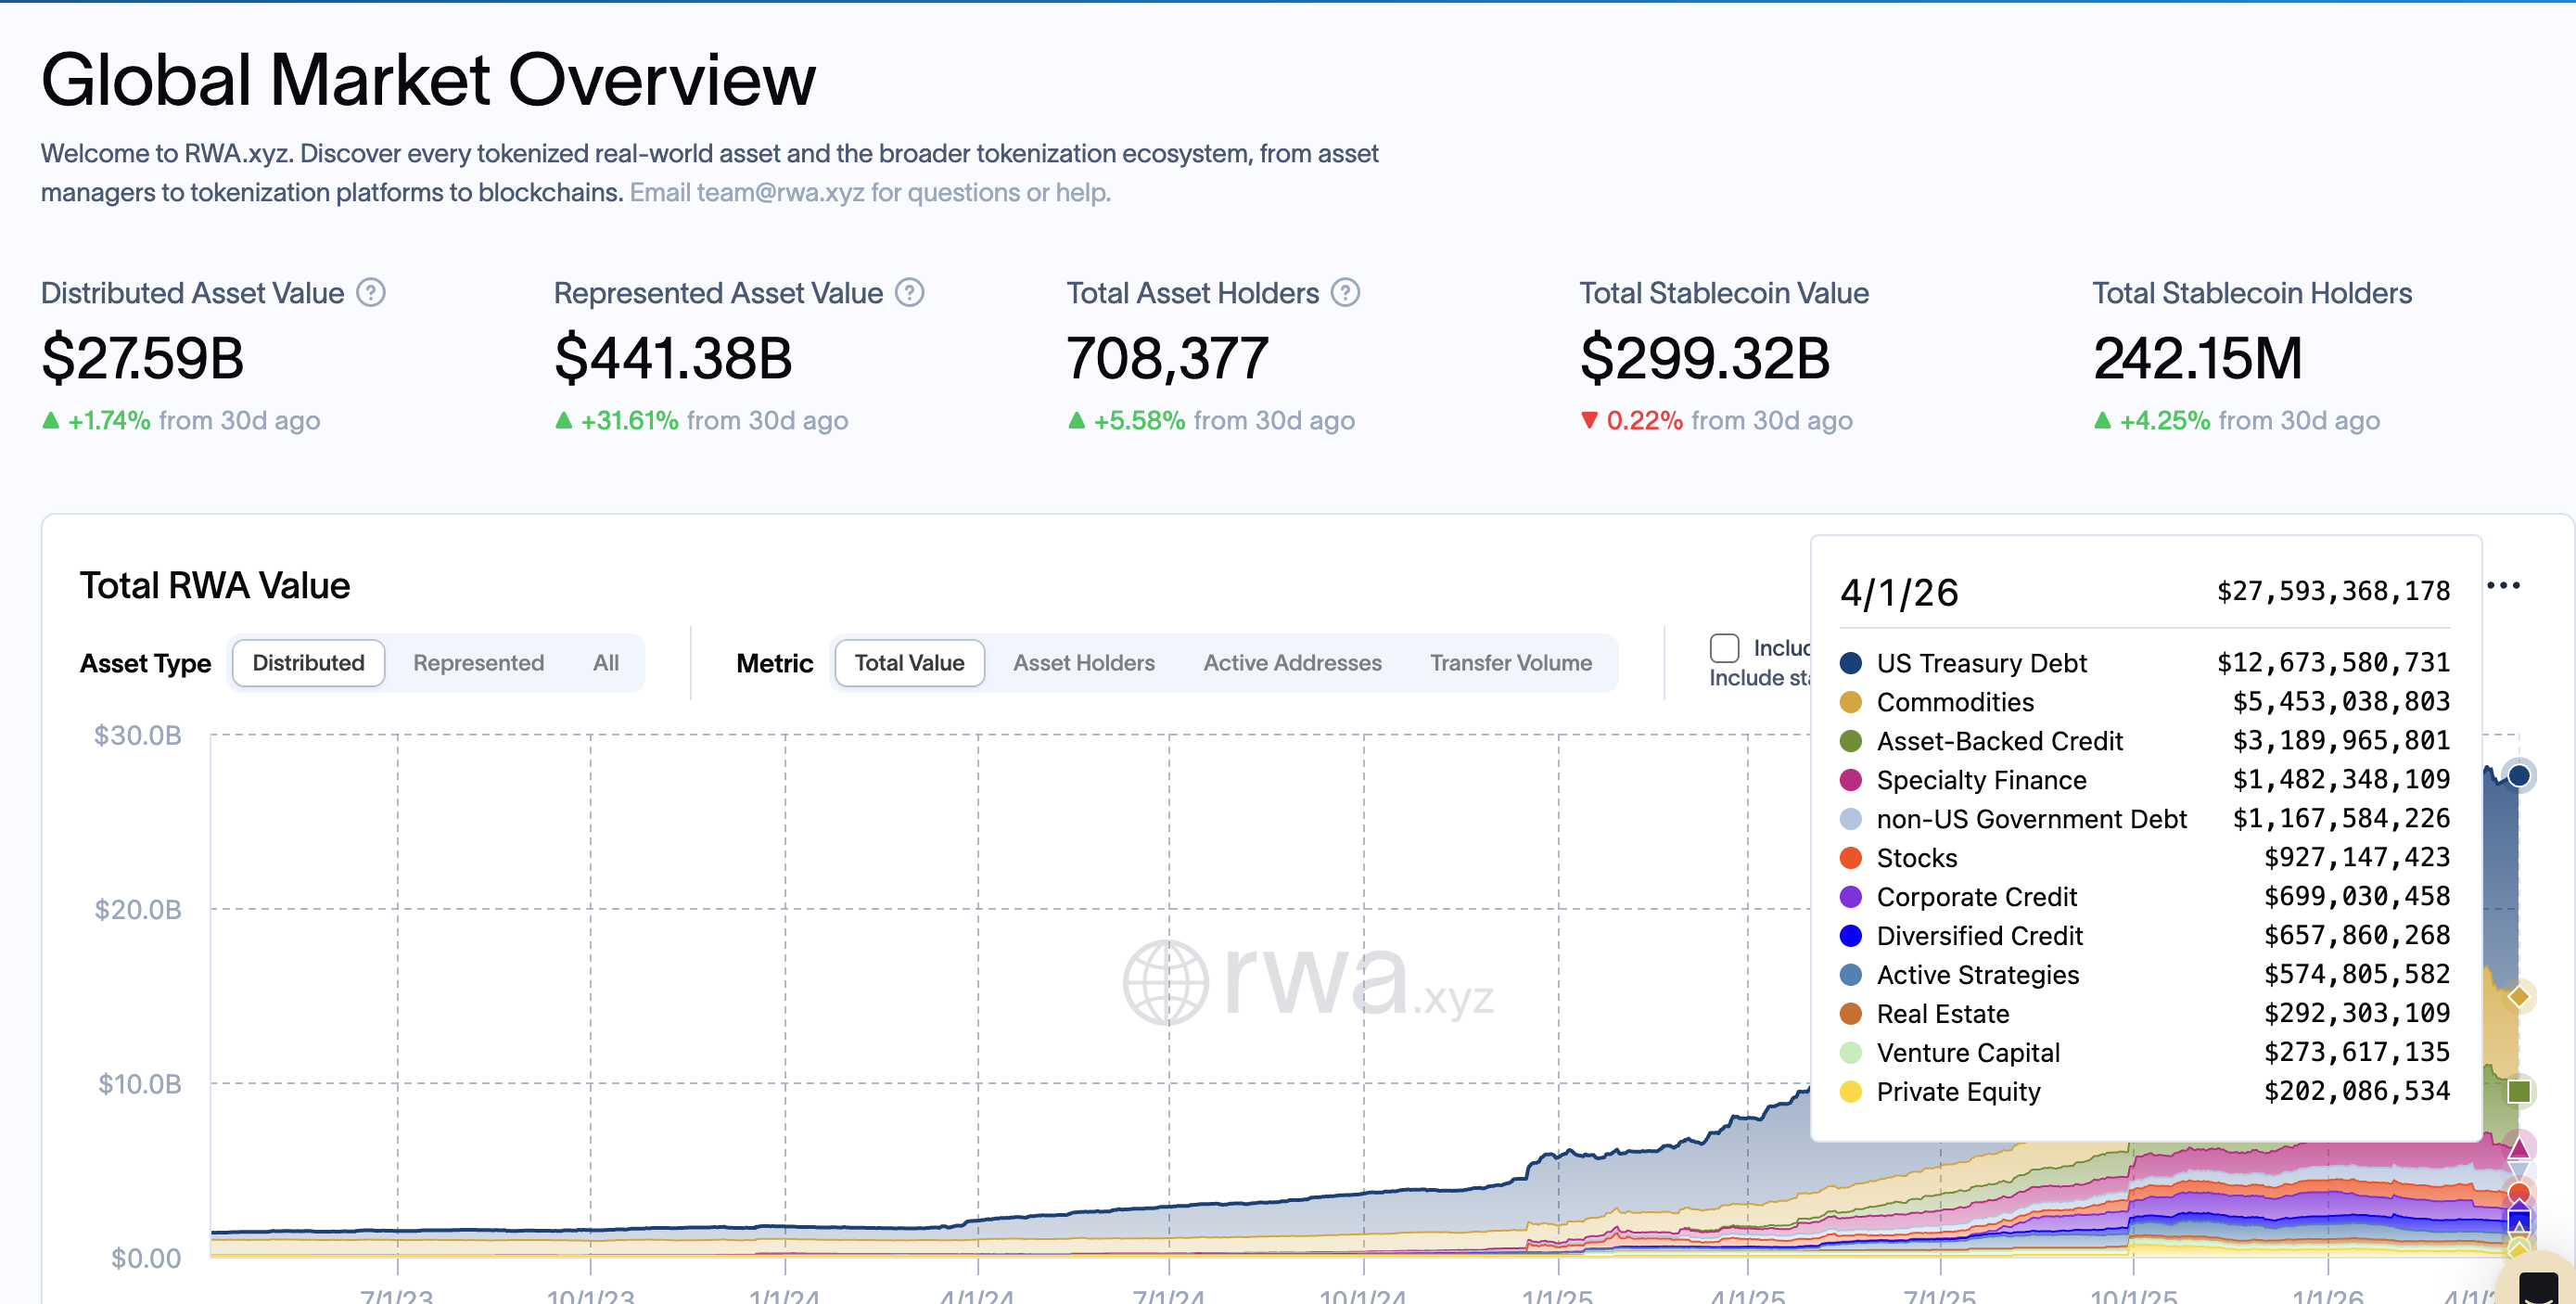
The broader market is scaling fast. RWA.xyz data as of April 2026 shows $12.67 billion in on-chain US Treasury debt, representing roughly 46% of the total $27.59 billion in tokenized real-world assets.
That total RWA figure grew 31.61% in just the last 30 days alone, with 708,377 asset holders across the ecosystem.
This is Wall Street holding crypto infrastructure, not crypto assets. However, all of it depends on one thing. Who has the keys.
The Custody Map Reveals a Single Point of Failure
Knowing who owns Wall Street’s crypto is only half the picture. The other half is who holds the keys.
Coinbase custodies over 80% of US Bitcoin and Ethereum ETF assets, a figure confirmed by CEO Brian Armstrong. Coinbase was the custodian for eight of the 11 spot Bitcoin ETF listings at launch. Only Fidelity self-custodies its own fund. VanEck selected Gemini.
This concentration creates a single-cluster dependency. A cyber incident, service disruption, or governance failure at one custodian could affect multiple funds simultaneously, with knock-on effects for creations, redemptions, and trading liquidity.
On the tokenized side, Bank of New York Mellon serves as BUIDL’s cash and securities custodian, while Anchorage Digital, BitGo, Copper, and Fireblocks support BUIDL subscribers.
As of March 2026, discussions are emerging around multi-party computation custody and multi-custodian mandates to spread risk. No structural changes have materialized yet.
The custody map reveals a paradox at the heart of Wall Street’s crypto exposure. A decentralized asset class funneled through increasingly centralized infrastructure. And that infrastructure still leaves major holders invisible, specifically those with no filing obligation at all.
The Shadow Holders and What No Filing Can Show
13F filings only apply to US institutional managers with over $100 million in qualifying assets. Family offices, offshore entities, and sovereign vehicles operating through intermediaries are not subject to disclosure obligations.
That creates a structural blind spot in Wall Street’s map of crypto ownership.
On-chain data reveals what filings cannot.
Cumberland DRW, one of Wall Street’s primary OTC desks, has processed a total of $123.58 billion in deposits and $97.71 billion in withdrawals across major exchanges since 2018.
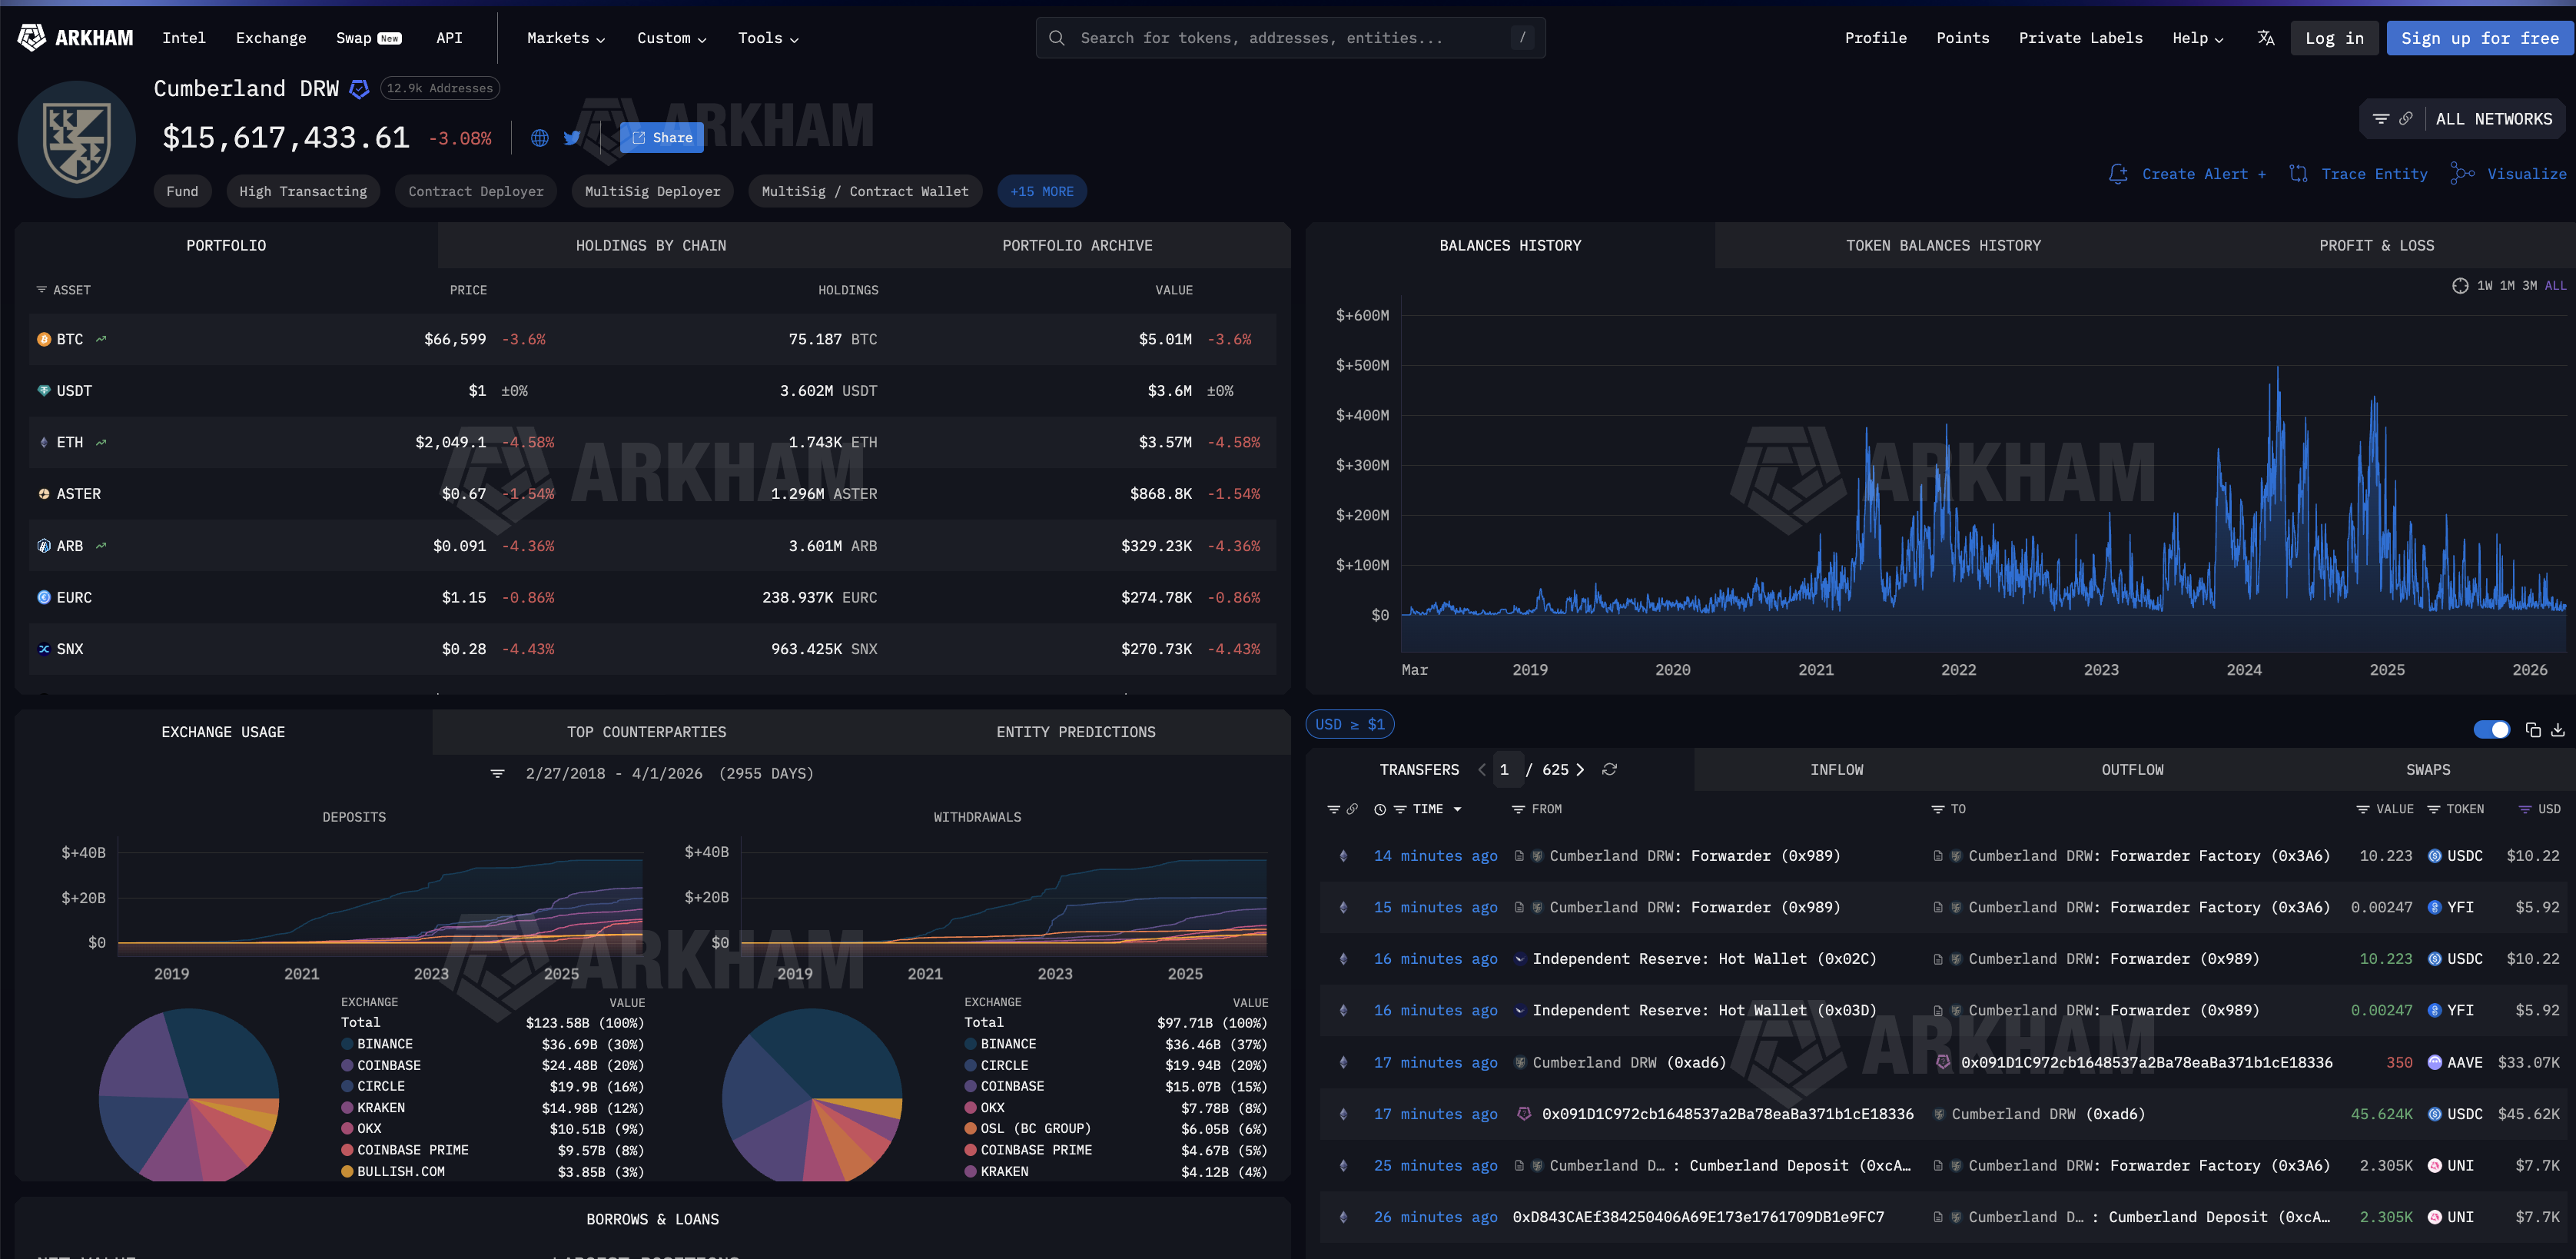
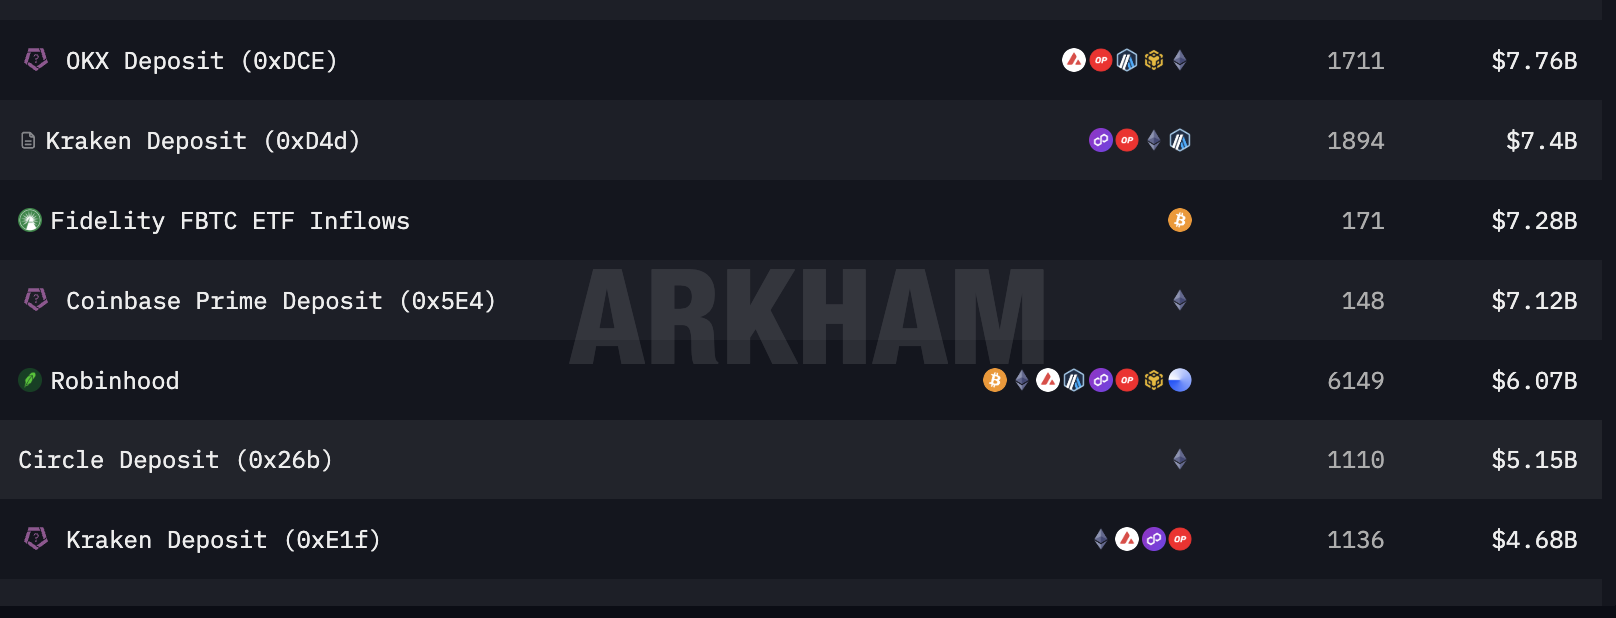
Filtering Cumberland’s outflows reveals where institutional capital actually goes. The top all-time outflow destinations include $17 billion to Binance, $14.53 billion to Coinbase Prime, likely for ETF creations, and $10.12 billion to Block Inc..
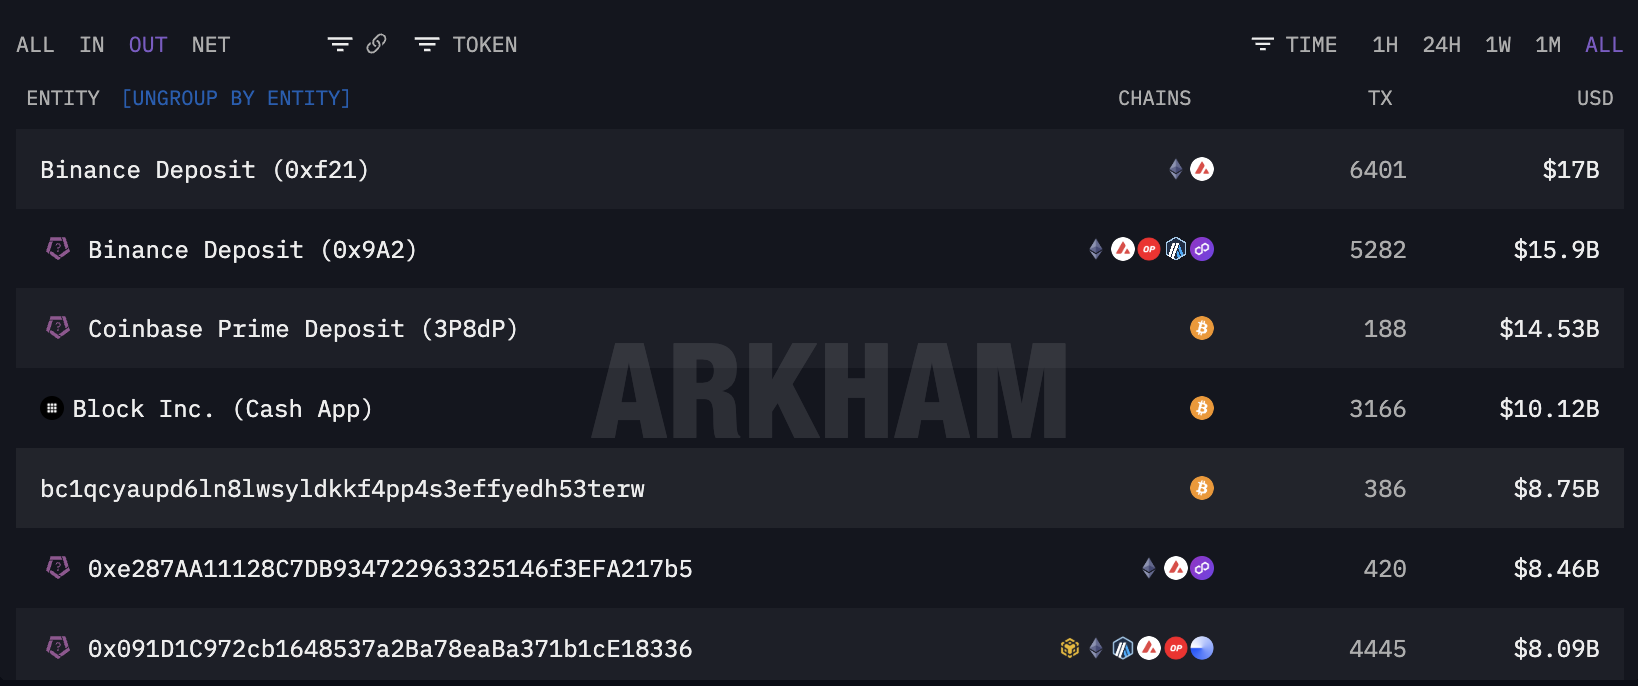
Scrolling further down the counterparty list confirms additional ETF and institutional plumbing. Fidelity’s FBTC ETF inflows appear at $7.28 billion across 171 transactions.
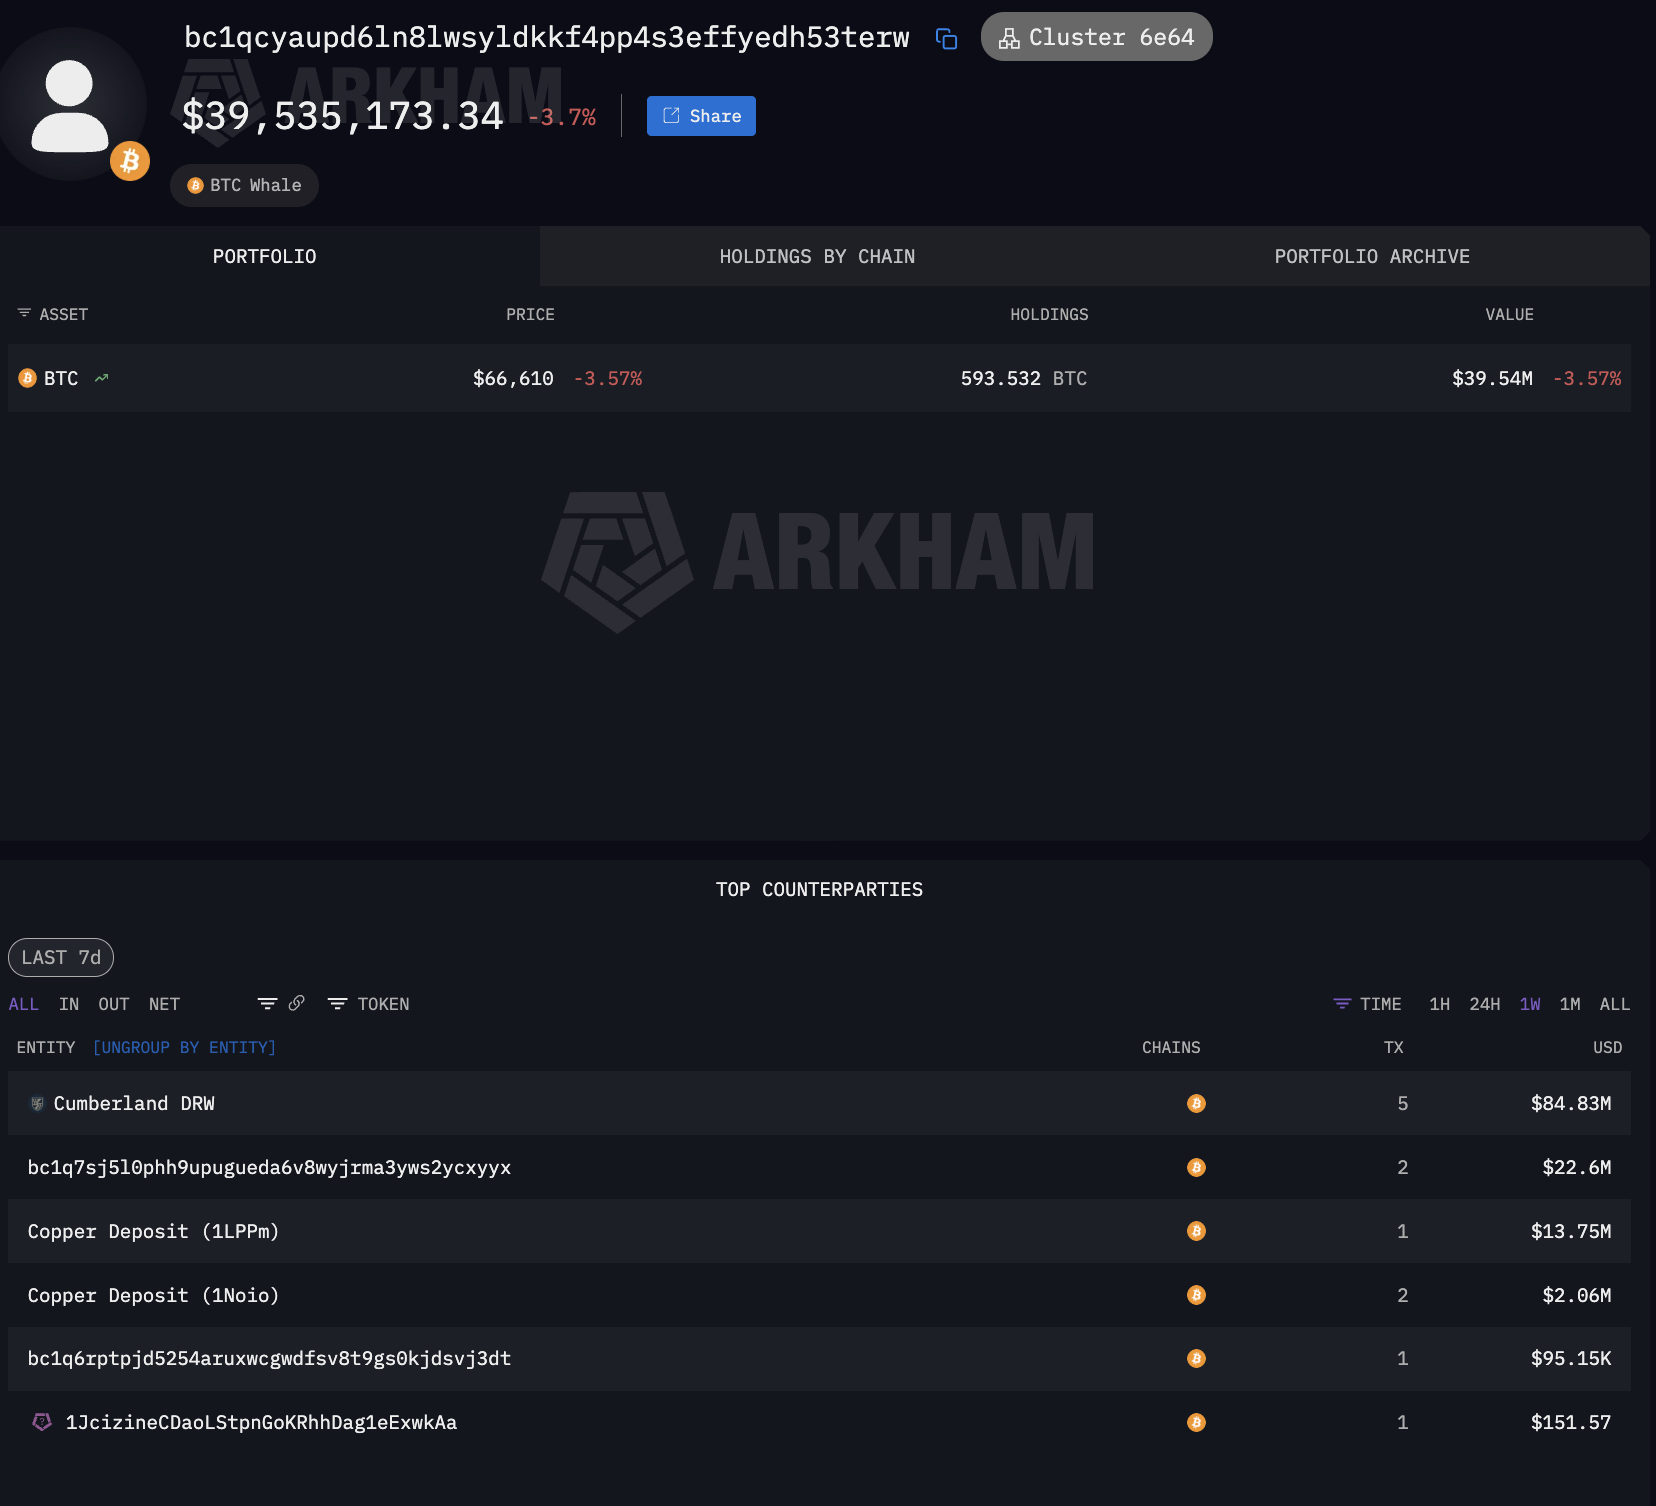
Alongside these labeled flows sit billions more directed to unlabeled wallets. The single largest unlabeled BTC recipient, wallet bc1qcyau..., received $8.75 billion across 386 transactions.
It currently holds 593 BTC and uses Copper’s institutional prime brokerage for custody.
That pattern, large OTC sourcing through a Wall Street trading firm paired with institutional-grade prime brokerage custody, is exactly the profile of a family office or sovereign vehicle operating through the same infrastructure as ETF issuers, just without the filing obligation.
The filings show part of the answer. The chain shows the rest.
The gap between the two hides durable demand from shadow holders who bought through a drawdown and still hold through institutional custody, suggesting deeper structural support than any ETF tracker captures.
That same gap also hides an untracked concentration that could crack it.
The post Who’s Really Holding Wall Street’s Crypto? appeared first on BeInCrypto.

TLDR:
- Bitcoin whales and sharks recorded over $30.9B in losses, averaging $337M daily in Q1 2026.
- Early February saw peak capitulation, with realized losses hitting $1.6B in a single day.
- Large holders led the sell-off, showing institutional-level distribution during market stress.
- Market stabilized post-February, with reduced losses and BTC trading within a tight range.
Bitcoin’s largest holders recorded steep realized losses during the first quarter of 2026, reflecting sustained selling pressure across major wallet groups. On-chain data shows whales and sharks collectively locked in over $30.9 billion in losses during the period.
Heavy Losses Driven by Early February Sell-Off
Glassnode data shared in a recent post on X by Coin Bureau pointed to an intense wave of selling in early February.
During this period, realized losses surged to nearly $1.6 billion in a single day. At the same time, Bitcoin’s price dropped sharply, signaling a coordinated market reaction.
Large holders played a central role in this movement. Wallets holding between 100 and 1,000 BTC recorded average daily losses of $188.5 million.
Meanwhile, wallets with 1,000 to 10,000 BTC posted daily losses of $147.5 million. Together, these groups accounted for a combined daily average of $337 million in realized losses.
This pattern suggests that selling activity was not limited to smaller participants. Instead, it involved entities often associated with institutional capital or long-term investors. The scale of these losses points to a broad liquidation phase rather than isolated exits.
At the same time, long-term holders continued to realize losses of nearly $200 million per day. This added further pressure to the market during the quarter. The combined effect marked the heaviest realized losses since the 2022 bear market.
Market Stabilizes as Selling Pressure Eases
Following the sharp downturn in early February, market conditions began to shift. Realized losses dropped into a lower range, typically between $200 million and $600 million per day. This change coincided with Bitcoin’s price stabilizing between $65,000 and $75,000.
As the weeks progressed, the market entered a consolidation phase. Price movements became more controlled, while large-scale panic selling appeared to subside. However, smaller spikes in realized losses continued to appear throughout March.
These repeated spikes reflected ongoing exits from weaker market participants. At the same time, price action remained choppy, with no clear directional trend. Both buyers and sellers appeared active, yet neither side gained sustained control.
By the end of March, realized losses had settled at moderate levels, ranging between $300 million and $500 million. This steady pattern suggested a more balanced environment compared to the earlier volatility.
The data shows that extreme selling conditions eased after the initial shock. Still, the presence of continued losses indicates that market confidence has not fully returned.
The absence of another major spike suggests a pause in aggressive selling rather than a complete shift in sentiment.
Overall, the first quarter of 2026 reflects a transition from heavy liquidation to a more stable but uncertain market phase.

Grayscale Investments posted consecutive endorsements of Sui (SUI) this week, praising its programming model for institutional use while calling current altcoin prices a potential buying opportunity.
The asset manager highlighted SUI alongside Ethereum (ETH), Solana (SOL), Chainlink (LINK), and Avalanche (AVAX) as tokens trading at historically low levels.
Why Grayscale Is Targeting SUI Now
Grayscale argues that financial institutions need speed, efficiency, and reliability, and highlights SUI’s programming model, built to preserve security while scaling performance.
It follows a recent post in which Grayscale Research called current altcoin levels a potentially attractive entry point.
“Grayscale Research believes that the current levels for leading altcoins like ETH, SOL, LINK, SUI, and AVAX, amongst others, offer a potentially compelling entry point,” they said.
Head of Research Zach Pandl expanded on the thesis in a separate report. He noted that the firm’s altcoin basket has fallen roughly 59% from its highs and gained only 2% from its lows since the January 2024 launch of the firm’s crypto ETP.
Pandl also pointed to relative strength in crypto markets during March. While the S&P 500 fell about 5%, the Grayscale Crypto Sectors Index rose about 4%.
“Current levels for leading altcoins…are quite compelling,” read an excerpt in the Grayscale report.
Broader Institutional Context
Grayscale’s SUI conviction extends beyond research. The firm recently launched its GSUI staking ETF on NYSE Arca and also operates trusts for SUI ecosystem tokens DeepBook and Walrus.
That makes SUI one of Grayscale’s deepest single-ecosystem bets outside Bitcoin and Ethereum.
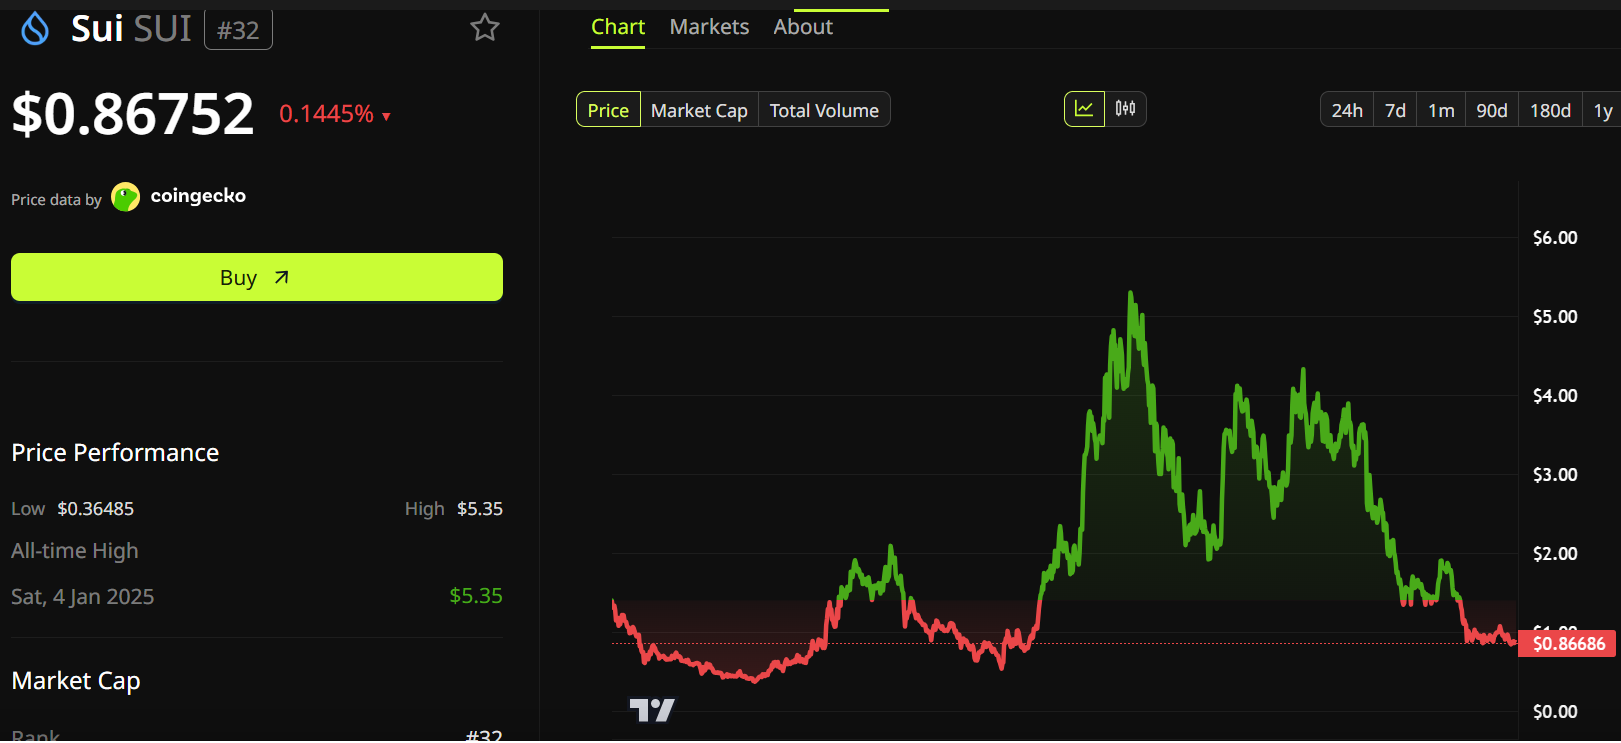
SUI currently trades near $0.87, having dropped over 80% from its cycle peak above $5.36.
Whether Grayscale’s repeated backing helps establish a floor at these levels will depend on whether institutional capital follows the firm’s public thesis.
The post Grayscale Says 5 Altcoins Are at ‘Buy Zone’ Levels appeared first on BeInCrypto.
Crypto World
XRP Price Prediction: Ripple’s 5B Token Reserve Hits Record as Pepeto Presale Goes Viral With $8.68M Raised
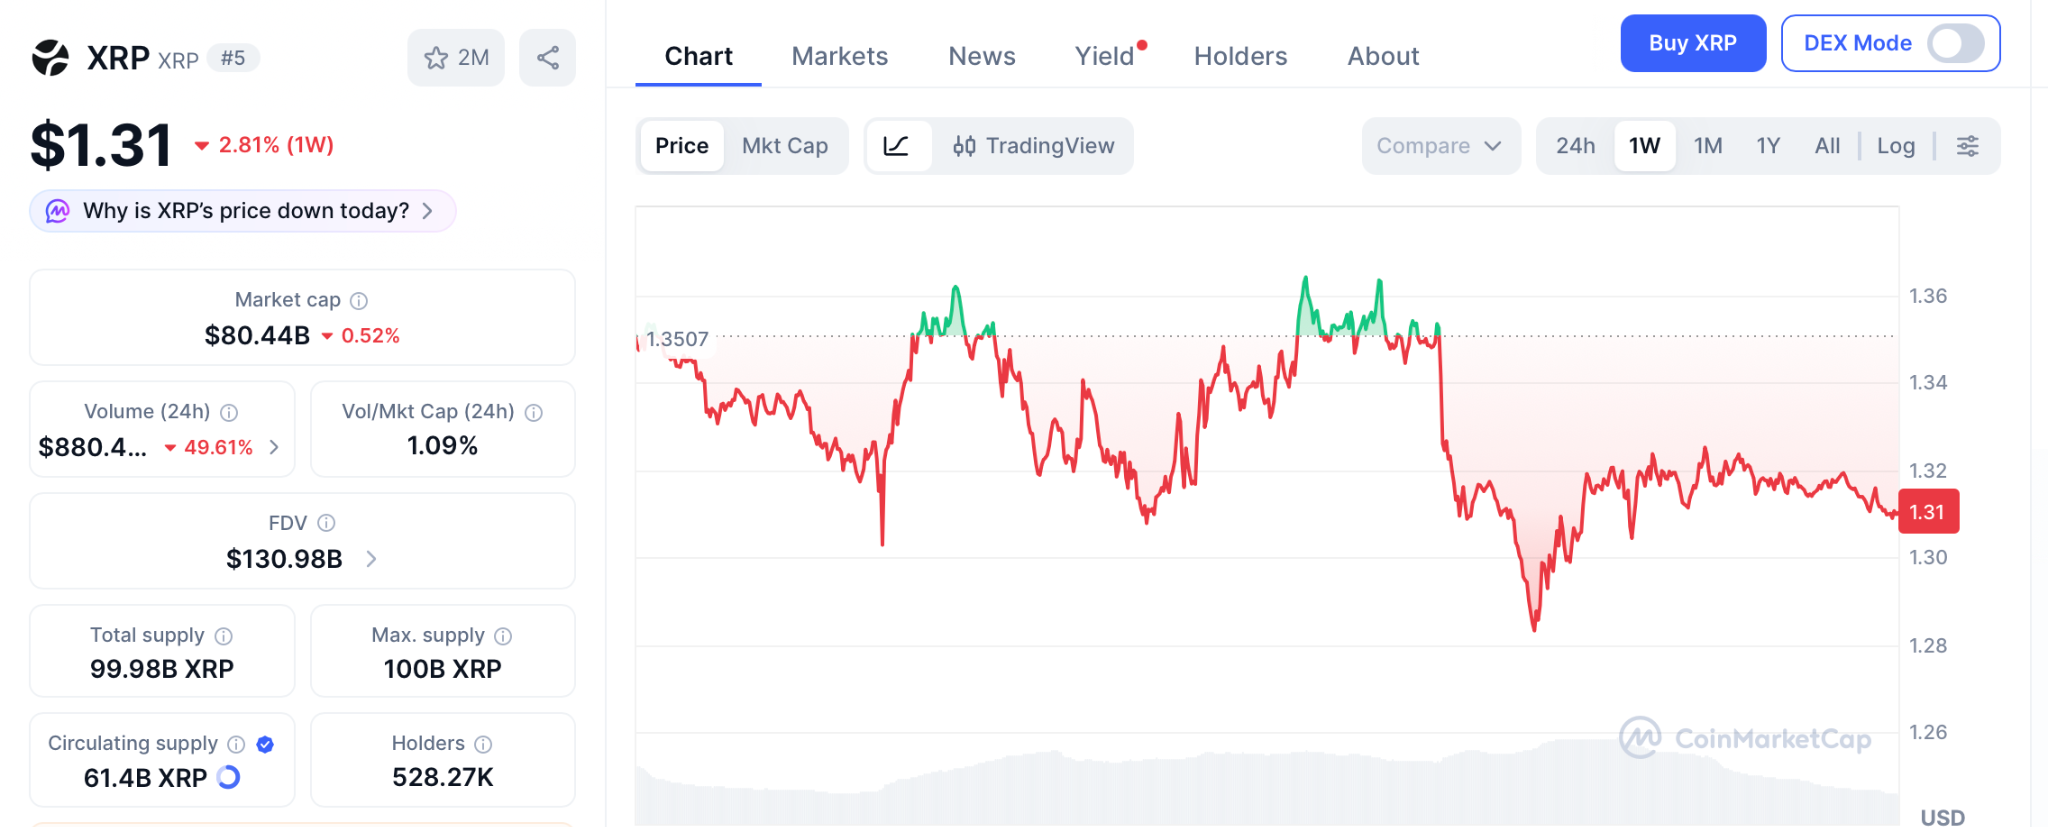
The xrp price prediction just absorbed its most significant supply event in months after Ripple unlocked 1 billion XRP worth $1.34 billion from escrow on April 1 and relocked 700 million the following day, pushing spendable reserves to 5 billion tokens for the first time, surpassing every monthly average from 2025, according to U.Today. With 300 million XRP now free to enter circulation, the supply overhang adds weight to a token already stuck in a tight range near $1.31.
But while XRP builds a case that could take years to fully play out, a different project has pulled $8.68 million in presale capital from wallets that recognized something the wider market has not priced in yet, and the fundamentals behind that conviction deserve attention before the listing reprices everything.
Ripple Pushes Spendable XRP to Record 5 Billion as Supply Pressure Builds
Ripple executed its scheduled escrow release on April 1 in two transactions of 500 million XRP each, then relocked 700 million on April 2, leaving approximately 300 million tokens available for distribution, according to CoinMarketCap. The company’s spendable reserves climbed from 4.968 billion in January to 5.08 billion by March, and the April unlock extends that trend further.
The xrp price prediction gets stronger on institutional timelines, but even aggressive analyst targets place XRP at $3, roughly a 2x from $1.31, and the wallets that created real portfolios in crypto understand that a slow double over years is not where generational returns live.
XRP Price Prediction Builds a Long Term Case While Pepeto Delivers the Entry That Creates the Stories People Remember
Pepeto: The Entry Where Every Signal Points in the Same Direction at the Same Time
The xrp price prediction carries real weight and the escrow dynamics add serious context, but the wallets that turned crypto into generational wealth did not get there by watching large caps grind higher over years. They identified the moment where a proven team, working infrastructure, and presale pricing all existed simultaneously, and they committed before the listing repriced everything. Pepeto is that moment right now.
The cofounder who grew Pepe into an $11 billion success now leads an exchange where AI screens every contract for risk before it goes live, where tokens move freely between Ethereum, BNB Chain, and Solana at zero cost, and where trading fees simply do not exist.
A former Binance executive shapes the exchange architecture while SolidProof verified every contract before the first dollar entered. The xrp price prediction to $3 requires years of institutional settlement volume to materialize. Pepeto operates on its own clock because its exchange model generates demand from the first trade, and BNB proved what that model produces by climbing from its own presale to a $90 billion valuation purely on platform activity.
$8.68 million entered during a correction because the wallets behind it calculated what exchange volume does to a token priced at six zeros. This is the setup that produced BNB millionaires, that rewarded early DOGE holders, that every cycle delivers exactly once. Once Pepeto’s Binance listing goes live, this presale price vanishes and every multiple attached to it closes permanently.
XRP Price Prediction After Escrow Unlock: Constructive Long Term but Timeline Stretches Forward
XRP trades near $1.31 according to CoinMarketCap with the xrp price prediction targeting $1.47, $1.61, and $2.40 on technical completions. The CLARITY Act faces its binary Senate markup in late April.
The escrow unlock and RLUSD’s $1.3 billion market cap reinforce the long-term thesis, but analysts note that scaling requires the CLARITY Act to pass and institutional settlement to grow, placing the largest gains in the 2027 to 2030 window.
Conclusion
Ripple’s treasury strategy is legitimate and the xrp price prediction has earned its constructive case, but the wallets that captured the biggest returns in every cycle did not do it by holding large caps through slow climbs. They locked in the window where a proven founder, live infrastructure, and presale pricing all overlapped before the listing closed it permanently.
Pepeto is that alignment right now with a cofounder behind $11 billion, an exchange verified and approaching launch, and $8.68 million from wallets that studied the fundamentals and acted while fear kept others frozen.
Skipping Pepeto at presale stage most likely means buying after listing at whatever price the early wallets decide to sell at, and watching the returns every trader dreams about belong to someone else. Visit the Pepeto official website while the presale window remains open.
Click To Visit Pepeto Website To Enter The Presale

FAQs
How does Ripple’s April escrow unlock affect the xrp price prediction?
The April 1 unlock added 300M XRP to circulation, creating short-term supply pressure while long-term fundamentals remain constructive.
Is $3 a realistic xrp price prediction target for 2026?
XRP needs BTC past $100K and the CLARITY Act signed into law. Without both, it stays rangebound near $1.30 to $1.50.
Why are XRP investors also entering the Pepeto presale?
The xrp price prediction offers roughly 2x while Pepeto at presale pricing with a $7B cofounder and verified exchange offers multiples XRP cannot match.
Disclaimer: This is a Press Release provided by a third party who is responsible for the content. Please conduct your own research before taking any action based on the content.
TLDR:
- Japan’s 2Y, 3Y, 5Y bond yields hit all-time highs while the 10Y yield reached its highest since 1999.
- The US-Iran conflict has blocked 90–95% of Japan’s oil route, driving inflation fears and BOJ pressure.
- There is currently a 55% probability of a 25BPS BOJ rate hike this month, unsettling crypto markets.
- Each BOJ rate hike since 2024 has caused Bitcoin to drop between 20% and 35% within weeks of the move.
Japan’s bond market crisis is drawing renewed attention from crypto investors worldwide. Bond yields across Japan’s 2-year, 3-year, and 5-year tenors have reached all-time highs.
The 10-year yield also climbed to its highest point since 1999. These shifts are raising concerns about a potential Bank of Japan rate hike. Analysts warn this could trigger a crypto market selloff similar to Q1 2026.
Rising Yields and the Strait of Hormuz Connection
Japan’s bond yields are climbing primarily because of growing inflation expectations. The ongoing US-Iran conflict has severely disrupted shipping through the Strait of Hormuz.
Nearly 90 to 95 percent of Japan’s oil supply passes through that route. With the strait largely blocked, energy prices for Japan are under significant upward pressure.
Higher energy costs feed directly into Japan’s broader inflation outlook. As a result, investors are pricing in the possibility of a hawkish shift from the Bank of Japan.
Crypto analyst Crypto Rover pointed to this connection on X. He noted that rising yields this week coincided with the shipping disruption.
When inflation expectations rise, bond yields typically follow. Japan is particularly vulnerable because of its heavy reliance on imported oil.
That dependence makes any disruption in Middle Eastern shipping a direct economic concern. Investors are now watching BOJ closely for any policy response.
Market data currently shows a 55 percent probability of a 25-basis-point rate hike by the BOJ this month. If the US-Iran situation remains unresolved, that probability is expected to climb further.
A confirmed rate hike could accelerate capital flows out of risk assets. Crypto markets would likely feel that pressure quickly.
BOJ Rate Hikes and Bitcoin’s Crash Pattern
Historical data shows a clear pattern between BOJ rate hikes and Bitcoin price drops. In March 2024, Bitcoin peaked near $74,000 and then fell roughly 20 percent.
In July 2024, it dropped 30 percent within a single week following a BOJ move. January 2025 saw Bitcoin fall 35 percent over several months after another hike.
The most recent example came in December 2025, when Bitcoin lost 34 percent in just six weeks. Crypto Rover attributed these drops to the unwinding of yen carry trades.
Traders who borrowed cheap yen are forced to sell assets when borrowing costs rise. That selling pressure then strengthens the yen and creates further liquidation.
The cycle tends to feed on itself once it starts. Asset prices fall, triggering more margin calls and further selling. Crypto markets, being highly liquid and volatile, often absorb the sharpest drops. Bitcoin and altcoins become exit routes for traders covering yen-denominated positions.
If the BOJ holds off on a hike, markets may stabilize in the near term. However, the bond market crisis in Japan remains an active risk for crypto investors globally.

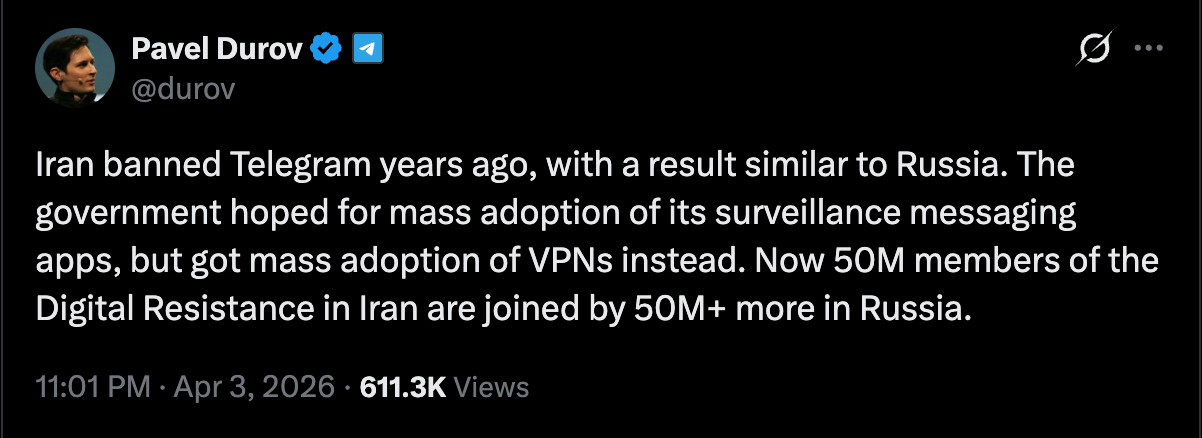
The Iranian government’s bid to shutter Telegram in the country appears to have backfired, as millions of users find workarounds to stay online through privacy-centric tools and VPNs, according to Telegram founder Pavel Durov.
In a post on X, Durov said Tehran’s attempt to clamp down on the messaging app “years ago” has instead fueled a broader wave of circumvention. He noted that tens of millions of Iranians remain connected via VPNs and similar technologies, and he highlighted a cross-border effect as VPN-driven connectivity accelerates in Russia as well.
“The government hoped for mass adoption of its surveillance messaging apps, but got mass adoption of VPNs instead. Now, 50 million members of the digital resistance in Iran are joined by over 50 million more in Russia.”
Decentralized technologies—ranging from blockchain-based messaging to encrypted, distributed networks—are increasingly pitched as a way to counter state-imposed online restrictions and surveillance, offering users a path to private communications even when central authorities exert control.
Key takeaways
- Iran’s Telegram ban did not end use; tens of millions continue to access the service via VPNs and related tools, per Pavel Durov.
- The stance has produced a broader migration toward privacy-preserving and decentralized messaging technologies beyond a single app.
- Even as governments restrict access, parallel connectivity channels such as Starlink and device-to-device mesh networks emerge as potential backstops for communication.
- Evidence from protests in Nepal and Madagascar shows spikes in downloads of decentralized messaging apps during periods of social unrest, underscoring demand for censorship-resistant tools.
- For investors and builders, the episode highlights a growing divergence between regulatory attempts to control information flow and a user base willing to adopt privacy-native infrastructure at scale.
Regulatory push, user resilience
Iran’s January 2026 nationwide internet blackout, enacted amid escalating protests and ongoing regional tensions, marked a decisive move to curb online mobilization. While the blackout remains in effect, residents retain some access through alternative means—most notably satellite-backed networks such as Starlink, which the government has not fully blocked—and through local, privacy-forward apps capable of wading through censorship filters.
Among the most discussed workarounds is BitChat, a messaging application built to operate over Bluetooth and mesh networks. BitChat turns each participating device into a relay node, effectively stitching a communications mesh that can bypass traditional networks and satellite backbones. Its decentralized design aims to keep conversations flowing even when centralized infrastructure is restricted.
The broader ecosystem around decentralized technologies is also expanding to address similar scenarios elsewhere. BitChat’s architecture has drawn attention for its potential to offer an alternative communication channel when internet access is compromised. The project’s technical approach and practical uses were detailed in public repositories and whitepapers, illustrating how mesh networking can complement or substitute conventional connectivity in crisis conditions.
Decentralized messaging in the crucible of unrest
The wave of protests that swept across Nepal in 2025 and 2026 brought a notable surge in interest for censorship-evading communication tools. Cointelegraph reported a sharp uptick in BitChat downloads in Nepal during the social-media crackdown, described as a period when the government’s grip on information intensified. In the same breath, Nepalese protests were described as having a transformative political effect within the month, with the government reportedly toppled by demonstrators in that period.
Similar dynamics were observed in Madagascar, where a related surge in decentralized messaging adoption accompanied political turbulence. These patterns illustrate a practical use case for privacy-preserving and distributed communications during periods of blackout and unrest, rather than a speculative tech experiment.
Proponents argue that the trend signals more than isolated incidents. As governments seek to regulate or disable centralized platforms, users appear to gravitate toward tools that improve resilience, privacy, and autonomy. This shift aligns with a broader discourse in the crypto and decentralized tech communities about building communications layers that remain accessible despite state-level interference.
What this means for markets, users, and builders
The episode offers a tangible case study in how regulatory pressure can inadvertently accelerate adoption of decentralized and privacy-first technologies. For traders and investors, the takeaway is not a call for quick price moves but a recognition that demand for censorship-resistant communications could expand alongside ongoing geopolitical frictions and regulatory crackdowns in various regions.
For developers and infrastructure builders, the narrative underscores several priorities: enhancing the reliability of offline and mesh-based communications, improving the security and usability of decentralized messaging, and developing interoperable layers that can bridge traditional networks with privacy-focused protocols. The convergence of encrypted messaging with crypto-inspired incentives and governance mechanisms could shape new kinds of platforms that prioritize user sovereignty and resilience over centralized control.
While the exact regulatory responses and technological adoption timelines remain uncertain, the Iranian case—paired with parallel developments in Nepal and Madagascar—highlights a clear, growing demand for alternatives that keep people connected when conventional networks falter.
As the situation evolves, watchers should monitor how governments respond to a populace that increasingly expects and deploys private, censorship-resistant channels. The next developments could redefine how citizens, developers, and policymakers think about online rights, access, and the role of decentralized technology in everyday communication.
Source references and ongoing reporting from Cointelegraph and related coverage underscore the continuity of this trend as it unfolds across regions facing varying degrees of internet control and regulatory pressure.
The Iranian government’s attempt to block the Telegram messaging application in the country has backfired, as users find ways to circumvent national firewalls and online controls, according to Telegram co-founder Pavel Durov.
“Iran banned Telegram years ago,” Durov said on Friday; however, tens of millions of users in the country have managed to access the application via virtual private networks (VPNs) and other similar tools, he added.
VPNs route web traffic through servers distributed around the globe to mask the true Internet Protocol (IP) addresses of users and obscure their locations. This allows individuals with VPN access to bypass national online restrictions. Durov said:
“The government hoped for mass adoption of its surveillance messaging apps, but got mass adoption of VPNs instead. Now, 50 million members of the digital resistance in Iran are joined by over 50 million more in Russia.”

Decentralized technologies like blockchain, crypto and encrypted messaging applications can mitigate or neutralize state-imposed online restrictions and surveillance infrastructure, promoting individual liberty, proponents of decentralized technology say.
Related: Global turmoil pushes uptake of decentralized messengers, social media
Users turn to decentralized alternatives amid online blackouts
The government of Iran imposed a nationwide internet blackout in January 2026, amid growing protests and civil unrest, which is still in effect due to the ongoing war between Israel, the United States and Iran.
Residents in the country can still access the internet through Starlink, a satellite-based network, or communicate via BitChat, a messaging application that uses Bluetooth radio waves to form a mesh network between devices.
BitChat’s mesh network transforms each device into a relay node that transfers data to other devices running the application within range, bypassing online and satellite-based systems entirely.

The government of Nepal imposed a social media ban in September 2025 amid growing protests, causing a spike in BitChat downloads.
Bitchat was downloaded over 48,000 times in Nepal the week of the social media ban, and the government of Nepal was toppled by protestors that same month.
The application recorded a similar download spike in Madagascar amid protests, which also occurred around the same time as the political revolution in Nepal.
Magazine: Did Telegram’s Pavel Durov commit a crime? Crypto lawyers weigh in

Bitcoin leverage rises as spot demand weakens across markets. Negative funding rates reflect stronger short positioning pressure. Institutional accumulation offsets declining retail spot activity.
Bitcoin traded near $67,150 as derivatives activity shaped short-term price behavior. Market data showed declining spot volume alongside rising leverage metrics. The trend pointed to increased reliance on futures positioning rather than direct buying.
Falling Spot Volume Signals Weak Market Participation
Bitcoin recorded a steady drop in daily spot volume over recent weeks. Activity declined from 42,026 BTC on March 17 to 35,590 BTC on April 2. The contraction reflected weaker participation in direct market transactions.
At the same time, open interest declined from $23.33 billion to $21.26 billion. However, the drop remained smaller compared to spot volume losses. This difference suggested that derivatives exposure stayed relatively elevated.
The estimated leverage ratio increased from 0.2207 to around 0.225. The shift indicated that traders relied more on leveraged positions. As a result, price action became less dependent on organic spot demand.
Rising Short Pressure and Liquidation Risk Build
Funding rates remained mostly negative across perpetual futures markets. This pattern showed that short positions dominated trader sentiment. It also indicated persistent pressure against upward price movement.
Liquidity zones below the current price appeared closer than those above. This structure increased the probability of downward moves in the short term. Long positions faced a higher risk of forced liquidations under such conditions.
At the same time, analysts highlighted that leverage-driven markets tend to amplify volatility. Price swings often accelerate when liquidation cascades begin. Therefore, short-term direction remained sensitive to derivatives positioning.
Institutional Demand Contrasts with Weak Spot Activity
Despite weaker spot demand, institutional buying activity continued to absorb supply. Exchange reserves dropped by 66.3K BTC over the past 30 days. The decline reflected ongoing accumulation outside public trading venues.
Over-the-counter transactions accounted for 92.1% of recent flows. In contrast, regular market volume contributed only 7.9% during the same period. This imbalance showed that large buyers dominated current demand trends.
Broader macroeconomic uncertainty still influenced market stability. External shocks could quickly push assets back onto exchanges. Such shifts may increase available supply and trigger rapid price adjustments.
Market Structure Reflects Mixed Signals
Bitcoin’s current structure combined strong institutional accumulation with weak retail participation. This mix created uneven support across different market segments. It also increased reliance on leveraged trading activity.
At the same time, declining spot demand limited organic price growth potential. Derivatives markets continued to play a larger role in price discovery. This dynamic added complexity to short-term market direction.
Overall, the market showed signs of fragility despite ongoing accumulation. Liquidity positioning and leverage trends suggested elevated risk levels. As a result, near-term movements remained vulnerable to sudden shifts.

Solana-based perpetual futures exchange Drift Protocol is facing mounting scrutiny following the catastrophic $285 million exploit it suffered this week.
The backlash is being driven by a highly speculative recovery strategy and suspicious post-hack token movements.
Drift Team Linked Wallet Shifts Over $2 Million Tokens
On April 4, blockchain analysis platform Onchain Lens reported that a wallet linked to the Drift team deposited 56.25 million DRIFT tokens into centralized exchanges Bybit and Gate after the hacking incident. The tokens were valued at $2.44 million.
Transfers to exchanges are typically interpreted as a sign of potential selling activity. The timing has added to the concern, with the token falling to an all-time low of $0.03343 over the past 24 hours.
The move has drawn significant scrutiny from the community because it comes while the project is still dealing with the fallout from the hack.
That has made the transfer of internal funds to secondary markets during a severe liquidity crisis especially contentious. It has also raised fresh concerns about possible asset flight and complicated efforts to rebuild user trust.
On April 1, North Korean attackers hacked Drift Protocol, draining around $280 million. This slashed the platform’s total value locked from $550 million to about $230 million as of press time.
The April 1 attack ranks as the largest decentralized finance hack of 2026 so far. The fallout has continued to spread, with reports indicating that the number of affected projects has now risen to 20.
The breach also stands as the second-largest hack in Solana’s history, behind only the $326 million Wormhole exploit in 2022.
Solana Co-Founder Proposed Recovery Strategy
Amid the ongoing crisis, Solana co-founder Anatoly Yakovenko publicly suggested that Drift could survive by executing an “airdrop” of IOU tokens.
This mirrors the strategy employed by the centralized exchange Bitfinex following its $72 million hack in 2016.
Yakovenko said a core engineering team could rebuild the platform and use the IOU tokens to eventually make affected users whole.
Market analysts, however, point to major structural differences between the two cases.
Bitfinex benefited from a dominant position in centralized trading and recurring fee revenue during a historic crypto bull market. This allowed the exchange to gradually buy back its debt tokens at a 1:1 ratio.
Drift, by contrast, operates as a decentralized exchange in a highly competitive and fragmented market. With user confidence damaged and liquidity cut roughly in half, the protocol lacks the predictable revenue base needed to support an unsecured debt instrument.
Analysts have also argued that describing such an issuance as an “airdrop” risks obscuring the core issue. Without a solvent protocol and a viable path to repayment, the tokens would carry no intrinsic value beyond speculation on a future recovery.
The post Solana’s Drift Floats Airdrop After $285 Million Hack, Faces Backlash appeared first on BeInCrypto.
Crypto World
Ripple (XRP) Down 7% This Month, Investors Move to Taurox (TAUX) as Pre-KYA Opening Might Start a Rally

XRP trades near $1.32 with growing optimism. April has historically been XRP’s strongest month, posting average returns of 24.8% since 2014, driven by the upcoming CLARITY Act Senate Banking Committee markup scheduled for the second half of the month.
Taurox, an AI-driven trading protocol, positions itself to harness this momentum through autonomous agents that deliver diversified, risk-managed yields to stakers in the evolving crypto landscape.
Navigating XRP Volatility with Taurox’s Structured Edge
XRP’s recent price action remains choppy despite partnerships and regulatory progress, with escrow unlocks adding supply pressure and exposing holders to frequent 20-30% whipsaws. Taurox counters this by pooling deposits of USDT, BTC, or XRP into a shared trading pool. Global developers, quants, and AI engineers build the agents that generate proportional net profits.
Each agent is capped at 2% of pool AUM, while KYA tiers enforce conservative, moderate, or aggressive risk levels. Enforced Sharpe ratios ≥1.5 and maximum drawdowns below 15% deliver smoother returns than direct exposure or traditional 2% management-fee hedge funds.

Pre-KYA Registration Now Open: Accelerating the Agent Pipeline
Taurox has hit a major roadmap milestone ahead of schedule by opening the Pre-KYA Registration Table. This early entry point allows developers, quants, and AI builders to pre-register their trading agents before the full Know Your Agent (KYA) system goes live. Pre-registered agents receive priority Proving Ground access, jumping the queue for faster entry and earlier capital allocation.
They also qualify for bonus incentives from the dedicated Agent Creator Fund, which represents 10% of total TAUX supply. Anyone with a working trading strategy can now position their agent among the first wave in the Taurox ecosystem.
Taurox Mechanics: On-Chain AI Trading with Rigorous Controls
Taurox aggregates staker deposits into a central trading pool and mints txTokens at the prevailing NAV per share, starting at $1.00. The protocol maintains a 15% stablecoin reserve buffer and directs the remainder to agents through a performance-weighted algorithm. Agents execute strategies like statistical arbitrage via on-chain vaults or CEX sub-accounts.
Every agent must complete the Proving Ground until achieving statistical significance, such as ≥500 trades. Risk controls include 2% daily stop-losses, 5% single-trade limits, and 5% pool-wide drawdown halts. KYA tiers enforce strategy fidelity in a fully verifiable decentralized quant framework.

TAUX Tokenomics: Fixed Supply and Burn-Driven Scarcity
TAUX has a fixed 2 billion non-mintable supply. Unlike traditional hedge funds, Taurox charges no upfront fees and takes only 5% of gross profits, purchased as TAUX on-market. Of this revenue, 30% is permanently burned, while 70% supports the DAO treasury.
The remaining 95% distributes progressively to stakers and creators, with stakers receiving 80% at 0-20% returns, tapering to 43% above 300%, based on high-water mark net profits. Allocations include 40% for presale, 15% for staking rewards, 10% for agent incentives, and 5% for the team with 6-month cliff vesting.
Taurox Presale: Asymmetric Entry with Strong Fundamentals
Taurox Presale has entered Phase 4 and surpassed $950K raised. TAUX currently trades at $0.018. Phase 4 investors stand to gain almost 4.5x at listing when TAUX launches at $0.08. If Taurox reaches its $1B target pool, these investors could see up to 103x returns as TAUX reaches $1.85. A $500 investment today would grow to about $2,220 at listing and nearly $28,000 when TAUX hits $1 valuation.
The presale features a 1-month cliff and 20% monthly unlocks from months 2-5, enabling immediate staking while limiting early sell pressure. Combined with 30% fee burns and progressive splits, it offers strong upside for short and long-term horizons.
Taurox as the Decentralized Quant Layer
Taurox blends AI autonomy, strict on-chain risk controls, and deflationary mechanics into next-generation DeFi. Its global agent ecosystem and burn-driven scarcity position it for sustainable growth as the crypto space evolves.
Learn More
Buy TAUX: https://taurox.io
Whitepaper: https://docs.taurox.io/
Official Telegram: https://t.me/tauroxlabs
Official X/Twitter: https://x.com/TauroxProtocol
Disclaimer: This is a Press Release provided by a third party who is responsible for the content. Please conduct your own research before taking any action based on the content.
Wales blasted by force 10 winds amid Storm Dave amber warning from Met Office
Who’s Really Holding Wall Street’s Crypto?

Unpacking Peter Thiel’s big bet on solar-powered cow collars

Smart energy pays enters the US market, targeting scalable financial infrastructure

Why Israel is blocking foreign journalists from entering

Bitcoin: We’re Entering The Most Dangerous Phase

Powerful Morning Dua for Rizq, Job, Business & Financial Problems | Start Your Day with Barakah

#motivation #home #money #house #god #lakshmi #shorts #viralvideo #reels #youtubeshorts #quotes

Larry Lepard – “My 2026 Bitcoin Prediction Will Shock Many People”
-

 NewsBeat2 days ago
Steven Gerrard disagrees with Gary Neville over ‘shock’ Chelsea and Arsenal claim | Football
-

 Business2 days ago
No Jackpot Winner and $194 Million Prize Rolls Over
-

 Fashion1 day ago
Weekend Open Thread: Spanx – Corporette.com
-
Entertainment5 days ago
Fans slam 'heartbreaking' Barbie Dream Fest convention debacle with 'cardboard cutout' experience
-

 Crypto World3 days ago
Gold Price Prediction: Worst Month in 17 Years fo Save Haven Rock
-

 Tech6 days ago
The Pixel 10a doesn’t have a camera bump, and it’s great
-
Crypto World4 days ago
Dems press CFTC, ethics board on prediction-market insider trades
-
 Entertainment7 days ago
Lana Del Rey Celebrates Her Husband’s 51st Birthday In New Post
-

 Tech6 days ago
Avatar Legends: The Fighting Game comes out in July and it looks pretty slick
-

 Business3 days ago
Login and Checkout Issues Spark Merchant Frustration
-

 Sports4 days ago
Tallest college basketball player ever, standing at 7-foot-9, entering transfer portal
-

 Tech5 days ago
EE TV is using AI to help you find something to watch
-

 Tech5 days ago
Apple will hide your email address from apps and websites, but not cops
-

 Fashion7 days ago
Amazon Sundays: Soft Spring Layers
-

 Politics5 days ago
Should Trump Be Scared Strait?
-

 Tech6 days ago
Elon Musk’s last co-founder reportedly leaves xAI
-

 Fashion5 days ago
The Best Spring Trends of 2026
-

 Tech4 days ago
How to back up your iPhone & iPad to your Mac before something goes wrong
-

 Crypto World5 days ago
U.S. rule change may open trillions in 401(k) funds to crypto
-

 Tech5 days ago
Flipsnack and the shift toward motion-first business content with living visuals
You must be logged in to post a comment Login