
Crypto World
Hyperliquid and Pump.fun Drive 90% of $638M Record Crypto Buybacks: FT

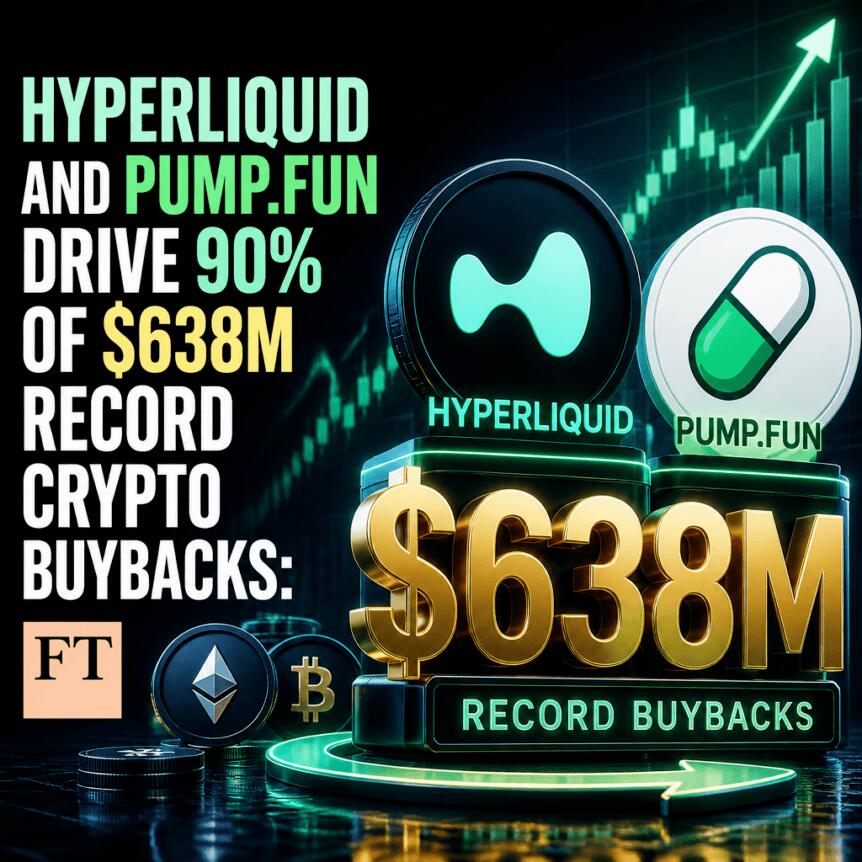
Crypto projects are leaning harder into a strategy more familiar from traditional finance: buying back their own tokens. So far in 2026, projects have reportedly spent a record $638 million on token buybacks, according to data compiled by Allium Labs and cited by the Financial Times in a report released Monday.
That total highlights a clear concentration. Hyperliquid and Pump.fun together account for the majority of the year-to-date figure, with Hyperliquid responsible for roughly $370 million and Pump.fun nearly $200 million, as reported by the Financial Times based on Allium Labs’ dataset.
Key takeaways
- Year-to-date token buybacks reached $638 million in 2026, per Allium Labs data cited by the Financial Times—up from $545 million over the same period in 2025.
- Hyperliquid and Pump.fun dominate the activity, together accounting for roughly $570 million of the $638 million total.
- Buybacks are still uncommon in crypto, but more issuers are now using revenue to fund repurchases and support token value.
- Following an Ethena Foundation vote proposal for fee revenue to be used for ENA buybacks, ENA rose 10.7% on the day after the announcement, according to the report.
- HYPE and PUMP have outperformed the broader crypto market decline so far in 2026, based on TradingView-reported performance data.
Record buybacks, concentrated among a few protocols
The Financial Times report framed token buybacks as the crypto analogue to share buybacks: instead of supporting equity prices directly, projects repurchase their own tokens in an effort to bolster token valuation and returns for existing holders.
While this approach remains relatively rare across the broader industry, the numbers show it is no longer an edge-case tactic. Allium Labs’ figures—reported by the Financial Times—indicate buyback spending has accelerated sharply over the past year, rising to $638 million year-to-date in 2026 from $545 million in the same period of 2025. The earlier baseline from Allium Labs cited by the Financial Times shows much lower activity in 2024, at just $366,000.
Crucially, the activity is not evenly distributed. Hyperliquid’s buyback spend of roughly $370 million and Pump.fun’s nearly $200 million together represent the bulk of the year’s token repurchase momentum, suggesting that revenue-rich protocols with clear treasury mechanics are currently driving most of the trend.
How Hyperliquid and Pump.fun are funding repurchases
The performance of HYPE and PUMP appears tightly linked to that repurchase intensity. According to TradingView data cited by the report, HYPE is up 145% year-to-date and PUMP is up 109% year-to-date during a period when Bitcoin fell 10% and total crypto market capitalization declined by 11.9%.
Hyperliquid’s structure is especially aggressive: the report states Hyperliquid spends about 99% of its revenue on token buybacks. It adds that Hyperliquid reported $169 million in second-quarter revenue on Aug. 6, directing $141 million toward HYPE buybacks, citing prior coverage from Cointelegraph (link provided in the source material).
Pump.fun’s approach is similar in spirit but less extreme in percentage terms. The report says Pump.fun allocates about 50% of its net protocol revenue for token repurchases. It also notes the launchpad has $420 million in annualized revenue, based on average daily revenue over the past 90 days, referencing data presented in the source article.
For investors, the key takeaway is that these are not one-off buyback announcements; both projects appear to embed repurchases into how they use revenue. That can matter because sustained buyback programs may influence token holder expectations differently than occasional treasury actions.
Ethena enters the buyback conversation
The broader market dynamic is also shifting. On Thursday, the Ethena Foundation opened a vote on a fee-switch proposal, under which 95% of the net revenue paid to it from Ethena’s core business lines would be used to repurchase ENA tokens, according to the report.
The same coverage noted that the ENA token rose 10.7% on the day after the proposal was opened, suggesting traders are actively pricing in the possibility that revenue earmarked for repurchases could tighten supply or otherwise support valuation.
This matters beyond one token. As governance proposals proliferate, buybacks could become a more common tool for protocols seeking to align treasury use with tokenholder interests—particularly when those protocols have measurable and recurring revenue streams that can be redirected.
Why this trend could spread further
Momentum around token buybacks is beginning to attract mainstream portfolio analysis within crypto. Earlier in August, Bitwise chief investment officer Matt Hougan said, as referenced in the source article, that “crypto valuations could double” in the next two years as protocols increasingly use revenue to fund token buybacks and burns, returning more value to investors.
That prediction is not a guarantee, but the underlying logic is straightforward: if revenue consistently converts into repurchases (and potentially burns), the token’s economic value proposition can become more direct, rather than relying solely on speculation about adoption or network effects.
Still, readers should treat this as an evolving sector experiment rather than a uniform playbook. The same data point can have different implications depending on how a protocol determines buyback size, whether repurchases are executed regularly, and how token supply mechanics work in practice. Even within the report’s examples, the buyback intensity varies—Hyperliquid’s stated near-total revenue dedication versus Pump.fun’s roughly half.
Going forward, the most useful signal to watch is whether the next wave of proposals and repurchase programs matches the consistency seen in Hyperliquid and Pump.fun—or whether buybacks remain occasional. As governance votes move from concept to execution, traders and long-term holders will likely focus on how reliably protocols convert revenue into buy pressure and how quickly markets respond when those programs begin.

Strive, a publicly traded asset manager and Bitcoin treasury company, added 1,800 Bitcoin to its holdings last week, accelerating an accumulation strategy that has propelled it into the ranks of the world’s five biggest publicly traded corporate Bitcoin holders.
The company purchased the Bitcoin (BTC) for approximately $143 million between Aug. 24 and Aug. 28, paying an average price of $79,431 per BTC, including fees and expenses. CEO Matt Cole confirmed the acquisition on Monday.
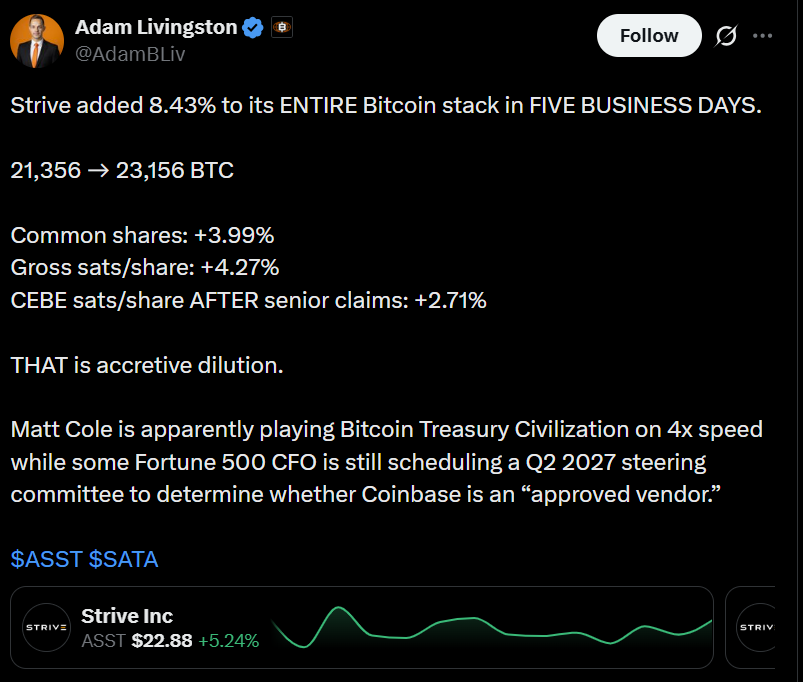
The purchase brought Strive’s total holdings to 23,156 Bitcoin, up from 21,356 BTC a week earlier. As Cointelegraph reported, the company had purchased 1,110 BTC the previous week for roughly $81.5 million at an average price of $73,409 per coin.
Strive has accelerated its Bitcoin accumulation in recent weeks. Adam Livingston, an adviser to Saturn Credit, noted that the latest purchase increased the company’s Bitcoin holdings by roughly 8.4% in just five business days.
Source: Adam Livingston
The acquisition also pushed Strive past Bullish, the crypto exchange and digital asset infrastructure company, to become the fifth-largest publicly traded corporate holder of Bitcoin, according to industry data.
Corporate Bitcoin buying returns as price rebounds
Strive’s latest purchases have coincided with a broad recovery in Bitcoin and the wider digital asset market that began on Aug. 19, when the US Treasury Department announced plans to double the size of certain long-term bond buybacks. The move helped push Treasury yields lower and fueled a rebound in risk assets, with Bitcoin rallying more than 23% to a recent high above $81,000.
Strive isn’t alone in ramping up its Bitcoin purchases. Michael Saylor’s Strategy, the world’s largest corporate Bitcoin holder, announced Monday that it had resumed buying BTC for the first time since June, acquiring 4,603 Bitcoin at an average price of $80,318.
The purchase lifted Strategy’s holdings back above 845,000 BTC following four Bitcoin sales since May.
Related: Crypto Biz: Bitcoin pumps, Wall Street does the paperwork
In March, an almost-dead Bitcoin wallet suddenly resurfaced and moved about $1 million worth of BTC through a large centralized custodian—only for nearly the same amount to be sent back three weeks later. Less than two months after that brief “round trip,” the same stash was intentionally destroyed by sending it to an unspendable address.
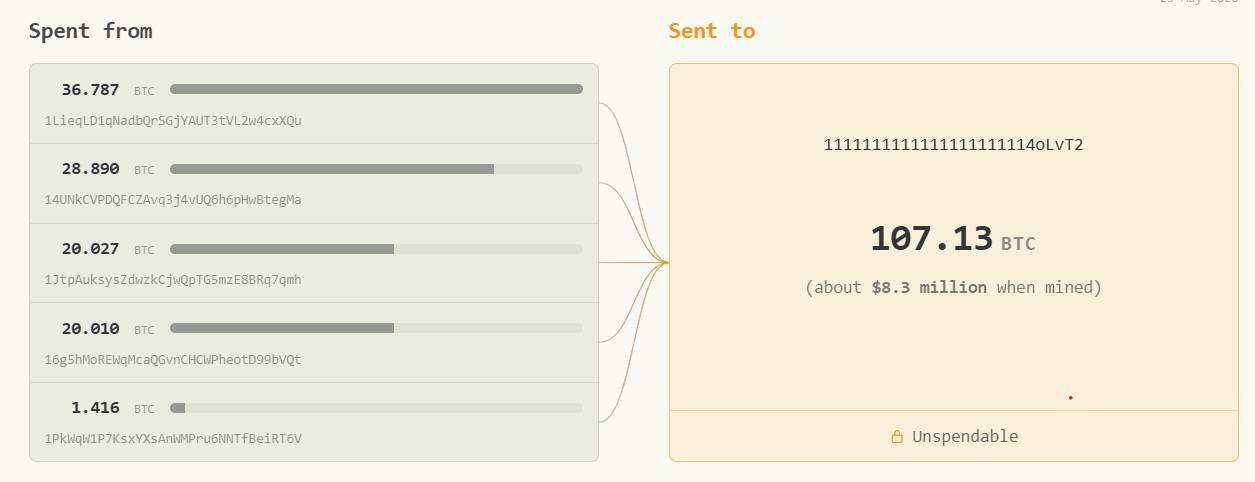
The episode sits within a broader puzzle highlighted by blockchain researchers: multiple BTC-burning transactions in May, totaling 107 BTC (worth roughly $8.5 million at the time). New wallet-cluster analysis suggests the burn-related addresses were likely controlled by the same individual, raising the question of why someone would deliberately destroy coins that represent long-held value.
Key takeaways
- One dormant wallet moved 20.00010537 BTC through an unidentified major custodian and then received 20.00006037 BTC back about three weeks later—an outcome difficult to square with typical trading.
- Five separate wallets later burned their BTC, and Chainalysis reported “strong indicators of common ownership” linking them.
- Most of the funds behind the burn can be traced back to Mt. Gox-era origins, suggesting an early adopter connection.
- Researchers cannot confirm why the coins were destroyed; even CoinShares-class level of onchain forensics can’t determine intent from transaction history alone.
- A possible clue emerges from repeated transfers clustered around similar dollar values (about $10,400), hinting at a planned approach—but not fully explaining the March round trip.
A dormant wallet returns—and immediately interacts with a custodian
Blockchain educator Bennet described a wallet that lay dormant for nearly 12 years before suddenly moving 20.00010537 BTC to “a custodian of some kind,” according to his analysis. Three weeks later, almost the entire balance returned, minus only a very small difference (about $3). Bennet characterized the pattern this way: the full balance went out to what appeared to be an exchange hot wallet and nearly the same amount came back three weeks later; then, seven weeks after the return, the funds were burned.
What makes the sequence notable is its symmetry. Burning is irreversible on-chain, but the “round trip” suggests the private keys behind the dormant wallet were actively used—not merely to let funds sit, but to interact with custodial infrastructure, retrieve the coins, and then choose a terminal outcome.
Bennet’s observation aligns with a timing link to a wider narrative of BTC destruction. Earlier coverage connected the broader mystery to 107 BTC burned in May, described as worth approximately $8.5 million at the time. The March event may be part of the same story, even though the chain of custody is obscured once the coins enter custodian systems.
Chainalysis: the burn wallets point to one controller
Chainalysis analysis, as summarized by Bennet and repeated in the coverage, indicates that five wallets ultimately responsible for destroying BTC show “strong indicators of common ownership.” In other words, the on-chain behavior suggests the same party controlled these addresses at some point.
The wallets were reportedly funded on the same day in April 2014. From there, each address sent BTC to the same deposit address at a large centralized exchange. Researchers also noted a rotational pattern: one address would transmit BTC to the exchange until its activity paused, then another would take over with transactions of similar cadence and dollar-equivalent value.
Chainalysis further reported that most of the funds could be traced back to Mt. Gox, implying an early Bitcoin holder background. While the connection suggests origin, it does not prove the coins were withdrawn directly from Mt. Gox at the time it ceased trading in February 2014—because the five wallets were funded in April. Bennet argued it’s plausible the owner was among those who managed to get their coins out before the collapse.
Equally important: the custodian remains unidentified. Chainalysis confirmed it is a large centralized exchange, but it does not publicly disclose the names of the services it identifies. Bennet’s interpretation is that the deposit address behaves like a static customer address within a custodian—one that doesn’t maintain a meaningful balance itself because deposits are swept and consolidated internally using an omnibus wallet approach. That design makes the coins’ subsequent fate hard to follow on the public blockchain.
The “$10,400” pattern—and why it may still be incomplete
One of the wallets involved in the burn later sent 19.6 BTC in 60 separate transactions to the same custodian between 2022 and 2024, according to the mempool-linked reference in the reporting. The BTC amounts varied widely—from roughly 0.15 BTC to 0.62 BTC—but when translated into dollars at the time of each transfer, the transactions were strikingly consistent.
Specifically, 58 of the 60 transfers were within 10% of approximately $10,400 per transaction. That implies the controller cared more about dollar totals than fixed BTC amounts. Bennet suggested the behavior could reflect a planned liquidation strategy.
However, the pattern has limits. The blockchain cannot prove whether those dollars were realized through a sale, held, or moved onward, because once funds hit a custodian they are mixed with many other inputs and consolidated internally. Researchers also noted that while the payment size was broadly constant, transaction frequency was not; transfers arrived in clusters rather than a perfectly regular automation schedule. Bennet viewed that as more consistent with sending a fixed-dollar amount when conditions required it, rather than a purely automated periodic process.
Still, even if the “$10,400” behavior hints at strategy, it doesn’t close the gap around the March event—particularly the fact that the wallet sent almost exactly the same amount out and got almost the same amount back shortly afterward.
The $1 million “round trip” doesn’t fit a simple trading explanation
After remaining untouched for roughly 12 years, the dormant wallet moved its entire balance of 20.00010537 BTC and received 20.00006037 BTC back—leaving a tiny difference of about 4,500 satoshis (around $3). The returned Bitcoin was split into three transactions of 7 BTC, 7 BTC, and 6.00006037 BTC, sent over three consecutive days.
Bennet argued that the use of round numbers may align with custodial withdrawal limits. More importantly, the coins did not just reappear somewhere else—they returned to the same address that had sent them to the custodian.
The transaction history also suggests the same private key holder controlled the wallet before and after the round trip. Bennet noted that using the BTC in March would have required the private key to authorize the custodian movement, and burning it in May required the key again. That shared key linkage makes the sequence particularly difficult to interpret as a straightforward exchange workflow where funds simply change hands.
The central tension is clear: if the activity were primarily about trading or liquidation, the near-identical “go out, come back” outcome appears unusually tight, especially given the custodial mixing that otherwise obscures on-chain details.
So what was the point of a deliberate burn?
Multiple explanations have been floated, but the available evidence doesn’t neatly select one. The liquidation theory helps rationalize earlier patterns—especially the “$10,400” clustering and the apparent rotational funding to the same custodian—but it does not readily explain why the controller would send roughly $1 million through the same infrastructure in March and then retrieve virtually all of it.
One alternative possibility is that the controller was testing an old custody setup or wallet—verifying that after a long dormancy, coins could still be moved through a major custodian and returned successfully. Yet that still leaves the subsequent decision to destroy the BTC.
Tax or compliance narratives could also be imaginable: someone might reorganize assets through recognized custody channels for record-keeping. But the reporting notes there is no evidence tying these actions to any specific regulatory or tax event.
Privacy is another candidate. Sending BTC through a custodian that sweeps deposits into an omnibus wallet can make on-chain tracing more difficult after the point of deposit. Still, privacy alone doesn’t clarify why the coins later ended up burned rather than merely secured.
Bennet also suggested a more personal motive: someone without heirs might have chosen to permanently reduce Bitcoin’s circulating supply by burning rather than destroying private keys. He also emphasized that this hypothesis is not provable purely via blockchain analysis.
Chainalysis, as cited in the coverage, effectively summed up the current limitation: it does not have a clear explanation for why the owner would move a long-dormant stash through a custodian, retrieve roughly the same amount, and then burn it deliberately.
In other words, the blockchain records the “what” with unusual clarity, but not the “why.”
The next thing to watch is whether more tracing work identifies the custodian involved in the March round trip and in the May burn-linked transfers, or whether additional wallet-cluster research finds consistent behavioral links across other dormant-to-active Bitcoin movements. Without that, the most important unknown remains intent—and intent is the one variable onchain forensics can’t conclusively measure.


The deal adds transfer-agent and settlement infrastructure to ICE’s plans for an NYSE-affiliated market for tokenized stocks, tZERO said.
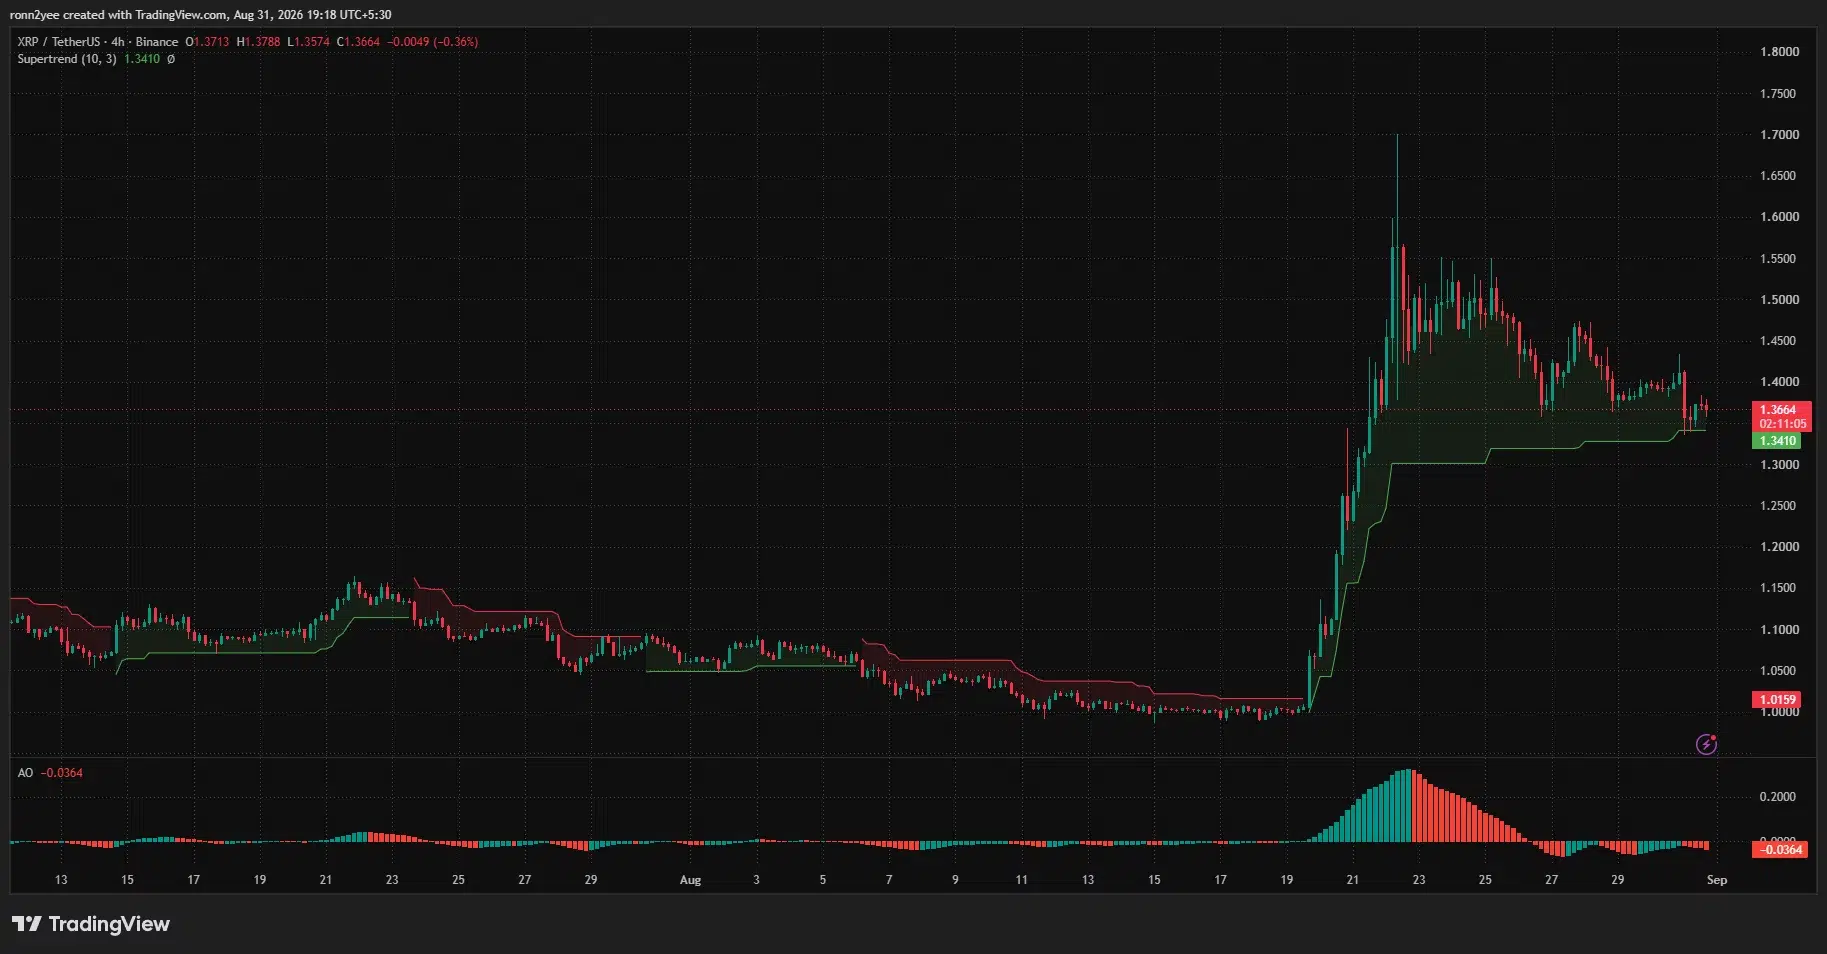
XRP price traded near $1.36 on Aug. 31 after falling roughly 7% over seven days, as fading momentum and leveraged position unwinding offset record weekly demand from U.S. spot exchange-traded funds.
Summary
- XRP price retreated from $1.48 to $1.36 but remained above its 4-hour Supertrend support at $1.341.
- U.S. spot XRP ETFs attracted $110.49 million during their strongest inflow week of 2026.
- CoinGlass data shows major liquidation concentrations near $1.35, $1.38, and between $1.44 and $1.50.
- A break below $1.34 could expose $1.28, while reclaiming $1.40 would improve the recovery setup.
XRP price pulls back 7% after August rally
According to data from crypto.news, XRP (XRP) price was trading around $1.36 on Aug. 31 at the time of writing. The token had declined from approximately $1.48 over the previous seven days, leaving it down about 7% for the period.
The pullback followed a rapid recovery from an August low near $0.98. XRP gained more than 30% during the month and briefly reached $1.70 on Aug. 22 before sellers rejected the move. Price then formed a series of lower highs below $1.55, $1.50, and $1.45.
XRP’s 4-hour chart shows that the latest decline brought the token back toward a support area that formed during the initial breakout. The Supertrend indicator remained bullish at $1.341, placing its active support slightly below the market price.
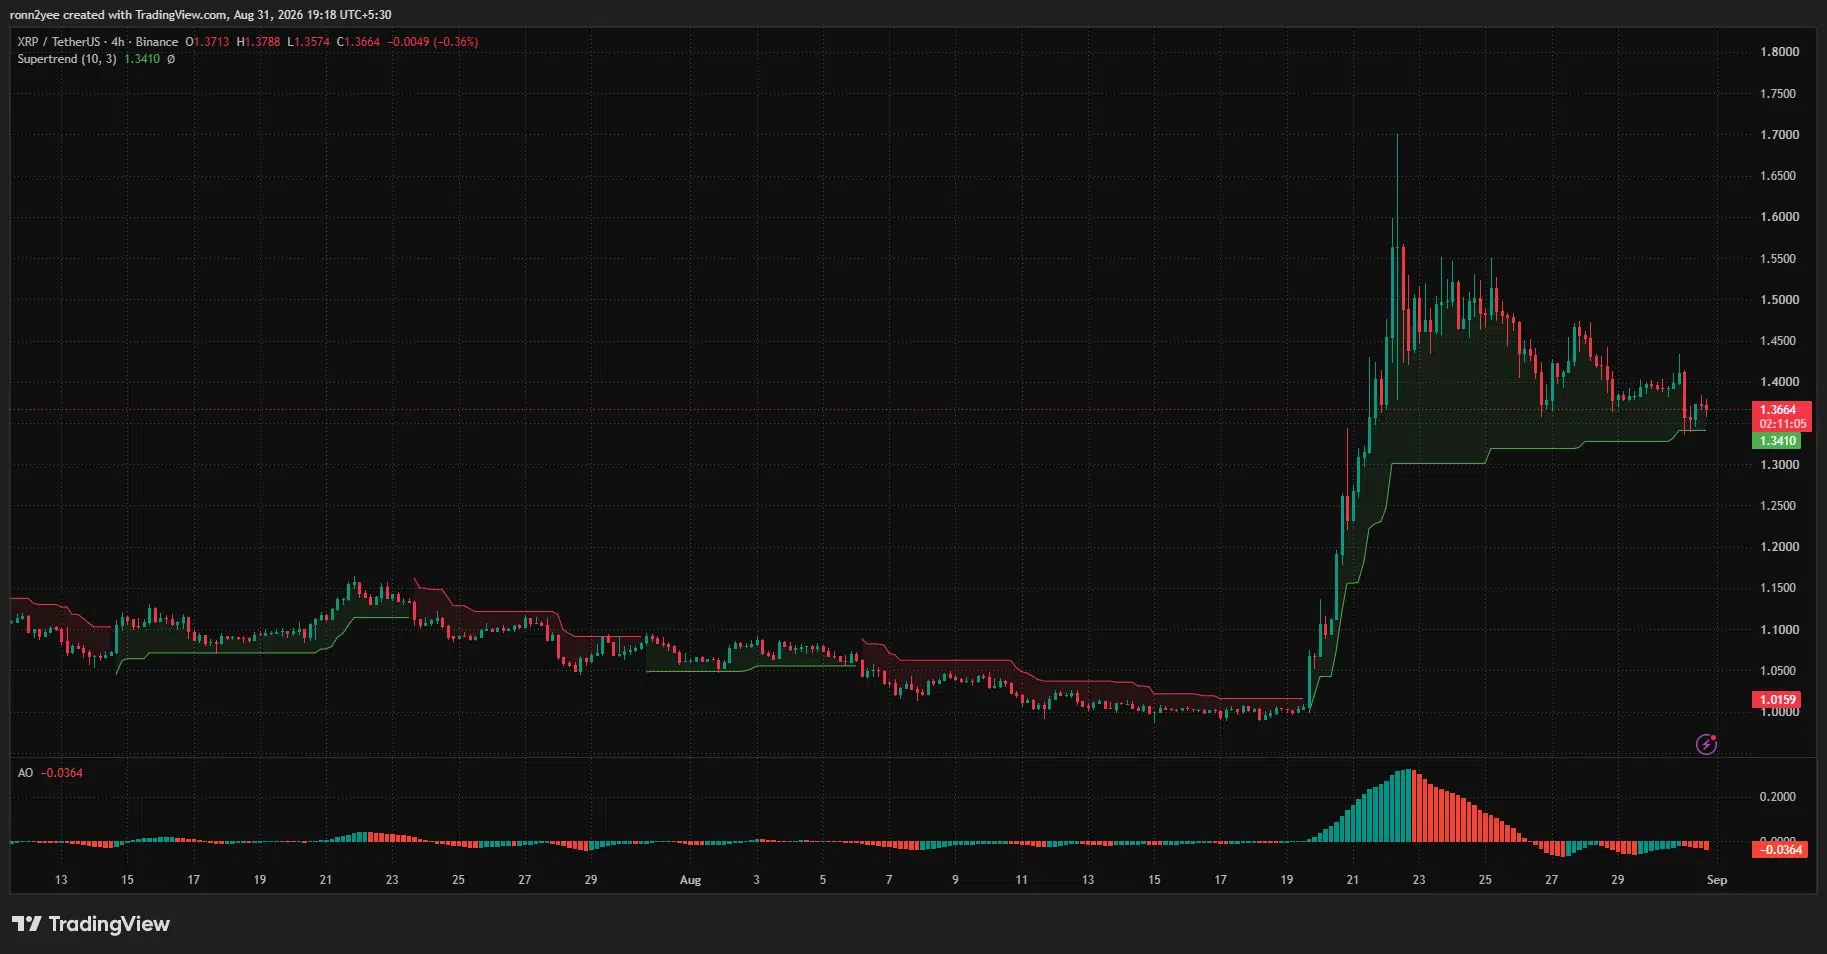
However, the Awesome Oscillator registered a negative reading of -0.0364. Its histogram also stayed below zero, indicating that short-term bearish momentum had not fully cleared despite XRP’s attempt to stabilize above $1.35.
The combination leaves XRP at a decision point. Holding $1.34–$1.35 would preserve the higher trading range created by the August rally, while a confirmed 4-hour close below it could weaken the remaining bullish structure.
ETF inflows counter XRP derivatives reset
U.S. spot XRP ETFs recorded $110.49 million in net inflows during the week ending Aug. 28, according to data from SoSoValue. It was their strongest weekly result of 2026.
The funds held about $1.44 billion in net assets after the inflows, while cumulative net inflows reached approximately $1.66 billion. The demand created a contrast between institutional fund flows and XRP’s falling market price.
Derivatives traders took a more defensive position. Aggregate XRP futures open interest had climbed to approximately $2.73 billion earlier in August, its highest level since October, as leveraged traders positioned for a larger move.
Price and open interest later declined together as XRP retreated from the $1.48–$1.50 resistance zone. Such a combination generally points to traders closing existing positions rather than building an aggressive new short position, although open-interest changes alone cannot identify every trader’s direction.
The reset reduced some of the leverage accumulated during the rally. It did not, however, produce enough spot buying to return XRP above $1.40 before the end of the month.
XRP liquidation map identifies the next price magnets
The one-week CoinGlass liquidation heatmap places the largest nearby liquidity concentrations around $1.35 and $1.38. XRP tested both areas during the Aug. 31 decline and was trading between them when the chart was captured.
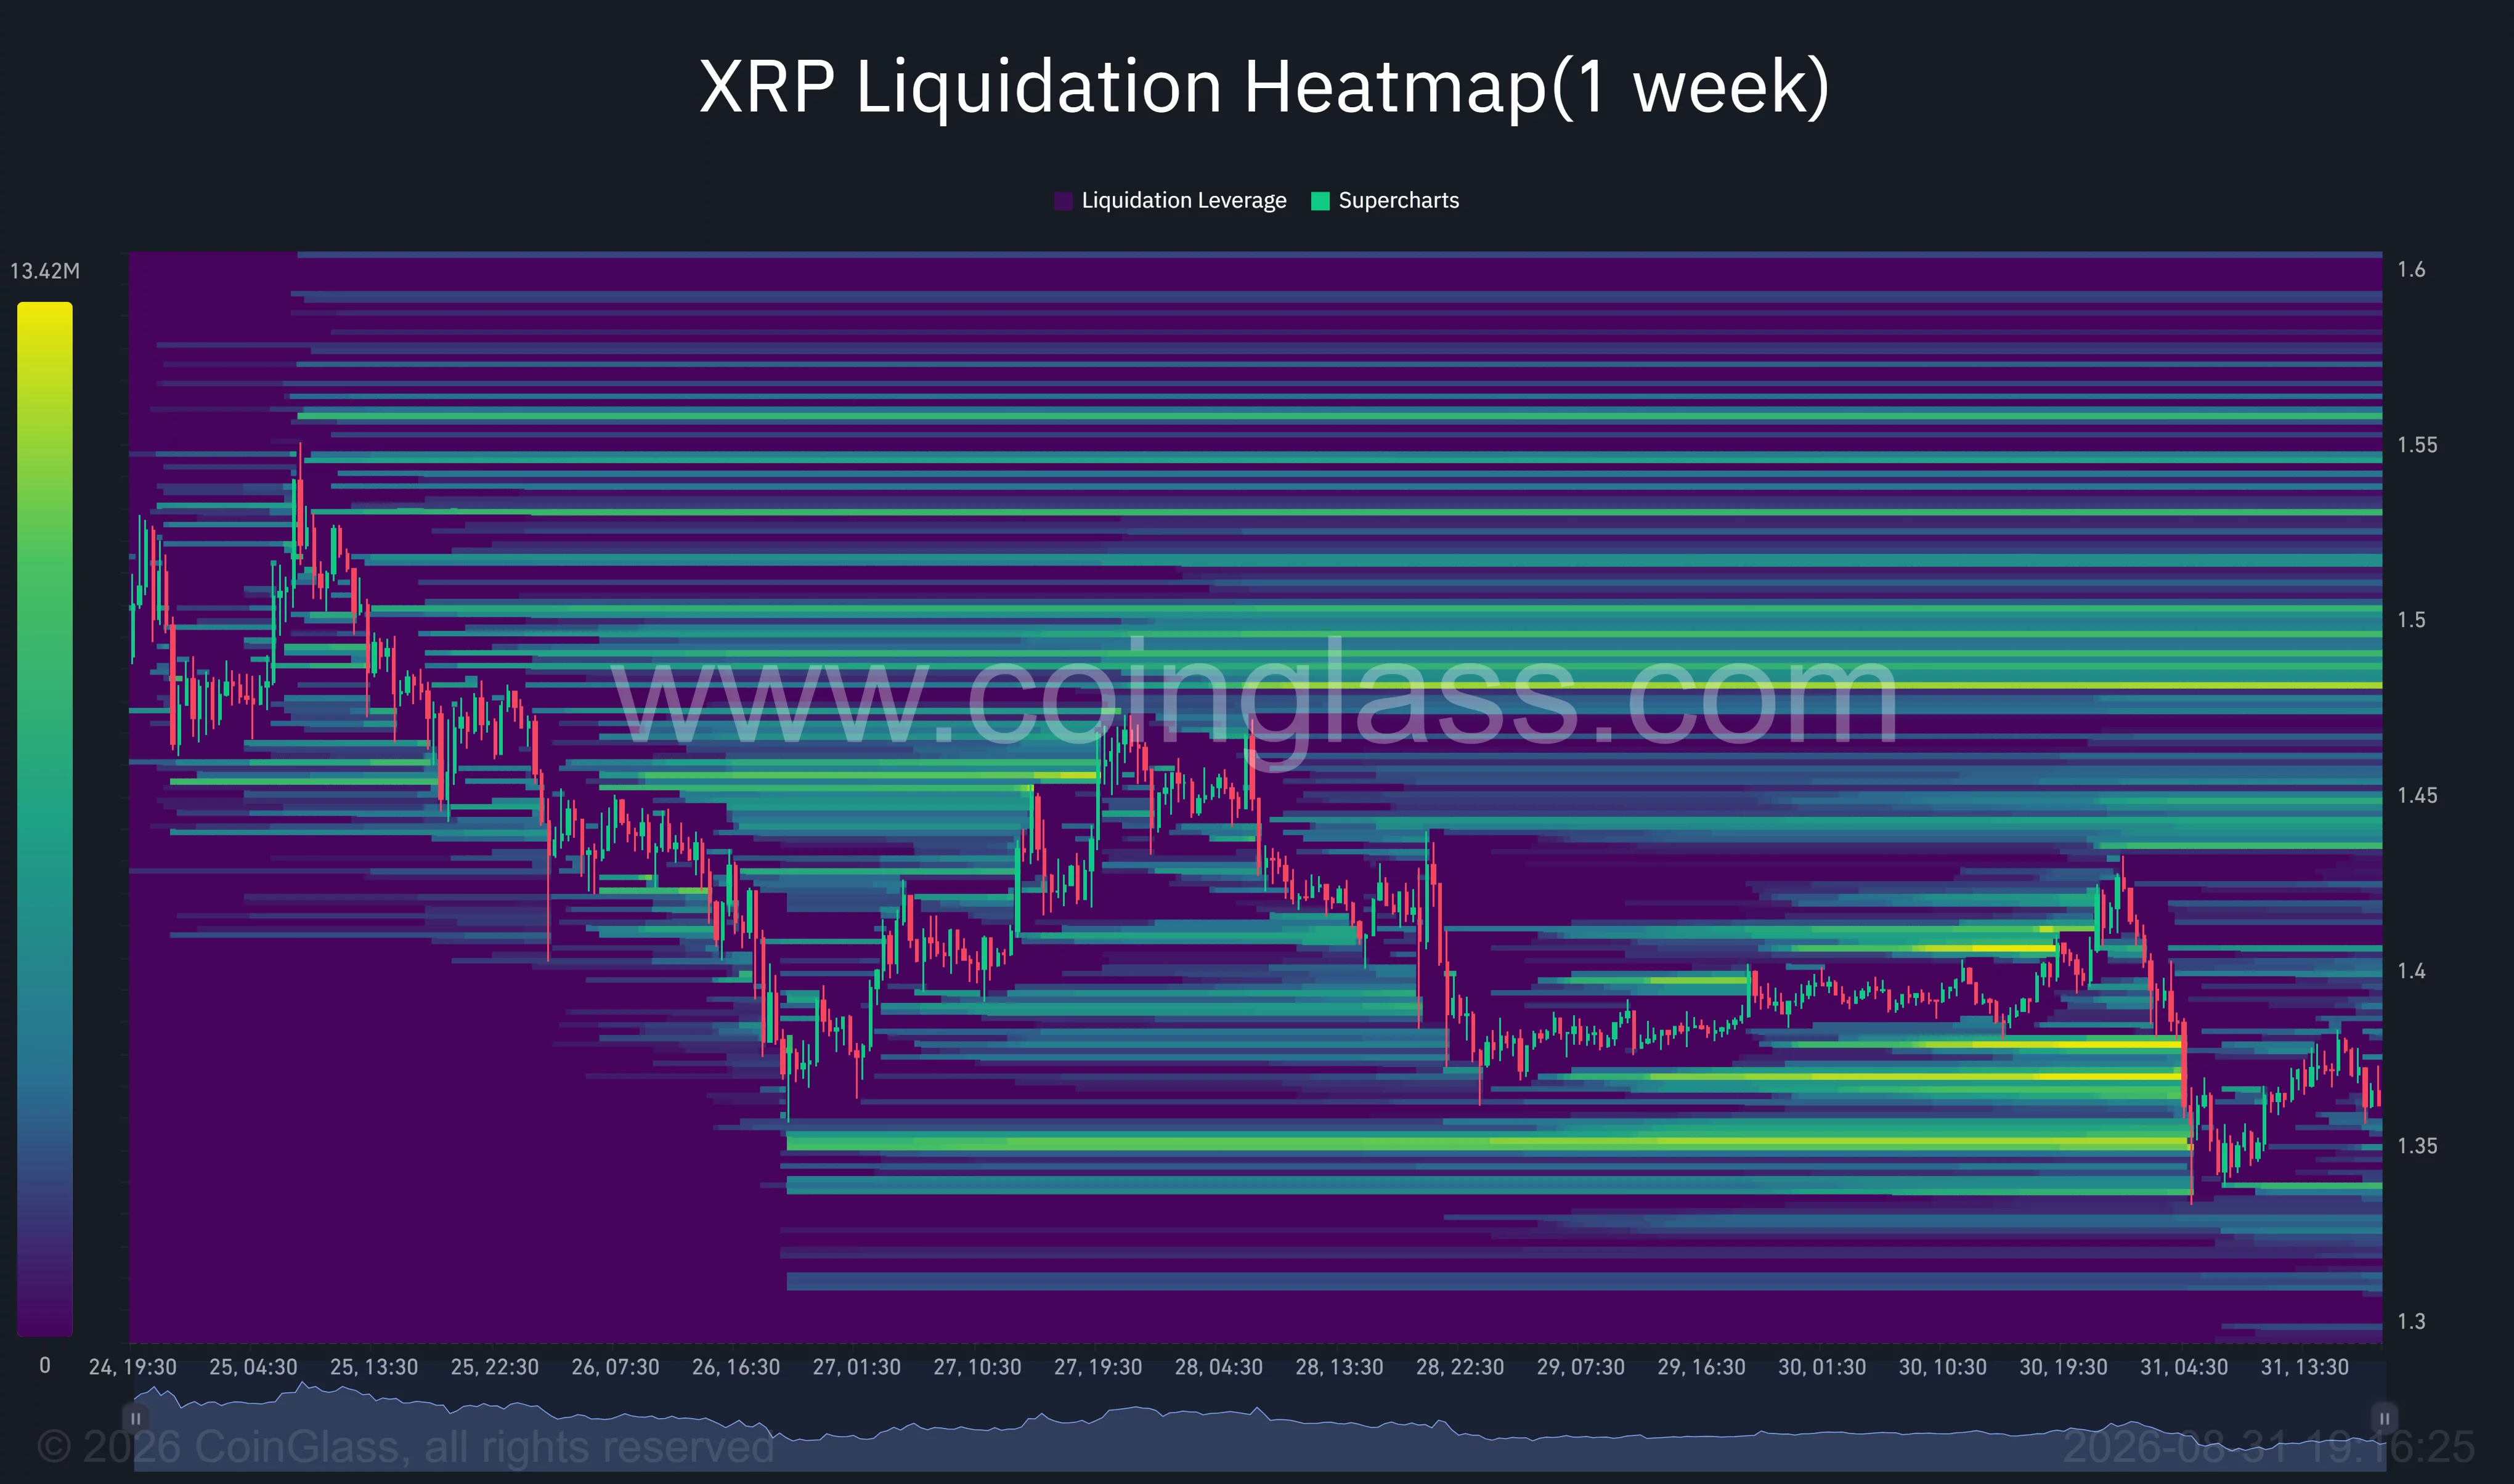
A concentrated band around $1.35 could attract further price movement if sellers retest the weekly low. Losing that level would place the next visible liquidity pockets near $1.33 and $1.30.
Liquidity also remains stacked above the market. The first meaningful overhead cluster appears near $1.40–$1.42, followed by a broader concentration between $1.44 and $1.45. Larger liquidation bands extend toward $1.48–$1.50.
Those zones could accelerate a rebound if XRP moves higher and forces leveraged short positions to close. They can also act as resistance because traders may use the same levels to exit positions.
The daily chart provides a more constructive signal. Chaikin Money Flow stood at 0.09, keeping the indicator above zero and pointing to net buying pressure over its 20-day measurement period. The positive reading suggests capital has not fully left the market despite the weekly price decline.
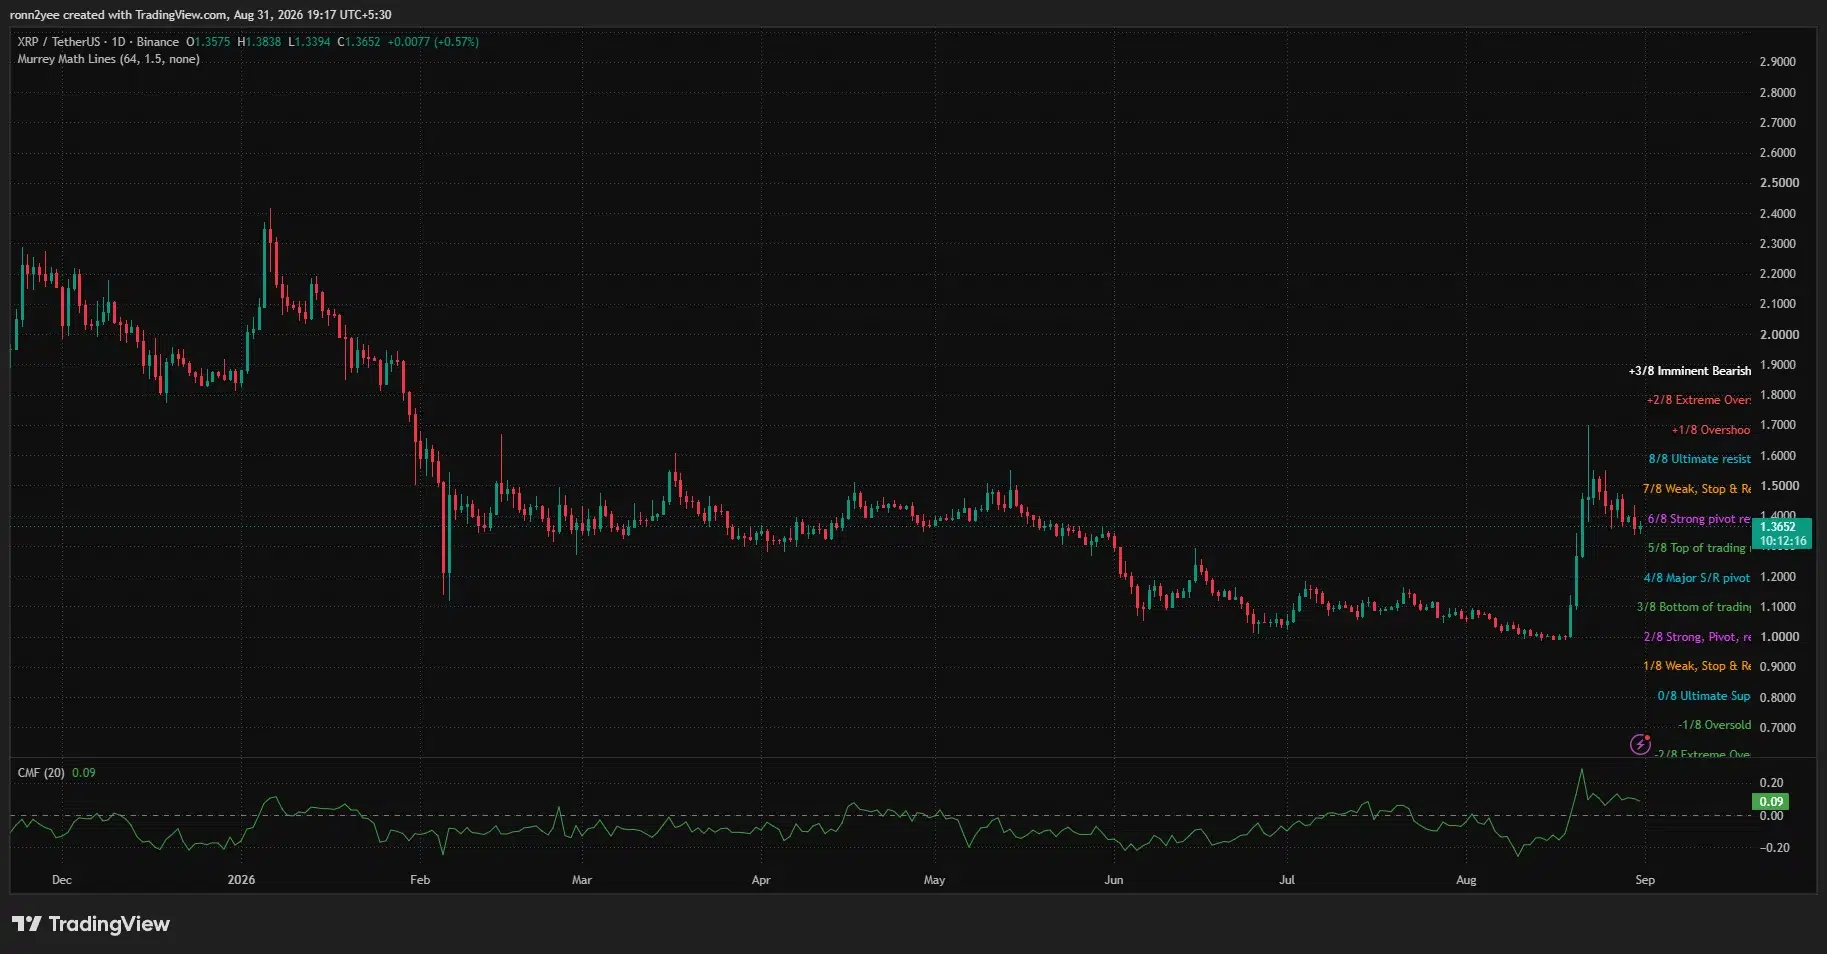
XRP nevertheless remained close to the daily Murrey Math pivot near $1.40. A daily recovery above that level would open a path toward $1.50 and the chart’s $1.60 resistance. Failure to reclaim it would leave the token exposed to another test of the lower trading range.
XRP support at $1.28 becomes the main downside test
Chart analyst ChartNerd said XRP had failed to reclaim its 50-week exponential moving average for a second consecutive week. The analyst placed that average near $1.53 and identified the 20-week EMA around $1.27 as the next short-term support floor.
The weekly rejection adds weight to the $1.48–$1.53 resistance range. A break above the zone would invalidate the present series of lower highs and allow buyers to target $1.60, followed by the August wick near $1.70.
On the downside, the 4-hour Supertrend at $1.341 offers the first line of support. A decisive break could send XRP toward $1.30 and the weekly 20 EMA near $1.27–$1.28. The bullish August recovery would become more vulnerable if the price closes below that moving average.
Ripple’s scheduled escrow release adds another short-term consideration. The company’s monthly system is set to unlock 1 billion XRP on Sept. 1, although Ripple has historically returned a large share of the released tokens to escrow. The scheduled release does not mean the full amount will enter the open market at once.
CLARITY Act vote adds a US policy catalyst
The U.S. Senate is expected to hold a procedural vote on the CLARITY Act on Sept. 15. The vote would test whether supporters can secure the 60 votes required to advance the market-structure legislation.
The vote is not final passage, and no signed law is scheduled for Sept. 15. Its outcome could still affect sentiment toward U.S.-traded digital assets because the proposal seeks to clarify federal oversight of crypto markets.
For XRP, the immediate technical range remains more important. Buyers must protect $1.34–$1.35 and reclaim $1.40 to shift short-term momentum. Losing the lower boundary would increase the risk of a deeper correction toward $1.28, while a move above $1.50 would put the August recovery back in control.
Disclosure: This article does not represent investment advice. The content and materials featured on this page are for educational purposes only.
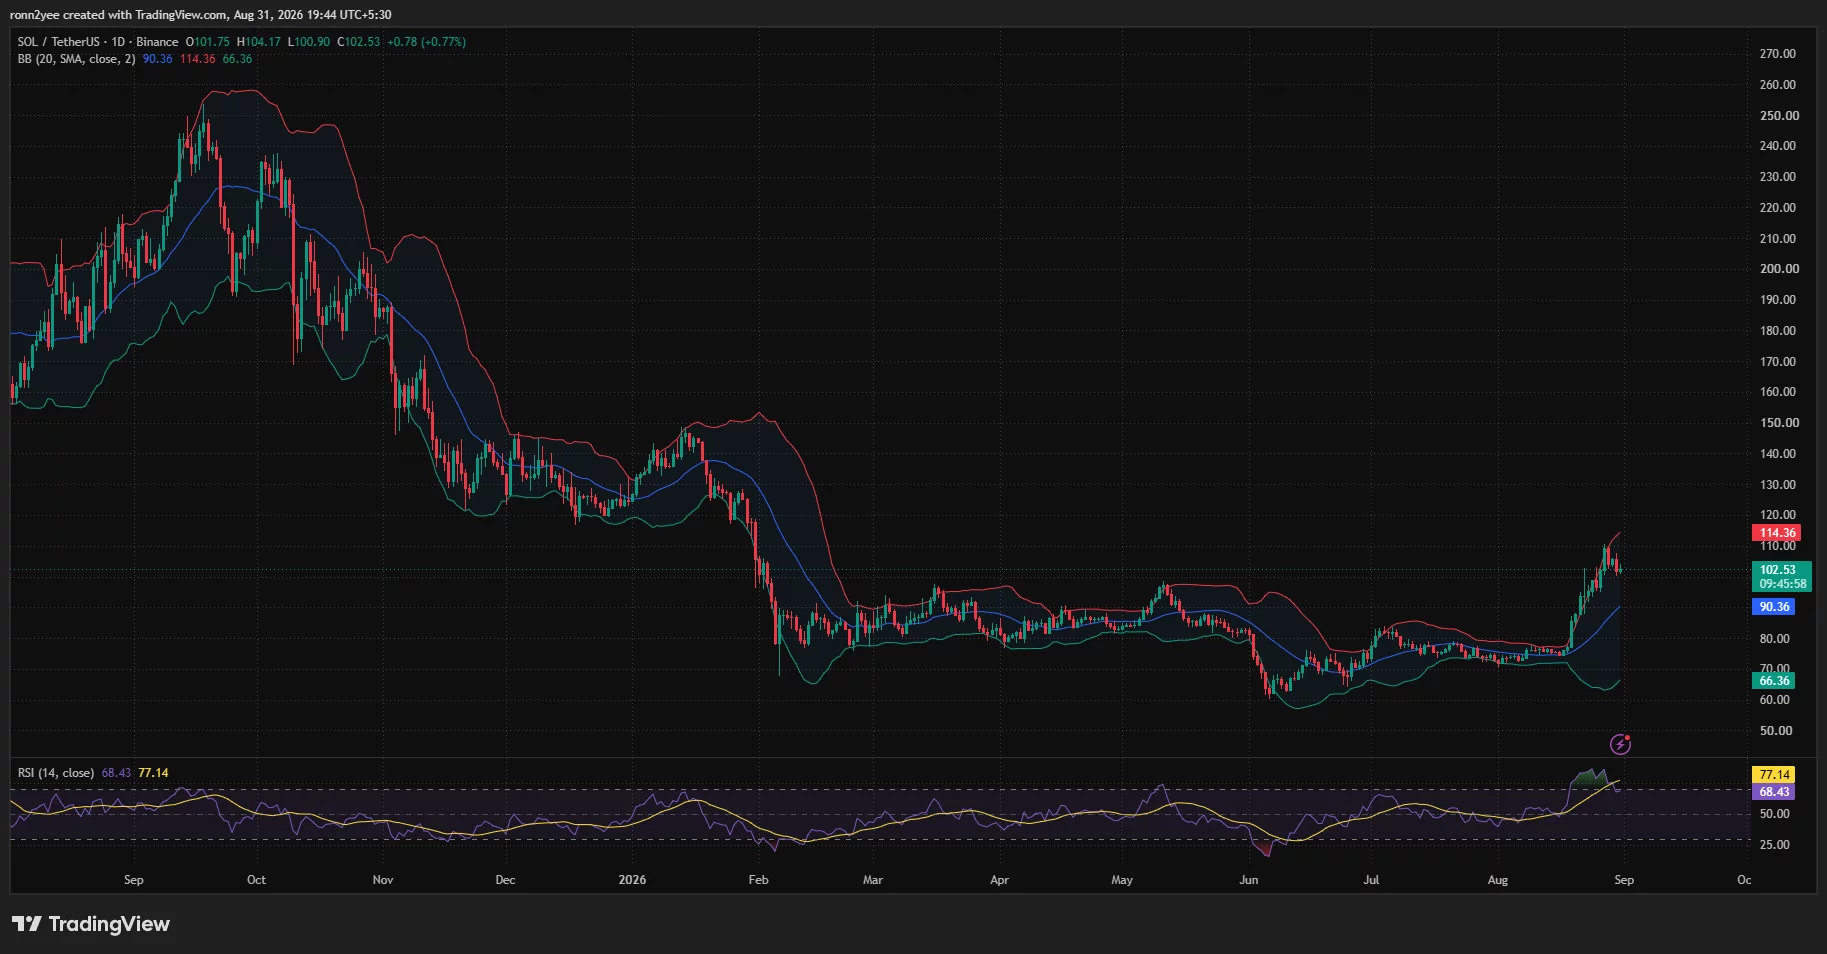
Solana price traded near $102.50 on Aug. 31 after retreating from a weekly high of $110.04, but its daily and 4-hour charts show that the broader August breakout remains intact above $100.
Summary
- Solana price gained 4.2% from Aug. 25 through Aug. 31 despite falling 6.8% from its weekly high.
- Daily RSI cooled to 68.43 after moving above 70 during the late-August rally.
- 4-hour Supertrend support sits at $100.95, making $100 the main short-term level for bulls.
- Liquidation clusters near $100.50 and $104–$105 could amplify Solana’s next move.
Solana price cools after reaching $110
According to data from crypto.news, Solana (SOL) price opened Aug. 25 at $98.56 and rose to an intraday high of $110.04 on Aug. 27, producing an 11.6% advance in less than three days. Its price subsequently pulled back to around $102.50 on Aug. 31, reducing the weekly gain to roughly 4.2%.
The retreat followed a much larger recovery from Solana’s early-August low near $71. From that level to the weekly peak, SOL gained approximately 55%, leaving the token vulnerable to profit-taking as traders approached the end of the month.
Solana’s daily chart shows that the rally pushed the price above the upper Bollinger Band before sellers emerged near $110. The token remained above the indicator’s middle band at $90.36, while the upper and lower bands stood at $114.36 and $66.36, respectively.
A move beyond the upper band often reflects strong momentum, but it can also indicate that price has advanced faster than its recent volatility range. SOL’s return inside the band therefore points to cooling momentum after the breakout rather than confirmation of a broader bearish reversal.
The daily Relative Strength Index supports that reading. RSI reached overbought territory during the rally but had fallen to 68.43 by Aug. 31. Its moving average remained higher at 77.14, showing that momentum was easing after the rapid advance.
The $100 level is Solana’s immediate technical test
Solana’s 4-hour chart places the Supertrend support at $100.95, just below the market price. SOL has remained above the indicator since its breakout from the mid-$70 range, and the Supertrend has continued to signal an upward short-term structure.
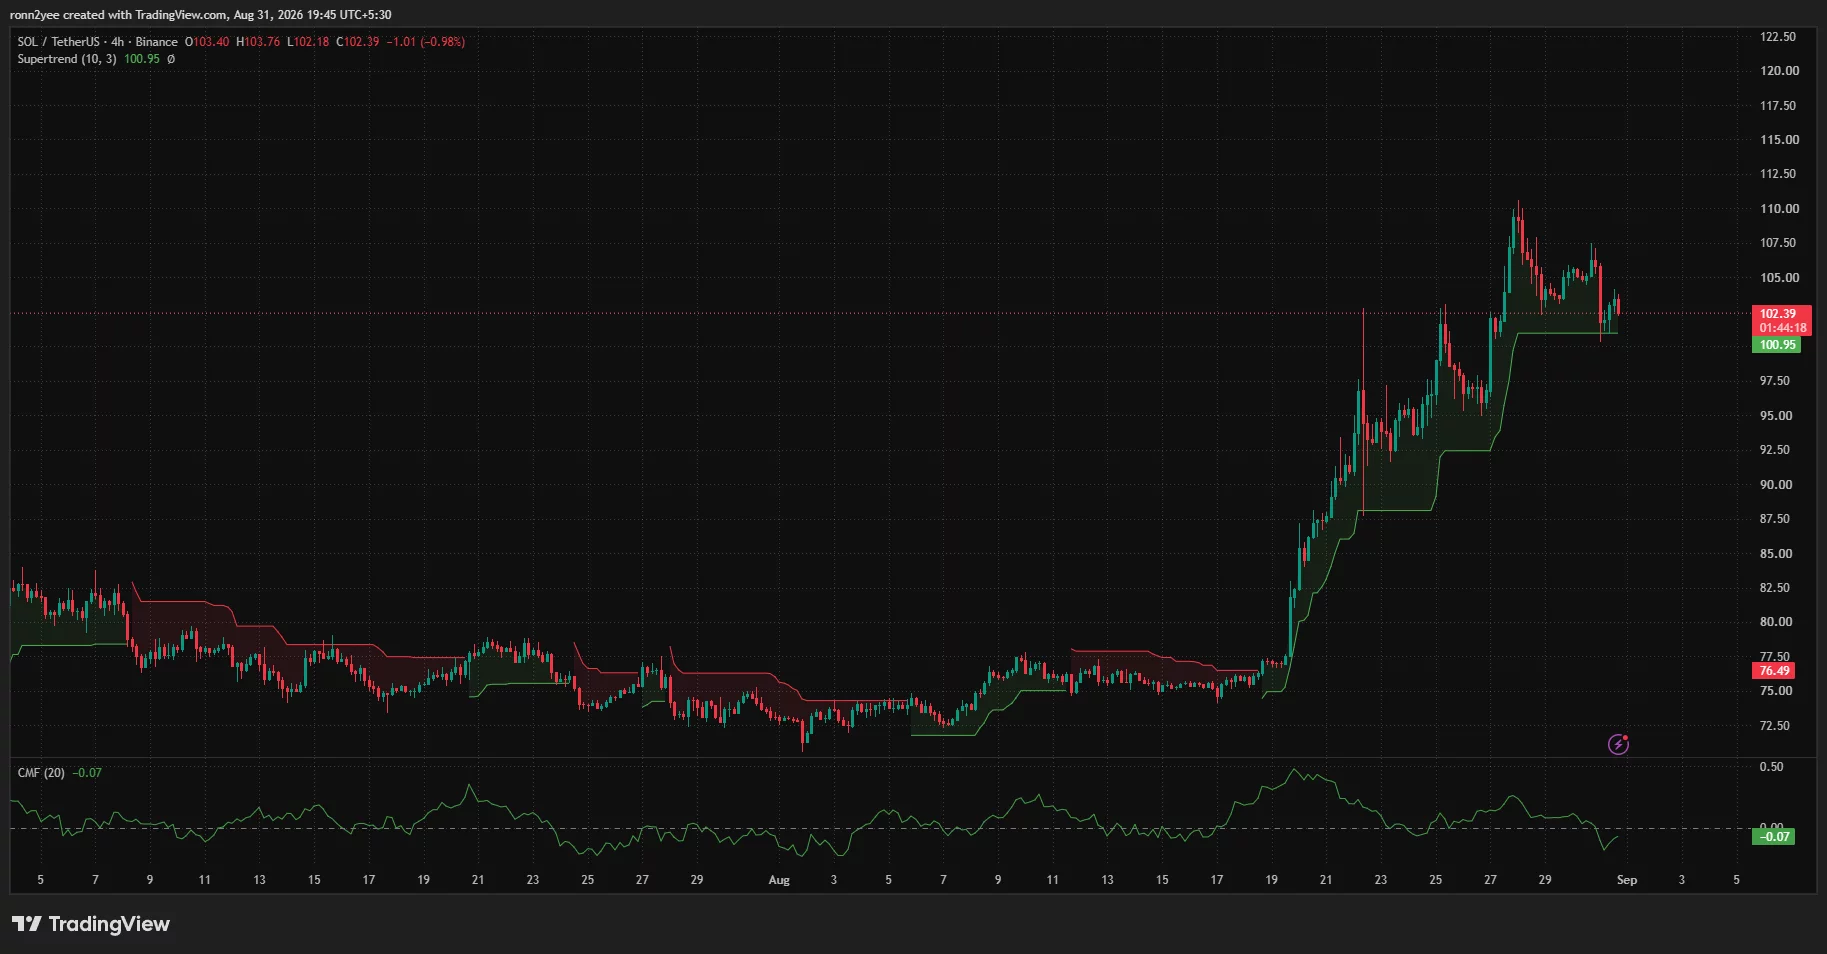
The position leaves the $100–$101 area as the first line of defense. A sustained close below that range would weaken the 4-hour setup and could send the price toward $97.50, followed by the previous breakout region between $92 and $95.
Selling pressure has already started to appear in the Chaikin Money Flow indicator. 4-hour CMF stood at minus 0.07, showing that capital flow had shifted slightly negative as SOL retreated from $110.
The reading is not deeply bearish, but it indicates that buyers have yet to regain the strength seen during the breakout. A CMF recovery above zero, combined with SOL holding over $100.95, would provide firmer evidence that the pullback has run its course.
On the upside, initial resistance lies between $104 and $105, where several recent rebounds stalled. Clearing that area would expose $107.50 and the Aug. 27 high at $110.04. A daily close above $110 could then bring the upper Bollinger Band near $114.36 into focus.
Liquidation map puts SOL between two leverage zones
CoinGlass’ 24-hour liquidation heatmap shows Solana trading between concentrated leverage levels on both sides of its price.
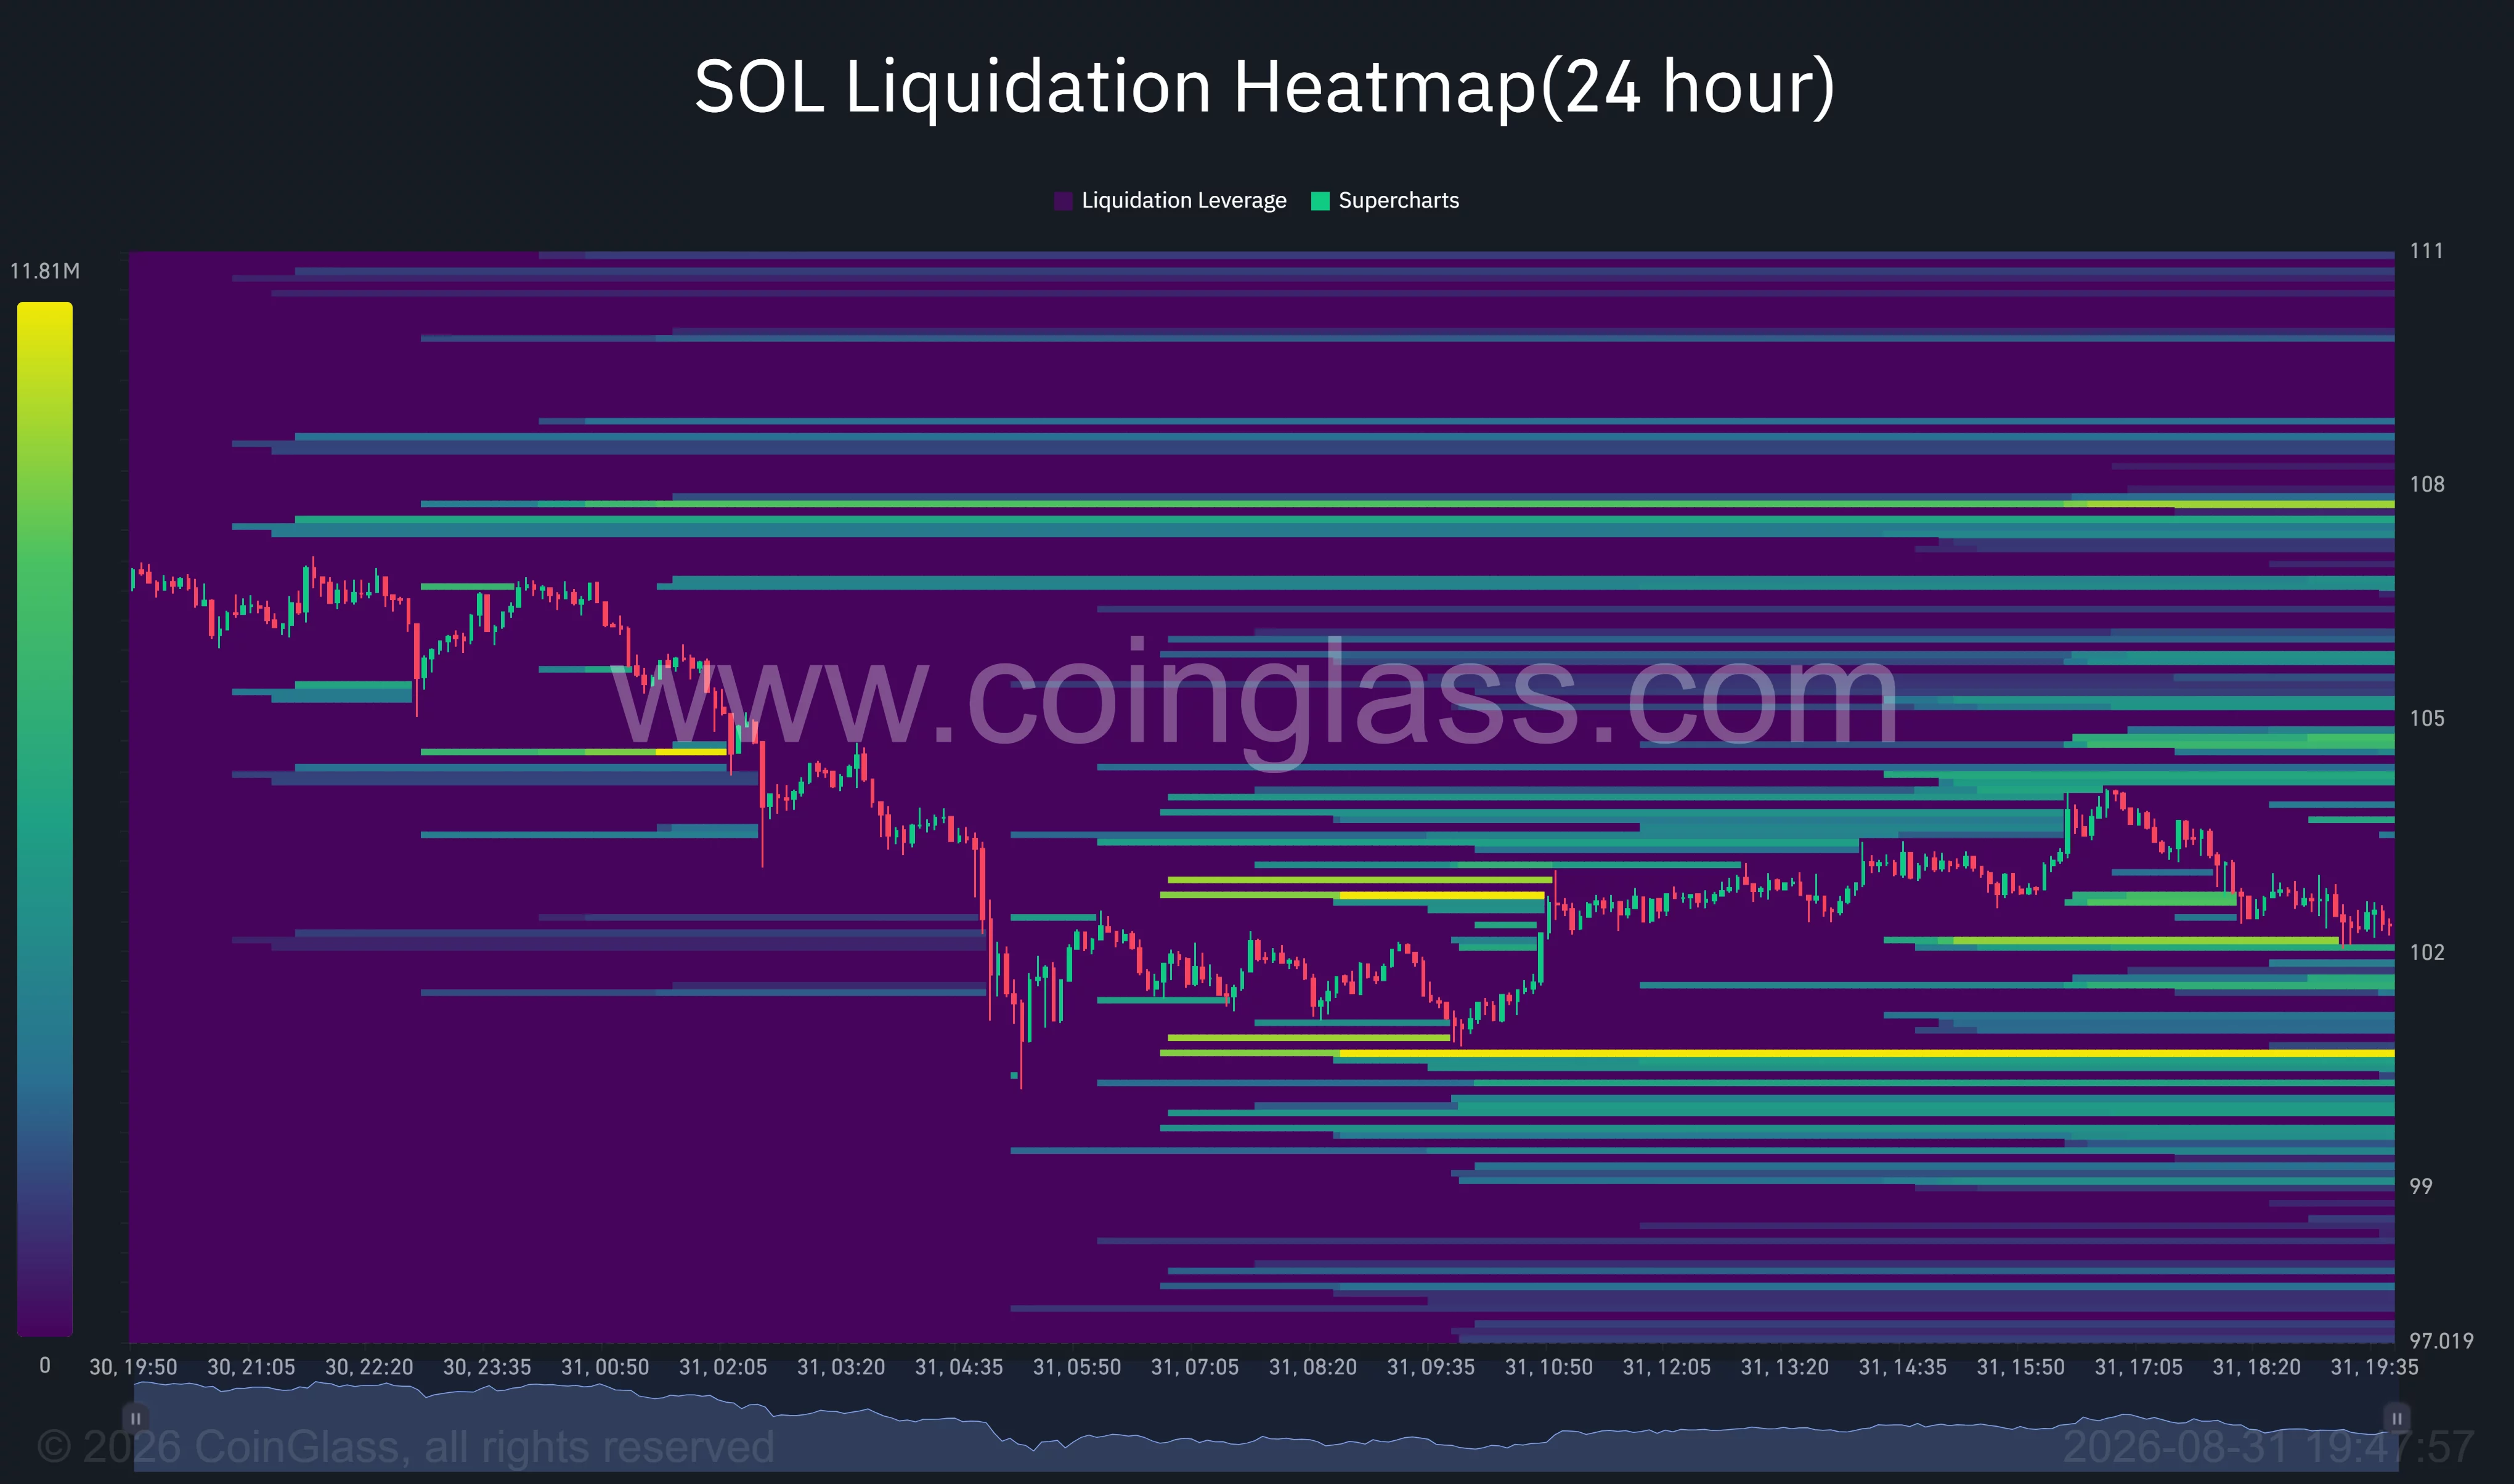
The strongest nearby downside cluster appears around $100.50–$101. A drop into that zone could trigger leveraged-long liquidations, potentially accelerating a break below the 4-hour Supertrend support.
Additional liquidity is visible below $100, particularly around $99 and $97.50. Those levels could become relevant if sellers force a decisive loss of the psychological $100 mark.
Above the market, liquidation concentrations appear near $104–$105, followed by larger clusters around $107.50–$108. A rebound through those areas could force short positions to close and add momentum to another attempt at $110.
The heatmap does not predict which side will be reached first. It instead identifies areas where leveraged positions are concentrated, meaning price volatility may increase if SOL moves into either cluster.
Analyst sees a larger Solana breakout forming
Analyst Gerla said on Aug. 31 that Solana had broken a downtrend that had lasted for roughly one year and was beginning to establish a higher-low structure.
“If this reaccumulation holds, I’m watching the $100 area first, then $300+ as the next major expansion zone.”
The chart shared by Gerla treats $100 as the base of a longer-term recovery rather than an immediate upside target. Her projection requires SOL to hold its reclaimed range and continue forming higher highs and higher lows over a much longer period.
The $300 target remains speculative and sits far above the levels shown by the current daily indicators. Before such a scenario becomes relevant, SOL would need to reclaim $110, break the daily upper Bollinger Band near $114, and overcome several resistance zones left by its decline from the 2025 peak.
For the short term, the charts present a narrower decision range. Holding $100.95 would preserve the 4-hour Supertrend signal and keep $105, $107.50, and $110 in play. Losing $100 on strong selling pressure would invalidate the immediate bullish setup and raise the risk of a deeper retracement toward $97.50 or $92–$95.
US traders may also watch demand through US-listed Solana investment products and any progress on federal crypto market-structure legislation. However, the next directional move will likely depend first on whether spot buyers defend $100 as leveraged positions unwind around the monthly close.
Disclosure: This article does not represent investment advice. The content and materials featured on this page are for educational purposes only.
Crypto World
Ethereum Price Prediction: What’s Next for ETH After Massive Rally From $1.9K to $2.5K?
Ethereum is consolidating after a sharp breakout from the $1.9K area, with ETH currently trading below $2.5K. The technical structure has improved considerably, while the continued decline in exchange reserves provides a supportive backdrop.
However, ETH’s $2.5K resistance zone is a meaningful one, and a breakout or rejection from this level is key to determining whether the recovery can extend or the recent price surge was just a bull trap.
Ethereum Price Analysis: The Daily Chart
The daily chart shows a significant structural improvement over the past several weeks. ETH broke above the descending channel that had contained the price throughout the past few months, subsequently reclaiming the $1.9K region and then accelerating sharply higher.
The breakout also pushed ETH through the $2.1K resistance zone before the asset surged toward the current $2.5K area. The move also brought ETH above both the 100-day (~$1.9K) and 200-day (~$2.05K) major moving averages. These moving averages are also now sloping upward, which suggests that the broader bearish structure is losing momentum and a structural bullish shift might be occurring.
As already mentioned, ETH is now trading inside a resistance zone around $2.45K-$2.55K. This area has repeatedly attracted selling pressure in recent sessions, with several candles failing to establish a decisive breakout above $2.5K. A daily close above this region would strengthen the bullish continuation scenario and could expose the next major resistance around $3K and potentially higher.
On the downside, the first important support is around $2.1K. This zone is particularly significant because it previously acted as resistance and was decisively reclaimed during the latest rally. A pullback that holds this area would therefore keep the bullish breakout structure intact.
Below it, the $1.9K zone represents another important support region and serves as the initial point of the breakout. Therefore, a sustained move back below it would weaken the current bullish structure and raise the risk that the recent breakout was just a failed recovery preceding a deeper decline.

ETH/USDT 4-Hour Chart
The 4-hour chart provides a clearer view of August’s price action and the current consolidation. Following the vertical breakout from $1.9K, ETH initially pushed above $2.3K and continued toward $2.5K. Since then, the price has been moving sideways within a relatively tight range, with the $2.5K level acting as the upper boundary.
This consolidation can be interpreted constructively as long as ETH continues to hold the higher levels established during the breakout. The market is effectively digesting a very aggressive upward move rather than immediately giving back the entire rally.
Therefore, the immediate resistance remains around $2.5K. A decisive 4-hour breakout and sustained trading above this zone would provide confirmation that buyers are regaining control and could open the way toward higher daily-chart resistance.
Looking below, the first notable support lies around $2.2K-$2.3K. This zone coincides with a bullish order block, where the latest acceleration higher began, and could therefore attract buyers if ETH undergoes a deeper retracement.
The next support is around $2.05K-$2.1K, and holding this area would be particularly important, as a drop below it would also lead to a decline below the $2K psychological level and could quickly damage market sentiment.
Meanwhile, the 4-hour RSI has pulled back from overbought territory and is hovering around 50. This is consistent with a cooling-off phase following the breakout rather than an outright momentum breakdown. A renewed move above the $2.5K area while RSI expands again would strengthen the continuation setup, but this scenario will likely materialize after further consolidation or correction, as the market seems over-extended in the short-term.

Sentiment Analysis
The exchange-reserve chart provides a notably constructive signal for Ethereum. ETH held on exchanges has declined steadily from above 21M ETH in 2025 to approximately 14.9M ETH at the latest reading shown on the chart. The decline has even become steeper over the past couple of months.
At the same time, ETH’s price has recovered from $1.5K to approximately $2.4K. The divergence is important because the declining exchange reserve suggests that a smaller quantity of ETH is sitting on exchanges and potentially immediately available for selling. While exchange reserves alone cannot determine future price direction, sustained withdrawals can reduce readily available sell-side supply if the trend reflects longer-term accumulation or movement into self-custody and other non-exchange venues.
The chart also shows that the decline in exchange reserves has persisted even through periods of significant price volatility. This makes the current supply-side backdrop more constructive than if reserves were rising alongside the latest rally.
As a result, the technical and on-chain pictures are currently aligned. ETH has broken its longer-term descending trend, reclaimed the key $2K area, and is consolidating near the next resistance while exchange reserves continue to fall. This shrinking supply might just need a slight demand push from the spot or the futures market to result in a breakout and a further rally.

The post Ethereum Price Prediction: What’s Next for ETH After Massive Rally From $1.9K to $2.5K? appeared first on CryptoPotato.
In March, someone moved $1 million worth of Bitcoin through a large crypto custodian. Three weeks later, almost exactly the same amount came back. Incredibly, less than two months after that, the Bitcoin was deliberately destroyed.
The wallet had been dormant for almost 12 years before it suddenly sprang back to life. Bitcoin educator Bennet noted it sent 20.00010537 BTC to “a custodian of some kind” before receiving it back again (minus $3 or so).
“The whole balance went out to what looks like an exchange hot wallet, and almost exactly the same amount came back three weeks later. Seven weeks after that, it was burned.”
The mystery BTC transaction is part of a wider enigma surrounding 107 BTC burned in May, worth roughly $8.5 million at the time.
New blockchain analysis shows that five wallets that ultimately destroyed their Bitcoin appear to have been controlled by the same person. It was likely an early Bitcoin holder who had funds on the collapsed Mt. Gox exchange.
But why on earth would anyone deliberately destroy millions of dollars worth of Bitcoin?
The BTC wallets behind the burn
The five addresses that eventually sent their Bitcoin to an unspendable address show “strong indicators of common ownership” according to Chainalysis.
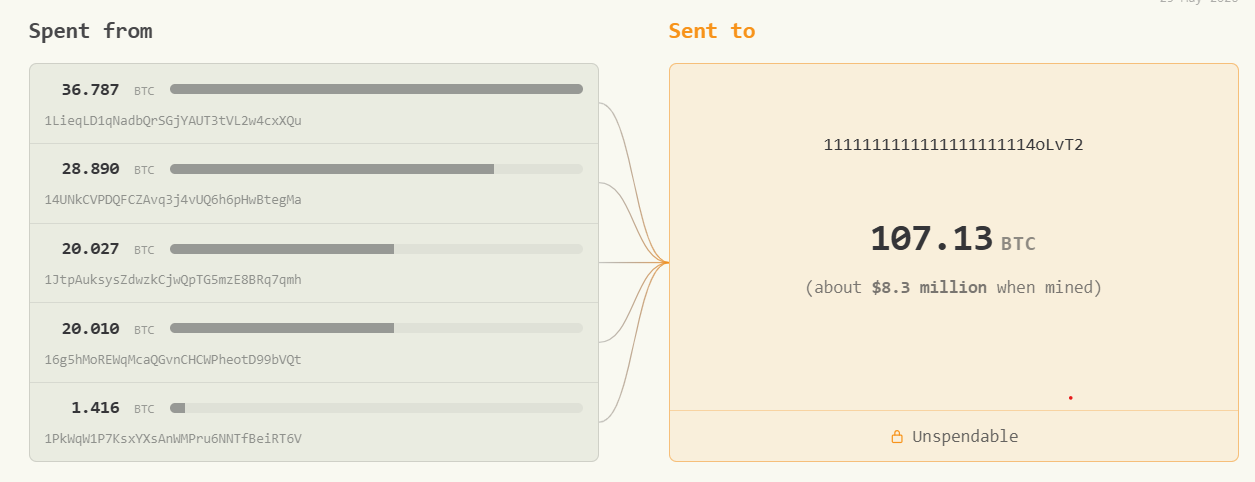
How to destroy Bitcoin. Source: Bennet.org
All five wallets were initially funded on the same day in April 2014, and each subsequently sent almost the same dollar-equivalent amount of BTC to the same deposit address at a large centralized exchange.
Related: Bitcoin faces true demand test above $83K as liquidity thickens: Glassnode
The addresses also seem to have operated on a rotational basis: one would send Bitcoin to the exchange until its activity stopped, then another would take over with transactions of a “similar cadence and value.”
Most of the funds, Chainalysis says, can be traced back to Mt. Gox, “suggesting the owner was an early adopter of Bitcoin.”
That doesn’t necessarily mean the coins were withdrawn directly from Mt. Gox, since the exchange ceased trading in February 2014, and the five wallets were funded in April. Bennet says:
“It’s entirely possible that the owner of these coins was one of the lucky ones who managed to get their coins off the exchange before it collapsed.”
The custodian itself remains unidentified. Chainalysis confirms it’s a large centralized exchange but says it does not publicly disclose the names of services it identifies.
Bennet’s analysis suggests the address behaves like a static customer deposit address at a large custodian.
That’s because the address doesn’t maintain a balance, and the deposits are swept into transactions containing dozens of other inputs before being consolidated into an omnibus wallet.
Once the Bitcoin enters the custodian’s system, the public blockchain can no longer tell us what happened to those coins. And that makes the wallet’s earlier activity even more intriguing.
The $10,400 clue
One of the five addresses sent 19.6 BTC in 60 transactions to the custodian between 2022 and 2024.
The Bitcoin amounts were vastly different, ranging from about 0.15 BTC to 0.62 BTC. But when measured in dollars, the transactions reveal extraordinary similarities.
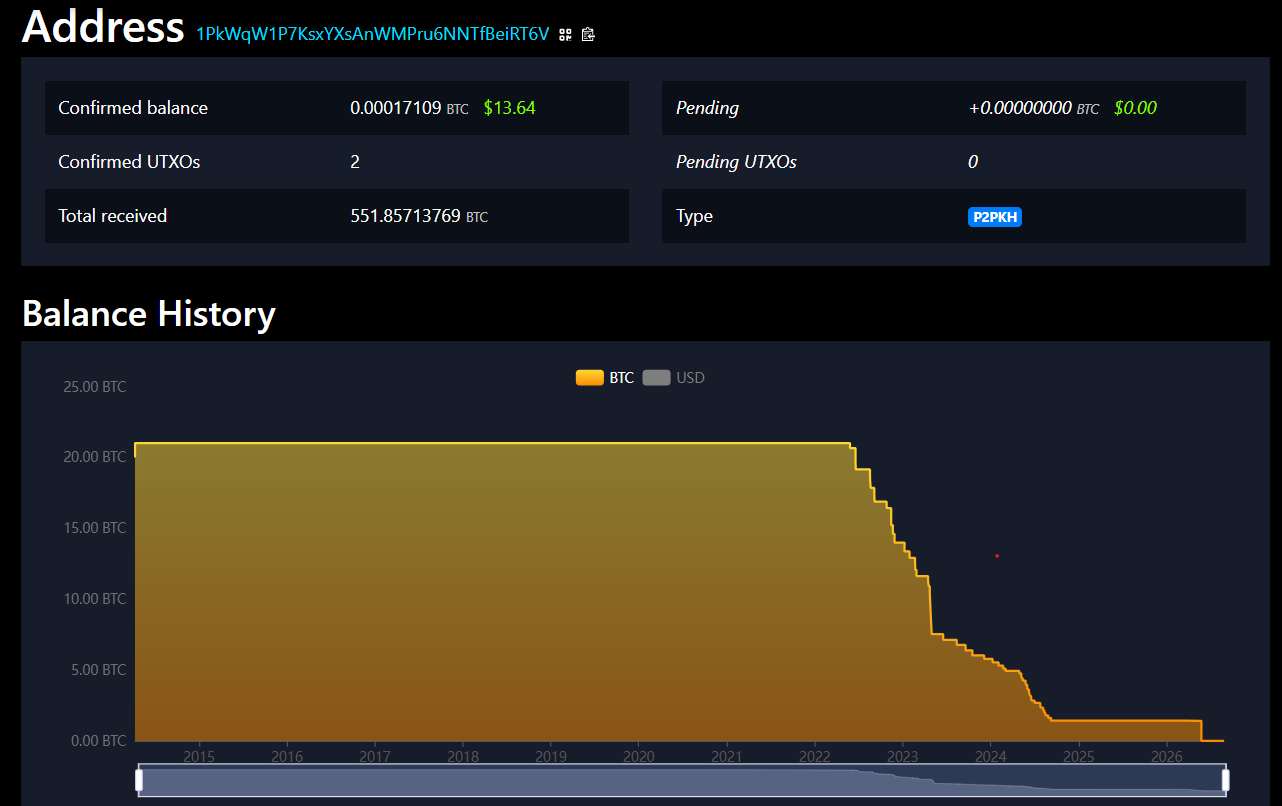
This address sent 19.6 BTC in 60 transactions to the same custodian. Source: Mempool.space
Despite Bitcoin’s price more than quadrupling during the period, 58 of the 60 transfers were within 10% of approximately $10,400 when they were sent.
So, while the owner wasn’t repeatedly sending the same amount of BTC, they were repeatedly sending almost the same dollar amount. Bennet says:
“This suggests to me a planned liquidation strategy.”
There is no way to prove this theory from the blockchain, since the BTC was mixed with large numbers of other coins once it reached the custodian, and the data doesn’t show whether the Bitcoin was sold, held or transferred elsewhere.
Related: Bitget CEO isn’t buying the Bitcoin rally — She’s waiting for $50K
Interestingly, “while payment size was constant,” Bennet says, “frequency was not — these $10k transfers came in clusters,” which could be more consistent with someone sending fixed-dollar amounts when required rather than following an automated schedule.
The $1 million round trip
While the $10,400 transactions offer a possible explanation for the wallet owner’s earlier relationship with the custodian, they do not help explain the $1 million round trip that happened in March.
After sitting untouched for roughly 12 years, the wallet suddenly moved its entire balance of 20.00010537 BTC and received 20.00006037 BTC back, a difference of just 4,500 satoshis, or around $3.
That weighs against the idea that the owner was simply trading the Bitcoin, since whatever happened inside the custodian, almost exactly the same amount came back.
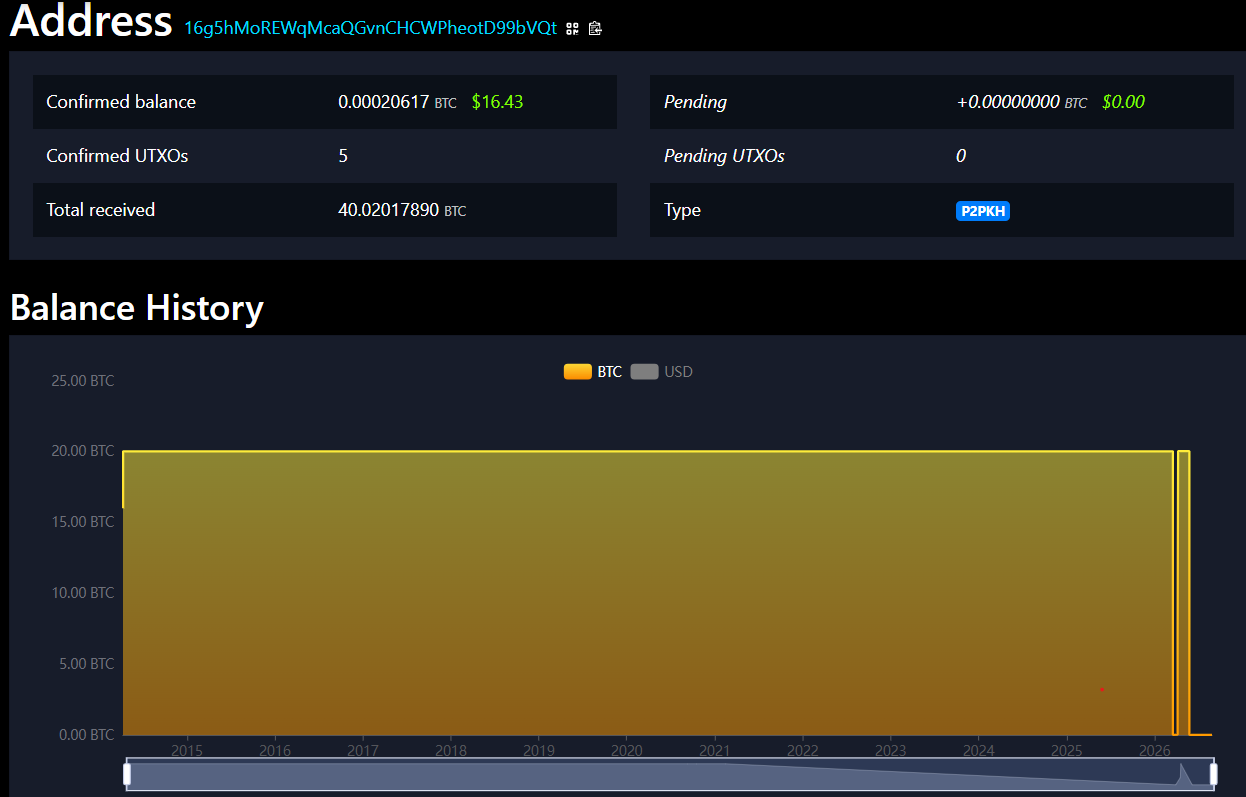
This address sent 20 BTC and received 20 BTC back. Source: Mempool.space
The returned Bitcoin was also split into three transactions of 7 BTC, 7 BTC and 6.00006037 BTC, sent over three consecutive days.
Bennet says the round numbers are consistent with a daily withdrawal limit imposed by the custodian. Crucially, the Bitcoin didn’t simply end up in another wallet; it returned to the same address that had sent it.
The transaction history also indicates that the same key holder controlled the coins before and after the round trip, Bennet says: spending the Bitcoin in March required the private key, while burning it in May required the same key again.
That makes the sequence particularly difficult to explain as a conventional exchange transaction.
So why did they do it?
There are several possibilities, but none fits all of the evidence. The liquidation theory makes some sense of the earlier transactions, but it doesn’t explain why the owner would send roughly $1 million through the same infrastructure in March and then retrieve virtually all of it.
Perhaps the owner was testing an old wallet or custody arrangement after 12 years of dormancy, moving the coins through a major custodian and successfully getting them back to show that an old key and custody setup still worked. But then, why destroy the Bitcoin afterward?
Tax or compliance reasons could potentially explain why someone moved an old stash through a major custodian, but then, there is no evidence linking the transaction to a particular tax or regulatory event.
There is also a privacy explanation. Sending Bitcoin through a custodian that sweeps deposits into an omnibus wallet makes the subsequent movement of those coins much harder to follow onchain. That’s certainly plausible but still provides no clues as to their ultimate destruction.
Perhaps the Bitcoin burn itself was intended as some kind of statement. Yet beyond a few blockchain sleuths, the action almost went unnoticed.
Burning Bitcoin is irreversible, so whoever controls the private keys chose to send the coins somewhere they can never be spent again, rather than simply leaving them untouched. Bennet says:
“There’s also the possibility that a very wealthy individual without heirs decided to permanently burn their coins (thereby publicly reducing the total bitcoin supply), rather than just destroying their keys.”
For now, even the firms best placed to analyze the blockchain are at a loss. Chainalysis concedes:
“We don’t have a clear explanation for why the owner would move a long-dormant stash through a custodian, retrieve roughly the same amount, and then deliberately burn it.”
While the blockchain can give us an unusually detailed record of what happened, it can’t tell us why. For now, at least, that remains the million-dollar question.
Magazine: El Salvador’s Bitcoin experiment turns 5: ‘It was for us, not them’
Cointelegraph publishes long-form journalism, analysis and narrative reporting produced by Cointelegraph’s in-house editorial team with subject-matter expertise. All articles are edited and reviewed by Cointelegraph editors in line with our editorial standards. Some articles contain affiliate links, from which Cointelegraph may earn a commission. These relationships do not influence which products we review or our editorial conclusions. Content published in here does not constitute financial, legal or investment advice. Readers should conduct their own research and consult qualified professionals where appropriate. Cointelegraph maintains full editorial independence.
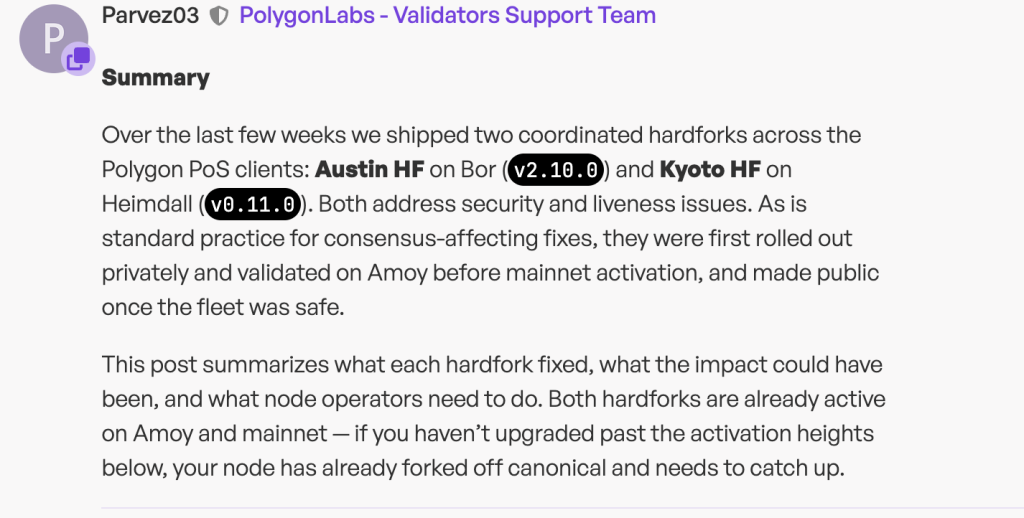
Polygon Crypto deployed two coordinated hard forks, Austin on Bor v2.10.0 and Kyoto on Heimdall v0.11.0, to close denial-of-service, resource-exhaustion and consensus-hardening risks across its Polygon PoS client stack. Both upgrades were rolled out privately and validated on the Amoy testnet before mainnet activation, according to a Polygon forum post published August 27.
No mainnet disruption was observed from the vulnerabilities Austin addressed, and both forks were already active on Amoy and mainnet by the time the disclosure went public.

The sequencing matters: Polygon fixed the issues, confirmed the fleet was safe, then explained what had been broken – not the other way around.
Polygon Crypto: What Austin and Kyoto Actually Fixed
Austin closed two Bor block-processing DoS paths. State-sync events, which handle L1-to-L2 bridge deposits, execute contract code and precompiles just like ordinary transactions, but their gas consumption previously wasn’t metered against a hard per-block cap.
A block carrying enough state-sync events, or one especially expensive one, could make processing slow enough to transiently stall the chain. Austin added an explicit per-block gas bound to close that gap.
The second Austin fix removed Bor’s TxDependency wire field entirely. The field was a parallel-execution hint with no size limit, meaning a block producer could stuff an arbitrarily large blob into an otherwise valid sibling block and crash any peer that tried to process it.
Polygon Labs patched a batch of security flaws in its PoS network through two private hard forks, Austin on Bor and Kyoto on Heimdall, before disclosing them publicly. The important detail is the operating model: consensus-affecting fixes were rolled out quietly, validated on the… pic.twitter.com/Sezi5VENW0
— TheFrogMaxi
 (@thefrogmaxi) August 31, 2026
Since parallel execution doesn’t need peers to trust a producer’s hint to function correctly, removing the field cost nothing downstream.
Kyoto’s most severe fix targeted deeply nested google.protobuf.Any fields in Heimdall transactions. Without a cap, a single cheaply-crafted transaction could force every validator to perform disproportionately expensive decode work simultaneously, a permissionless way to impose costly, correlated load across the entire validator set.
Kyoto added a byte-level pre-scan enforced identically at mempool admission and on the consensus path, so a transaction can’t slip through one check and get rejected by the other.
Kyoto also bundled smaller hardening fixes: a cap on fee-coin counts, normalized checkpoint signature recovery bytes, idempotent handling of repeated producer-downtime messages, milestone range votes bound to the signed parent hash, checkpoint-window continuity checks, non-halting future-span creation, and injective replay keys for topup, clerk and stake L1 events.
All of it is inert below the fork height – normal traffic sees no behavioral change. That kind of layered validation hardening echoes broader industry efforts to shore up transaction-processing edge cases before they’re exploited, similar in spirit to protocol-level changes aimed at emerging transaction-security threats elsewhere in the industry.
Make Your Prediction Count With $25 For Free on Kalshi
Why Bor and Heimdall Both Needed Patching
Austin activated at Amoy block 44,120,000 and mainnet block 91,949,700. Kyoto activated at Amoy height 42,252,000 and mainnet height 51,533,000.
Bor handles block execution while Heimdall runs consensus, and Kyoto’s fixes span ABCI, milestone, bor, stake, topup, clerk and bridge processing, meaning the patch touched checkpoint finality, milestone accounting and L1-event replay logic all at once.
Bor v2.10.0 is mandatory for all nodes; Heimdall v0.11.0 is mandatory for all validators and full nodes. Both are plain binary upgrades with no state migration or genesis change required for operators already current.
Huge applause to the @0xPolygonLabs security team
Quietly patched DoS flaws via the Austin & Kyoto hard forks—zero downtime, zero exploits, zero user impact.
This is how battle-tested infrastructure operates. Security first, noise later.$POL #Polygon https://t.co/jIESwxvLxC
— Delli Babu | $POL

(@DelliBabu_POL) August 30, 2026

That’s a distinct case from nodes still running pre-fork binaries past the activation heights: those have already forked off canonical consensus and need to upgrade and roll back to resync, rather than simply updating in place.
Coordinated client upgrades of this kind carry real operational stakes for any high-throughput chain, a dynamic playing out elsewhere as networks weigh state growth and execution risk against upgrade cadence, see the ongoing debate around Ethereum’s Glamsterdam upgrade path.
For Polygon PoS, the takeaway is straightforward: the vulnerabilities were resource-exhaustion and consensus-edge-case risks, not correctness failures, and both were resolved before any exploitation was observed on mainnet.
The Best Traders Around Use It: AI Copy Trading Bots From CryptoHopper
The post Polygon Crypto Secures Bor and Heimdall Clients Before Disclosure appeared first on Cryptonews.

Ripple just gave the market something bigger than a daily candle to chew on. The company’s quantum security roadmap could reshape how the market prices in long-term network risk, and there’s a detail in the phasing schedule that traders should not skip past.
Ripple has laid out a four-stage post-quantum roadmap for XRPL, running from an emergency “Q-Day” recovery plan through a targeted mainnet code amendment by 2028. Phase 1 lets users migrate to quantum-safe accounts without exposing current keys. Phase 2 tests NIST-recommended ML-DSA algorithms on AlphaNet in H1 2026. XRPL’s existing key-rotation feature gives it a structural head start that most legacy chains lack.
— Coin Bureau (@coinbureau) August 29, 2026
 NEW: Ripple is quantum-proofing the XRP Ledger before "Q-Day" arrives.
Ripple is preparing ripple:native for the moment quantum computers can break the cryptography protecting wallets, which researchers call Q-Day, per CoinDesk.
The company laid out a four-stage migration… pic.twitter.com/HK6AVJtIY3
None of this changes XRP’s cryptography today. Shor’s algorithm-capable quantum computers remain theoretical. But markets price narratives well before they price threats, and “first major L1 with a formal quantum timeline” is a narrative XRP holders will hear repeated for the next two years.
Discover: The Best Crypto to Diversify Your Portfolio
Can XRP Price Hold $1.35 Support Amid The Ripple Quantum News?
XRP’s pullback from August highs has it consolidating in the $1.34–$1.40 band, with the 7-day chart down near 10% even as the monthly print stays positive.
Volume has thinned alongside the price compression, typically a sign that the market is waiting on a catalyst rather than committing to direction.

- Bull case: a hold above $1.35 support opens a retest of the $1.45–$1.50 resistance zone, where August’s stronger momentum stalled.
- Base case: continued range-bound trading between $1.35 and $1.40 as the market digests the quantum roadmap without a near-term price trigger.
- Bear case: a break below $1.30 invalidates the recent structure and opens room toward the low-$1.20s.
Recent analysis on the $1.40 floor suggests bulls need volume confirmation, not just headline momentum, to reclaim that level.
Trade XRP on Bybit and Get a Chance to Win Our $1,000 USDT Airdrop
Maxi Doge Targets Early Mover Upside as XRP Consolidates
XRP’s structural news is bullish on paper, but a 2028 implementation timeline does little for anyone trading weekly charts. Holders sitting on August gains now face a market pricing in patience over payoff.
This is the kind of setup that sends capital hunting for shorter runways. Support-test dynamics like these tend to push traders toward earlier-stage plays where upside isn’t already baked into a multi-billion-dollar market cap.
That’s the lane Maxi Doge ($MAXI) is running in. It’s an Ethereum-based meme token built around a 240-lb leverage-obsessed mascot and a “never skip leg-day, never skip a pump” ethos. A gym-bro humor wrapped around a trading community angle.
The presale has raised $4.8 million at a current price of $0.0002836, with a huge 65% APY staking live for early buyers. Standout features include holder-only trading competitions with leaderboard rewards and a Maxi Fund treasury earmarked for liquidity and partnerships.
Research Maxi Doge through the official presale page before the presale ends.
Discover: The Best Token Presales
The post Ripple Unveils 4-Stage Quantum Security Plan: Is XRP Set to Benefit? appeared first on Cryptonews.
Most leading digital assets have posted minor losses over the past 24 hours, while the total capitalization of the crypto market has slightly retreated during the same period.
The popular privacy token Monero (XMR) defied the ongoing conditions, registering a double-digit increase and nearing the prestigious top 10 club. Here’s what fueled the rally.
Leading the Gainers
XMR is the best-performing cryptocurrency from the top 100 list today (August 31), with its price briefly surging to almost $530, the highest since January this year. Currently, it trades at around $525 (per CoinGecko), representing a 43% jump on a monthly scale.
The asset’s market cap jumped to nearly $10 billion, overtaking well-known altcoins like Chainlink (LINK) and Cardano (ADA) and making it the 13th-largest cryptocurrency.
Perhaps the biggest catalyst for the move north is THORChain’s network upgrade, which reportedly introduced native support for XMR swaps.
According to X user Nebrasangooner, breaking above the $410 resistance was the key bullish trigger, suggesting the asset is ready to take off. For his part, David Gokhshtein remains baffled by how XMR printed such gains without being listed on many major exchanges.
Recall that at the beginning of 2024, Binance terminated all services with the token, triggering a substantial price decline. XMR remains unavailable on Coinbase as well, while the few popular platforms that support it are Kraken, KuCoin, and MEXC.
Other X users commenting on the price increase include Mav and Sweep. The former claimed that the rise above $500 has confirmed XMR’s comeback, whereas the latter described it as “an absolute sleeping giant” and “the real privacy token.”
Meanwhile, the coin’s recent exchange net flow indeed suggests a further rally could be on the way. CoinGlass’s data displays that outflows have surpassed inflows over the past several days, signaling that investors have abandoned centralized platforms in favor of self-custody, thereby reducing immediate selling pressure.

The Concerning Sign
Contrary to the aforementioned bullish predictions, XMR’s Relative Strength Index (RSI) hints at an incoming correction. The technical analysis tool ranges from 0 to 100, where anything above 70 suggests the asset is overbought and due for a move south.
On the contrary, readings below 30 mean XMR has entered oversold territory and could be interpreted as buying opportunities. As of this writing, the RSI stands at roughly 77.

- XMR RSI, Source: RSI Hunter
The post Monero (XMR) Hits a 7-Month Peak: What Happened and What’s Ahead? appeared first on CryptoPotato.

‘Distinctive’ lifestyle and homeware brand confirmed to open fourth store in Glasgow

Warsh Rolls The Dice With Rhetoric

Strive Adds 1,800 Bitcoin in $143M BTC Purchase





-

 Crypto World6 days ago
SpaceX stock could rise 75% to $240, JPMorgan says
-

 Fashion3 days ago
Weekend Open Thread: Maeve – Corporette.com
-

 Crypto World4 days ago
Bitcoin’s 22% rally now needs real demand to outlast Treasury liquidity boost
-

 Crypto World5 days ago
Warsh Jackson Hole keynote puts financial innovation first
-

 Crypto World7 days ago
A $30 Billion AI Fund Implodes, Now the SEC Is Investigating Wall Street’s Role
-

 Business4 days ago
Salesforce Stock Soars 19% as Blowout Earnings and Agentforce AI Growth Silence Software Skeptics
-
 Crypto World6 days ago
Did Trump Just Move SpaceX Stock With One Truth Social Post?
-

 Crypto World5 days ago
Elon Musk Grok Bot Promise: We Will Make You Whole if AI Loses Your Money
-

 Business4 days ago
Apple Confirms September 9 Keynote and Reveals Its Full Pre-Order Schedule
-

 Business5 days ago
Walmart takes aim at younger shoppers with new fashion brand
-
 NewsBeat5 days ago
Lindsay Clancy jury braces for closing arguments as judge tells court: ‘You’ve heard all the evidence’ – Live updates
-

 Business3 days ago
Onto Innovation Stock: AI’s Next Bottleneck Is Yield (NYSE:ONTO)
-

 Business6 days ago
Thailand’s Eastern Economic Corridor Capital City (EECiti): Key Developments and Investment Opportunities
-

 Crypto World3 days ago
Bitcoin price tests $82K resistance as Brandt stays long
-
 Crypto World4 days ago
NVIDIA revenue hits $96.2B as AI demand doubles
-

 Business7 days ago
Moderna CEO warns China is pouring state money into mRNA technology
-

 Business7 days ago
NVIDIA Stock Drops Nearly 2 Percent to $210 on Seventh Losing Day Ahead of Critical AI Earnings
-

 Business3 days ago
iPhone 18 Pro Pre-Orders Could Shift to Saturday as Apple Reportedly Avoids September 11 Anniversary
-

 NewsBeat6 days ago
Trump’s trade truce with China faces test with Iran effort
-
 Crypto World5 days ago
Nvidia Q2 Earnings Reveal $96.2 Billion Beat, So Why Is NVDA Falling?
You must be logged in to post a comment Login