

Crypto World
Hyperliquid price forms bearish double top, will it crash back to $35?
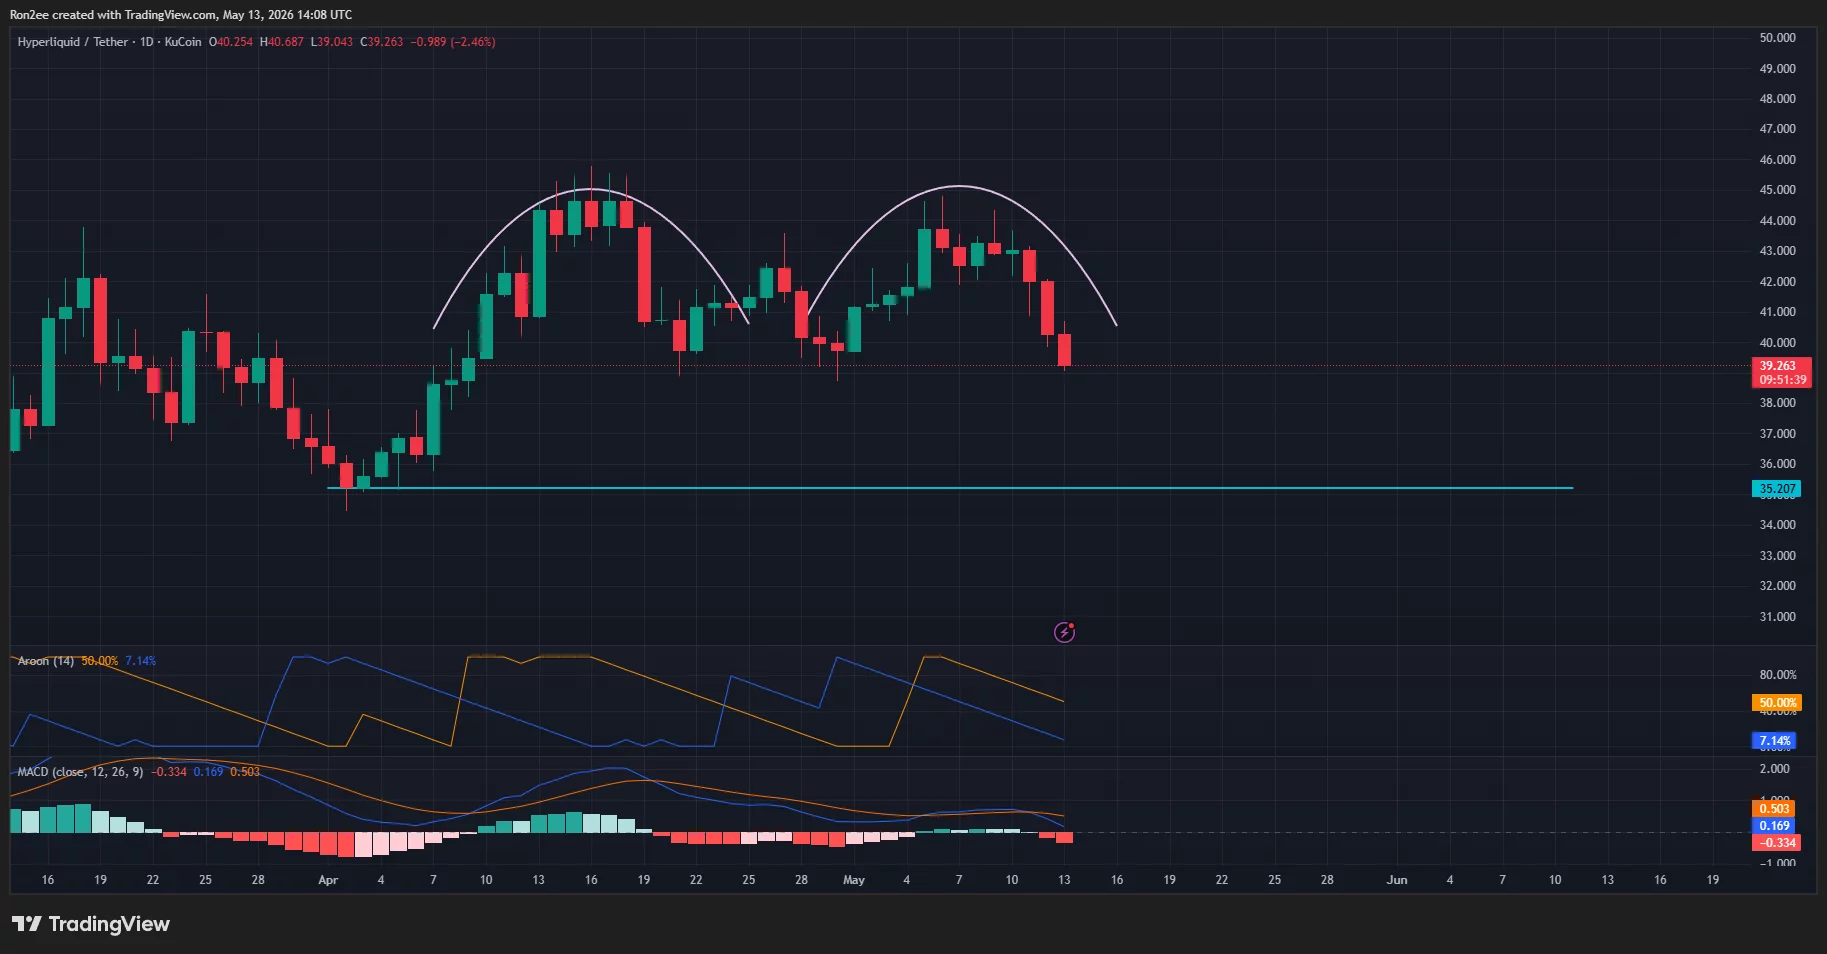
Hyperliquid price extended its decline on Tuesday after failing to hold above a key resistance zone, raising concerns that a bearish double top pattern may now be forming on the daily chart.
Summary
- Hyperliquid price fell toward $39 after forming a potential bearish double top pattern near the $44–$45 resistance zone.
- Whale positioning on Hyperliquid reached $4.236 billion, with long and short exposure remaining nearly balanced at a 0.98 ratio.
- A bearish MACD crossover and weakening momentum indicators raised the risk of a deeper correction toward the key $35 support level.
According to data from crypto.news, Hyperliquid (HYPE) price dropped to around $39.2 at press time on May 13 after briefly trading above $44 earlier this month. Despite the recent pullback, the token still remains significantly above its April lows near the $35 region.
The latest correction comes as whale positioning on Hyperliquid reached roughly $4.236 billion in total exposure, with large traders showing an unusually balanced stance between bullish and bearish bets. Long positions accounted for around $2.099 billion, while short positions stood slightly higher near $2.137 billion, producing a near-neutral long-short ratio of 0.98.
The positioning suggests that institutional and high-net-worth traders remain uncertain on the market’s near-term direction despite elevated volatility across digital assets.
At the same time, investor sentiment surrounding the Hyperliquid ecosystem has remained relatively strong following the launch of the first U.S.-listed exchange-traded funds tied to the HYPE token by 21Shares. The products include a spot ETF with staking exposure alongside a leveraged fund linked to the decentralized derivatives platform.
The ETF launch further strengthened Hyperliquid’s growing institutional profile as the protocol continues dominating decentralized perpetual futures trading. The platform currently controls a substantial share of decentralized perpetual open interest while processing billions of dollars in daily trading volume.
However, traders appear to have started locking in profits after HYPE repeatedly failed to break above the key $44–$45 resistance zone over the past several weeks.
Hyperliquid price analysis
On the daily chart, Hyperliquid price appears to have formed a bearish double top pattern with two major peaks established near the $44–$45 region. Typically, a double top pattern signals weakening bullish momentum and often precedes a deeper correction once the neckline support breaks.

The neckline of the pattern currently sits near the $35.2 support zone, which also aligns with a major horizontal support area that buyers defended aggressively during the April consolidation phase.
A look at the MACD indicator reinforces the weakening momentum outlook. The MACD histogram has turned negative again, while the MACD line has crossed below the signal line, confirming a bearish crossover and suggesting that downside pressure may continue building in the short term.
Meanwhile, the Aroon indicator also points to fading bullish momentum. The Aroon Up indicator has declined toward the 50% level while the Aroon Down remains subdued near 7%, signaling that buyers are gradually losing control of the trend even though broader bearish dominance has not yet fully emerged.
If sellers manage to push HYPE below the neckline support near $35, the bearish double top setup could trigger a larger correction toward the $31–$32 region.
On the upside, bulls would likely need to reclaim the $44 resistance area to invalidate the bearish structure and restore momentum toward the psychological $50 level.
Disclosure: This article does not represent investment advice. The content and materials featured on this page are for educational purposes only.


MUFG Bank, Mizuho Bank, and Sumitomo Mitsui Banking Corporation have established a formal joint council to develop and co-issue a yen-backed crypto stablecoin by the end of Japan fiscal year 2026, March 2027.
The stablecoin will be issued under a trust agreement, with all three banks acting as joint settlors and a trust bank or similar institution serving as trustee. This is not a pilot. Three systemically important institutions have committed shared infrastructure.
The initiative operates under the FSA’s Payment Innovation Project and follows a late-2025 pilot examining whether multi-bank stablecoin co-issuance could be carried out, in the banks’ words, “legally and appropriately.”
The answer, evidently, was yes. Collectively, MUFG, Mizuho, and SMBC oversee more than $7 trillion in assets, making this the largest institutional Japan stablecoin initiative in Asia to date.
Japan Payment Services Act: The Regulatory Architecture Behind the Joint Issuance
Japan’s stablecoin regulation crystallized in June 2023, when amendments to the Payment Services Act introduced a formal licensing regime for fiat-pegged stablecoins, classifying them as electronic payment instruments.
The law restricts domestic issuance to three categories of entities: licensed banks, trust companies or trust banks, and registered fund transfer service providers. That restriction is the structural moat the megabanks are stepping through.
The FSA’s Payment Innovation Project, housed within the FinTech Proof-of-Concept Hub operational since 2017, provided the formal channel for the late-2025 pilot.
Updated PSA 2026 amendments took full effect June 13, 2026, tightening travel-rule obligations for cross-border transactions and reinforcing the FSA’s enforcement posture. From June 1, 2026, foreign trust-type stablecoins can also operate in Japan as electronic payment instruments under a revised Cabinet Office Ordinance, provided they clear FSA licensing, collateral management, and audit standards.
Reserve rules are specific: trust stablecoin issuers may invest up to 50% of reserves in short-term Japanese government bonds. The megabank yen stablecoin is expected to be fully reserved, backed by cash and JGBs held in trust, aligning precisely with the FSA’s asset-segregation and redemption-at-par requirements.
Discover: The Best Crypto to Diversify Your Portfolio
Japan Yen Crypto Stablecoin Field: JPYC, JPYSC, EJPY, and Now the Megabanks
The megabanks are entering a yen stablecoin market that has moved fast since 2023’s regulatory clarity. JPYC Inc. launched Japan’s first legally recognized yen-denominated stablecoin, JPYC, in October 2025.
The FSA subsequently classified it under the same regulated payment services framework as PayPay and Rakuten Pay in April 2026, a signal of how mainstream the product has become.
SBI Holdings and Startale Group followed in February 2026 with JPYSC, a trust bank-backed yen stablecoin issued by SBI Shinsei Trust Bank and targeting institutional and cross-border use cases.
The Japan Blockchain Foundation announced EJPY in May 2026, to be issued on Japan Open Chain and Ethereum.

On the dollar side, major financial institutions are racing to establish bank-issued crypto footholds, USDC became the first dollar-pegged stablecoin approved in Japan in March 2025, issued by SBI, and Ripple and SBI Holdings have announced plans to launch RLUSD in Japan.
What distinguishes the megabank co-issuance model is regulatory weight, not technology. JPYC and JPYSC are compliant products. A jointly branded yen stablecoin from all three of Japan’s dominant banking groups carries a different order of institutional credibility, and a different scale of potential settlement volume.
Discover: The Best Token Presales
The post Japan Three Biggest Banks Unite to Launch Yen Crypto Stablecoin by March 2027 appeared first on Cryptonews.
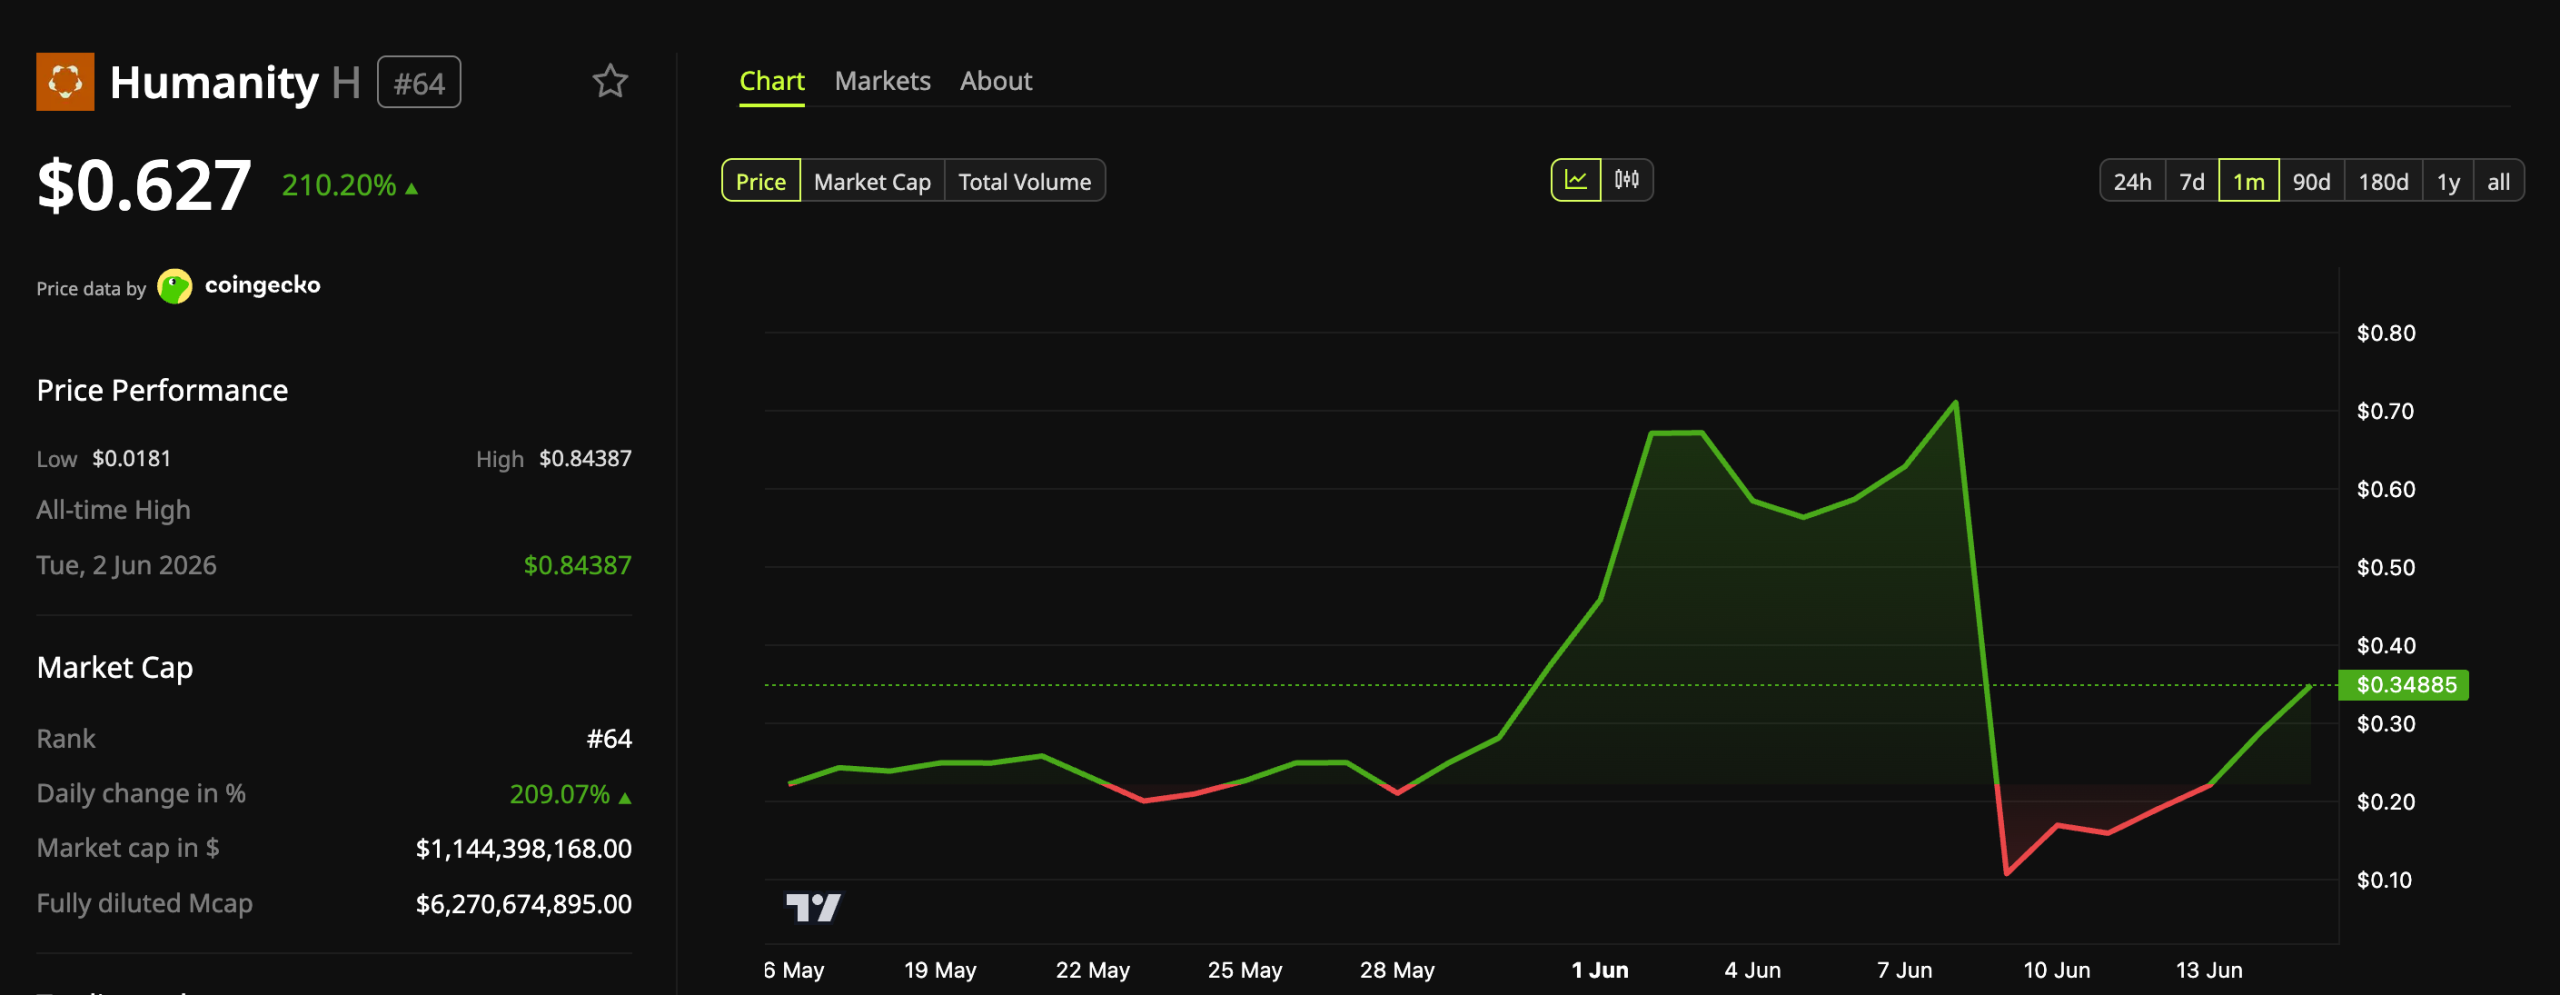
Humanity Protocol’s H token surged by more than 200%, topping every other cryptocurrency by daily gains, as buyers returned days after the June 8 exploit.
The token ranked as the market’s biggest gainer, recovering some of the value it had lost after attackers seized control of private keys.
H Token Rebounds From Exploit Lows
The H token changed hands near $0.627 on Sunday. That represented a daily gain of about 210%.
The move extended a recovery rally that began after the token collapsed by over 80% on the day of the attack. Its market value now sits near $1.1 billion, ranking 64th overall.
Follow us on X to get the latest news as it happens

The rally also landed as the broader crypto market edged higher. Total market value rose about 1% over 24 hours, helped by easing tension between the US and Iran. H’s triple-digit gain far outpaced that move.
Quantstamp Ties Humanity Protocol Attack to North Korean Hackers
Meanwhile, Humanity Protocol published findings from security firm Quantstamp on June 12. The report described tooling and methods characteristic of North Korean, or DPRK, hackers.
Investigators traced the breach to a phishing email that impersonated South Korean exchange Bithumb. A director opened a malicious attachment.
The file then installed remote-access malware on his device. The attacker copied private keys and ran a coordinated cross-chain operation.
“The tooling and tradecraft point to DPRK involvement. The Hancom-signed loader, the use of Stas’m RDP Wrapper, binaries disguised as Microsoft Defender’s Network Inspection Service, and a hidden GuestUser profile are all patterns Quantstamp describes as characteristic of North Korean intrusions,” the post read.
On-chain investigator ZachXBT also confirmed that the “sketchy MM/OTC” activity and the key compromise were actually unrelated.
The rebound signals renewed appetite for H despite the breach. Risks remain, however. The attacker still controls the BNB Smart Chain deployment and can mint fresh tokens.
Whether the rally holds may depend on how quickly Humanity Protocol contains that threat through its recovery plan.
Subscribe to our YouTube channel to watch leaders and journalists provide expert insights
The post Humanity Protocol Token Soars 210% to Lead Crypto Market Gainers appeared first on BeInCrypto.

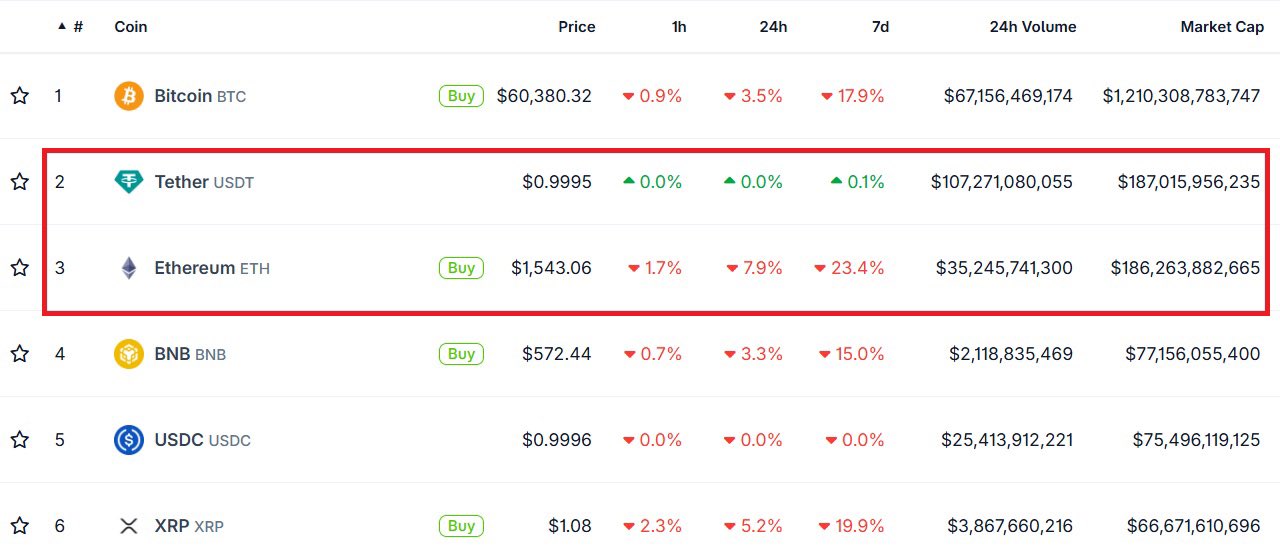
For a few hours, earlier this week, Tether USDT stablecoin held a higher market cap than Ethereum, the first time that has happened in eight years. Data across multiple trackers placed both assets in the $183–188B range during the crossover window, with one snapshot showing USDT at $187B against ETH at $186B, a spread of under $1B.
The flip lasted hours, and ETH reclaimed second place once the price stabilized. The mechanism that produced the crossover, steady USDT supply expansion meeting sustained ETH price weakness, did not disappear when the ranking reversed.
Discover: The Best Crypto to Diversify Your Portfolio
Crypto Market Structure: Tether USDT Flippening
This was not a supply shock on Ethereum’s side. What compressed ETH’s market cap was price, and what expanded USDT’s was issuance. Tether own Q4 2025 attestation showed USDT at a record $187.3B, having added $12.4B in a single quarter even as the crypto market was catching a falling knife.
By early 2026, USDT’s market cap had climbed from $144.2B to $184B in twelve months, 28% growth, while ETH’s dollar valuation moved in the opposite direction.
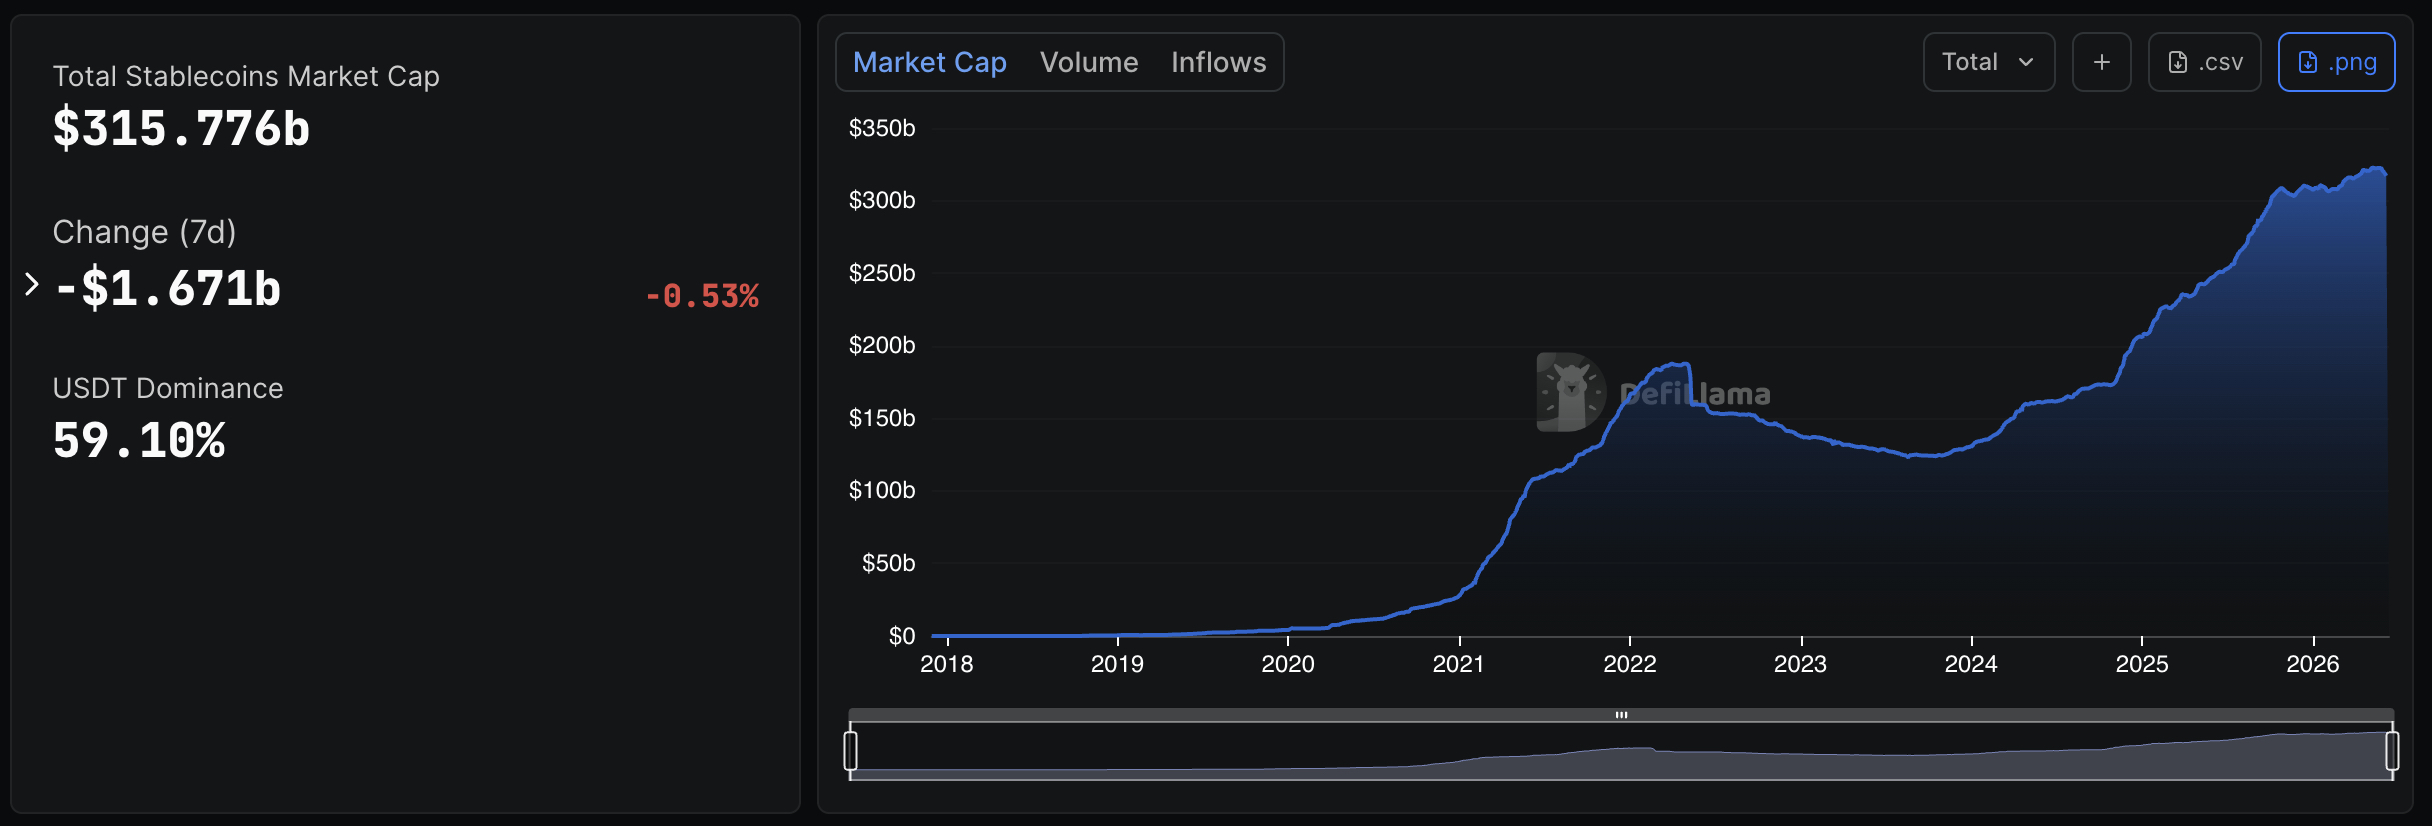
In the three weeks leading into the crossover, more than $7B exited the stablecoin sector while $400B was wiped from the total crypto market cap. Ethereum’s DeFi TVL slid to around $36B. Traders were not abandoning stablecoins; they were parking liquidity while shedding volatile assets.
USDT’s share of the total stablecoin sector sits at 59%, with USDT and USDC together accounting for 82%, which means Tether is not a peripheral player in this dynamic.
Discover: The Best Token Presales
Mike McGlone’s Warning: It Doesn’t Stop at Ethereum
Bloomberg Intelligence senior commodity strategist Mike McGlone has been tracking this trajectory longer than most. In October 2020, McGlone wrote that USDT, then at $16B against ETH’s $43B, was “on pace to match the market capitalization of Ethereum in a bit less than a year,” describing it as part of an “inexorable trend” toward stablecoins gaining mainstream footholds.
LATEST: — CoinMarketCap (@CoinMarketCap) February 13, 2026
 Bloomberg analyst Mike McGlone says Tether's USDT stablecoin is on track to eventually flippen both Ethereum and Bitcoin. pic.twitter.com/kiAbF30dbb
McGlone’s updated thesis goes further. He expects “the flippening to continue,” with Tether’s market cap topping Ethereum in 2026 and “eventually Bitcoin.” The extreme scenario he outlines: if Bitcoin falls toward $10,000, USDT, which would need to grow 7x from current levels, could eventually challenge BTC for the top spot.
We are not endorsing the $10,000 BTC scenario here. But dismissing it entirely because it sounds extreme is how people missed the USDT-flips-ETH call in the first place.
Discover: The Best Crypto to Diversify Your Portfolio
ETH and USDT Now: The Gap, the Recovery, and What Comes Next
As of today, Ethereum has reclaimed the second position in market cap rankings, but the margin is not comfortable. ETH would need to sustain meaningful price recovery, or Tether USDT issuance would need to plateau for the second place to feel secure again.
Neither is guaranteed. Structural improvements in Ethereum’s tech stack, including ZK-proof scaling developments, offer a longer-term bullish counterpoint, but those catalysts operate on a different timeframe than the near-term price weakness that enabled the June flip.

USDT’s supply trajectory shows no sign of reversal. Tether added $12.4B in a single quarter during a down market. In a neutral or risk-on environment, that pace could accelerate. At $1 peg, market cap and circulating supply are essentially the same number, so every new USDT minted is a direct market cap increment, without the price volatility that governs ETH’s ranking.
Discover: The Best Token Presales
The post Tether USDT Briefly Overtakes Ethereum in Market Cap: A $187B Wake-Up Call appeared first on Cryptonews.
Two of the most important metrics for the overall state of the Bitcoin network have declined recently, including the mining difficulty, which experienced a substantial reduction during the weekend.
This comes amid reports that miners, the backbone of the world’s largest blockchain, continue to be under severe pressure due to the broader market state.
Mining Difficulty Down 10%
Upon creating Bitcoin’s blockchain, the anonymous dev behind it, Satoshi Nakamoto, incorporated a key measure that adjusts every roughly two weeks (2,016 blocks) to make it harder or easier for miners to do their job of maintaining a consistent block creation of approximately 10 minutes. In simpler terms, if there are too many miners, the mechanism increases the difficulty to prevent too-fast block creation, and vice versa.
The latest adjustment took place earlier today. Data from on-chain monitoring sources shows that the difficulty dropped by just over 10%, meaning that there are fewer miners operating on the Bitcoin blockchain. This was the second-largest negative adjustment for the year after the 11.16% drop in early February.
The mining difficulty declined from almost 138T to under 125T. Current data, though still far from the actual adjustment, suggest the next one will be even worse, with projections indicating a 16% drop.
Meanwhile, the Bitcoin hash rate has continued to decline, according to data from Coinwarz. The total combined computational power used by the blockchain to process transactions and mine new blocks, which is measured in hashes per second, is down to under 790 EH/s. Recall that the record was at over 1.2 ZH/s from a year ago.

Miners Under Pressure
The declining mining difficulty and hash rate mean that a certain portion of BTC miners have shut off their machines. A recent report indicated that they have felt the pressure from the overall market weakness and reduced revenue.
Analyst Axel Adler Jr. described their current state as a “stress zone,” as evidenced by the Puell Multiple 30-day moving average, which fell 11% in less than two weeks. The raw Puell Multiple is even lower, while the Miner Capitulation metric, tracking the percentage change in BTC’s price since the most recent difficulty bottom, has declined by 21% lately.
The post Bitcoin Mining Difficulty Drops 10% as Pressure on Miners Grows appeared first on CryptoPotato.


Ripple CEO Brad Garlinghouse has put a clear number on the company’s 2026 business goal.
Summary
- Ripple’s revenue target separates operating income from XRP holdings, aiming to calm balance sheet concerns.
- Hidden Road, RLUSD, and treasury tools give Ripple more routes to serve banks and firms.
- XRP ETF inflows remain positive, but token demand still differs from Ripple’s business revenue path.
According to posts shared by CoinMarketCap and crypto-focused accounts on X, Ripple expects to end 2026 with a $1 billion revenue run rate. The figure does not include XRP held on Ripple’s balance sheet.
That detail matters because Ripple has long faced public debate over the link between its business and XRP. Garlinghouse’s target frames the company as a fintech infrastructure provider that aims to earn money from products, clients, and services, not from token holdings or sales.
Hidden Road, RLUSD and AI payments drive business push
Ripple has expanded beyond cross-border payments during the past year. The company agreed to buy prime broker Hidden Road for $1.25 billion in 2025, a deal that added credit, clearing, and prime brokerage services for large clients. Ripple said Hidden Road clears about $3 trillion a year across markets.
The deal also supports Ripple USD, known as RLUSD. Ripple has promoted the stablecoin for enterprise settlement and collateral use. Recently, crypto.news reported that Ripple is also adding RLUSD to new payment tools, including services tied to AI agents and machine payments on the XRP Ledger.
Company materials point to custody, treasury management, and liquidity services as core offerings. These products target banks and firms that need faster settlement, account control, and access to digital assets through regulated processes, rather than retail trading.
XRP demand stays separate from company revenue
Crypto.news data showed XRP trading near $1.15 on June 14, while XRP-linked ETF products recorded inflows for a fifth straight week. As reported earlier today, XRP products added about $10.68 million in the week ended June 12, even as Bitcoin and Ethereum funds saw outflows during the same period.
Those figures show that investor demand for XRP can move on a different track from Ripple’s operating business. Garlinghouse’s “not including XRP” point places the revenue target outside daily price action. It also gives banks, payment firms, and corporate treasurers a clearer way to judge Ripple’s core business.
Regulation remains part of Ripple’s 2026 plan
Ripple’s growth plan also sits next to a busy U.S. policy calendar. As previously reported, the CLARITY Act cleared the Senate Banking Committee by a 15-9 vote on May 14, 2026. The bill still needs more work before a full Senate vote, including a merger with text from the Agriculture Committee.
Garlinghouse has backed clearer rules for digital assets, saying banks need more legal certainty before they move deeper into crypto services. For Ripple, a rulebook could support payments, custody, liquidity, treasury tools, stablecoins, and token settlement in the United States.
Ripple has also moved into automated payments. As rypto.news reported on June 13, the company released the XRPL AI Starter Kit, which lets AI agents use XRP and RLUSD for payments through the x402 protocol with limited human involvement. The tool allows software agents to create wallets, check balances, track transactions, and send payments.
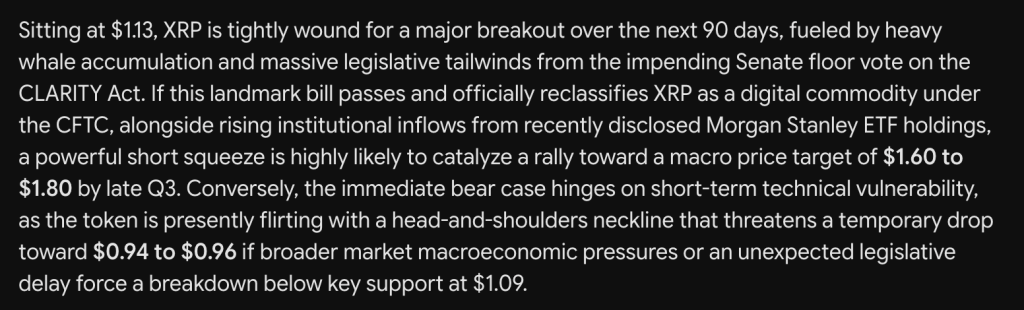
Google Gemini AI just put XRP back under the spotlight, predicting it is tightly wound for a major breakout toward $1.60 to $1.80 over the next 90 days.
With XRP sitting at $1.13 right now, that is a 42% to 59% move, and the whole setup is built on a coil that snaps the moment Washington pulls the trigger.
The bull case leans hard on a catalyst with a date attached. Heavy whale accumulation is soaking up supply while the market waits on the impending Senate floor vote on the CLARITY Act.

If that landmark bill passes and officially reclassifies XRP as a digital commodity under the CFTC, the legal overhang that has capped this token for years finally lifts.
Stack that on top of rising institutional inflows from recently disclosed Morgan Stanley ETF holdings, and you get the fuel for a powerful short squeeze.
That is the engine Gemini sees driving price toward the $1.60 to $1.80 target by late Q3.
The bear case is more of a near-term technical trap than a collapse. The token is presently flirting with a head and shoulders neckline, the kind of pattern that threatens a temporary drop if it breaks.
Lose the key support at $1.09, and the door opens toward $0.94 to $0.96. The triggers would be broader macro pressure or an unexpected legislative delay, knocking the CLARITY timeline off course.
So the whole thing hinges on that neckline holding while the Senate does its part.
XRP Price Prediction: A Coiled Spring Waiting On A Senate Gavel
XRP Price is on the 4-hour chart, and the price sits at $1.13 after a long bleed down from the $1.55 swing high back in mid-May.
The structure is a clear downtrend on this timeframe, a run of lower highs and lower lows that bottomed near $1.05 before this current bounce attempt.
Pattern-wise, this is the head and shoulders, the prediction flagged, with the neckline sitting right around $1.09 support.
Lose that line, and it confirms the bearish break. Key support sits at $1.09, with the next floor near $1.05 and deeper demand around $0.95. Resistance stacks at $1.20, then $1.35, and the heavier zone at $1.45.
RSI is reading 49.52 with its signal line at 45.22. So momentum is sitting right at the midline and curling up above its average.
That gap of about 4.3 points with RSI over the signal is an early sign buyers are starting to wrestle back control after the flush.
A clean push above 50 and into the 60s would confirm momentum is flipping bullish. Tie it together and the chart is coiled exactly like the thesis says, balanced on the neckline and waiting for a trigger.
Hold $1.09 and reclaim $1.20, and the path toward that $1.60 to $1.80 target starts to open up, but lose the neckline and $0.95 comes into play first.
Discover: The best crypto to diversify your portfolio with
Here is What Gemini AI Predicts For LiquidChain Near Future, Could be Very Bullish
Sitting at resistance waiting for a breakout is not positioning. It is standing in line.
Bitcoin, Ethereum, and XRP have been pressing against the same ceilings for weeks. The catalyst that unlocks the next leg is perpetually one data print away.
The institutional inflows are perpetually next quarter. Every large-cap trader waiting for a breakout is waiting on a decision that belongs to someone else’s balance sheet.
Early-stage infrastructure plays by completely different rules, Copilot AI predicts. Capital that would vanish as statistical noise at Bitcoin’s scale moves a small undiscovered project by multiples.
The asymmetric return lives in one place only: the gap between what something is genuinely worth and what the market currently thinks it is worth. That gap exists because the project has not been found yet. The moment it gets found, the gap is gone.
Cross-chain fragmentation has been extracting value from DeFi participants since the first bridge went live and nobody has eliminated it. Bitcoin, Ethereum, and Solana were engineered as independent systems with no shared architecture and no intent to interoperate.
Every transaction that crosses those boundaries pays the price of that design in fees, slippage, and execution failures. Bridges were supposed to be the solution. They became the mechanism through which the problem collects its fee.
LiquidChain eliminates the fee entirely. Three networks inside a single execution layer. One deployment reaches all of them. No cross-chain tax on any interaction anywhere.
Copilot AI flagged it as worth watching. The presale is at $0.01454 with just over $835,000 raised.
Execution is unproven. Adoption is unknown. Established assets offer a predictable ride toward a ceiling that is already fully visible. LiquidChain is an entry point that disappears once the market finds it.
Explore the LiquidChain Presale
The post Google Gemini AI Predicts Jaw-Dropping XRP Price For Next 90 Days appeared first on Cryptonews.
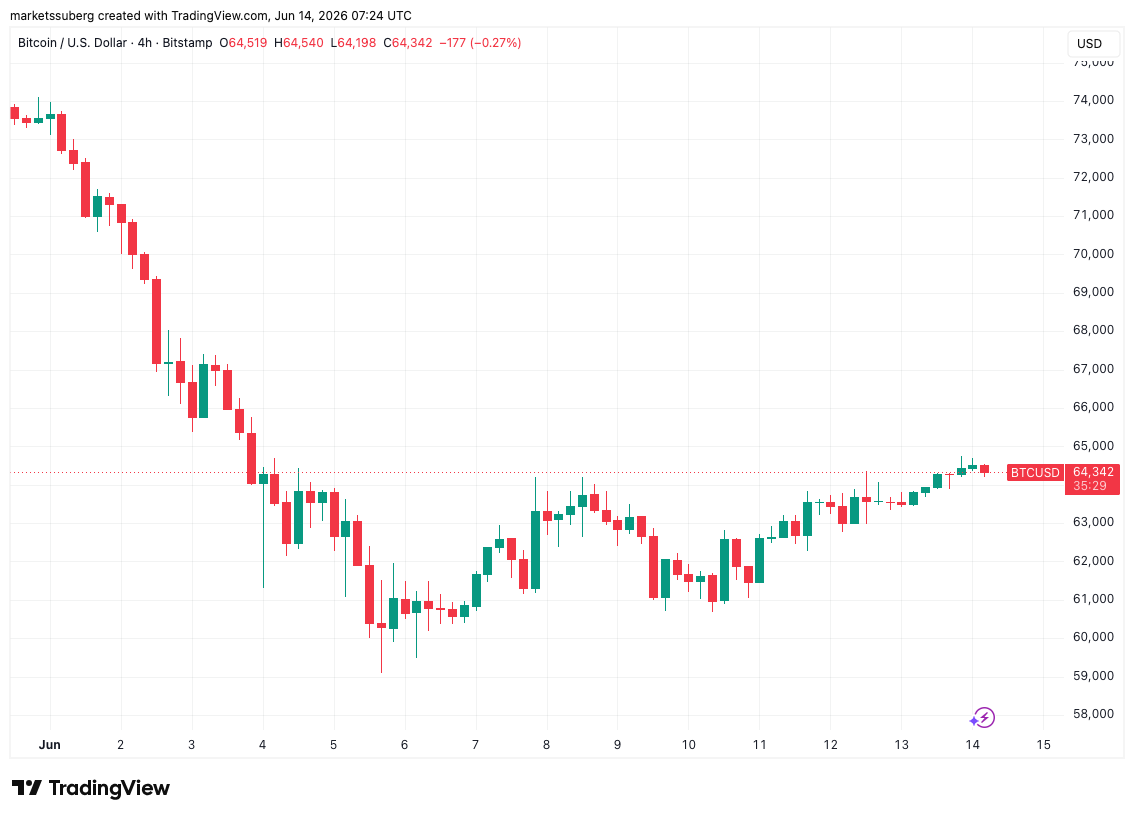
Bitcoin (BTC) circled $64,000 into Sunday’s weekly close as a US-Iran peace deal appeared imminent.
Key points:
- Bitcoin stays higher as US president Donald Trump pledges an Iran peace deal on Sunday.
- The Strait of Hormuz, a key global oil route, will be “open to all,” he says.
- Bitcoin analysis says no bearish chart patterns are active as open interest hints at a lasting price rebound.
Iran peace deal keeps Bitcoin rebound afloat
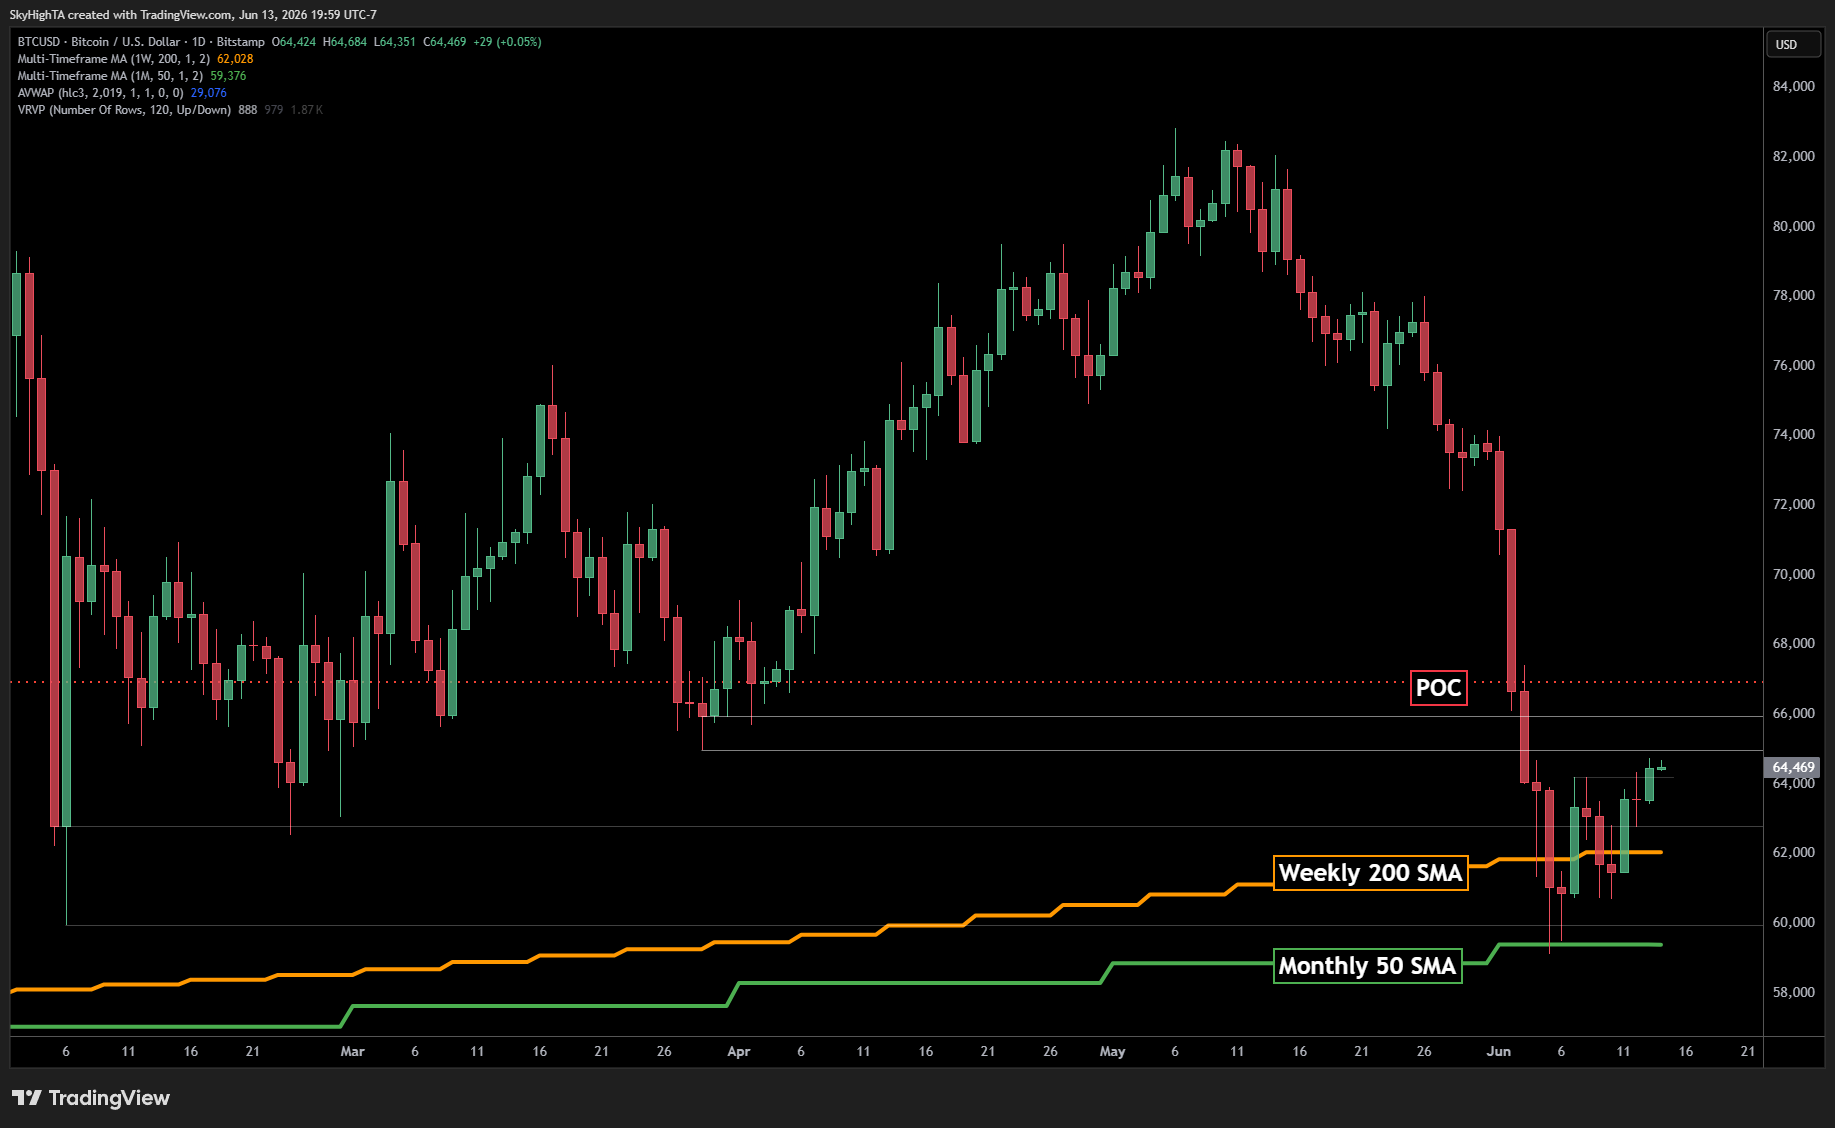
Data from TradingView showed price action settling after local highs of $64,750 on Bitstamp.

BTC/USD one-hour chart. Source: Cointelegraph/TradingView
These had accompanied an announcement by US president Donald Trump that a peace deal would be signed on Sunday.
“The Deal is scheduled to get signed tomorrow, and immediately after it is signed, the Hormuz Strait is OPEN TO ALL,” he wrote in a post on Truth Social.
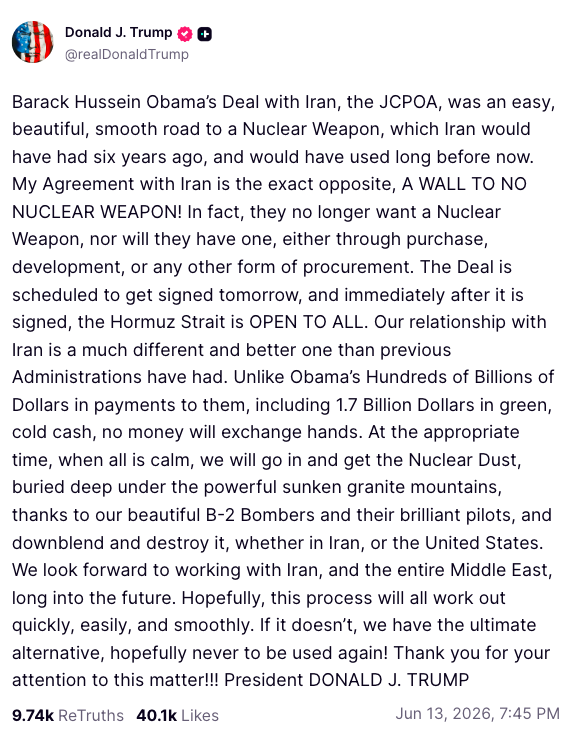
Source: Truth Social
Among traders, there was fresh hope that sell pressure on Bitcoin was easing as a result. Trader SuperBro noted that the 200-week simple moving average (SMA) was holding as support.
“In a word, constructive,” they summarized about low-time frame BTC price action in a post on X.
SuperBro dismissed concerns about a bearish breakdown pattern being in play, instead focusing on a point of control (nPOC) level on exchange order books above current spot price.
“$65K-$67K is a big test, at the last swing low and volume POC. If we can rip through this zone then the bear case takes a massive hit,” they concluded.
BTC/USD one-day chart. Source: SuperBro/X
Cointelegraph previously reported on misgivings about the 200-week SMA, which history had shown to be “unreliable” as a bear-market safety net.
Key BTC price setup “finally happening”
Continuing, trading account Cryptic Trades eyed a key combination of rising open interest and falling funding rates on exchanges.
Related: Bitcoin miner ‘capitulation’ comes as trader sees later 2026 bear-market bottom
“It’s finally happening,” it told X followers about what could support more sustainable BTC price strength.
Cryptic Trades suggested that current conditions showed a lack of belief on the part of bulls, removing the risk of new longs getting trapped before a new downturn.
“In other words, these aren’t longs aggressively chasing the move. These are bears doubling down, increasing their short positions, and betting that the downtrend isn’t over,” it explained.
“This is exactly the kind of setup that generally marks durable bottoms. The market starts moving higher, sentiment remains overwhelmingly bearish, and the most keep leaning the bearish. This is how aggressive short squeezes are born.”
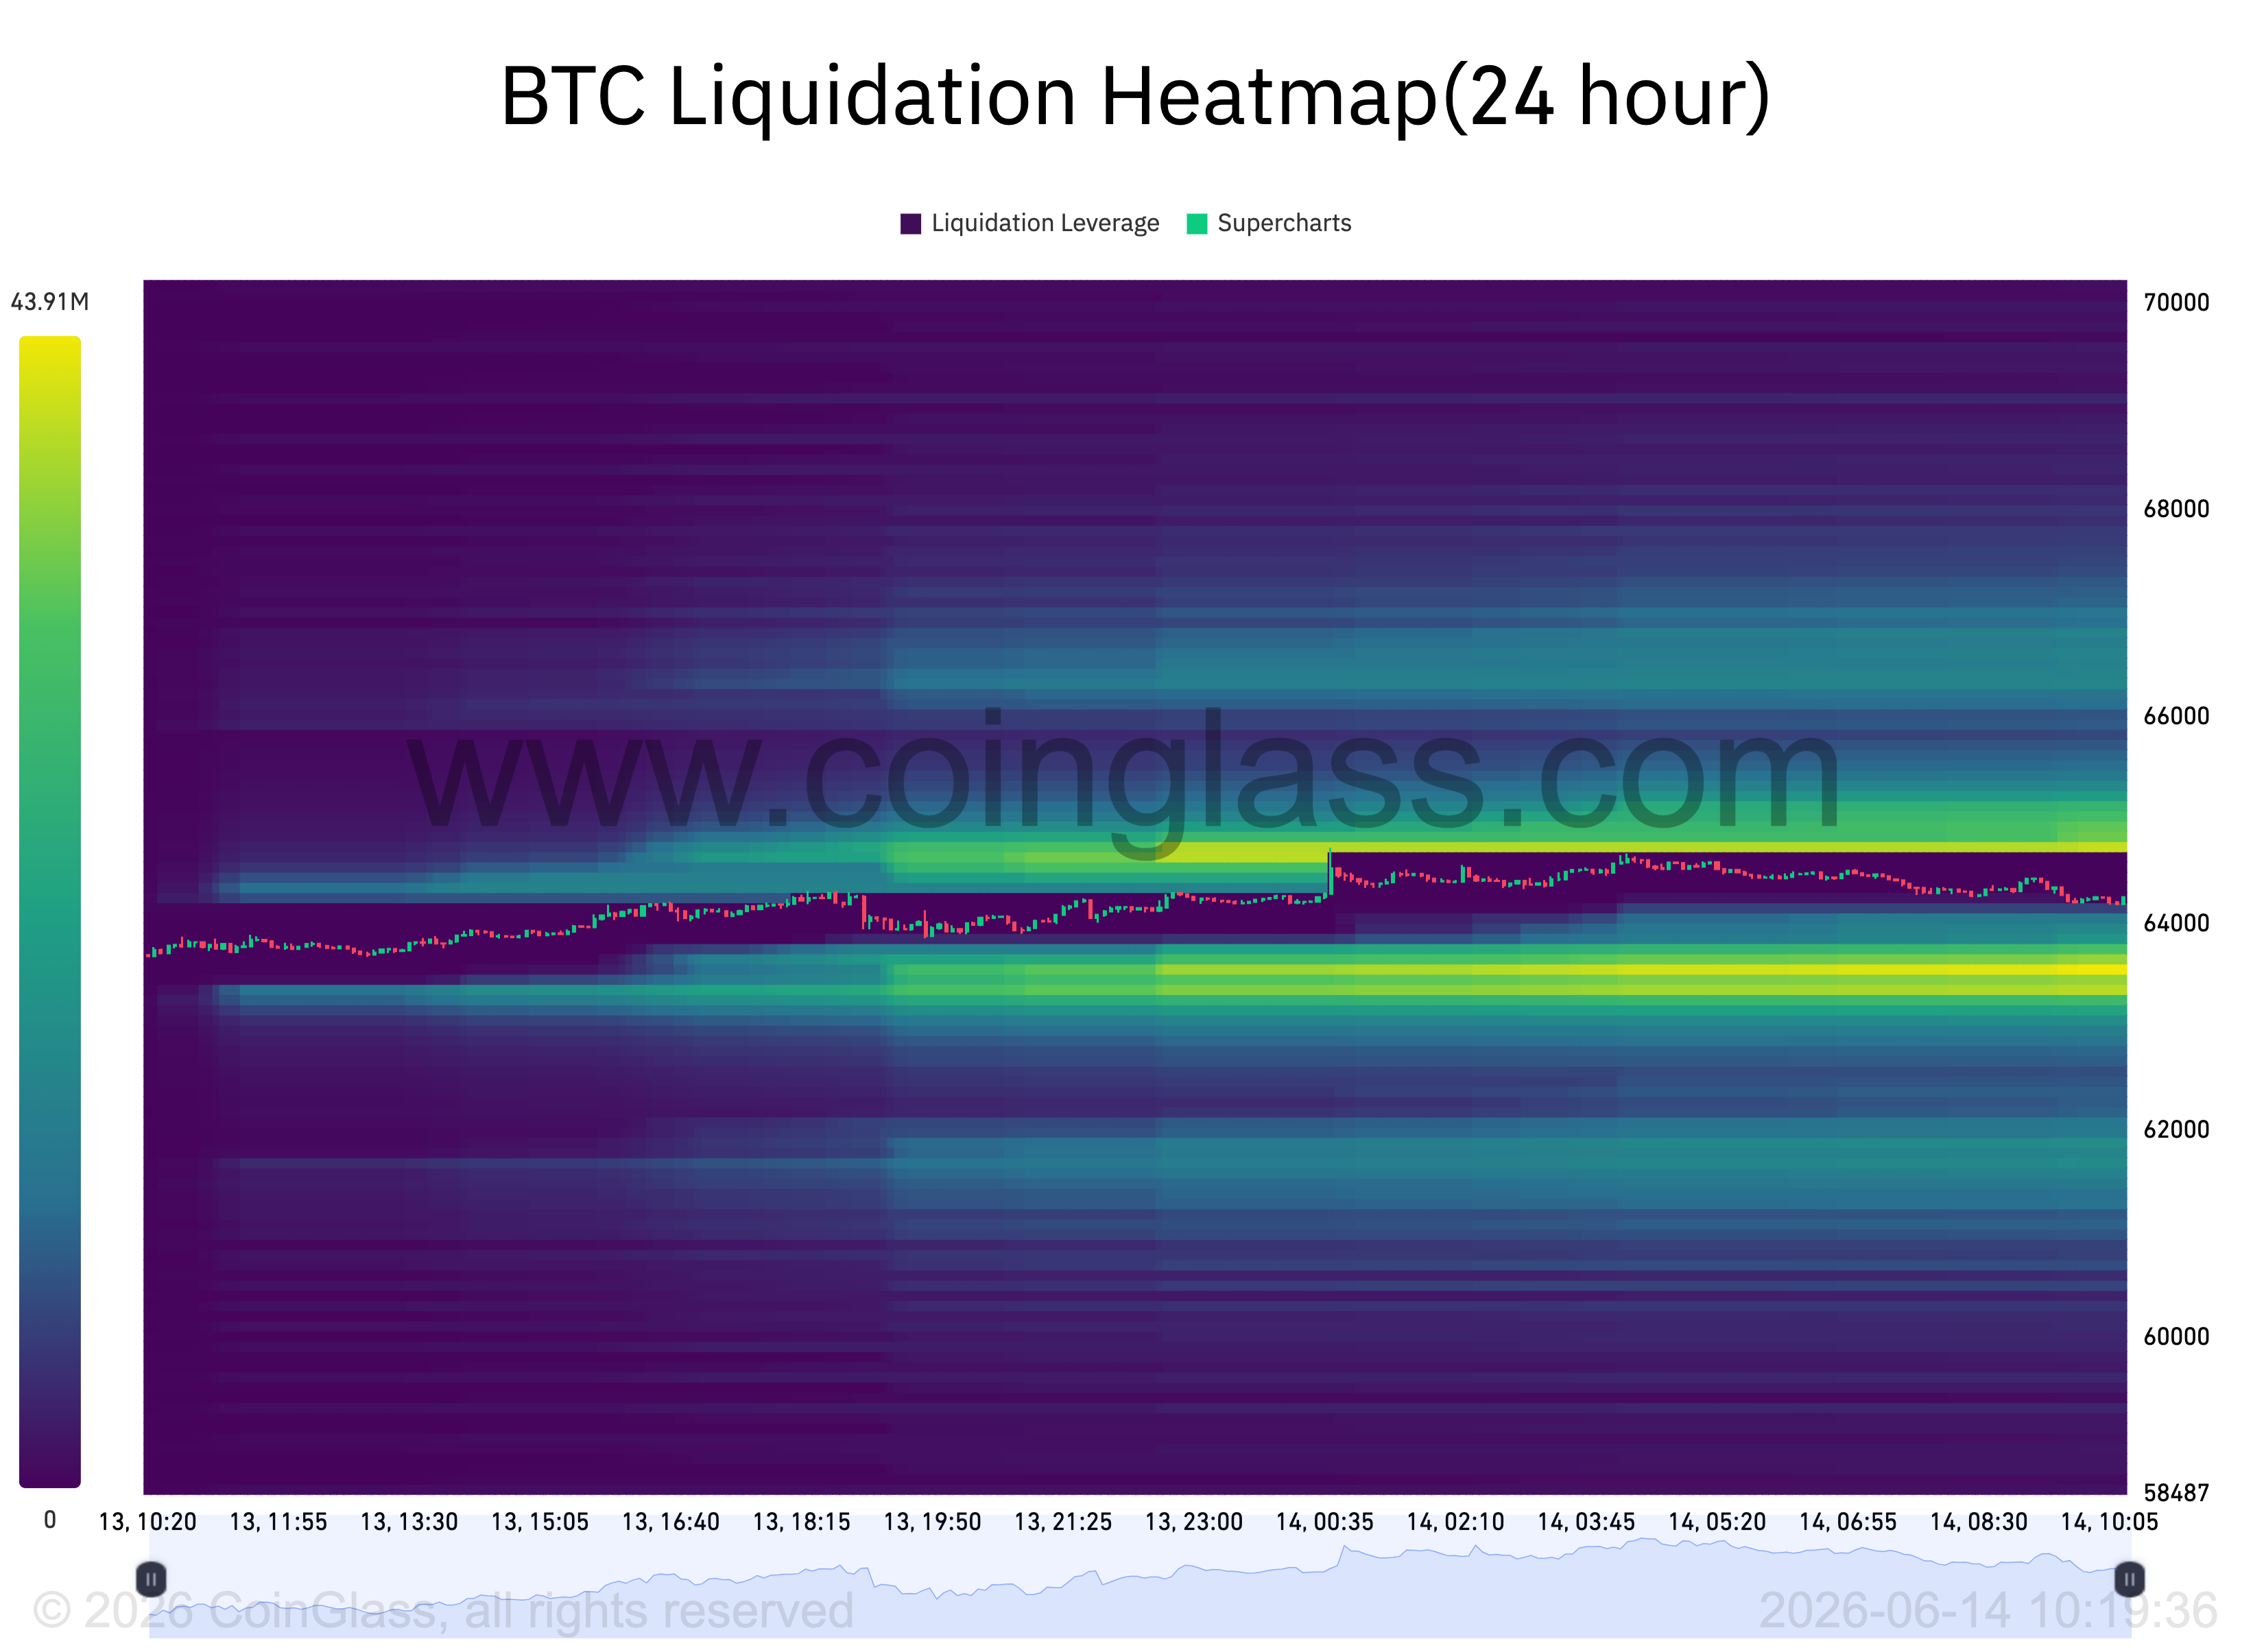
BTC liquidation heatmap. Source: CoinGlass
Data from CoinGlass showed that the local highs coincided with a large band of potential short liquidations.

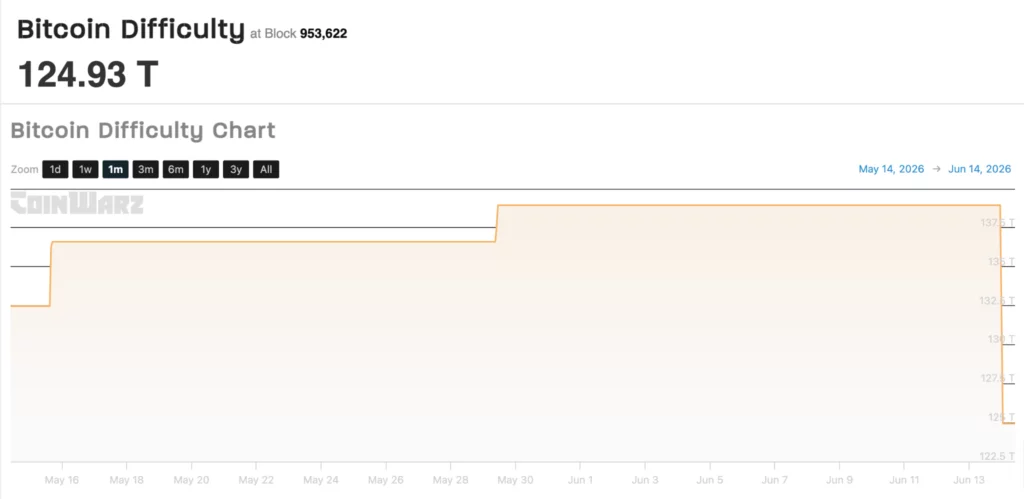
Bitcoin mining difficulty fell 10.09% after lower prices pushed weaker miners offline and slowed block production.
Summary
- Bitcoin’s 10.09% difficulty drop gave active miners more output after weaker operators paused machines offline.
- Galaxy Research tied the adjustment to June’s Bitcoin price slide and a longer mining epoch.
- Crypto.news reports show miners are redirecting power toward AI and high-performance computing revenue streams globally.
Bitcoin difficulty records sharp June drop
Bitcoin completed one of its largest downward mining difficulty changes at block 953,568. Galaxy Research data cited by WuBlockchain showed the difficulty fell from 138.96T to 124.93T. The move ranked as Bitcoin’s 11th-largest downward adjustment and the second-largest drop recorded so far this year.
Mining difficulty controls how hard miners must work to add new Bitcoin blocks. It changes every 2,016 blocks to keep the network close to a 10-minute block time. When miners leave the network and blocks arrive too slowly, the system lowers difficulty so active miners can find blocks more easily.
Miner margins tightened after Bitcoin price weakness
The adjustment followed a weak start to June for Bitcoin. Galaxy Research said Bitcoin’s price fell about 15% during the month, which cut miner revenue and forced some operators to switch off less efficient machines.
“Bitcoin completed its 11th-largest downward difficulty adjustment,” WuBlockchain reported, citing Galaxy Research.
The longer mining cycle showed the scale of the slowdown. The previous epoch lasted 15.6 days instead of the usual target of about 14 days. That delay showed that less hashrate was competing for rewards before the network reset difficulty lower.
During that stretch, the network produced blocks slower than planned, which is the condition that triggers a downward retarget under Bitcoin’s rules for miners.
Active miners may see better output
TheEnergyMag had earlier expected difficulty to fall by about 9.55%. The final adjustment came in deeper, at 10.09%. That drop may allow miners still running machines to produce more Bitcoin with the same active hashrate. It may also lift hashprice, or miner revenue per unit of computing power, back above $30 per PH/s.
The relief may not help every operator equally. Miners with newer machines and lower power costs are better placed to gain from lower difficulty. Older rigs remain exposed if Bitcoin prices fall again or energy costs stay high. The adjustment gives miners breathing room, but it does not remove pressure from tight margins.
AI data centers compete for mining power
The hashrate decline also comes as more mining firms move power capacity toward high-performance computing and AI data centers. Crypto.news has reported several examples of this shift. Core Scientific plans to turn its Pecos, Texas Bitcoin mining site into a large AI data center campus, including the repurposing of 300 megawatts of mining power.
TeraWulf also showed how the business mix is changing. The company reported $21 million in HPC hosting revenue in the first quarter of 2026, above its Bitcoin mining revenue for the same period. HIVE Digital has also announced a 320 MW AI infrastructure project near Toronto that is designed to host more than 100,000 GPUs.

Historical on-chain data suggest that bitcoin (BTC) may be nearing a bottom in this bear market, but demand conditions signal the asset still has a long way to go.
According to this week’s CryptoQuant report, the unfavorable spot and speculative futures demand conditions leave the BTC bottom unconfirmed. Either BTC significantly recovers in the coming weeks or the asset plunges to lower price levels.
Is BTC Near a Bottom?
Following the decline to a fresh bear market low of $59,000 last week, BTC now hovers roughly 9% above its realized price of $53,600. Analysts say this valuation level has historically been associated with bear market bottoms across past cycles. The realized price also represents the aggregate on-chain cost basis of all market participants, marking one of the most crucial valuation anchors in Bitcoin’s on-chain framework.
Past bear seasons always ended at prices near or marginally below the realized price. The only time BTC briefly pierced the realized price before a structural rebound was in November 2022 during the defunct crypto exchange FTX saga. So, from a valuation perspective, BTC may be close to a structural floor where accumulation phases began.
While on-chain data suggests an optimistic outlook, demand conditions suggest otherwise. It is a no-brainer that BTC needs strong, sustained demand to handle a structural rebound. With both speculative and apparent spot demand in contraction, the bullish reversal may take time to develop.
Total demand from both speculative futures and apparent spot fell to -652,000 last week, marking the largest contraction since January 2022. Even long-term spot demand, which is the apparent demand growth seen in a year, has turned negative and fallen to its most severe level since February 2024.
Demand Conditions Unfavorable for Bullish Reversal
The spot ETF market, on the other hand, is contracting at the fastest pace since the launch in January 2024. The 30-day ETF demand growth is currently at an unprecedented negative reading, according to analysts. This shows that U.S. institutional demand has stalled and even reversed to net selling, contributing to supply expansion.
In addition, realized losses from Bitcoin holders have not reached capitulation levels. The absence of a capitulation spike indicates that sellers are not yet exhausted.
“Until total demand stabilizes, ETF flows recover, and realized losses reach capitulation-level peaks, the current price level should be interpreted as a valuation floor candidate, not a confirmed cycle bottom,” CryptoQuant concluded.
The post Bitcoin Nears Potential Bottom, But Demand Conditions Remain Unfavorable: CryptoQuant appeared first on CryptoPotato.


Michael Saylor, founder and chairman of Strategy, said Bitcoin treasury firms need more than one measure to track their exposure to Bitcoin.
Summary
- Saylor says CEBE BPS shows Bitcoin exposure after debt and preferred stock claims are counted.
- BPS tracks common equity growth, while BTC Yield measures execution across Strategy’s Bitcoin accumulation plan.
- Shorter liabilities raise CEBE’s role, while lower-cost long-term claims can support Bitcoin upside per share.
In a set of posts on X on June 14, he drew a line between Bitcoin Per Share, or BPS, and Common Equity Bitcoin Exposure BPS, also called CEBE BPS.
“BPS measures Bitcoin per common share before senior claims. CEBE BPS measures Bitcoin per common share after senior claims,” Saylor wrote.
He added that CEBE is the conservative risk metric, while BPS tracks common equity growth. He also said BTC Yield measures BPS execution. The explanation aimed to separate growth math from balance sheet risk.
Debt changes how investors read Bitcoin exposure
The comments focused on how debt, preferred stock, and other senior claims can change the value left for common shareholders. In Saylor’s framing, BPS shows the amount of Bitcoin linked to each common share before those claims. CEBE BPS shows the amount after those claims.
Saylor said liability duration matters. “The shorter the liability duration, the more CEBE matters. The longer the duration, the more BPS matters,” he wrote. He said CEBE BPS would carry more weight if claims came due today. BPS would better show equity upside if Bitcoin grows faster than dividend costs.
Amplification can help or hurt shareholders
Saylor also introduced amplification as the gap between BPS and CEBE BPS. He said that without debt or preferred stock, BPS and CEBE BPS would be the same, and a Bitcoin treasury company would track Bitcoin in a way closer to an ETF.
He said higher liabilities can make the two metrics diverge. That structure can raise returns if Bitcoin grows faster than the cost of capital. It can also increase risk if the company uses short-term or expensive claims. “Not all liabilities are equal, ” Saylor wrote. The claim places funding terms at the center of any Bitcoin treasury model.
Strategy’s recent moves add market context
The remarks came after a volatile period for Strategy and its Bitcoin treasury model. As crypto.news reported, Strategy sold 32 BTC between May 26 and May 31 at an average price of $77,135, raising about $2.5 million. The sale marked its first reported Bitcoin sale since December 2022.
Moreover, the sale drew attention because Strategy has long presented Bitcoin as its main treasury reserve asset. The amount represented a small share of its holdings, but the event increased market focus on preferred stock dividends, cash needs, and the balance between Bitcoin growth and funding costs.
Funding costs remain central to the debate
Strategy later raised about $181 million through MSTR share sales and bought 1,550 BTC for about $101.3 million, as previously reported. The company’s Bitcoin holdings rose to 845,256 BTC, while its cash reserves increased to about $1 billion.
Those figures make Saylor’s new explanation timely. His comments point investors toward a broader reading of Bitcoin treasury firms, where total Bitcoin holdings, Bitcoin per share, senior claims, liability duration, and capital costs all shape common shareholder exposure.
Meanwhile, his main message was that CEBE BPS tracks risk, while BPS tracks growth. For common shareholders, the difference rests on whether Bitcoin appreciation can cover liability costs over the full financing cycle across calm and stressed markets.

Japan Three Biggest Banks Unite to Launch Yen Crypto Stablecoin by March 2027

20,000 gather in Belfast to denounce violent racist pogroms

Grange: Knicks snap drought with one of NBA’s most impressive playoff runs


-

 NewsBeat6 days ago
Alexander Zverev wins the French Open to finally earn a 1st Grand Slam title
-

 Crypto World6 days ago
Anatomy of the June crypto crash: Fed, Iran, Saylor
-

 Crypto World3 days ago
Oppenheimer backs SpaceX as $70 billion retail frenzy builds
-
 NewsBeat7 days ago
Alexander Zverev conquers demons and outlasts Flavio Cobolli to win French Open for first major title
-

 Crypto World3 days ago
Markets Rally as SpaceX IPO Looms Amid Iran Tensions and Inflation Surge
-

 Business6 days ago
High Stakes for Wembanyama as New York Pushes for 3-0 Lead
-

 Tech6 days ago
Notion restores access to Anthropic after service disruption
-

 Sports6 days ago
FIFA WC 2026 Group C: Morocco, Scotland challenge Brazil’s hunt for glory | FIFA World Cup 2022
-
 Crypto World6 days ago
Eli Lilly (LLY) Stock Surges 4% Following Breakthrough Sleep Apnea Trial Results
-

 Crypto World7 days ago
Trump’s AI Ownership Plan Could Benefit Anthropic at OpenAI’s Expense
-
 Sports5 days ago
Bangladesh beat Australia after 20 years in ODIs, register only their second win over six-time world champions | Cricket News
-

 Fashion2 days ago
Weekend Open Thread: Tuckernuck – Corporette.com
-

 Tech1 day ago
NanoClaw integrates JFrog registries to secure AI agent downloads
-

 Crypto World1 day ago
Bitget enters Argentina’s regulated crypto market through PSAV registration
-

 Tech2 days ago
This Week In Security: Microsoft On Microsoft, Register Your Domains, Linux On ARM, And FreeBSD Joins The File Cache Club
-

 Politics3 days ago
Politics Home | Healey Resignation Is “Colossal Failure Of Government”, Says Former Labour Defence Secretary
-

 Sports3 days ago
First Time Since 1971: Australia Register Historic Low In ODI Cricket
-
 Entertainment3 days ago
Donnie Wahlberg & More Heat Up Las Vegas at Circa’s Barry’s Downtown Prime
-

 Entertainment5 days ago
The Ryan Gosling True Crime Thriller On Netflix That Gets Even Stranger, Stream It Now
-

 Tech4 days ago
‘This is Seattle’s position on AI’: City Council votes unanimously to pause big new data centers
You must be logged in to post a comment Login