

Crypto World
Is a Breakout to $2.24 Next?
Most XRP investors are back in profit, increasing the chance for a rally to $2.24, but bulls must first hold the price above $1.40.
XRP’s (XRP) 28% rebound from its macro low at $1.12 pushed it above its realized price. In other words, the average XRP holder is no longer in the red.
Is this enough fuel for the bulls to push the altcoin’s price to $2.24?
Key takeaways:
XRP trades above its cost basis
Data from TradingView shows the XRP/USD pair trading at $1.44, up 1.6% over the last 24 hours and 5% over the last seven days.
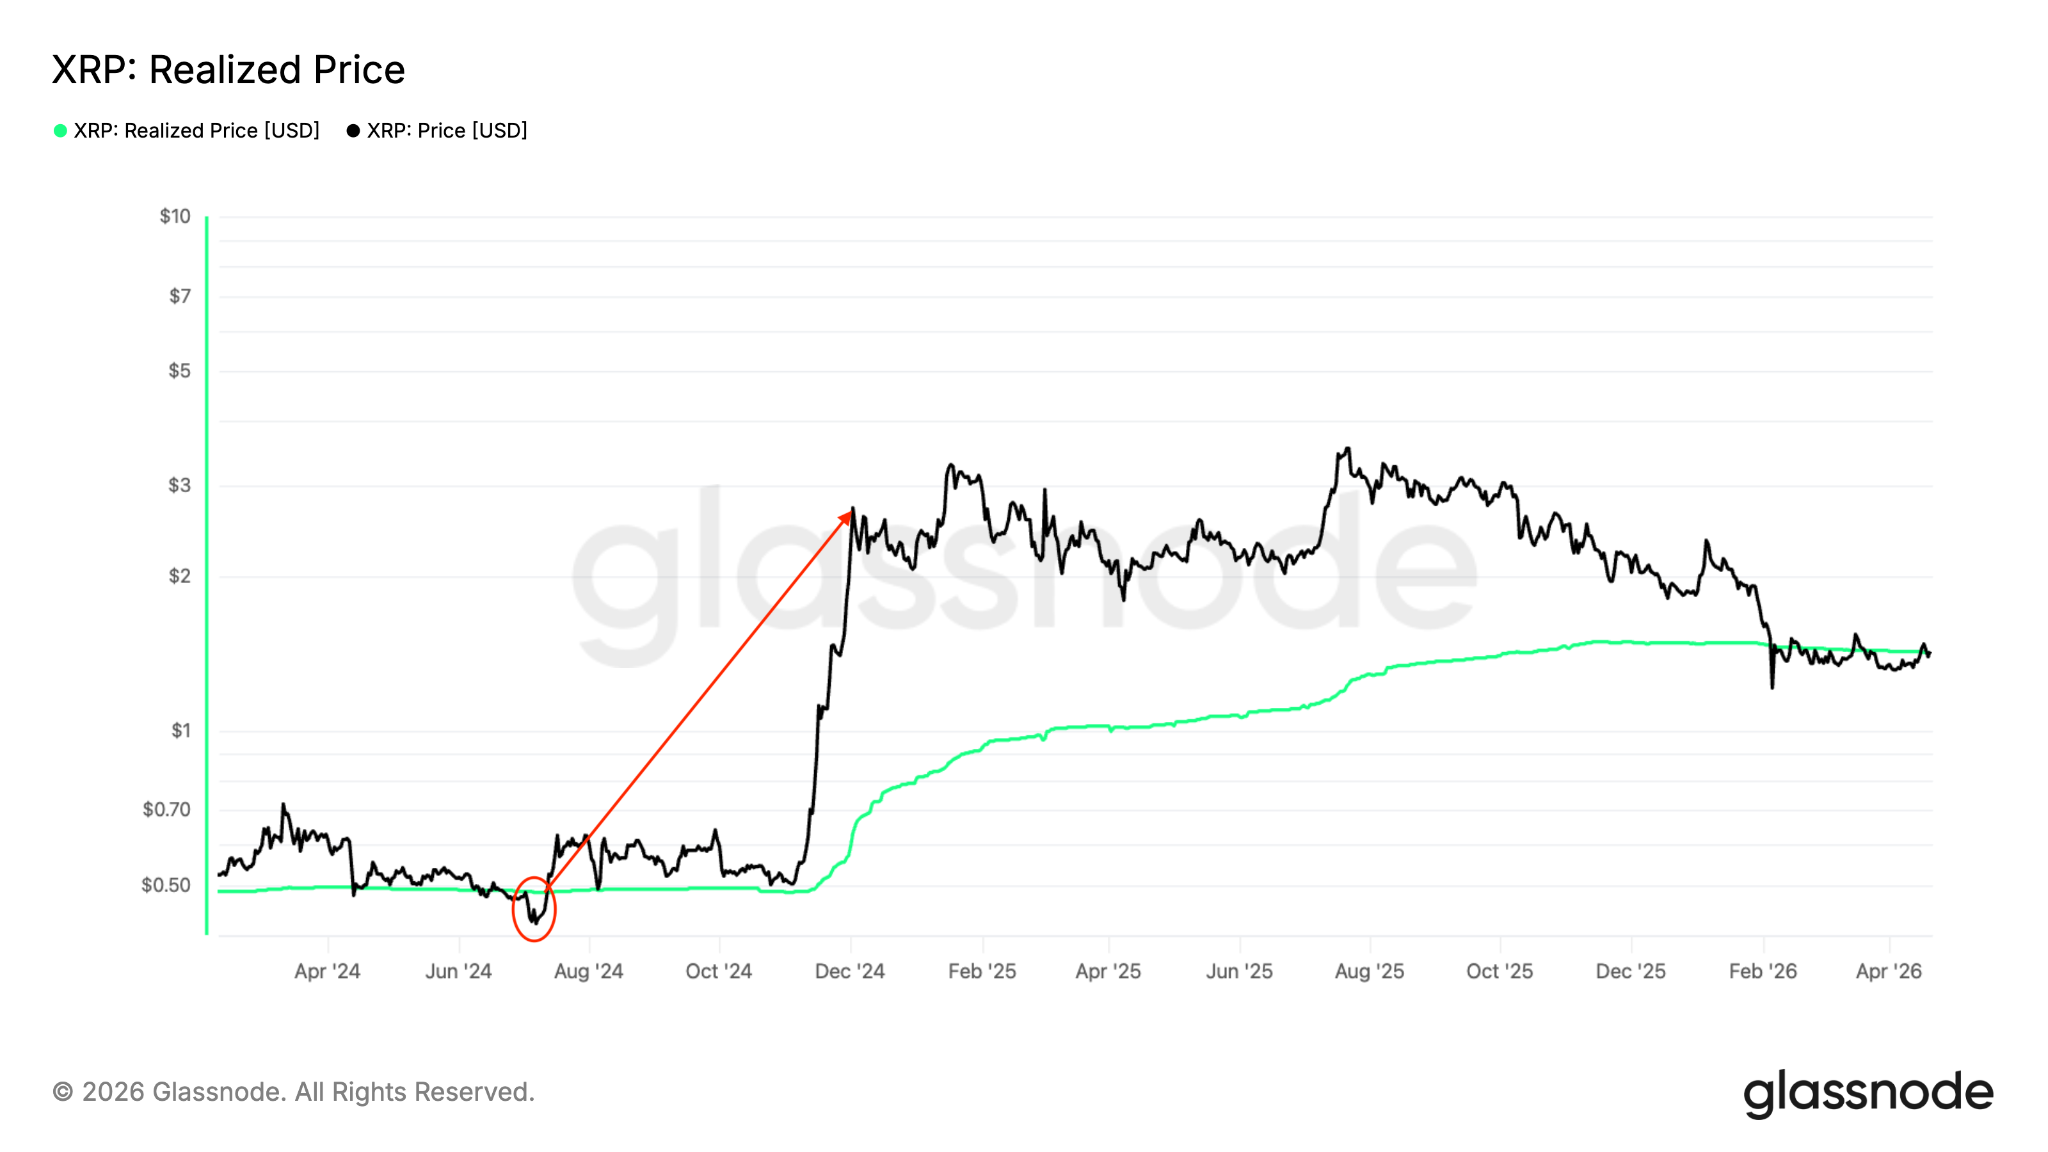
This means XRP is holding above its realized price, the average cost of all coins based on when they last moved, currently at $1.41, according to data from Glassnode.
The average XRP holder returning to profit after unrealized losses provides meaningful financial relief for many holders, signaling a bullish outlook.
Related: XRP price bottom signals emerge after the altcoin holds key support level
Historically, breaking above this level shifted market sentiment from “fear,” reducing sell pressure from underwater holders and encouraging holding.
The chart below shows that when the price reclaimed its realized price after hovering below it for a few months in mid-2024, it rallied 460% to $2.90 from $0.52.

Holding above $1.40 is crucial for the bulls to ensure a potential upward breakout.
On the upside, the key levels of resistance to watch out for are the 111-day moving average (MA) at $1.57, the 200-day MA at $1.88 and the 365-day MA at $2.22, based on XRP’s technical pricing model.

XRP’s symmetrical triangle targets $2.40
XRP has been consolidating within a symmetrical triangle for more than two months, as shown in the chart below.
The XRP/USD pair must break and close above the upper trend line of the triangle at $1.46 to continue the upward trajectory.
The measured target of the pattern, calculated by adding the triangle’s height to the breakout point, is $2.24, 55% above the current price.

Technical analyst and trader ChartNerd said the moving averages between $1.35 and $1.40 “need to be held” to keep the bullish outlook in play.

As Cointelegraph reported, buyers will have to achieve a daily candlestick close above the upper trendline of a descending parallel channel at $1.60 to confirm a potential trend change.
This article is produced in accordance with Cointelegraph’s Editorial Policy and is intended for informational purposes only. It does not constitute investment advice or recommendations. All investments and trades carry risk; readers are encouraged to conduct independent research before making any decisions. Cointelegraph makes no guarantees regarding the accuracy or completeness of the information presented, including forward-looking statements, and will not be liable for any loss or damage arising from reliance on this content.

Crypto World
Bitcoin and Ethereum Arrive on Wall Street Giant Charles Schwab for Selected Retail Clients

Charles Schwab has started rolling out its new Schwab Crypto accounts to retail clients, allowing users to trade Bitcoin and Ethereum directly through the platform alongside traditional investments, starting Tuesday.
The offering is currently available to most residents in the United States, although residents of New York, Louisiana, and US territories are excluded at this stage. Schwab Crypto accounts are also not yet available to international users.
Schwab Crypto Rollout
According to the announcement, the first group of eligible clients can begin accessing crypto trading. To open a Schwab Crypto account, users must already have an eligible brokerage account with the company. Supported account types include individual and joint brokerage accounts, while additional requirements such as jurisdiction-based eligibility also apply.
Schwab Premier Bank serves as the custodian for the latest offering, while Paxos will manage trade execution and sub-custody services. As per the FAQs page, Schwab Crypto plans to charge a 75-basis-point trading fee.
The rollout comes as the brokerage and banking firm continues expanding its presence in the crypto market. Last month, Charles Schwab introduced a dedicated crypto-focused page on its website under the “Schwab Crypto” branding, in a bid to expand its offerings for retail investors seeking direct exposure to digital assets.
Founded in 1971, Charles Schwab manages roughly $12 trillion in assets and is considered one of the largest banking and financial services organizations in the United States. But despite the major TradFi expansion into crypto, there have been no visible changes in the price of the two top assets as Bitcoin remained near $80,000, while Ethereum traded around $2,300.
Schwab 1Q Results
Charles Schwab posted a net income of $2.5 billion in the first quarter of 2026. After excluding certain transaction-related expenses, adjusted profit rose to $2.6 billion, while adjusted earnings per share increased 38% year-over-year to $1.43.
Meanwhile, quarterly revenue was up 16% to $6.48 billion. Client assets reached $11.77 trillion by the end of March, up 19% from a year earlier. Additionally, the company recorded $140 billion in core net new assets during the quarter and opened 1.3 million new brokerage accounts, which pushed total client accounts to 47.2 million.
The post Bitcoin and Ethereum Arrive on Wall Street Giant Charles Schwab for Selected Retail Clients appeared first on CryptoPotato.


- Tron (TRX) price is trading above $0.35 as the latest upward move adds to recent gains.
- The altcoin’s higher price action and network activity show marked divergence.
- Can TRX continue the uptick, or are bulls set for trouble amid a sharp reversal?
TRON (TRX) is among the stronger-performing altcoins on the day, posting modest gains as the token retests the key $0.35 resistance level amid a broader recovery across the crypto market.
Intraday data shows TRX trading volume declining 13% to about $639 million, suggesting softer market participation despite the price uptick.
The token’s ability to hold near current levels mirrors broader sentiment across major cryptocurrencies, with Bitcoin and Ethereum also maintaining important support zones.
However, analysts note that TRX’s price advance contrasts with weakening network activity metrics, a divergence that could point to potential downside risks if momentum fades.
TRX price outlook – overbought danger?
TRON is up about 23% year-to-date, making it one of the stronger-performing major altcoins over that period.
The token has continued to climb since rebounding from lows near $0.26 in early February.
Bulls are now testing resistance around $0.35, with traders watching for a possible move toward highs last seen in 2024.
Despite the strong performance, short-term technical indicators are beginning to show signs of caution.
The Relative Strength Index (RSI) has moved into overbought territory, a condition often associated with slowing momentum or potential reversals in momentum-driven markets.
Meanwhile, the MACD remains in bullish territory, although the indicator is beginning to show signs of weakening momentum.

CryptoQuant’s latest analysis highlighted this vulnerability, pointing to the stark divergence between price action and network activity.
According to the analysts, the TRX price surges in the past weeks have not aligned with on-chain activity.
For instance, the “Tokens Transferred (Total)” metric shrank from 17.3 billion to 12.2 billion, indicating reduced network utility. Prices bounced higher during this period.
“Typically, a healthy and sustainable price rally is validated by increasing network activity and utility. This glaring divergence suggests that the current upward momentum to $0.35 is not supported by actual on-chain usage. It implies that the recent price action might be driven more by speculation or hoarding rather than organic network activity,” CryptoQuant noted.
TRON experienced an 11% decline in the TRX burn ratio during Q1 2026, as users shifted toward staking rather than burning tokens for transaction fee discounts.
External factors, including ongoing scrutiny of founder Justin Sun, may further embolden bears if sentiment sours.
In the short term, key support levels cluster around $0.32-$0.29, which is where the 100-day and 200-day exponential moving averages currently hover.
A decisive break above $0.36 could validate the rally toward $0.40. Tron hit its all-time high price above $0.44 in December 2024.


Xandeum today launched Oxorro, a storage platform built so that the data stored on it remains accessible even if Oxorro itself disappears.
The premise is unusual. Most storage products are designed around the assumption that the provider will still be there when the customer needs the data. Oxorro is designed around the assumption that the provider might not be, and that the customer should not have to care.
In May 2024, Google Cloud accidentally deleted UniSuper’s private cloud subscription, cutting off access for more than 620,000 pension fund members. Recovery depended on backups that happened to exist elsewhere. Most organizations do not have that kind of fallback. Oxorro is built so they do not need one.
“Every storage vendor in the world will tell you their service is reliable, and most of them are right, most of the time,” said Bernie Blume, founder and CEO of Xandeum. “We are not in that business. We are in the business of making sure that when something does go wrong, whether it is a vendor failure, a policy change, or a jurisdiction shift, the data is still there, still accessible, and still under the customer’s control. We call it Unstoppable Operational Data, and we built Oxorro to deliver it.”
Oxorro presents to users as a familiar file system, with directories, files, permissions, and real-time read and write access. It is designed to work alongside existing infrastructure rather than replace it, so organizations can route the operational data that matters most through Oxorro while leaving the rest of their stack untouched.
Additional information is available at website
About Xandeum
Xandeum is building scalable, smart contract-native storage infrastructure designed to support decentralized applications with large-scale, flexible, and programmable data. Its technology enables a new category of storage-enabled applications intended for real-world operational use.
The post A Storage Layer Designed to Survive Its Own Provider, Now Live appeared first on BeInCrypto.
Bitcoin may have a roughly 77% chance of reaching new all-time highs within a year if historical BTC price patterns repeat.
Key points:
- Bitcoin reduces its drawdown from all-time highs from 50% to 35% with its rebound to $80,000.
- History shows that new all-time highs have come within a year during similar events.
- The Buffett indicator could be calling Bitcoin’s new $160,000 record highs in advance.
BTC price drawdown: Odds favor new all-time high
New research from network economist Timothy Peterson released on Tuesday shows what happens when BTC/USD claws back significant losses.
“I looked at every time Bitcoin went from a -50% drawdown to a -35% drawdown (the situation we are in today),” he revealed in a post on X.
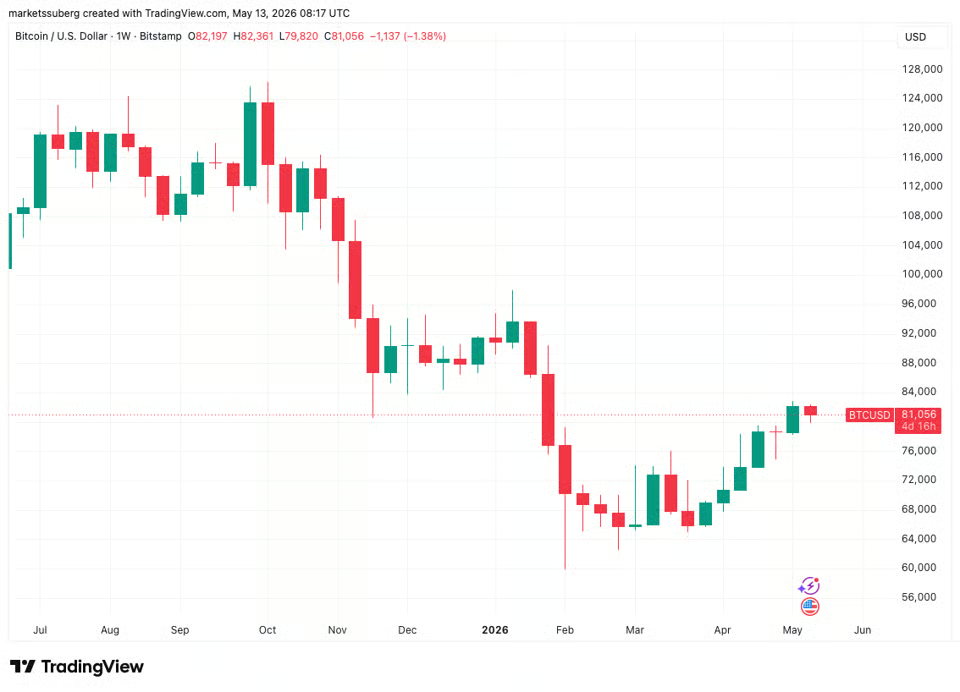
Bitcoin dipped below $60,000 in late February, a move that brought its drawdown versus its $126,200 all-time highs beyond 50%.
Since then, conditions have eased, and price currently trades around $81,000. Against its October 2025 peak, the pair is 35% lower, per data from TradingView.

BTC/USD one-week chart. Source: Cointelegraph/TradingView
As Peterson confirms in an accompanying chart, such moves have characterized price action throughout its past bear markets. What is more exciting for Bitcoin bulls, however, is what traditionally comes next.
He added that “7 out of 9 times it hit a new all-time high within a year.”

BTC price drawdown data. Source: Timothy Peterson/X
The last time that a similar recovery took place was at the end of the 2022 bear market, which saw a maximum drawdown of just over 70%.
Data from onchain analytics platform Glassnode shows that it took until December 2023 for that correction to become 35% against all-time highs from two years prior.
Bitcoin’s new record high then came in March 2024.

BTC price drawdowns from all-time highs. Source: Glassnode
Bitcoin “looks cheap” amid $160,000 target
Despite uncertainty over geopolitical and macroeconomic conditions going forward, Bitcoin is not without its bullish predictions this month.
Related: BTC price target becomes $85K next: Five things to know in Bitcoin this week
Examining Bitcoin versus gold, Matthew Sigel, head of digital asset research at VanEck, offered $160,000 per coin as a conservative estimate.
Sigel reported that the so-called Buffett indicator — the ratio of the total US stock market to GDP named after Warren Buffett — implies a BTC comeback move.
“Bitcoin looks cheap,” he told X followers on Monday.
“If it regains the 35x XBT/XAU cross implied by current levels of the Buffett Indicator, we’re looking at $160k, and that’s just catching up to where equities already are.”

BTC/USD versus Buffett indicator. Source: Matthew Sigel/X
Scalping is a trading style based on frequent transactions within short timeframes, often lasting only a few seconds or minutes. The objective is to capture small Scalping indicators are technical tools that signal entries and exits in forex and CFD markets. They are typically applied on 1-minute to 5-minute charts during very short-term trades. These forex scalping indicators process price, momentum, and volatility data into structured readings. They suit conditions defined by tight spreads, fast execution, and small price fluctuations.
Scalpers execute many trades over minutes or seconds, aiming to capture minor price moves in active markets. Technical indicators offer the structured signals needed to support these fast decisions. This article covers the main indicators for scalping and their application to intraday trading.
Common scalping indicators include:
- Exponential Moving Average (EMA): smooths recent prices to indicate trend direction.
- Hull Moving Average (HMA): a faster moving average designed to reduce lag.
- Relative Strength Index (RSI): a momentum oscillator measuring overbought and oversold conditions.
- Bollinger Bands: volatility bands set around a moving average.
- Stochastic Oscillator: measures the closing price relative to a recent trading range to identify momentum.
- MACD: compares two moving averages to identify momentum and trend direction.
Role of Indicators in Short-Term Execution
As you may know, scalping is a trading strategy where traders aim to take advantage of small price movements by executing numerous trades within short timeframes, often closing trades within a few minutes. This approach requires swift decision-making and precise timing.
Technical indicators may be important tools in this context, as they provide real-time data and insights into market trends, momentum, and volatility. Using these indicators, traders can identify optimal entry and exit points, potentially enhancing their ability to navigate the rapid pace of the market.
Below, we’ll break down five indicators for scalping. You’ll find these scalping indicators in MT4 and MT5, and TradingView. Also, you can get started in seconds with FXOpen’s TickTrader trading platform.
Indicators in scalping are typically used for:
- Trend identification: spotting whether price is moving directionally.
- Entry timing: pinpointing moments to act on a setup.
- Volatility assessment: gauging how widely the price is swinging in real time.
Moving Averages

Moving averages (MAs) are considered by some to be the most popular indicator for scalping, smoothing out price data to help identify trends by calculating the average price over a specific period. In scalping, where quick decisions are crucial, certain types of moving averages can be useful.
Exponential Moving Average (EMA)
Unlike the Simple Moving Average (SMA), which assigns equal weight to all data points, the EMA gives more significance to recent prices, making it more responsive to current market movements. This responsiveness is advantageous for scalpers.
Common EMA settings for scalping include 5, 9, and 20 periods, depending on chart timeframe. For instance, a 9-period EMA reacts swiftly to recent price changes, potentially providing timely signals for entry and exit points. The EMA for scalping may also act as dynamic support or resistance during trending price action.
Hull Moving Average (HMA)
Developed by Alan Hull, the HMA further reduces lag. It does this by weighting recent prices more heavily and applying a different calculation. The result is a moving average that tracks price action more closely while smoothing noise.
Applying Moving Averages in Scalping
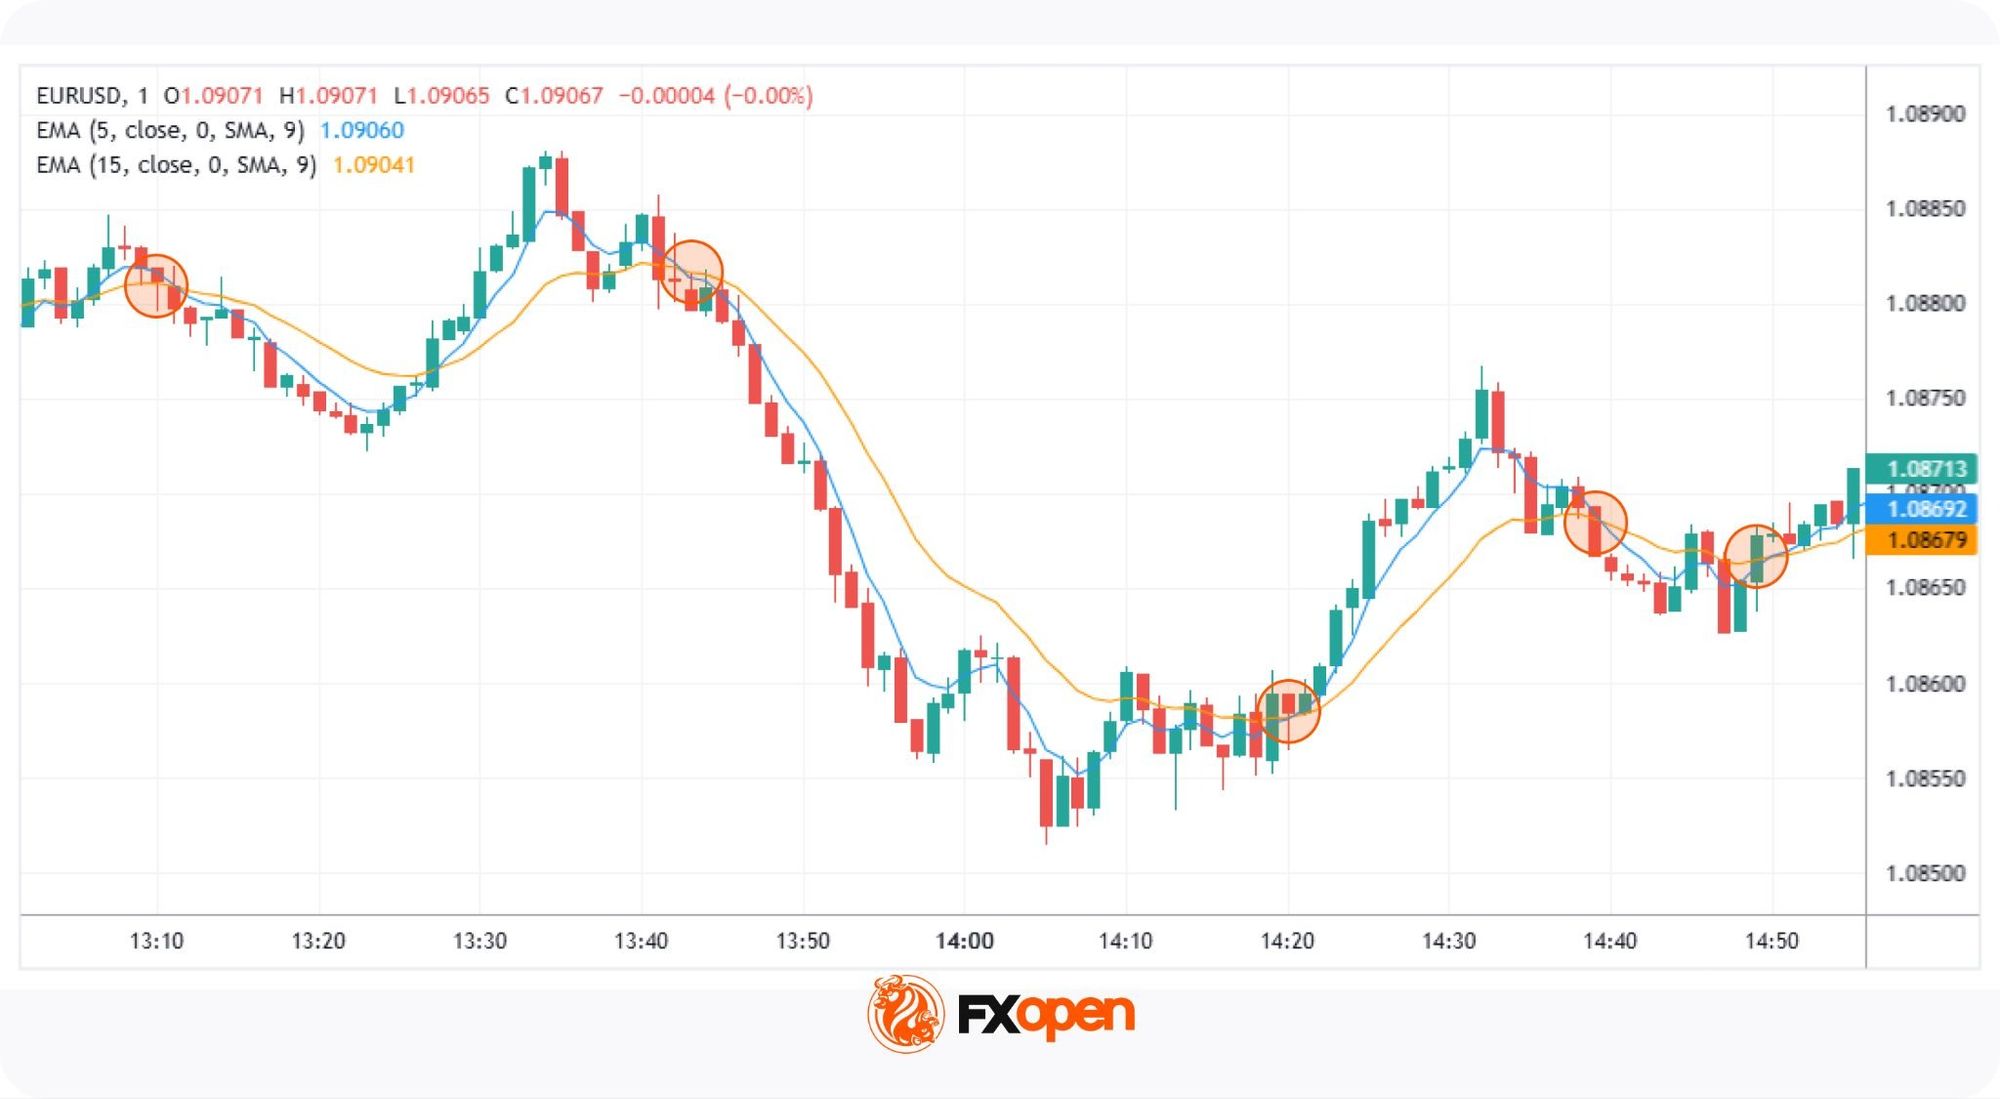
- Crossover Strategy: Scalpers often use two EMAs of different lengths. A common approach involves a fast EMA (e.g., 5-period) and a slow EMA (e.g., 15-period). When the fast EMA crosses above the slow EMA, it may indicate a bullish trend, suggesting an entry point for a buy trade or an exit point for a short trade. Conversely, when the fast EMA crosses below the slow EMA, it may signal a bearish trend, indicating a potential entry for a sell trade or moment to close a long trade.
- Trend Confirmation: The EMA and HMA can be used to confirm trends identified by other indicators. For example, if the moving average is sloping upwards, it may confirm an uptrend, supporting decisions to enter long positions. If it’s sloping downwards, it may confirm a downtrend, supporting decisions to enter short positions.
- Pullbacks: In trending markets, traders often monitor pullbacks to the EMA as potential continuation entries.
You can find these scalping indicators in TradingView and FXOpen’s TickTrader trading platform.
Relative Strength Index (RSI) in Scalping
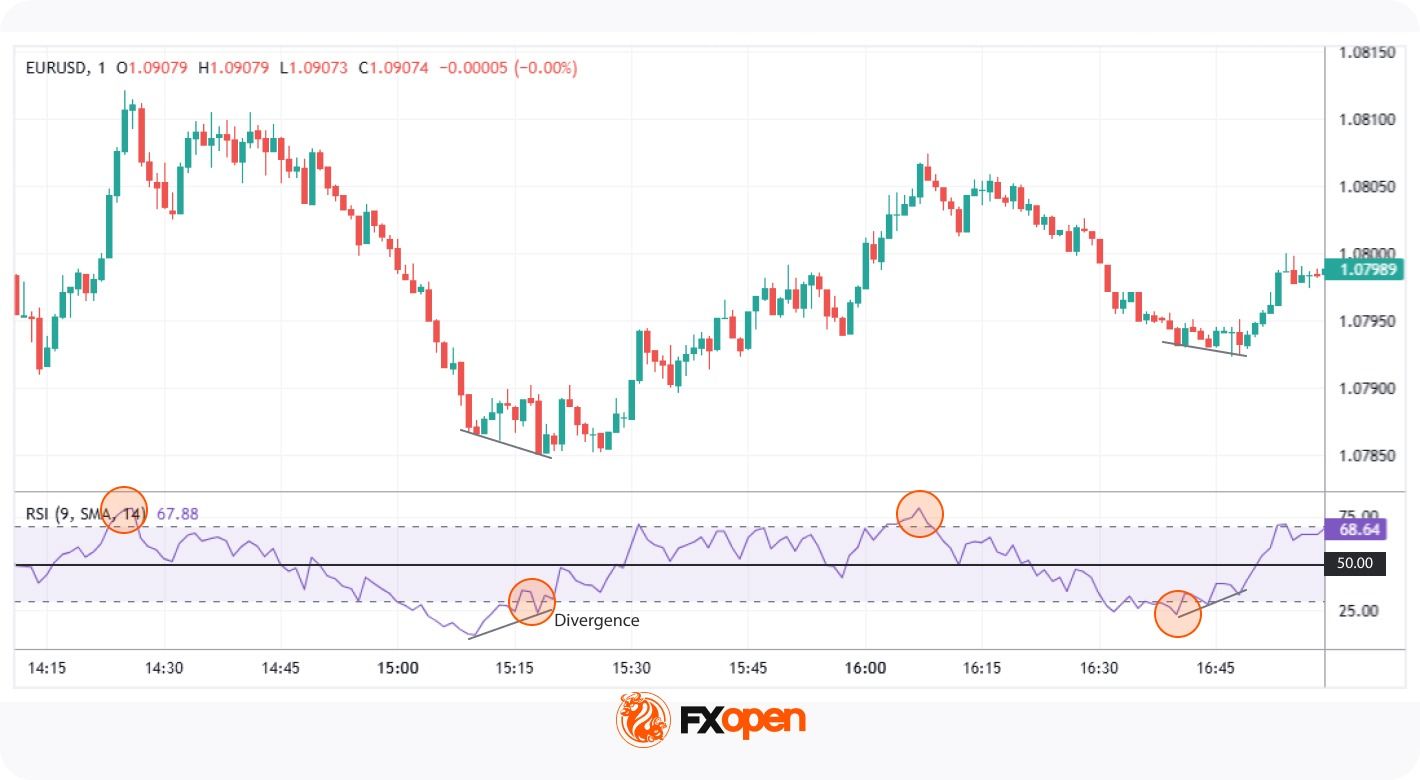
The Relative Strength Index (RSI) is a well-known scalping indicator that measures the speed and change of price movements, oscillating between 0 and 100. Traditionally, an RSI above 70 indicates overbought conditions, while below 30 suggests oversold conditions.
In scalping, traders often adjust the RSI from its typical length of 14 to shorter periods, such as 7 or 9, to capture rapid price swings occurring over minutes. This adjustment makes the RSI more sensitive to recent price changes, providing timely signals for quick trades. Shorter RSI scalping settings between 2 and 6 periods are also commonly used on very fast timeframes.
Applying RSI in Scalping
- Overbought/Oversold Levels: When the RSI moves beyond 70 or drops below 30, traders watch for potential reversal points. However, scalpers may focus on the RSI’s movement back into the 30-70 range as an early sign of momentum shifting.
- Divergences: Scalpers also look for divergence between price movement and the RSI. For example, if the price reaches a new high but the RSI does not, it may signal a weakening trend and possible reversal. This divergence may support traders in anticipating quick market shifts.
- Midpoint (50 Level): The 50 level serves as a midpoint, indicating the balance between gains and losses. An RSI crossing above 50 may suggest bullish momentum, while dropping below 50 can indicate bearish momentum. Scalpers use this midpoint to assess the prevailing market trend.
Bollinger Bands
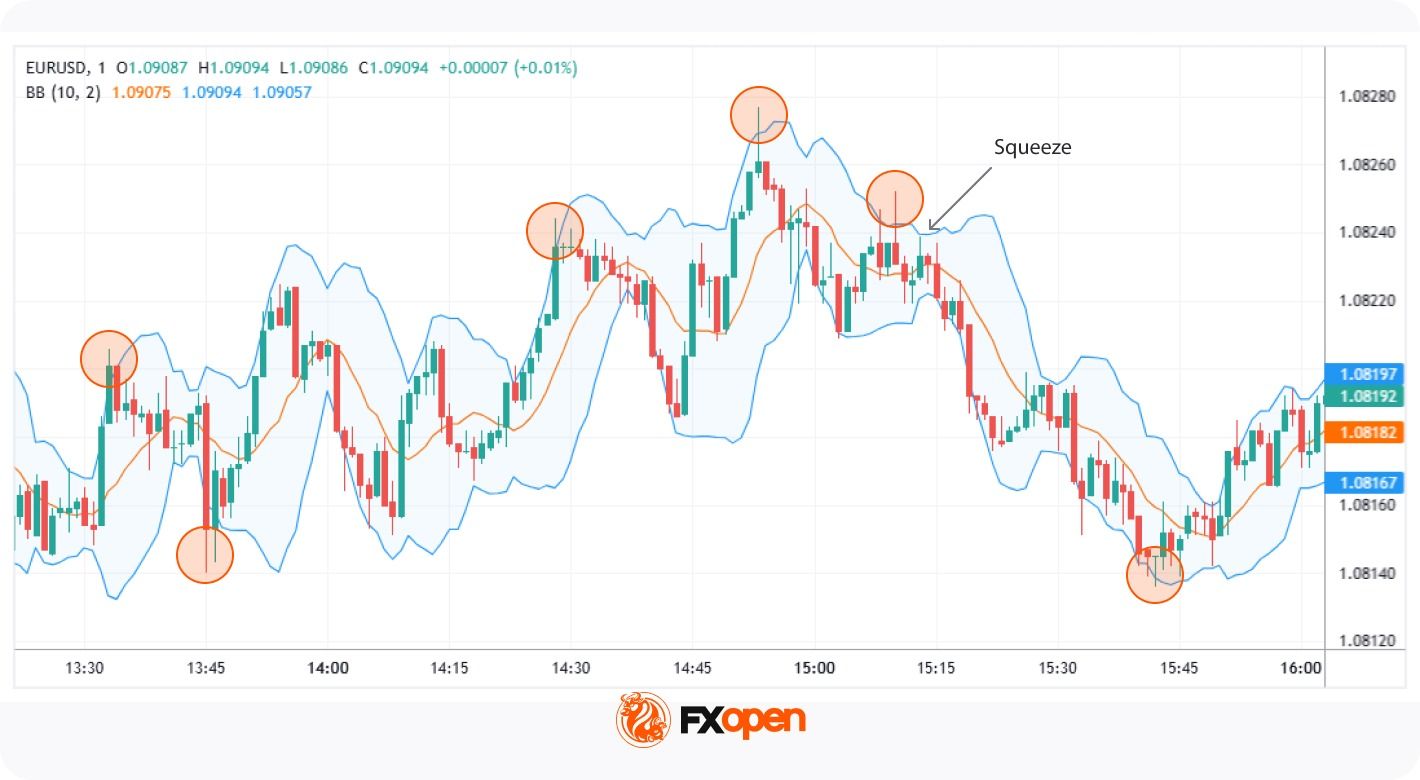
Bollinger Bands are a technical analysis tool comprising three lines: a simple moving average (SMA) in the middle, with upper and lower bands set at a specified number of standard deviations from the SMA. These bands expand and contract based on market volatility, providing a visual representation of price fluctuations. Squeeze conditions, where the bands narrow sharply, often precede expansion and stronger directional moves.
In scalping, traders often adjust Bollinger Bands scalping parameters to shorter timeframes, such as 1-minute or 5-minute charts, to capture quick price movements. A common approach involves setting the SMA period to 7-10 and the standard deviation to 1.5-2, potentially enhancing sensitivity to short-term market changes.
Applying Bollinger Bands in Scalping:
- Bollinger Squeeze: When the bands contract, indicating low volatility, it often precedes significant price movements. Scalpers watch for a breakout above or below the SMA. When the price breaks above the SMA, it may signal that the price will rise, and vice versa.
- Reversal: Price breaching the upper band may suggest overbought conditions, while below the lower band may indicate oversold conditions. Scalpers use these signals to anticipate potential price reversals.
Stochastic Oscillator
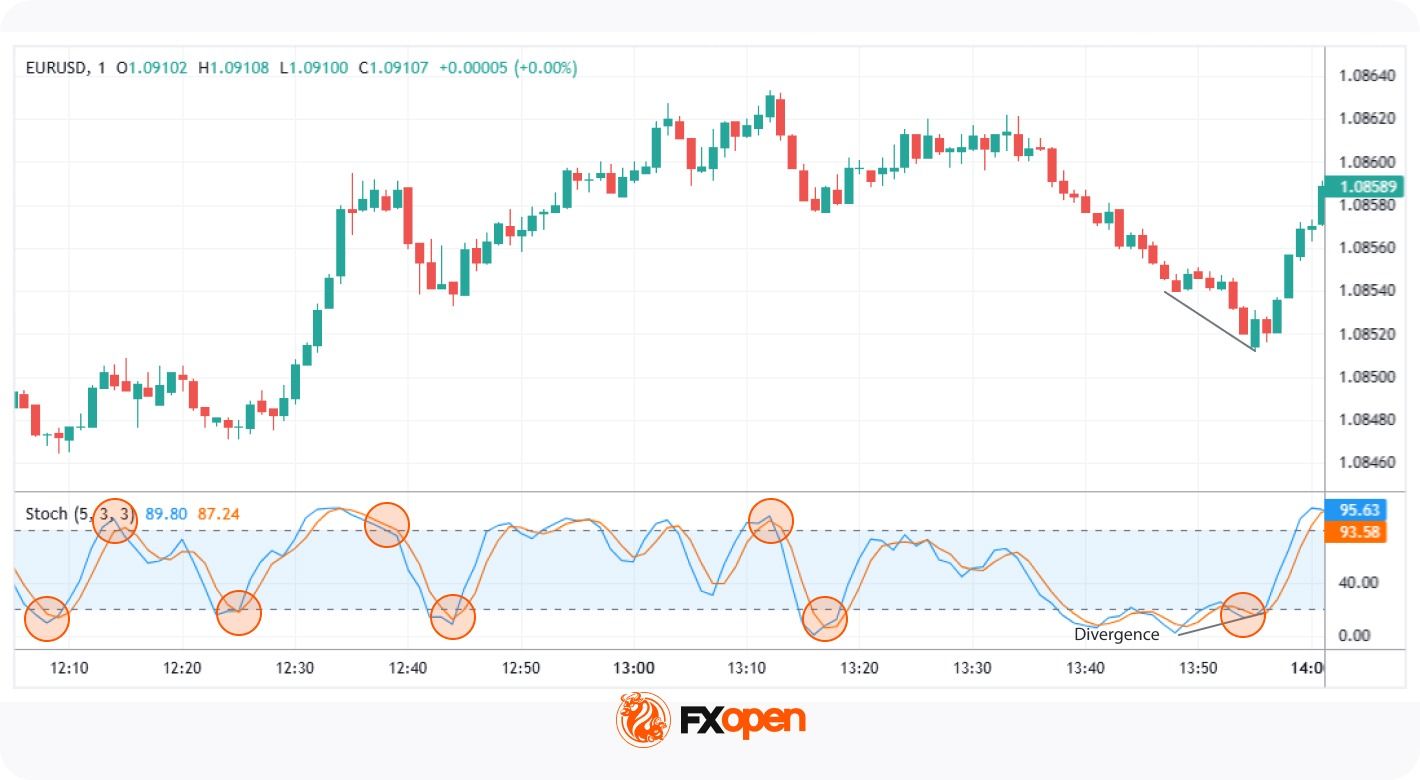
The Stochastic Oscillator is a momentum indicator that compares an asset’s closing price to its price range over a specific period, typically 14. It includes the %K line, the current closing price relative to the range, and the %D line, a moving average of %K. The scale runs from 0 to 100, where readings over 80 suggest overbought levels, and those under 20 point to oversold levels. The Stochastic Oscillator is more popular in range-bound markets than in strong trends.
In scalping, traders may adjust the Stochastic Oscillator to shorter settings, such as 5,3,3, to increase sensitivity to rapid price movements. This adjustment may help in capturing short-term market fluctuations.
Applying the Stochastic Oscillator in Scalping:
- Overbought and Oversold Conditions: When the %K line crosses the %D line in the overbought (above 80) or oversold (below 20) zones, it can signal a potential reversal. Scalpers use these crossovers as quick alerts for shifts in momentum, helping them to act swiftly in volatile markets.
- Crossovers: Besides extreme conditions, traders also monitor crossovers between %K and %D. A %K line crossing above %D from a lower level can suggest an upward move, while a downward crossover may hint at a short-term price decline.
- Divergence: If the price makes a new high/low but the Stochastic Oscillator does not, it may signal a weakening trend, indicating a potential reversal.
Moving Average Convergence Divergence (MACD)
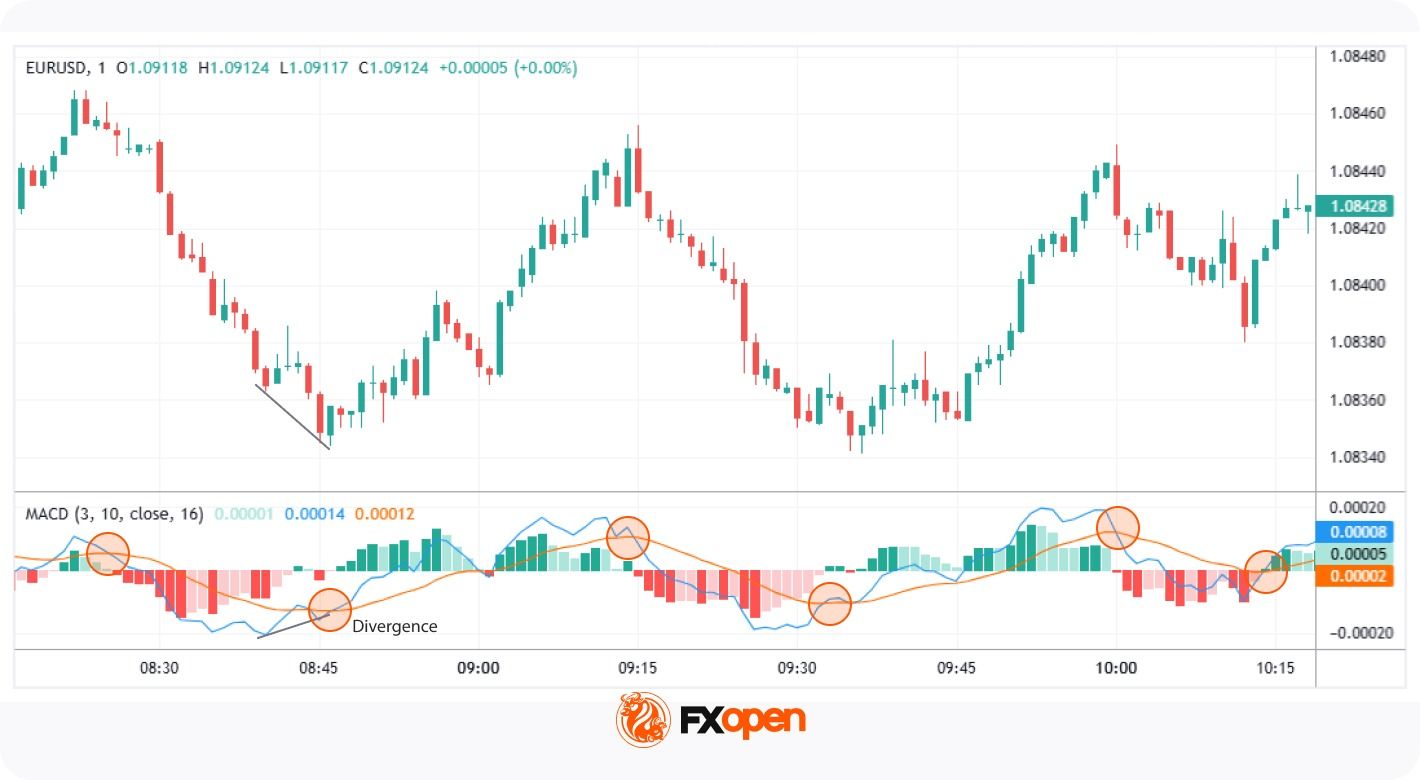
The Moving Average Convergence Divergence (MACD) is a widely used scalping indicator. It’s a momentum indicator that reflects the relationship between two moving averages. It comprises the MACD line (the difference between the 12-period and 26-period exponential moving averages), the signal line (a 9-period EMA of the MACD line), and a histogram, which illustrates the gap between the two lines.
Scalpers prefer to adjust these settings to 3, 10, and 16, respectively, to make the MACD more responsive to rapid price movements.
Applying MACD in Scalping:
- Crossovers: When the MACD line crosses above the signal line, it may indicate bullish momentum; a crossover below suggests bearish momentum. Scalpers monitor these crossovers to identify potential entry and exit points.
- Histogram Analysis: The histogram represents the difference between the MACD and signal lines. Histogram contraction in the MACD scalping indicator may reflect weakening momentum, while expansion tends to indicate momentum building in the prevailing direction. Scalpers use these changes to gauge the intensity of price movements.
- Divergences: A divergence occurs when the price moves in one direction while the MACD line moves in the opposite. For example, if the price reaches a new low but the MACD does not, it may reflect a potential upward reversal. Scalpers watch for such divergences to anticipate shifts in market direction.
Indicator Confluence in Scalping
Confluence refers to combining signals from multiple indicators to potentially filter noise and improve signal reliability. Each indicator offers unique insights, and their combined use may help filter out false signals. Here are some pairings:
- EMA + RSI → trend direction plus momentum confirmation: Utilising the Exponential Moving Average to identify trend direction alongside the Relative Strength Index to gauge momentum may help traders confirm the strength of a trend before making decisions. For instance, if the EMA indicates an uptrend and the RSI is above 50, it may suggest strong bullish momentum.
- Bollinger Bands + Stochastic → volatility plus reversal signals: Bollinger Bands measure volatility, while the Stochastic Oscillator identifies overbought or oversold conditions. When prices touch the upper or lower bands and the Stochastic Oscillator reflects overbought or oversold conditions, it may indicate potential reversal points.
- MACD + RSI → momentum confirmation across two indicators: The Moving Average Convergence Divergence (MACD) highlights momentum changes, and the RSI indicates overbought and oversold conditions. Using them together can support traders in confirming potential entry or exit points. For example, if the MACD shows bullish momentum and the RSI is rising but not yet overbought, it may signal the price will rise.
Indicator Settings Commonly Used in Scalping
The table below summarises typical scalping configurations for each indicator covered above. These are the settings traders most often apply on these indicators for 1-minute trading and 5-minute trading.
Market Conditions and Indicator Behaviour
Indicator readings shift in reliability depending on the underlying market environment. No single tool performs identically across trend, range, and low-volatility conditions.
In trending markets, the EMA and momentum indicators such as MACD tend to dominate. Trend-following signals carry more weight when price moves directionally with sustained pressure.
In range-bound markets, oscillators become more relevant. The Stochastic Oscillator and RSI often produce cleaner reversal signals when price oscillates between defined support and resistance levels. Moving average crossovers may generate frequent false signals in these conditions.
Under low-volatility conditions, signals across all indicator types weaken. Bollinger Bands contract, momentum readings flatten, and crossovers lose meaning. Traders often wait for volatility expansion before acting on indicator-based setups.
Limitations of Indicators in Scalping
Scalping with indicators offers valuable insights, but there are some challenges traders should be aware of:
- False Signals: Rapid market movements can trigger misleading signals, causing traders to act prematurely.
- Overtrading: Relying too heavily on short-term indicators can lead to excessive trades, increasing transaction costs.
- Market Noise: High volatility and frequent price fluctuations can make it difficult to distinguish genuine trends from random market “noise.”
- Lagging Indicators: Some indicators may react too slowly, causing traders to miss potential trades.
- Tuning: Tuning indicators may be necessary to optimise performance. Academic research has tested indicators such as MACD and RSI across multiple developed markets, with results varying by index, period, and parameter settings.
Key Takeaways on Scalping Indicators
Scalping relies on precise and timely decisions, which is why technical indicators play an important role in this trading style. Tools such as moving averages and oscillators provide structured signals that may support traders in navigating fast market movements. The choice of indicators varies depending on individual trading preferences, market conditions, and timeframes.
If you want to test the above-mentioned indicators or find something new for yourself, you can open an FXOpen account to access over 700 markets and trade with tight spreads from 0.0 pips.
FAQ
What Indicators Are Used for Scalping?
Common scalping indicators include the Exponential Moving Average (EMA), Relative Strength Index (RSI), Bollinger Bands, Stochastic Oscillator, and Moving Average Convergence Divergence (MACD). The Hull Moving Average is also used by some traders. Each tool serves a different function across trend identification, momentum measurement, and volatility assessment on short-term charts.
What EMA Settings Are Used in Scalping?
Common EMA settings for scalping include 5, 9, and 20 periods on 1-minute and 5-minute charts. Traders often pair a fast EMA, such as 5 or 9, with a slower EMA, such as 15 or 20, to monitor crossovers. Shorter periods react faster but may produce more false signals.
Can RSI Be Used for Short-Term Trading?
Yes, the RSI is popular among short-term trading indicators. Scalpers typically reduce the RSI period from the standard 14 to between 2 and 7 to capture rapid price swings. Traders watch for crosses above 70 or below 30, divergences with price, and movement around the 50 midpoint.
How Do Bollinger Bands Work in Scalping?
In scalping, traders often use a 7 to 10 period SMA with 1.5 to 2 standard deviations. Squeeze conditions may precede breakouts, while band touches may indicate reversal zones.
Do Indicators Behave Differently in Trending and Ranging Markets?
Yes, indicator reliability shifts with market conditions. In trends, momentum indicators such as MACD and EMAs tend to perform more consistently. In ranges, oscillators such as RSI and Stochastic produce cleaner reversal signals. Under low volatility, signals across all indicator types tend to weaken.
What Is the 1-Minute Scalp Strategy?
The 1-minute scalp strategy involves making rapid trades on a 1-minute chart. Traders look for small price movements and enter multiple trades within a short period, often using scalp trading indicators like the EMA or RSI for quick signals.
What Is the 5-Minute Scalping Strategy?
The 5-minute scalping strategy focuses on capturing short-term price movements on a 5-minute chart. Traders typically combine trend and momentum indicators, like the MACD and Bollinger Bands, to make fast, informed decisions.
Are There Good Stocks for Scalping?
The choice depends on the trader’s risk tolerance, trading approach, experience, and toolkit. However, according to theory, stocks with high liquidity, tight spreads, and significant daily volume are good for scalping. Popular choices include tech giants like Apple (AAPL) and Tesla (TSLA), as they offer frequent price fluctuations. But at the same time, they bear higher risks.
This article represents the opinion of the Companies operating under the FXOpen brand only. It is not to be construed as an offer, solicitation, or recommendation with respect to products and services provided by the Companies operating under the FXOpen brand, nor is it to be considered financial advice.
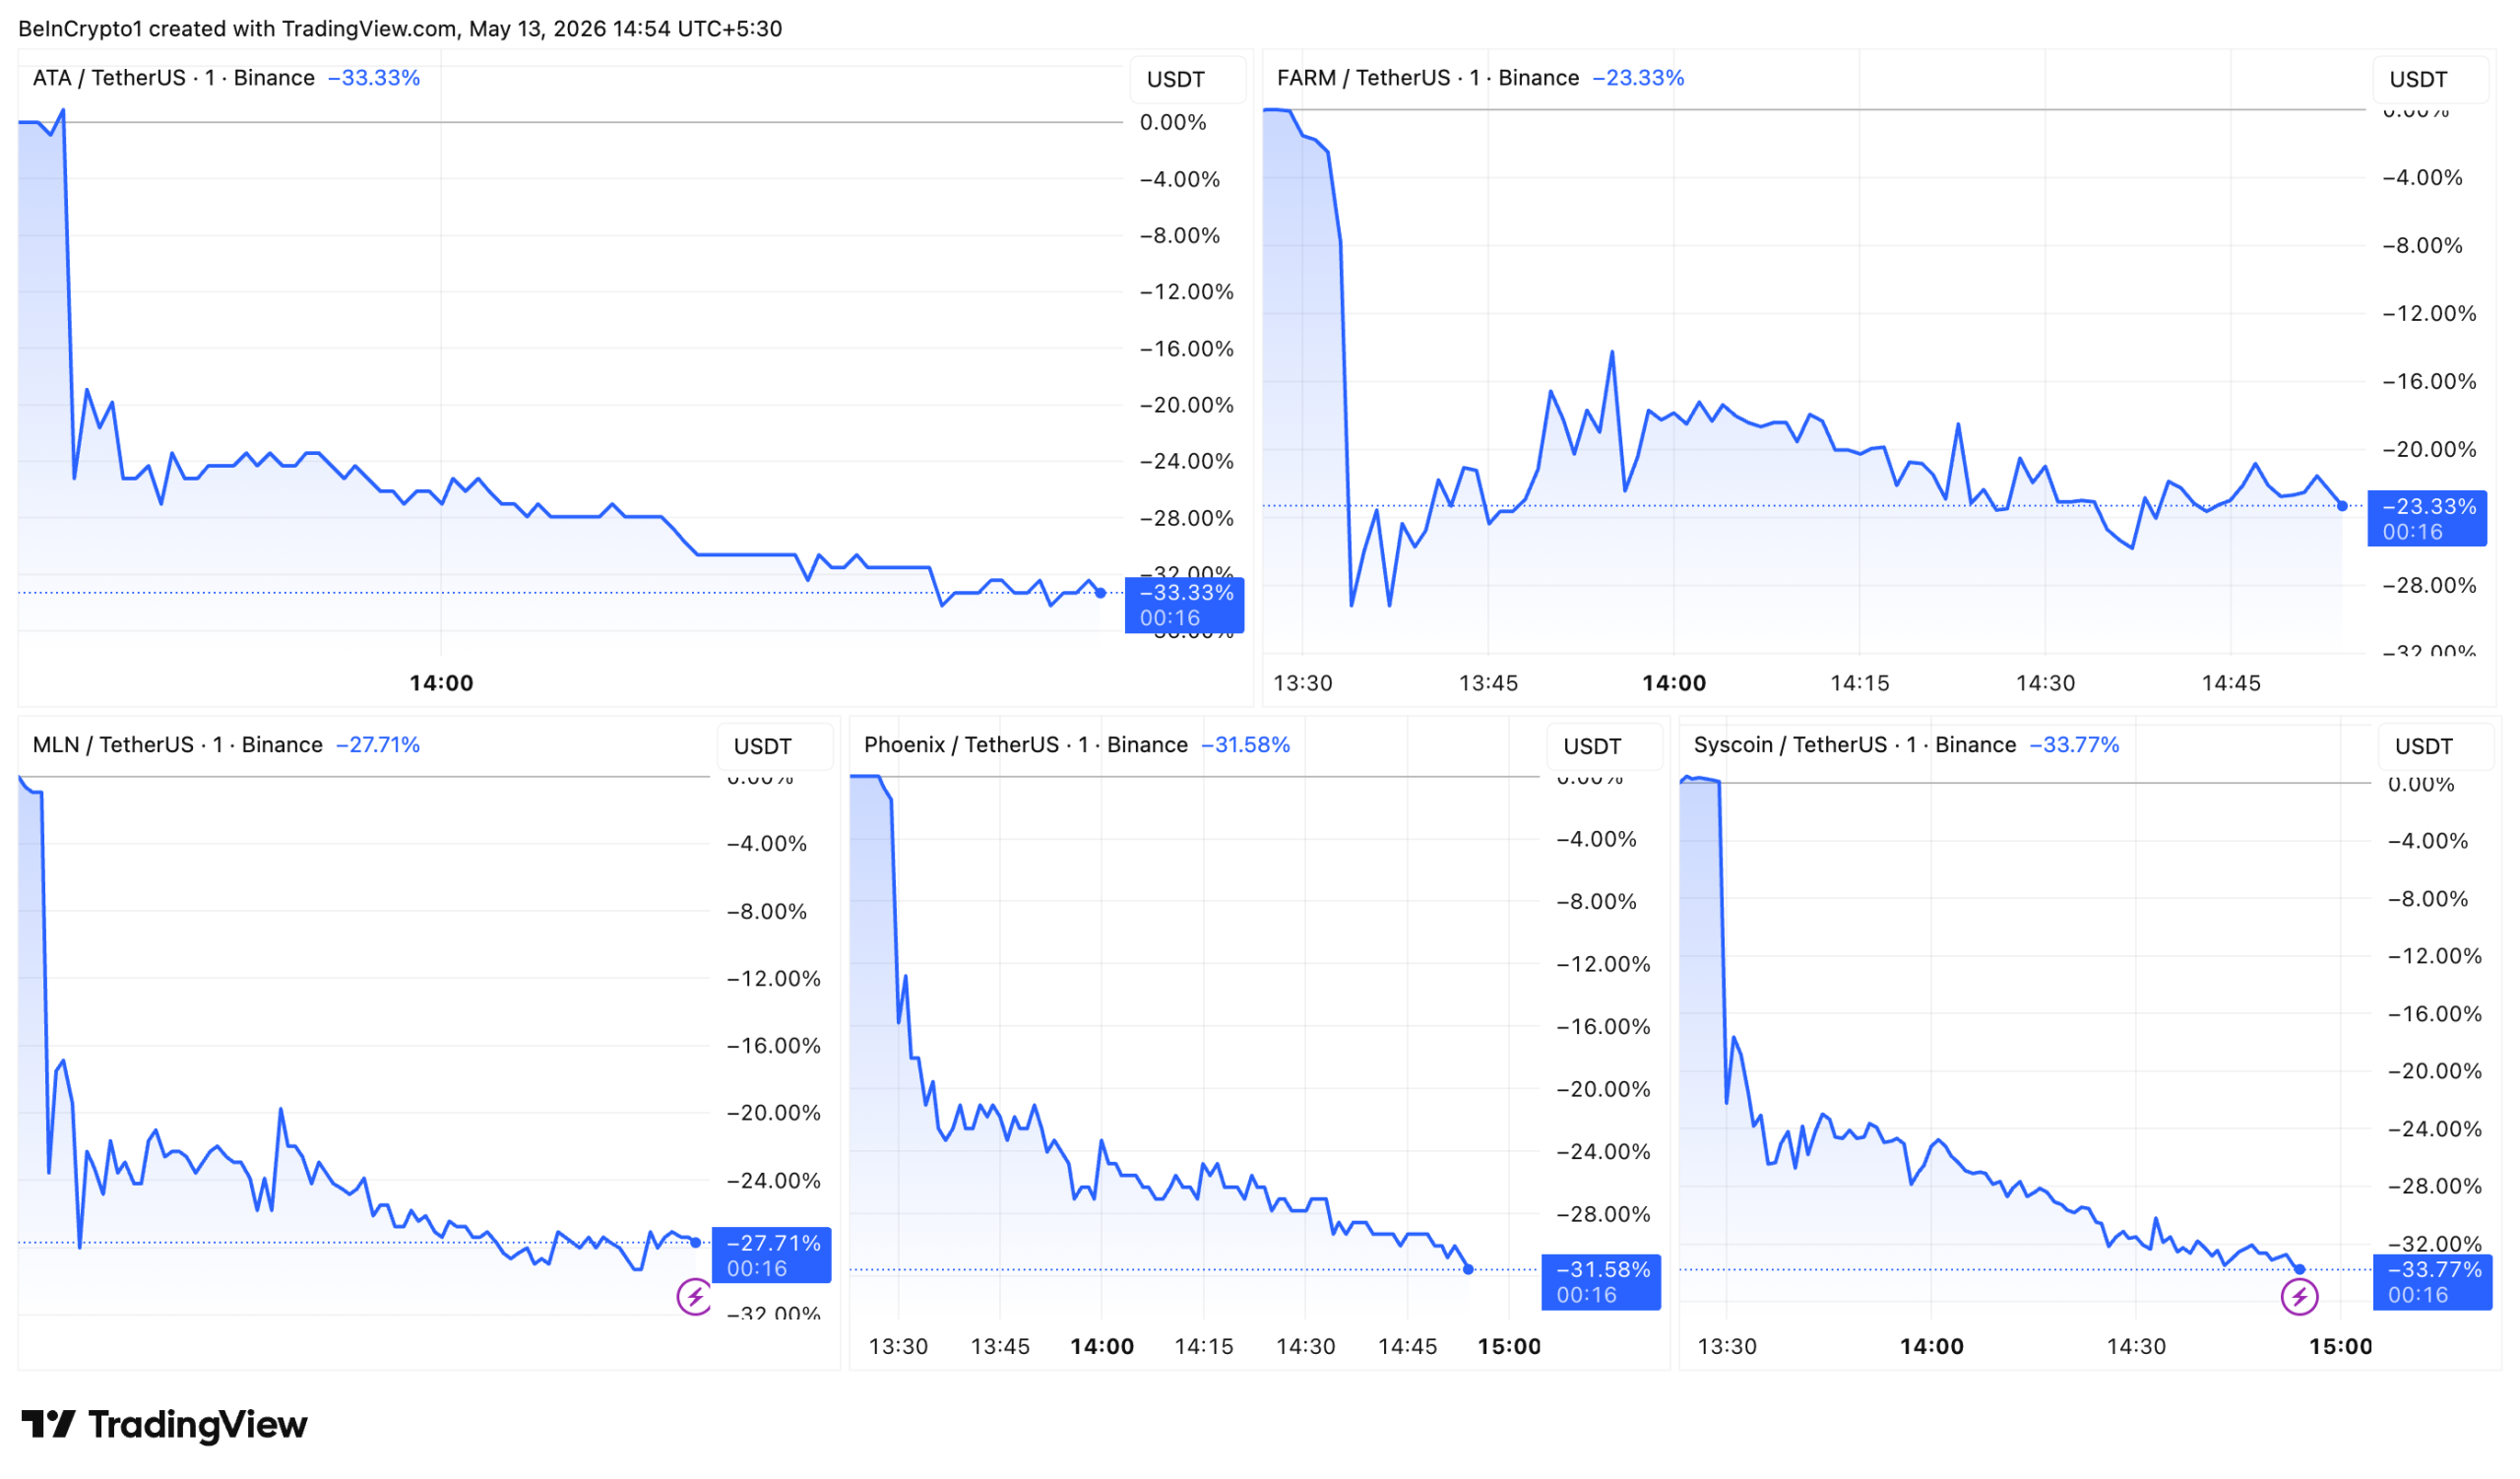
Binance announced that it will end spot trading for Automata (ATA), Harvest Finance (FARM), Enzyme (MLN), Phoenix (PHB), and Syscoin (SYS) on May 27, 2026.
All five tokens dropped sharply after the Binance delisting news. SYS fell 33.77%, ATA slid 33.33%, PHB lost 31.58%, MLN dropped 27.71%, and FARM declined 23.33% on Binance spot markets.
Follow us on X to get the latest news as it happens

What Token Holders Need To Know
In the latest announcement, Binance said that it will “delist and cease trading on all spot trading pairs” for the tokens at 3 a.m. UTC on May 27. The exchange will automatically cancel all trade orders. Trading bots tied to these pairs will also stop.
In addition, Binance will stop crediting deposits after 3 a.m. UTC on May 28. Withdrawals will remain open until 3 a.m. UTC on July 27, 2026.
Meanwhile, Binance Futures will close all positions and settle the relevant contracts on May 19 at 9 a.m. UTC. Margin and loan products will wind down before the spot delisting.
“Delisted tokens may be converted into stablecoins on behalf of users after 2026-07-28 03:00 (UTC). Please note that the conversion of delisted tokens into stablecoins is not guaranteed. A separate notification will be made before the conversion where applicable, and the stablecoins will be credited to users’ Binance accounts after the conversion,” the exchange added.
Why Is Binance Delisting 5 Altcoins
The exchange periodically reviews listed assets against a set of public metrics. These include trading volume, liquidity, development activity, team commitment, and regulatory factors, Binance stated in the announcement.
“When a coin or token no longer meets these standards or the industry landscape changes, we conduct a more in-depth review and potentially delist it. Our priority is to ensure the best services and protections for our users while continuing to adapt to evolving market dynamics,” it said.
In April, the exchange added the Monitoring Tag to Harvest Finance, Enzyme, and Syscoin, signaling possible future removal.
The Monitoring Tag has previously preceded delistings. Past cases include Beefy Finance (BIFI) and Orchid (OXT), both of which were dropped after similar warnings.
Subscribe to our YouTube channel to watch leaders and journalists provide expert insights
The post 5 Altcoins Record Double-Digit Losses After Binance Delisting Call appeared first on BeInCrypto.


Solana (SOL) treasury firm Upexi (UPXI) posted a $109.3 million net loss for the fiscal third quarter ended March 31, 2026.
This marks a 2,776% jump from the $3.8 million loss a year earlier, largely driven by Solana (SOL) treasury markdowns.
Solana Treasury Strategy Magnifies Upexi’s Quarterly Losses
In the press release, the firm said the net loss was driven by non-cash unrealized losses on digital assets, totaling $92.3 million during the quarter.
Still, the Solana-focused treasury strategy offered some bright spots. Gross profit climbed 179% year-over-year to $4.4 million.
In addition, the total quarterly revenue edged up to roughly $4.6 million, from $3.2 million in the same period of 2025.
“During the quarter, we grew the number of SOL held in our treasury by 9%, increased the number of tokens generated from staking, and repurchased approximately 2.5 million Upexi shares in the open market, all of which increased our Solana per share. Solana’s best-in-class performance, costs, and institutional adoption gives us conviction that we are building long-term shareholder value around the network that we believe will revolutionize global finance,” Allan Marshall, Chief Executive Officer of Upexi, said.
Follow us on X to get the latest news as it happens
The company also strengthened its balance sheet during the quarter, ending March 31 with $3.5 million in cash and equivalents and trimming short-term debt by about $7.6 million.
Capital activity was equally busy. Over the nine months ended March 31, Upexi bought back and retired 2,894,287 of its common shares under an active repurchase program. The firm also closed a $36 million private placement convertible note for 265,500 locked Solana tokens.
On the cost side, management has been making cuts. Upexi reduced the employee headcount to just 10, terminated a warehouse lease, and also eliminated several other general and administrative costs.
“Management estimates that by July 1, 2026, the ongoing cash expenses for operations and interest will be less than the treasury’s staking revenue at the current price of Solana,” the press release read.
Upexi is hardly alone in the red. Several digital asset treasury firms have absorbed quarterly losses amid declining crypto prices, putting pressure on their balance sheets.
Subscribe to our YouTube channel to watch leaders and journalists provide expert insights
The post Upexi Net Loss Balloons to $109 Million on Solana Treasury Markdown appeared first on BeInCrypto.

Banking giant JPMorgan has filed to launch a new tokenized money market fund on Ethereum. The fund allows stablecoin issuers to hold reserves in a regulated vehicle while earning interest.
The filing comes after Morgan Stanley announced its own money market fund called the Stablecoin Reserves Portfolio.
JPMorgan Files to Launch Tokenized Money Market Fund
The fund, called the OnChain Liquidity-Token Money Market Fund, will trade under the ticker JLTXX. According to a regulatory filing with the Securities and Exchange Commission, it will invest in US Treasury bills and overnight repurchase agreements collateralized by cash or US Treasurys. The fund will also comply with the GENIUS Act, signed in July, and be managed by JPMorgan’s Kinexys Digital Assets (KDA) unit. The filing adds that the fund utilizes a “permissioned system” sitting on top of blockchains. The fund is currently available only on Ethereum, but will be expanded to other networks in the future. The filing states, “The Ethereum blockchain, a public blockchain network, is currently the only available blockchain for use by investors, although expansion to other blockchains is anticipated in the future.”
Fund Details
Investors in the fund must commit a minimum investment of $1 million. The fund has a 0.16% annual fee after waivers. JPMorgan stated that the filing becomes effective on Wednesday, but has not disclosed the fund’s launch date. The fund also highlighted blockchain technology risk alongside interest rate changes and general market risks, noting that blockchain technology is relatively new and untested. The risks include the blockchain not functioning as intended, regulatory concerns, and unknown technical flaws.
Blockchain-based tokenization has attracted strong interest from Wall Street, with executives believing the technology offers greater efficiency in settlements and trading than traditional systems. According to RWA.xyz data, over $32 billion worth of real-world assets, including stocks, bonds, commodities, and real estate, are currently tokenized on-chain.
The fund is JPMorgan’s second crypto-linked initiative in a week following Ondo Finance’s collaboration with the bank’s Kinexys platform, Ripple, and Mastercard to settle tokenized treasuries on the XRP ledger. The upcoming tokenized money market fund will directly compete with BENJI, a tokenized money market fund from rival Franklin Templeton. BENJI is available on BNB Chain, Avalanche, and Canton.
JPMorgan’s Foray Into Tokenization
JLTXX is JPMorgan’s second tokenized product after the My OnChain Net Yield Fund (MONY). MONY launched in December on Ethereum and holds short-term debt securities with higher returns than bank deposits. JPMorgan also participated in a pilot transaction last week, moving the first tokenized US Treasury fund from the US to its Singapore bank account via the XRP ledger and interbank rails.
Disclaimer: This article is provided for informational purposes only. It is not offered or intended to be used as legal, tax, investment, financial, or other advice.
Crypto World
SharpLink’s Ethereum Bet Just Generated a $686 Million Loss: Is the Galaxy Deal News a Lifeline or a Vote of Confidence?
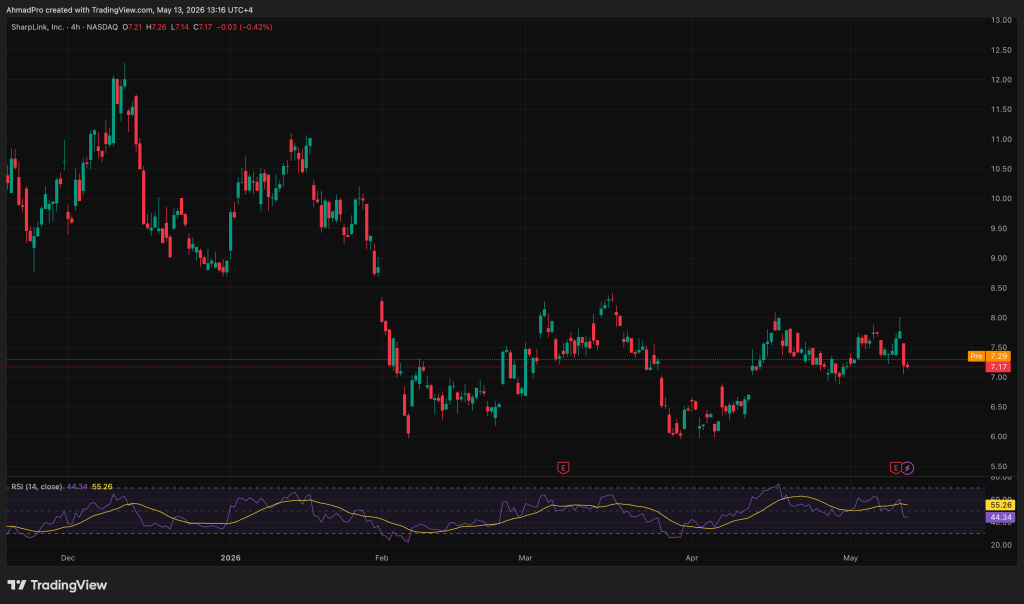
SharpLink posted a Q1 2026 net loss of nearly $686 million, driven almost entirely by $507 million in unrealized losses from its Ethereum treasury, a figure that dwarfs the firm’s less than $1 million loss in the same period last year. Bearish news for ETH treasuries.
The trigger was a 45% peak-to-trough ETH drawdown that turned the company’s aggressive accumulation strategy into a paper catastrophe under GAAP fair-value accounting rules.
The same earnings release announced a $125 million on-chain yield fund with Galaxy Digital, which some analysts are reading as a lifeline in disguise.

The tension at the center of this story is real: does the Galaxy deal signal institutional confidence in ETH staking infrastructure, or does it signal that SharpLink needed a structural backstop to stay credible? Those are not the same thing.
How a 45% ETH Drawdown Produced a $686M Loss, and Why the Math Works That Way
The mechanism here is worth understanding precisely, because it is not a trading loss or an operational failure in the traditional sense.
SharpLink holds approximately 872,984 ETH valued at roughly $2.1 billion at current prices. GAAP fair-value accounting requires the firm to mark those holdings to market at each reporting date, which means a price decline flows directly into the income statement as an unrealized loss – no ETH sold, no cash out the door.
ETH fell from approximately $3,354 on January 15, 2026, to $2,104 by March 31 – a drop of roughly 37% over the quarter alone, contributing the bulk of that $507 million unrealized hit.
Across the broader peak-to-trough cycle, the 45% ETH drawdown compressed the dollar value of SharpLink’s entire treasury position with mechanical precision. The larger the ETH stack, the larger the paper loss on the way down.
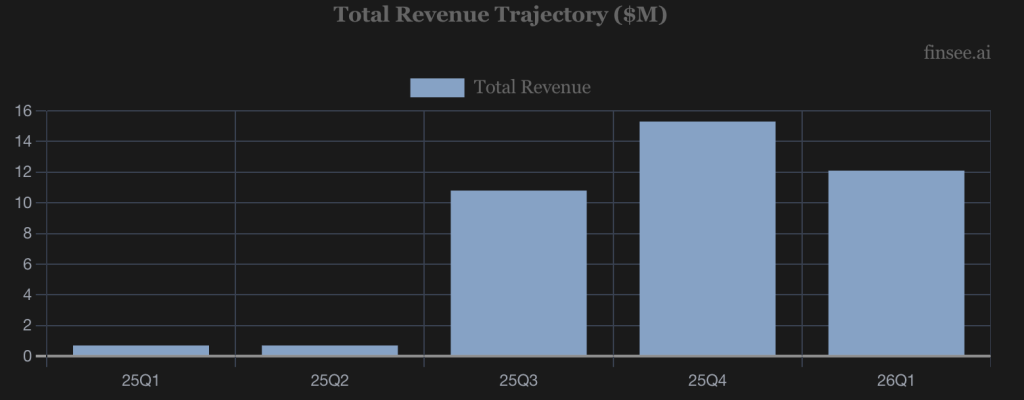
The staking revenue side did not come close to offsetting this. Q1 2026 revenues jumped to more than $12 million from under $1 million a year earlier, a genuine operational improvement powered by the firm’s staked Ethereum treasury.
SharpLink has accumulated 18,800 ETH in staking rewards since launching its treasury strategy in June 2025, running a mix of 66% native staking, 33% liquid staking, and 1% restaking. That is a functioning yield engine. It is just not a $507 million yield engine.
The distinction that matters analytically: this is not a validator economics failure, nor a leverage blowup. It is a concentration risk event, amplified by accounting standards that require mark-to-market recognition of assets that have not been liquidated.
SharpLink ended Q1 with $16.9 million in cash and 872,984 ETH still on its books. The loss is real on paper. The ETH is still there.
That said, the accounting and liquidity risks in institutional Ethereum staking operations are not theoretical. A 45% drawdown does not just create paper losses; it compresses the equity cushion that supports the entire treasury model and raises legitimate questions about what a further leg down would look like on the balance sheet.
Ethereum News: The Galaxy Digital Fund Is a Signal, But Not Necessarily the One Being Advertised
The $125 million on-chain yield fund announced alongside the Q1 results is structured as follows: $100 million comes from SharpLink’s staked ETH treasury, and $25 million from Galaxy Digital. Galaxy is responsible for protocol selection, exposure sizing, and ongoing monitoring of all on-chain deployments.
SharpLink brings the capital. Galaxy brings the operational oversight.
Galaxy Digital CEO Mike Novogratz framed the deal in sector terms: “Institutional capital is moving on-chain, and the infrastructure to support it has matured to a point where allocators can access yield, liquidity, and risk management with the same rigor they expect in traditional markets.”
That is a bullish read on institutional crypto broadly, and Galaxy’s own stock performance supports the narrative. GLXY shares are up 43% in the last month, recently trading at $30.92.
SharpLink CEO Joseph Chalom described the strategic direction as moving “beyond foundational staking into a broader set of on-chain opportunities,” emphasizing a “comprehensive risk-management framework” designed to deliver shareholder value across market cycles.
The language is disciplined. The timing raises a question worth naming: a firm reporting a $686 million quarterly loss is not negotiating from a position of strength.
The conflict of interest embedded in this structure is also worth naming. Galaxy is both a financial contributor to the fund and the entity managing its on-chain deployment decisions.
That does not make the partnership wrong. It does mean the assumption that Galaxy’s protocol selection is purely independent of its own positioning deserves scrutiny from investors and analysts watching this sector.
If ETH price recovers meaningfully through Q2 and Q3, the fund launch will look like a well-timed DeFi pivot that turned a paper-loss narrative into a yield-diversification story.
If ETH continues to grind lower, the $100 million deployed from SharpLink’s treasury into on-chain protocols will be exposed to additional mark-to-market pressure on top of the core holdings. The asymmetry runs in both directions.
The post SharpLink’s Ethereum Bet Just Generated a $686 Million Loss: Is the Galaxy Deal News a Lifeline or a Vote of Confidence? appeared first on Cryptonews.


Bitcoin , a leading indicator of risk sentiment, remains a paragon of stability ahead of President Donald Trump’s arrival in Beijing for talks with his Chinese counterpart, Xi Jinping.
The largest cryptocurrency recently traded 0.5% higher since midnight UTC at $80,900, in line with the gain of the CoinDesk 5 Index (CD5). All five members of the index advanced. The broader CoinDesk 20 Index (CD20) rose 1.3% while the CoinDesk 80 (CD80) was little changed, indicating a particular focus on the largest tokens.
The Trump-Xi talks are likely to cover tariffs, rare earth supply chains, and the Middle East. Any positive outcome, even a symbolic one on paper, could improve overall market sentiment and support risk assets
Ether (ETH) added 1.3% since midnight to $2,300 after the Ethereum Foundation published “Clear Signing,” a new standard designed to stop users from unknowingly approving malicious crypto transactions.
Among altcoins, Injective blockchain’s INJ token surged as much as 24%, the most since Feb. 19, alongside 5% gains in Polkadot’s DOT and the TRUMP memecoin.
Derivatives Positioning
- BNB futures open interest (OI) rose to 6.15 million tokens, up over 5% in 24 hours and the highest since April 3. The move points to fresh capital inflows.
- ZEC’s OI growth is the biggest among the major cryptocurrencies. Its 24-hour cumulative volume delta (CVD) is also positive and the highest among majors.
- That’s also a sign of new money flowing into the market, with traders buying via market orders rather than passive limit orders, signaling strong bullish sentiment.
- Still, the BNB market doesn’t look overheated. Funding rates remain below an annualized 10%, a sign of healthy bullish conditions without excessive leverage buildup. Its market capitalization has increased to $92.2 billion, the highest since March 18, reflecting renewed investor interest.
- OI in DOGE has increased 5.75% to 15.38 billion tokens, with its price chart pointing to a bullish crossover of the widely tracked 50- and 100-day simple moving averages. The token traded 4% higher at 11 cents as of writing. The other key metrics display a BNB-like bullish setup, suggesting improving speculative demand.
- Another standout is ether (ETH), the second-largest token by market value. OI in ether futures topped 15 million ETH, nearing last July’s record 15.30 million.
- The increasing demand for leverage, coupled with the relentless tightening of Bollinger Bands, suggests scope for a volatility boom.
- OI in bitcoin has held largely unchanged near 740K BTC in the past 24 hours, indicating relatively stable positioning in bitcoin compared to altcoins.
- Broadly speaking, most tokens, except BNB, XRP and TRX, have negative 24-hour CVDs, meaning the altcoin market is dominated by sellers shorting via market orders rather than passive limit orders. That signals lingering caution beneath the broader market strength.
- While macro risks pile up in the form of high inflation and hardening bond yields across the advanced world, the market remains calm. That’s evident from the continued decline in bitcoin’s and ether’s 30-day implied volatility indices. Ether’s EVIV index hit fresh year-to-date lows below 55%, while BVIV remains pinned near 40%, levels last seen in late January.
- The subdued volatility environment suggests traders are not yet pricing in major near-term turbulence.
- In the options market on Deribit, higher-strike call options continue to dominate volume rankings. Calls represent a bullish bet on the underlying BTC.
- As for block flows, put spreads and straddles emerged as preferred strategies over the past 24 hours, indicating traders are positioning for both downside protection and a potential volatility expansion.
Token Talk
- The DeFi United initiative seems to be restoring confidence in decentralized finance ecosystem, with the tokens of Aave , Arbitrum (ARB) and Lido (LDO) recovering over the past week.
- AAVE rose 3%, ARB gained 16% and LDO added 11% over seven days. ARB’s move stands out after the Kelp DAO exploit, which hit Arbitrum lending markets and left wrapped ether stranded across chains.
- The April 18 attack released unbacked rsETH through Kelp’s LayerZero OFT bridge. Aave’s incident report attributed the path to a forged LayerZero packet and a single-DVN configuration, while LayerZero linked the attack to North Korea’s Lazarus Group. It sparked a widespread recovery effort.
- Phase 1 of that recovery is now complete. The attacker’s rsETH on Arbitrum was burned, removing the unbacked supply, and Aave V3 positions tied to the exploiter were forcibly liquidated.
- The 117,132 rsETH, worth roughly $278 million, is set to be progressively refilled into the LayerZero bridge adapter over the next two weeks. Withdrawals are expected to resume within 24 hours of the first tranche.
- A separate legal process is ongoing for 30,765 ETH, roughly $71 million, frozen by Arbitrum’s Security Council. A U.S. federal court cleared an Arbitrum governance vote to move the funds to an Aave-controlled wallet while keeping the recovered ETH under court restrictions.

Politics Home Article | Tribune MPs Ready To Fight For Burnham Inclusion If Streeting Runs

Anthony Volpe likely for ’26 debut in Yankees’ rubber match at Orioles

VTech Toy Becomes PinkPad, The DIY Linux Laptop
Manchester United reach agreement with Casemiro over contract clause amid transfer speculation

US brings back mandatory military draft registration

Steven Gerrard disagrees with Gary Neville over ‘shock’ Chelsea and Arsenal claim | Football


-
 Crypto World5 days ago
HarrisX Poll Found 52% of Registered Voters Support the CLARITY Act
-

 Fashion5 days ago
Weekend Open Thread: Marianne Dress
-

 Crypto World6 days ago
Upbit adds B3 Korean won pair as Base token gains Korea access
-
 NewsBeat6 days ago
NCP car park operator enters administration putting 340 UK sites at risk of closure
-

 Fashion2 days ago
Coffee Break: Travel Steam Iron
-

 Fashion2 days ago
What to Know Before Buying a Curling Wand or Curling Iron
-

 Tech3 days ago
Auto Enthusiast Carves Functional Two-Stroke Engine from Solid Metal
-

 Politics2 days ago
What to expect when you’re expecting a budget
-
 Business4 days ago
Ignore market noise, India’s long-term story intact, say D-Street bulls Ramesh Damani and Sunil Singhania
-

 Politics4 days ago
Politics Home Article | Starmer Enters The Danger Zone
-

 Crypto World7 days ago
BlackRock CEO Larry Fink Discusses a New Asset Class
-

 Tech2 days ago
GM Agrees To Pay $12.75 Million To Settle California Lawsuit Over Misuse Of Customers’ Driving Data
-

 Entertainment6 days ago
Sarah Paulson Called Out For Met Gala ‘Hypocrisy’
-

 Politics6 days ago
Simon Cowell Says He Was ‘Horrible’ To Susan Boyle During BGT Audition
-

 Entertainment6 days ago
General Hospital: Ric & Ava Bombshell – Ric’s Massive Secret Exposed!
-

 Crypto World6 days ago
Robinhood says Wall Street is building onchain
-

 Sports6 days ago
UEFA Champions League final schedule, teams, venue, live time and streaming | Football News
-

 Entertainment7 days ago
Bold and Beautiful Early Spoilers May 11-15: Steffy Revolted & Liam Overjoyed!
-

 Entertainment6 days ago
Why David Letterman Called CBS ‘Lying Weasels’
-

 Entertainment7 days ago
Sister Wives: Tony Flings Shade at Robyn in New Post
You must be logged in to post a comment Login