
Crypto World
Is a crypto token actually cheap?



A token can look cheap by market cap and be catastrophically expensive by fully diluted valuation, and the gap between the two numbers is where most crypto losses quietly begin. This guide explains market cap and FDV, why the difference matters more than either number alone, how token unlocks turn FDV into future selling pressure, the low-float high-FDV trap that defined a market cycle, and how to read both numbers before you buy.
Two traders look at the same token. The first checks its market capitalization, sees a modest number, and concludes the token is cheap with room to grow. The second checks its fully diluted valuation, sees a figure ten times larger, and concludes the token is a time bomb of future selling. They are looking at the same asset, and they are both reading real numbers. The gap between what they see is one of the most important and least understood concepts in crypto valuation, and misreading it has cost more retail money than almost any other single mistake.
Market capitalization and fully diluted valuation, FDV, are the two headline ways to size a token, and each answers a different question. Market cap asks what the tokens in circulation right now are worth. FDV asks what all the tokens that will ever exist would be worth at today’s price. When most of a token’s supply is already circulating, the two numbers are close and the distinction barely matters. When most of the supply is still locked, waiting to be released over years, the two numbers diverge enormously, and the space between them is a map of future selling pressure that the market cap alone completely hides.
This guide explains both numbers and the relationship that matters more than either. It covers what market cap and FDV actually measure, why circulating supply is trickier than it sounds, how the unlock schedule turns FDV into a calendar of future dilution, the low-float high-FDV trap that defined the 2024 token cycle and its aftermath, the specific ways these numbers mislead, and the practical checklist for reading a token’s valuation before the locked supply reads it to you.
The two numbers, precisely
Market capitalization is the simplest valuation in crypto: circulating supply multiplied by current price. A token trading at $2 with 100 million coins in circulation has a $200 million market cap. It answers the question, what is the market currently valuing this token at, based on the coins actually available, and it is the number that appears first on every tracker and the one most people mean when they call a token large or small.
Fully diluted valuation multiplies the same price by the total supply that will ever exist, not just what circulates today. If that same $2 token has a maximum supply of one billion coins, of which only 100 million circulate, its FDV is $2 billion, ten times its market cap. FDV answers a different question, what would this token be worth if every coin that will ever exist traded at today’s price, and it is, in effect, the valuation the market is implicitly assigning to the entire project if you assume the price holds as the rest of the supply arrives.
The relationship between the two is the whole game, and it is captured by one ratio: circulating supply divided by total supply, the float. A token with 90% of its supply circulating has a market cap close to its FDV, the two numbers nearly agree, and there is little hidden supply to worry about. A token with 10% of its supply circulating has an FDV ten times its market cap, and 90% of its eventual supply is sitting locked somewhere, scheduled to enter the market over time. The lower the float, the wider the gap, and the wider the gap, the more the market cap flatters the token by hiding what is coming.
Circulating supply is trickier than it looks
Before trusting either number, it is worth knowing that circulating supply, the input to market cap, is itself a slippery figure. It is meant to count the coins genuinely available to trade, excluding locked, reserved, and unreleased tokens, but the accounting varies by source and can be gamed. Projects sometimes report circulating supply generously, counting tokens that are technically unlocked but held in foundation or team wallets that will not actually sell, or excluding tokens in ways that flatter the market cap. Different data providers apply different methodologies, which is why the same token can show slightly different market caps on different trackers.
This matters because market cap inherits every ambiguity in circulating supply. A token whose reported circulating supply is artificially low will show an artificially low market cap, making it look cheaper than it is, while its FDV, based on the harder-to-fudge total supply, tells the less flattering truth. The discipline is to treat circulating supply as a claim to be checked rather than a fact, and to always read it alongside total supply and the unlock schedule, because the gap between circulating and total is not empty space, it is a queue.
The unlock schedule: FDV as a calendar
Here is the insight that turns FDV from an abstract number into a practical warning: the difference between circulating supply and total supply does not stay locked forever. It is released on a schedule, the vesting or unlock schedule, and that schedule is a calendar of future selling pressure written years in advance.
When a project launches, it typically sells or allocates only a fraction of its tokens, keeping the rest locked for the team, investors, treasury, and ecosystem, released gradually over months or years. Each release, an unlock, converts locked tokens into circulating ones, expanding the supply that can be sold. The tokens existed all along, they were always counted in FDV, but they become sellable only when they unlock, the anticipatory dynamic that governs every large scheduled release. This is why FDV matters: it is not a hypothetical, it is a preview of the supply that is contractually scheduled to arrive, and the unlock calendar tells you exactly when.
The mechanical consequence is relentless. A low-float token with a high FDV faces a headwind that a high-float token does not: a steady stream of newly unlocked tokens, often released to insiders sitting on large gains, entering a market that must absorb them just to keep the price flat. If demand does not grow at least as fast as supply unlocks, the price falls, not because anything went wrong with the project, but because the supply side of the equation was scheduled to overwhelm the demand side from the start. Reading a token’s unlock schedule is reading its future selling pressure, and a token whose FDV dwarfs its market cap is a token whose price chart is fighting its own supply calendar for years, the same supply-versus-demand scissors that shapes entire market cycles.
The low-float, high-FDV trap
The gap between the two numbers is not just a technical curiosity; it defined an entire market cycle and taught a brutal lesson. In the 2024 token era, a wave of projects launched with very low floats and very high FDVs: a small fraction of supply circulating, valuations that looked reasonable by market cap, the fair-launch platforms industrializing exactly this structure at scale, as their own house token’s supply cliff showed but enormous by FDV, and long vesting schedules loading the future with unlocks.
The pattern worked, briefly, because low float is a price accelerant in both directions. With few tokens available to trade, modest demand produces dramatic price gains, thin supply amplifies buying the way it amplifies everything, the same launch-curve dynamic that prices earliness into every memecoin, and the early charts looked spectacular, drawing in buyers who checked the market cap, saw room to grow toward the FDV, and bought. Then the unlocks began. Wave after wave of locked supply, much of it held by insiders who had bought far lower, entered the market, and the same thin float that amplified the rise now had to absorb a rising tide of new supply against fading demand. The result was a cohort of tokens that spent the following period grinding relentlessly lower, not from any failure of their projects but from the arithmetic they launched with: valuations set at the top, supply scheduled to arrive into weakness, and a float too thin to defend the price on the way down. The lesson the cycle burned into the market was that a low market cap next to a high FDV is not a bargain waiting to grow, it is frequently a warning that the price you see was manufactured by scarcity that is scheduled to end.
A worked comparison: two tokens, same market cap
Set two tokens side by side to see the gap do its work. Token A trades at $1 with 800 million of its 1 billion total supply circulating: an 80% float, a market cap of $800 million, and an FDV of $1 billion. The two numbers nearly agree, only 200 million tokens remain to unlock, and whatever selling pressure they represent is modest against the supply already trading. Token B also has an $800 million market cap, at $4 with 200 million of a 1 billion total supply circulating: a 20% float and an FDV of $4 billion. Same market cap, radically different situations. Token B has four times the eventual supply still locked, 800 million tokens queued to arrive, and its price must climb a supply escalator running the other way for as long as those unlocks continue.
A buyer comparing the two by market cap alone sees a tie and might pick Token B for its higher price and apparent momentum. A buyer reading float and FDV sees that Token A is most of the way through its dilution while Token B has barely begun, and that Token B’s $4 price is being held up by a float one-quarter the size, exactly the scarcity that will reverse as supply unlocks. Neither token is automatically good or bad, but they are not remotely the same investment, and only the second reading reveals it. The market cap said they were equal; the FDV and the float said one had a tailwind and the other a four-year headwind.
What responsible vesting looks like
Because the guide has dwelt on the trap, fairness requires describing the healthy version, since a high FDV is not inherently a red flag. Responsible token design vests supply in ways that align insiders with long-term holders rather than setting them up to dump: meaningful cliffs before any team or investor tokens unlock at all, long linear release schedules that spread supply over years instead of dropping it in cliffs, allocations weighted toward ecosystem and community rather than concentrated in early investors, and transparent, published schedules that let the market price the dilution in advance instead of being surprised by it. A project with a high FDV but a slow, transparent, community-weighted unlock schedule and genuine demand growth can absorb its supply gracefully, and many legitimate networks have.
The distinction that matters is therefore not high FDV versus low FDV but scheduled dilution versus demonstrable demand. A token whose users, revenue, or adoption are growing fast enough to soak up its unlocks can carry a high FDV comfortably; a token whose only source of price support was a thin float, facing large near-term unlocks to insiders already in profit, cannot. Reading valuation well means holding the FDV and the unlock schedule in one hand and the demand trajectory in the other, and asking the only question that ultimately sets the price: is real demand growing at least as fast as scheduled supply. When the answer is yes, a high FDV is a sign of ambition; when it is no, the same number is a countdown.
How the numbers mislead, in both directions
Each number lies in its own way, and knowing how is the point of reading them together. Market cap misleads by hiding the future: it makes low-float tokens look cheap and small, showing only the tokens that circulate today and silently omitting the locked supply queued to dilute them, which is exactly why the low-float trap works, buyers who anchor on market cap are reading a number designed, whether intentionally or not, to look better than the token’s real valuation. FDV misleads by ignoring time and probability: it values every future token at today’s price as if all supply existed now, which overstates the case for tokens whose locked supply may be burned, may never fully release, or may be years away, and it treats distant, uncertain dilution as if it were present, which can make a healthy long-vesting project look scarier than it is.
The truth lives in reading both against the unlock schedule. A high FDV is not automatically damning, plenty of legitimate projects launch with most supply locked and vest it responsibly, but a high FDV with imminent, large unlocks to insiders sitting on gains is a specific and readable danger. A low market cap is not automatically a bargain, it may simply be the visible tip of a much larger diluted valuation. The numbers are inputs to a judgment, not verdicts on their own, and the judgment requires the third document neither number contains: the vesting schedule that says how much supply arrives, when, and to whom.
The practical checklist
Reading a token’s valuation honestly comes down to a short sequence. First, check the float: circulating supply divided by total supply, because it tells you at a glance how much of the story the market cap is hiding, a float near 100% means the two numbers agree, a float near 10% means the market cap is showing you a tenth of the eventual supply. Second, read the gap: compare market cap to FDV, and treat a large gap as a flag to investigate, not a verdict, but never a number to ignore. Third, pull the unlock schedule: find out how much locked supply exists, when it releases, and to whom, because that calendar is the future selling pressure the FDV only summarizes, and imminent large unlocks to early investors are the specific danger the low-float trap is built on. Fourth, weigh demand against supply: ask whether the project’s growth in users, revenue, or adoption is plausibly fast enough to absorb the scheduled unlocks, because that race, demand growth against supply release, is what actually sets the price over time.
The deeper habit, beneath the checklist, is refusing to let a single number make the decision. Crypto’s most expensive lesson is that a token can be simultaneously cheap by one honest measure and dangerously expensive by another, and that the two measures diverge precisely in the tokens most aggressively marketed as opportunities. Market cap tells you what the market pays for what exists. FDV tells you what it is implicitly paying for what is coming. Neither is the truth alone; the truth is in the space between them, on the unlock calendar, and the traders who read that space before they buy are reading the one part of a token’s valuation that the price chart, the marketing, and the market cap are all designed to keep them from seeing until it is too late.
A closing note on where these numbers come from, because trusting a tracker blindly reintroduces the very ambiguity the guide warns against. Market cap and FDV are computed from supply figures that projects self-report and aggregators standardize imperfectly, total supply can change if a project mints or burns tokens, maximum supply is sometimes uncapped entirely, which makes FDV undefined or meaningless, and circulating supply, as covered above, is the softest input of all. The disciplined reader treats the headline numbers as starting points and verifies the underlying supply mechanics: is there a hard cap, is supply inflationary, are tokens being burned, and does the unlock schedule match what the tracker implies. These checks take minutes and routinely overturn the first impression, a token with an uncapped supply has no true FDV, a token with aggressive burns may see supply shrink instead of grow, and a token whose emissions never end is diluting holders forever regardless of any headline ratio. The two numbers are tools for asking better questions, not answers to be trusted on sight, and the space between them, mapped against the real supply schedule, is where a token’s honest valuation actually lives.
Disclaimer: This article is for educational purposes only and does not constitute investment advice. Digital asset markets are volatile and you can lose your entire investment. Details are current as of July 9, 2026. Always do your own research.
Frequently asked questions
What is the difference between market cap and FDV?
Market capitalization is circulating supply times price: the value of the tokens available to trade right now. Fully diluted valuation is total supply times price: the value of every token that will ever exist at today’s price. When most supply already circulates, the two are close; when most supply is locked, FDV can be many times larger than market cap, revealing hidden future supply the market cap conceals.
Why does a high FDV matter if those tokens are not circulating yet?
Because the locked tokens are scheduled to enter circulation over time through unlocks, and each unlock adds sellable supply the market must absorb. A high FDV relative to market cap means large amounts of supply are queued to arrive, often to insiders holding gains, creating persistent selling pressure. FDV is a preview of that scheduled dilution, which is why it can matter more than the current market cap.
What is a low-float, high-FDV token?
It is a token with only a small fraction of its total supply circulating and a fully diluted valuation many times its market cap. The thin float makes the price easy to move up early, attracting buyers, while the huge locked supply is scheduled to unlock over time. Many such tokens from the 2024 cycle rose sharply then fell relentlessly as unlocks flooded the market, making the pattern a well-known trap.
Is a low market cap always a good buying opportunity?
No. A low market cap can simply be the visible tip of a much larger fully diluted valuation, with most supply locked and scheduled to dilute holders over years. A token can look cheap by market cap and be expensive by FDV at the same time. Reading market cap without checking FDV and the unlock schedule is exactly the mistake the low-float trap exploits.
How do I find a token’s unlock schedule?
Token unlock and vesting schedules are published by projects and aggregated by several analytics platforms that track upcoming releases, their sizes, and their recipients. The schedule tells you how much locked supply exists, when it becomes sellable, and whether it goes to team, investors, or ecosystem, which is the information FDV only summarizes and the single most useful supplement to both valuation numbers.
Can circulating supply be misleading?
Yes. Circulating supply is meant to count freely tradable tokens, but methodologies vary and it can be reported generously, counting tokens held in team or foundation wallets that will not sell, or excluding supply to flatter the figure. Because market cap depends on it, an inflated or understated circulating supply distorts the market cap directly, which is why total supply and FDV, harder to fudge, are useful cross-checks.
Does a high FDV always mean a token is a bad investment?
No. Many legitimate projects launch with most supply locked and vest it responsibly over years, and a high FDV alone is not damning. The danger is specific: a high FDV combined with large, imminent unlocks to insiders sitting on gains, into a market whose demand is not growing fast enough to absorb them. FDV is a flag to investigate the unlock schedule, not an automatic verdict.
Which number should I use to compare two tokens?
Use both, plus the unlock schedule. Comparing by market cap alone can make a low-float token look smaller and cheaper than a high-float token that is actually more fairly valued. Comparing by FDV alone can penalize a responsibly vesting project. The honest comparison weighs each token’s market cap, its FDV, its float, and how fast its scheduled supply arrives against its actual demand growth.
Disclosure: This article does not represent investment advice. The content and materials featured on this page are for educational purposes only.



Hashdex said it will liquidate its eponymous spot-price Bitcoin exchange-traded fund this month, distributing the cash to all remaining shareholders and selling the fund’s roughly 225 BTC holdings.
In a filing on Monday, the fund issuer said the decision was made after evaluating factors including trading liquidity, operating costs and investor interest. The 200,000 shares, which have traded on NYSE ARCA under the DEFI ticker since March 2024, have net assets of $14.25 million, according to the fund’s website.
Late to the game, which saw the first of 10 other competing BTC ETFs debut months ahead of it, analysts saw opportunity at a time when BTC was trading for the then-all-time high of more than $73,000.
“The getting is so good right now I could see this one getting some bites (if the fee is competitive) despite being so late,” said Bloomberg Senior ETF analyst Eric Balchunas in a March 27, 2024 post.
Originally launched in 2022 as a Bitcoin futures ETF, Hashdex Bitcoin Futures ETF, its highest asset level was $17.54 million, reached on May 9, 2025, according to data tracker SoSoValue. The next largest ETF among the US-traded BTC issues is WisdomTree Bitcoin Trust (BTCW), with $140.37 million in net assets as of Friday’s market close.
Related: Bitcoin may find bear market bottom in August: 10x Research
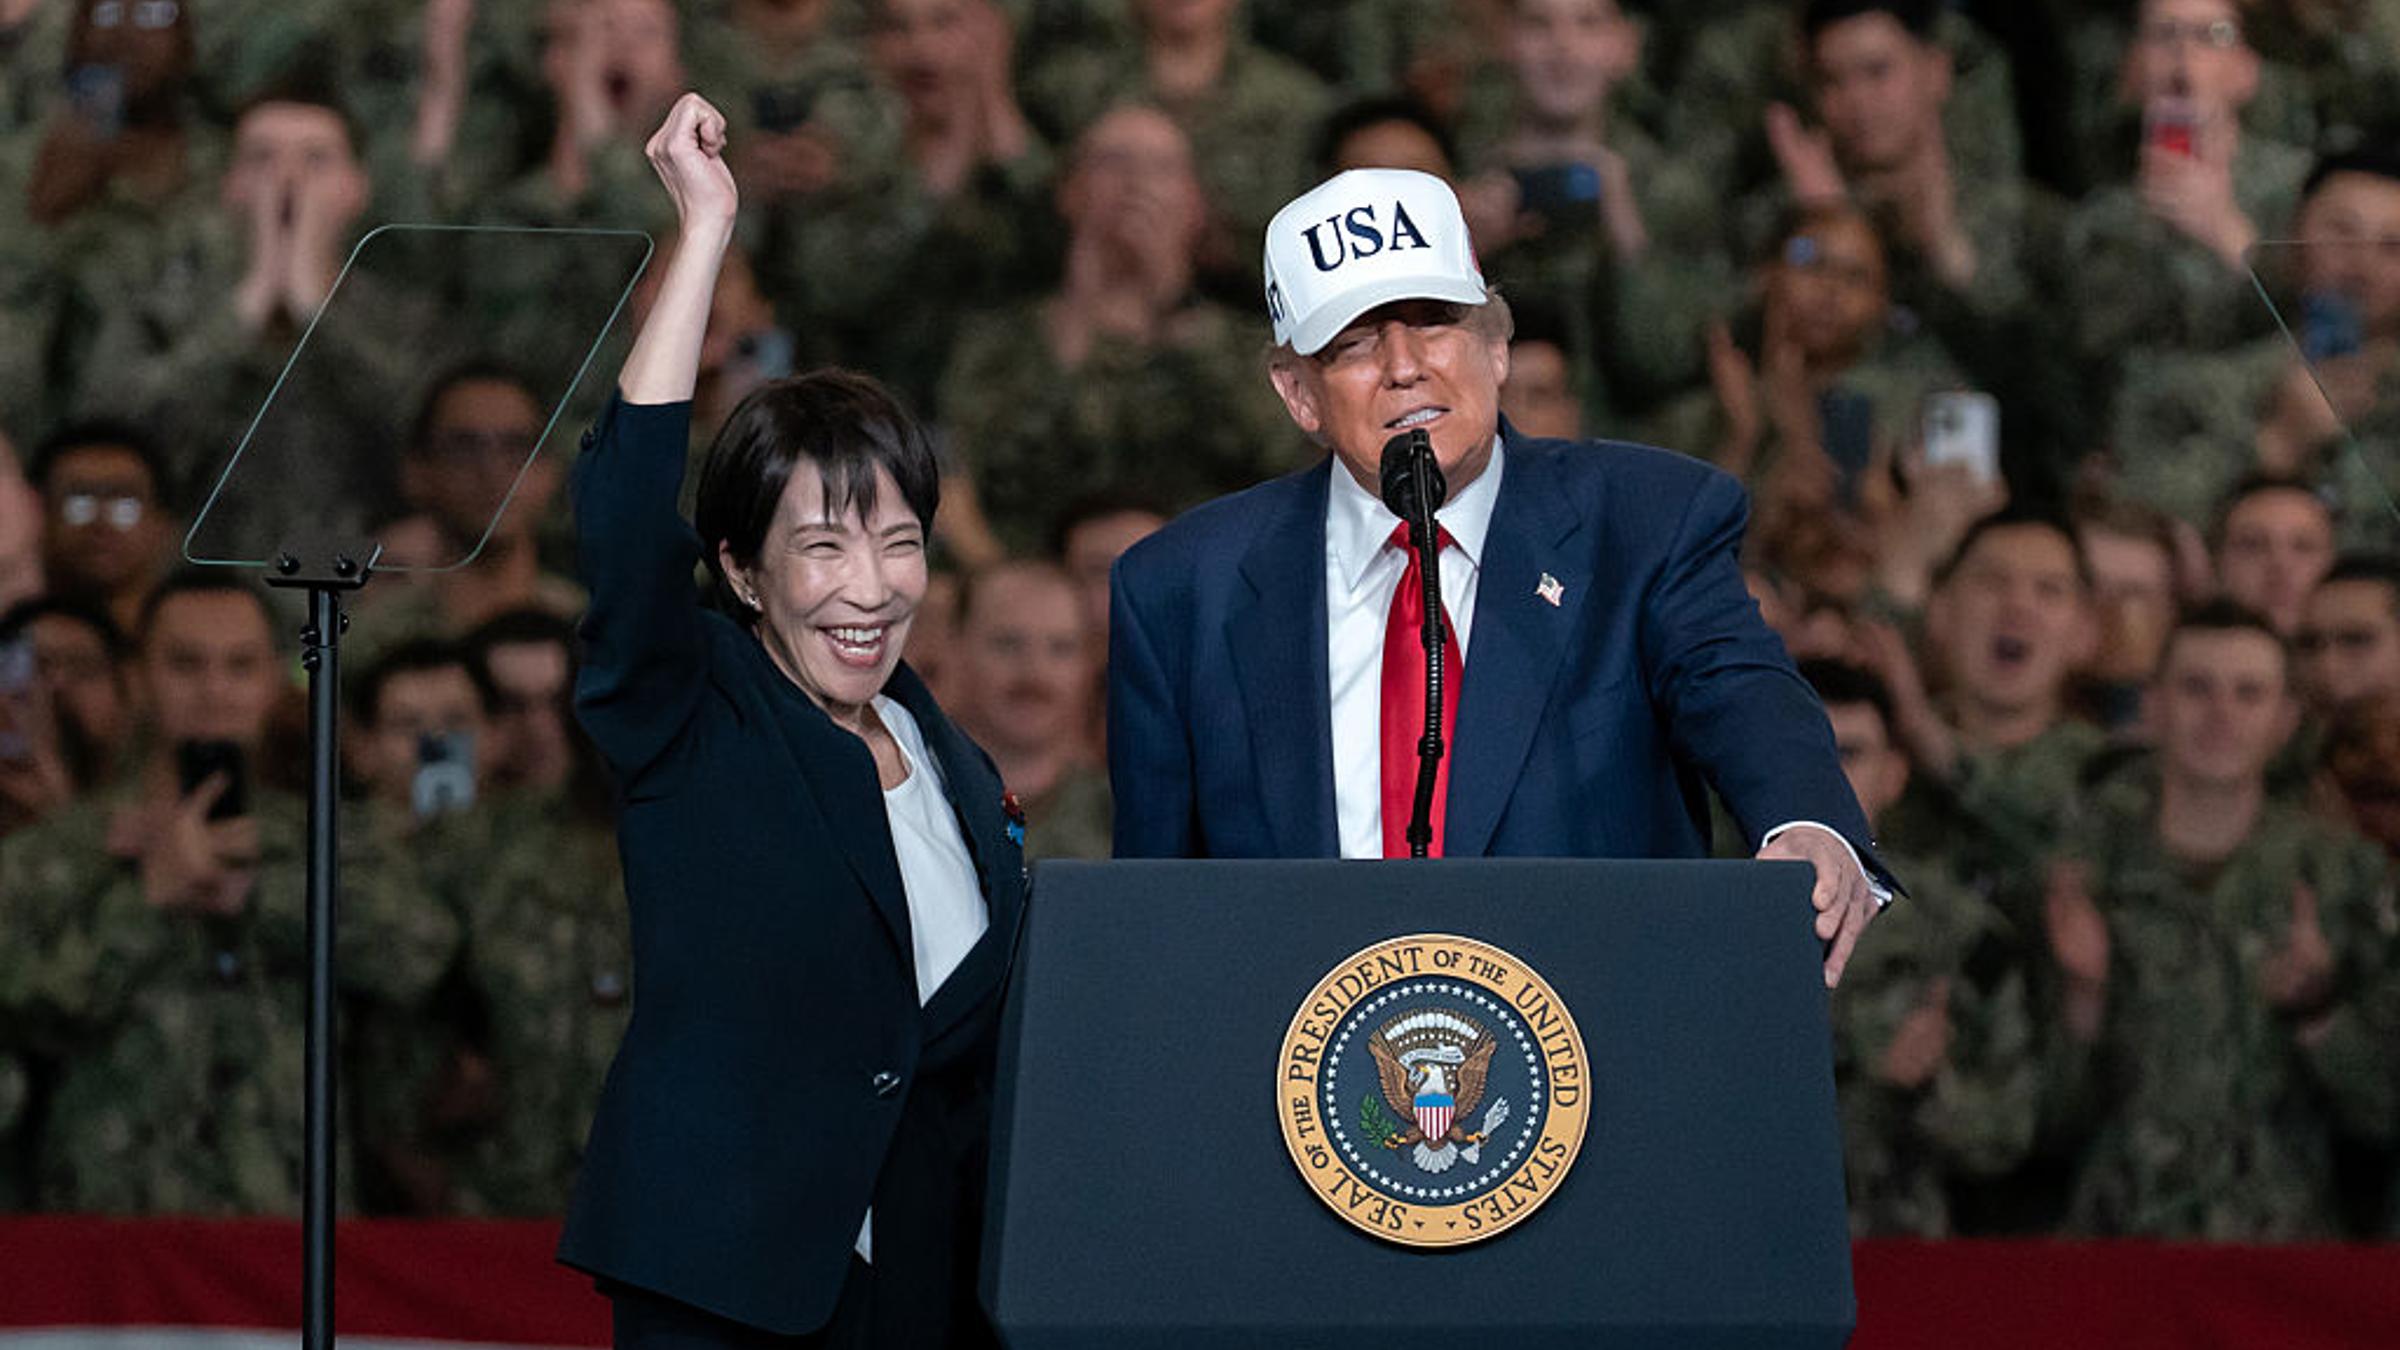
When asked why the United States intervened to support the Japanese currency, U.S. President Donald Trump told reporters aboard Air Force One over the weekend that the U.S. is “always there” for Japan.
“They have a weakening yen, and they wanted a little bit of help,” he said. When questioned over what the U.S. is “getting out of that arrangement,” Trump replied “financial benefit,” but emphasized it’s also “good for the world economy.”
What is behind the fall in the yen?
Japan had already expressed “serious concern” over the yen’s rapid depreciation in March and conducted unilateral intervention between April 28 and May 27.
Despite those efforts, the currency continued to weaken, with the yen sliding to 163.73 per dollar on Thursday before rebounding to 157.57 on Friday.
One reason a stronger yen matters is Japan’s dependence on imported energy. According to the International Energy Agency, Japan remains heavily reliant on imported oil and gas, particularly from the Middle East.

Strategy, the publicly traded Bitcoin holding company formerly known as MicroStrategy and led by chairman Michael Saylor, disclosed another sizable Bitcoin sale in an SEC filing. In the period from July 27 through Sunday, the company sold 1,638 BTC and used the proceeds to support capital-market obligations tied to its preferred stock financing structure.
According to the company’s Monday 8-K filing, the sale totaled $104.7 million at an average price of $63,957. Of that amount, $52.4 million was allocated to dividend payments on its STRC preferred stock, while $52.3 million funded STRC share repurchases.
Key takeaways
- Strategy sold 1,638 Bitcoin from July 27 through Sunday, generating $104.7 million, per an SEC 8-K.
- Dividend funding and STRC buybacks accounted for nearly all sale proceeds, underscoring how Bitcoin liquidity is being used to manage preferred-stock obligations.
- The company says it now holds 842,138 BTC, bought at an aggregate cost of $63.5 billion.
- Strategy also raised $290.6 million through MSTR share sales during the same period, increasing its US dollar reserve to $4 billion as of Sunday.
- STRC trades below its $100 target value—something investors may watch because it can affect the attractiveness and efficiency of future STRC fundraising.
Bitcoin sales feed dividends and STRC repurchases
In the latest disclosure, Strategy characterized the July 27-to-Sunday transaction as one of its larger BTC sales for the year. The company’s filing indicates this was its second-largest Bitcoin sale of 2024.
Crucially, the proceeds were not used for general corporate purposes. Instead, they were split between two items linked to STRC: dividend payments on the preferred stock and STRC repurchases. Together, those allocations amounted to just over $104.7 million, leaving little room for other uses from this tranche.
Strategy’s total Bitcoin balance after the sale stands at 842,138 BTC, with the company reporting an aggregate acquisition cost of $63.5 billion.
How this compares with earlier reported BTC sales
The latest sale follows other previously disclosed events that frame Strategy’s approach to managing its capital structure.
Earlier coverage noted that Strategy sold 3,588 BTC for about $216 million on July 6. The company also disclosed that it sold 32 Bitcoin in early June—its first reported BTC sale since a 2022 tax-loss transaction.
While each sale reduces the company’s Bitcoin exposure, the repeated pattern of tying sale proceeds to STRC-related obligations suggests Strategy is treating Bitcoin liquidity as part of a broader financing and cash-management playbook rather than treating every sale as an isolated departure from its prior accumulation stance.
Cash buffer grows as USD reserve rises to $4 billion
Alongside the BTC sale disclosure, Strategy reported raising additional funds through MSTR share sales during the same period. According to the 8-K, it raised $290.6 million, with multiple allocations.
The filing states that $250 million of the MSTR proceeds was used to increase Strategy’s US dollar reserve, which stood at $4 billion as of Sunday. It also reports that $28.9 million funded STRC repurchases and $11.7 million was added to the company’s cash balance.
In a post on X on Monday, Michael Saylor said Strategy repurchased $81.2 million worth of STRC stock and extended its US dollar “runway” by 57 days to 2.3 years.
STRC trading below target and what that may imply
Strategy’s financing mechanism includes its perpetual preferred stock, STRC. Market data cited in the report suggests STRC was trading at $89.40 during Monday’s pre-market session, or about 10.6% below its $100 target value, according to Yahoo Finance data.
In the same period, the company’s common stock—MSTR—was indicated to have declined roughly 0.9% in pre-market trading, based on Yahoo Finance data referenced in the article.
Trading below STRC’s intended par has potential consequences for Strategy’s capital strategy. If STRC remains below target value, investors may view future fundraising through STRC sales as less efficient for Strategy—because selling preferred stock at a discount typically brings in fewer dollars per unit sold relative to the target. That, in turn, can increase the importance of the company’s dividend policy to attract buyers and provide support to STRC pricing.
Earlier comments from CryptoQuant CEO Ki Young Ju had urged Strategy to pause Bitcoin purchases and replenish cash reserves after dividend coverage deteriorated. In a June 24 X post, Ju said the company should “pause Bitcoin purchases, rebuild cash reserves, and adopt a systematic framework for purchase timing.” Earlier reporting in the same context noted that dividend coverage had fallen to 14 months from seven years.
Strategy has previously responded to these concerns by laying out a framework for capital allocation. A June 29 8-K filing described a capital framework allowing Bitcoin sales to fund dividends, raised the annual dividend rate on STRC preferred stock to 12%, and disclosed that the US dollar reserve had grown to $2.55 billion.
What investors should watch next is whether the new $4 billion USD reserve and the disclosed approach—using Bitcoin sales to service STRC dividends and repurchases—continues alongside STRC trading conditions, particularly how far STRC remains below target and whether Strategy’s dividend and preferred-stock buyback activity accelerates or slows in subsequent filings.
Hashdex will close and liquidate its US-listed Bitcoin ETF, DEFI, after the fund struggled to attract enough assets and trading activity to remain viable.
Summary
- DEFI held approximately $14.7 million in assets as of July 30.
- The fund’s final trading day is Aug. 17, followed by its NYSE Arca delisting.
- Remaining shareholders should receive a cash liquidation payment around Aug. 28.
- Hashdex’s separate $206.8 million NCIQ crypto index ETF remains active.
DEFI will stop trading on Aug. 17
According to a WSJ report, asset management company Hashdex said the Hashdex Bitcoin ETF, which trades on NYSE Arca under the DEFI ticker, will stop trading after the market closes on Aug. 17. The company will then begin liquidating the fund’s assets and delist its shares.
The fund will also stop accepting creation orders from authorized participants after that date. Investors can continue buying and selling shares through their brokers until the final trading session, although market prices may differ from the fund’s net asset value as the closure approaches.
Hashdex attributed the decision to several factors, including the fund’s asset base, trading liquidity, operating expenses and investor demand. DEFI managed about $14.7 million as of July 30, placing it among the smaller US spot Bitcoin products.
The fund’s website listed a net asset value of $71.32 per share and a closing price of $71.15 as of July 31. DEFI normally invests at least 95% of its assets in spot Bitcoin, with the remainder available for cash, cash equivalents, and CME-listed Bitcoin futures.
Shareholders will receive cash after liquidation
Investors who continue holding DEFI shares after the final trading day will not receive Bitcoin. Instead, the fund will sell its holdings and distribute the remaining proceeds in cash after deducting its liabilities and liquidation costs.
Hashdex expects to make the distribution around Aug. 28. The amount shareholders receive will depend partly on Bitcoin’s price while the portfolio is being liquidated, meaning the final payment may differ from DEFI’s net asset value before trading ends.
The liquidation could also create tax consequences for US investors. A cash distribution may be treated as a taxable disposal, depending on the shareholder’s cost basis, account type and individual circumstances.
Investors who sell their shares before Aug. 17 will receive the prevailing market price rather than the final liquidation value. Trading volume and the spread between bid and ask prices could become more important as the fund approaches delisting.
Hashdex faced heavy competition from larger Bitcoin ETFs
DEFI entered the US spot Bitcoin ETF market through a conversion of an existing futures-based product. The fund began holding spot Bitcoin in March 2024, more than two months after the SEC approved the first wave of spot Bitcoin ETFs in January.
That timing placed DEFI behind larger competitors that had already accumulated substantial assets and trading volume. Its relatively small asset base made it harder to compete on liquidity, despite charging a 0.25% expense ratio.
The closure does not signal Hashdex’s exit from the US crypto ETF market. Its separate Hashdex Nasdaq CME Crypto Index ETF, trading under NCIQ, held about $206.82 million in net assets as of July 31.
NCIQ currently provides market-cap-weighted exposure to Bitcoin, Ethereum, XRP, Solana, Cardano, Chainlink, Stellar and Bitcoin Cash. Bitcoin represented 78% of its portfolio as of July 27, while Ethereum accounted for 12.2%.
Hashdex also reduced NCIQ’s annual management fee from 0.50% to 0.25% in March. The fund was renamed from the Hashdex Nasdaq Crypto Index US ETF in January but retained its existing ticker.
DEFI investors face three remaining dates
DEFI shareholders now face a short liquidation timeline. Aug. 17 will be the final day to sell shares on NYSE Arca and the cutoff for new creation orders. Hashdex will then unwind the portfolio before making the expected cash payment around Aug. 28.
Bitcoin price changes during that period will affect the fund’s remaining assets and, in turn, its final distribution. Investors who retain their shares through liquidation should also expect the position to disappear from their brokerage accounts once the cash payment is processed.
The closure applies only to DEFI and does not affect NCIQ or Hashdex’s other crypto investment products.


South Korean cryptocurrency exchange Bithumb said Monday it plans to apply for a preliminary listing review in 2027 and complete an initial public offering in 2028.
Bithumb said it has reorganized its business structure, including spinning off Bithumb Asset, to clarify responsibilities across its business units and reduce potential conflicts of interest ahead of the listing review.
The exchange said its preparations will include upgrading internal controls and shifting from domestic accounting standards to K-IFRS, the international accounting framework used by listed companies in South Korea.
Bithumb said the timetable could change depending on market conditions and the review schedules of relevant authorities.
The exchange is one of five South Korean platforms that support fiat currency trading through real-name bank accounts, offered through its partnership with KB Kookmin Bank.
Bithumb’s listing push comes as rival South Korean exchanges deepen their ties with traditional finance and technology groups. Mirae Asset Consulting took control of rival exchange Korbit on July 23, while Upbit operator Dunamu is pursuing a share-swap deal that would make it a wholly owned subsidiary of Naver Financial, subject to regulatory and shareholder approval.
Related: Kiwoom eyes Bithumb stake as Korean brokerages push into crypto: Report
Bithumb’s 620,000 BTC crediting error
In a February promotional error, Bithumb mistakenly credited customer accounts with balances totaling 620,000 Bitcoin instead of distributing 620,000 Korean won in cash rewards. Bithumb recovered 99.7% of the erroneous credits, though customers sold about 1,788 BTC before accounts were frozen.
At a Feb. 11 National Assembly parliamentary hearing, Bithumb CEO Lee Jae-won said the exchange’s process for checking the planned distribution against its actual holdings had failed and that the promotional amount had not been earmarked in a separate account.
Its IPO preparations also come as two Bithumb-linked listed companies face continuing audit and listing problems. Vidente, a major Bithumb shareholder, and Bucket Studio, which indirectly controls Vidente, have had trading in their shares suspended since March 2023 over audit and other listing issues.
According to Yonhap news agency, Bucket Studio appointed a former police official as its standing auditor in June, while Vidente plans to appoint a former National Tax Service official to the same role. South Korea’s Government Public Service Ethics Committee cleared both hires after finding no close relationship between the officials’ previous duties and their new roles.
Magazine: The 100x obsession: Fundamentals grow in importance as crypto matures
Bitmine Immersion Technologies added 10,399 ETH to its treasury and repurchased another 4.5 million shares, but BMNR stock fell toward $17 as investors weighed its mounting unrealized losses.
Summary
- Bitmine acquired 10,399 ETH, lifting its holdings to 5,797,813 ETH.
- The company now controls about 4.8% of Ethereum’s total supply.
- Bitmine repurchased 4.5 million BMNR shares during its third consecutive week of buybacks.
- BMNR traded near $17.06, with technical indicators showing weak trend strength.
Bitmine’s Ethereum holdings approach 5.8 million ETH
Bitmine said it acquired another 10,399 ETH over the past week, continuing the accumulation strategy it adopted last year. The purchase increased its total holdings to 5,797,813 ETH, equivalent to approximately 4.8% of Ethereum’s circulating supply.
The latest purchase followed Bitmine’s acquisition of 9,946 ETH during the previous week. Together, the transactions added more than 20,000 ETH to the company’s treasury within two weeks.
Chairman Tom Lee linked the continued accumulation to Ethereum’s recent performance against US technology stocks. He said ETH outperformed the Nasdaq 100 by 25% during July, its widest margin since July 2025.
“This is the largest outperformance since July 2025, and we believe it is reflective of the strengthening fundamentals of crypto.”
Lee noted that ETH climbed from $2,375 in July 2025 to $4,057 by the end of the following month. However, past performance does not guarantee that Ethereum or BMNR will repeat that move.
Bitmine has maintained its accumulation strategy despite the broader crypto downturn and the paper losses attached to its holdings. DropsTab estimates that the company has an unrealized loss of approximately $8.8 billion on its Ethereum position.
Staked ETH could generate $247 million annually
Bitmine has also placed most of its Ethereum treasury into staking. The company reported 4,917,189 ETH staked, representing nearly 85% of its total holdings.
At the stated valuation, the staked position is worth about $9.2 billion. Bitmine projects that it could generate approximately $247 million in annualized staking revenue.
Staking provides the company with ETH-denominated income while it holds the asset on its balance sheet. However, that revenue may fluctuate with Ethereum’s staking yield, validator performance and the market value of ETH.
The strategy also means BMNR investors are exposed to several overlapping risks. These include Ethereum price volatility, the company’s cost basis, dilution from capital raises and operational risks associated with staking such a large position.
For US investors, BMNR offers equity-market exposure to Ethereum without requiring direct token custody. Unlike a spot Ethereum exchange-traded fund, however, the stock also carries corporate management, financing and capital-allocation risks.
BMNR buyback enters its third consecutive week
Bitmine repurchased 4.5 million common shares during the past week, marking the third straight week of purchases under its buyback program.
The company has now bought back more than 16 million shares. Management said it considers BMNR attractively valued relative to its assets and long-term Ethereum strategy.
Share repurchases reduce the number of outstanding shares when they are retired, potentially increasing each remaining shareholder’s proportional claim on the company. Their impact depends on the price paid, the source of the funds, and whether new stock issuance offsets the reduction.
Lee argued that periods of strong monthly ETH performance against the Invesco QQQ Trust have historically been followed by BMNR outperforming Ethereum during the next month. That relationship remains a company observation rather than a guarantee of future returns.
The buyback may provide some support for BMNR, but investors have yet to respond positively to the latest Ethereum purchase and repurchase announcement.
BMNR stock struggles with resistance near $17.15
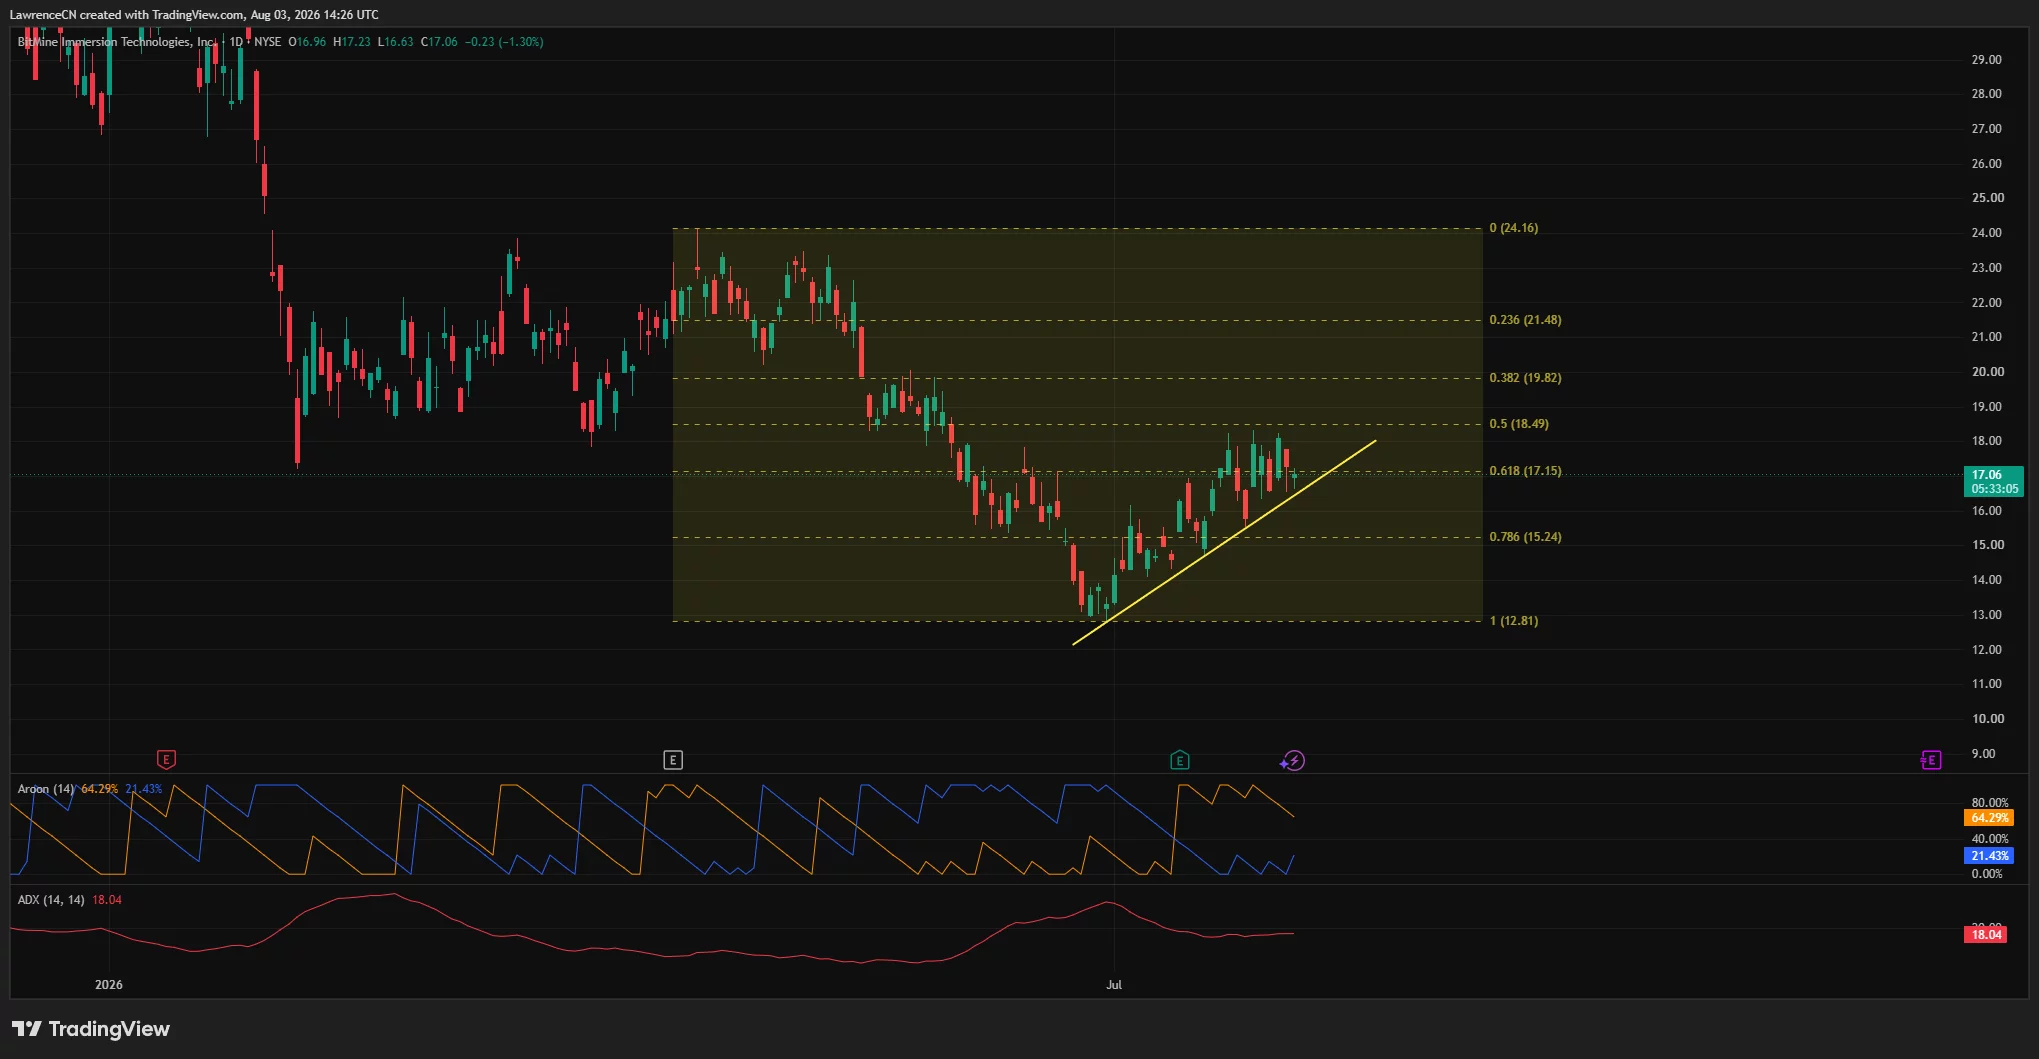
BMNR traded near $17.06 on Aug. 3, falling about 1.3% on the daily chart. The stock recorded an intraday high of $17.23 and a low of $16.63.
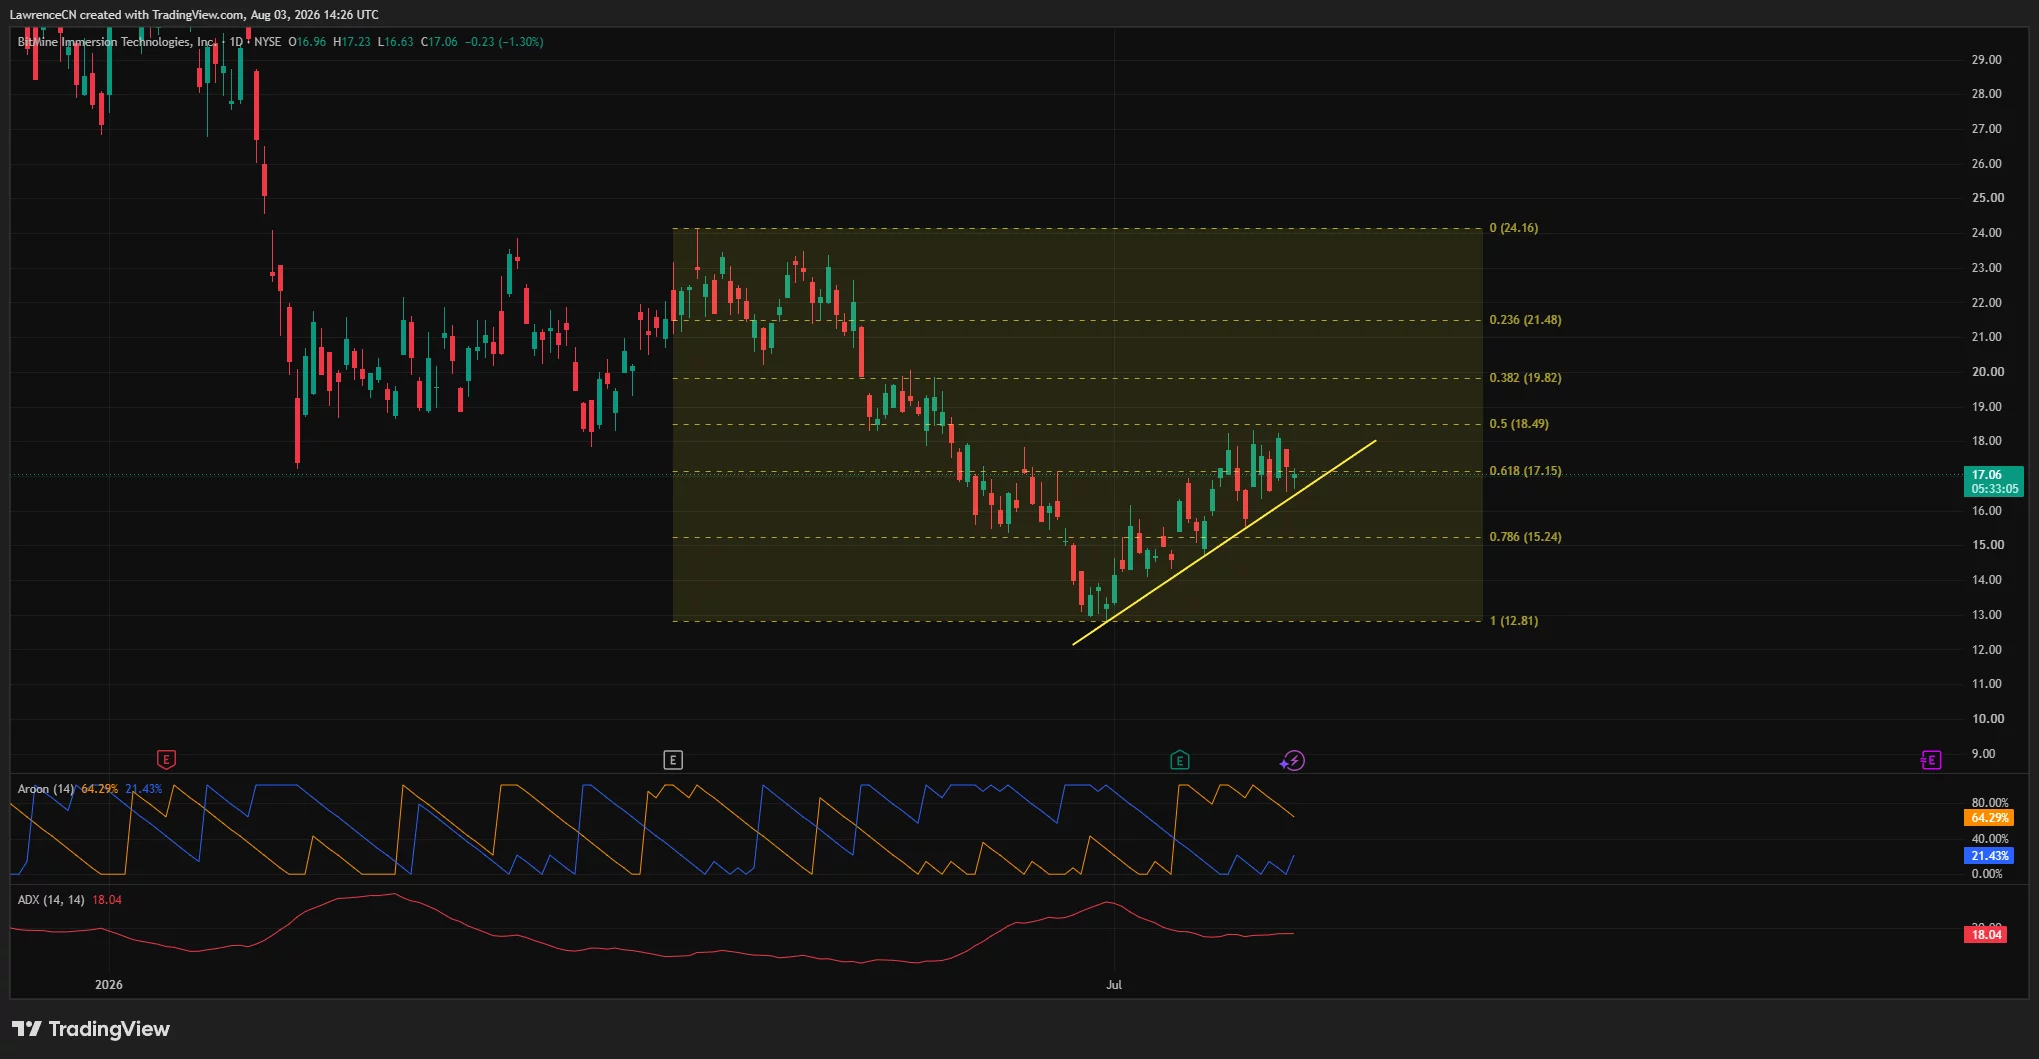
BMNR price is testing the 61.8% Fibonacci retracement at $17.15, which is acting as the immediate resistance level. A daily close above that mark could allow BMNR to challenge $18.49, corresponding to the 50% retracement level.
The next resistance sits at $19.82. A stronger recovery beyond that level could bring $21.48 into focus, although the stock would need greater momentum and trading volume to sustain such a move.
BMNR remains above an ascending trendline drawn from its June low near $12.81. That structure suggests the short-term recovery has not failed, but the stock has struggled to build momentum above $17.
Aroon readings of 64.29% and 21.43% favor the recent recovery attempt. However, the average directional index stands at 18.04, below the commonly watched 20 threshold, indicating that the prevailing trend remains weak.
A rejection at $17.15 could send BMNR back toward the rising trendline around $16. Stronger support sits at the 78.6% Fibonacci level of $15.24. A decisive break below that area would weaken the recovery structure and increase the risk of another test of $12.81.
Disclosure: This article does not represent investment advice. The content and materials featured on this page are for educational purposes only.

Bitcoin begins the first full week of August trading around the $63,000 area as traders look past a difficult macro calendar and focus on a fresh, ongoing catalyst from within the crypto ecosystem. Sentiment is being tested by the fallout from a Coldcard wallet hack, while broader markets await key US data and geopolitical signals that can swing risk assets.
At the same time, investors are weighing whether August will follow the bearish script that has marked prior cycles. Even with July ending higher, analysts point to technical resistance and liquidation zones that could amplify downside if momentum fades.
Key takeaways
- Bitcoin is hovering near $63,000 as traders digest the continuing Coldcard hardware wallet incident and its effects on flows.
- Crypto market participants say US nonfarm payrolls—due Thursday—may drive volatility depending on how labor strength and unemployment evolve.
- Oil prices slid after President Donald Trump signaled potential movement on an Iran-related deal, adding to macro uncertainty for risk assets.
- Long-term holder behavior appears consistent with accumulation, even as near-term traders warn that resistance could keep August pressured.
- CoinGlass and other technical observers highlight the 50-month EMA around $65,827 as a key barrier, while derivatives positioning points to liquidation risk near $64,200.
Why Treasury and FX policy still matters to crypto
The week’s macro backdrop is shaped not only by upcoming US economic releases, but also by renewed attention to how dollar liquidity and Treasury market stress can spill into global financial conditions. According to QCP Capital, the US and Japan executed a rare coordinated foreign-exchange intervention last week, designed to support the yen after it neared levels around 164 per USD, based on TradingView data.
QCP Capital emphasized that the operation’s mechanics matter: the New York Fed acted as a fiscal agent using the Federal Reserve’s Foreign and International Monetary Authorities (FIMA) repo facility, rather than reflecting a Federal Reserve monetary-policy decision. In QCP’s view, that distinction highlights how institutions outside the FOMC can still move liquidity and influence broader conditions.
Further, industry commentary cited a desire to reduce the risk of Japan selling large quantities of US Treasuries, which could otherwise disrupt the dollar environment. Louise Loo of Oxford Economics told CNBC that volatile conditions tied to potentially fiscally aggressive policies in Japan could extend into US Treasury markets, destabilizing the dollar.
In a post on X, Treasury Secretary Scott Bessent also argued the FIMA facility could be used again, describing it as an “important backstop” and encouraging that it be “upsized” in coming months. For crypto traders, the practical takeaway is that interventions affecting FX and Treasury-market liquidity can quickly shift risk appetite—often before any direct crypto-specific news lands.
US payrolls, oil, and the Iran signal: the risk-asset checklist
For digital-asset markets, the next major swing factor is Thursday’s nonfarm payrolls release. Earlier in this cycle, weaker-than-expected labor numbers put pressure on expectations for how aggressively the Federal Reserve might move on rates, a dynamic that coincided with a reaction in Bitcoin when June payroll data came in well below forecasts, as Cointelegraph previously reported.
Market positioning for Thursday remains mixed. Continuum Economics, for example, expects July nonfarm payrolls to rise by 120k overall (and 110k in the private sector), while also projecting unemployment will edge up to 4.3% from 4.2%. The firm’s forecast also notes average hourly earnings rising by 0.3% in line with its trend, according to its published preview.
Beyond labor data, traders are monitoring signals related to US-Iran de-escalation. On Sunday, President Donald Trump posted on Truth Social that he had agreed to cancel further strikes on Iranian territory “subject to being able to rapidly make a DEAL,” adding language about potential opening of the Strait of Hormuz and an end to Iran’s nuclear threat. Oil responded quickly, with both WTI and Brent down by more than 8% on Monday.
For crypto markets, the relevance of oil is straightforward: sustained moves in energy prices often feed into inflation expectations and, by extension, interest-rate expectations. When the path of rates is uncertain, risk assets—including Bitcoin—tend to trade with sharper sensitivity to macro surprises.
Coldcard hack: exchange inflows rise, but not in an outsized way
On the crypto side, one of the most immediate concerns remains the Coldcard wallet hack. Earlier coverage cited a “low-entropy bug” in Coldcard hardware wallets, with theft activity continuing for multiple days. Galaxy Research’s Alex Thorn advised Coldcard users to move funds “ASAP” and suggested using higher transaction fees to reduce the time spent interacting with the wallets.
Yet exchange flow data suggests the reaction is not turning into a broad, panic-driven transfer into trading venues. According to CryptoQuant, net exchange inflows were 34,932 BTC on Friday and 8,768 BTC on Sunday. CryptoQuant’s data framing indicates the inflow volume, while meaningful on certain days, aligns with typical levels seen during the month rather than representing a one-off liquidation wave.
What did change more noticeably was the number of inbound transactions. CryptoQuant data shows exchanges received 31,217 inbound BTC transactions on Friday, dropping to 19,537 on Sunday. CryptoQuant head of research Julio Moreno attributed the influx mainly to transactions between 1 and 10 BTC, which he said had their highest daily total since early February.
Separately, CryptoQuant reported that on a rolling 30-day basis Bitcoin long-term holders remain in a broad accumulation phase. In its analysis, the BTC LTH Accumulation & Distribution indicator showed LTH supply inflow around 220.4K BTC, implying ongoing inflow into long-term holdings outweighs distribution back to the market.
That combination—exchange activity rising in transaction count, but long-term holders still accumulating—suggests the market is processing the incident through behavior that is more nuanced than a simple rush to sell.
August caution: resistance levels and leverage-built downside
Even as Bitcoin finished July about 7.4% higher, traders are preparing for a difficult August. CoinGlass data shows monthly performance for BTC/USD came in slightly below its 2025 result, but the broader narrative remains that downside pressure can return during August, consistent with patterns some analysts associate with prior midterm-era behavior.
Rekt Capital pointed to the 50-month exponential moving average as an ongoing ceiling, stating on X that the 50-month EMA continues to act as resistance. That level is near $65,827, and the expectation is that repeated rejections could set up further downside continuation.
Derivatives positioning adds another layer of near-term risk. CoinGlass data tracking clusters of high-leverage BTC bets highlighted $64,200 as a potential area where forced liquidations could occur if price moves higher against leveraged positions.
On the other end of the spectrum, quant analyst David Eng described Bitcoin as “sitting on its long-term statistical floor” around $63,000, referencing a power law framework that expects price to grow as a power of time. While such models do not guarantee short-term price direction, they help explain why some participants remain willing to accumulate near specific long-horizon reference points.
With long-term holders accumulating quietly while near-term technicals and leverage maps warn of friction, the next macro prints and any follow-through from the Coldcard incident will likely determine whether August breaks from prior weakness—or extends it.
Traders should watch Thursday’s nonfarm payrolls for cues on rates and risk appetite, while also tracking whether Coldcard-related wallet activity continues to translate into exchange selling or stays contained to transaction-level spikes; the answer could shape how quickly Bitcoin sheds or absorbs this month’s technical pressure.
Bitcoin (BTC) starts the first full week of August circling $63,000 as traders weigh the impact of the ongoing Coldcard wallet hack.
Key points:
- US Treasury Secretary Scott Bessent leverages a Federal Reserve repo facility for a joint intervention as the Japanese briefly recovers from forty-year lows against the dollar
- Oil prices fall sharply as president Donald Trump gives hope of a deal with Iran.
- Bitcoin rounds out July 7.4% higher, but warnings of a red August stay in place.
Bessent eyes further yen interventions
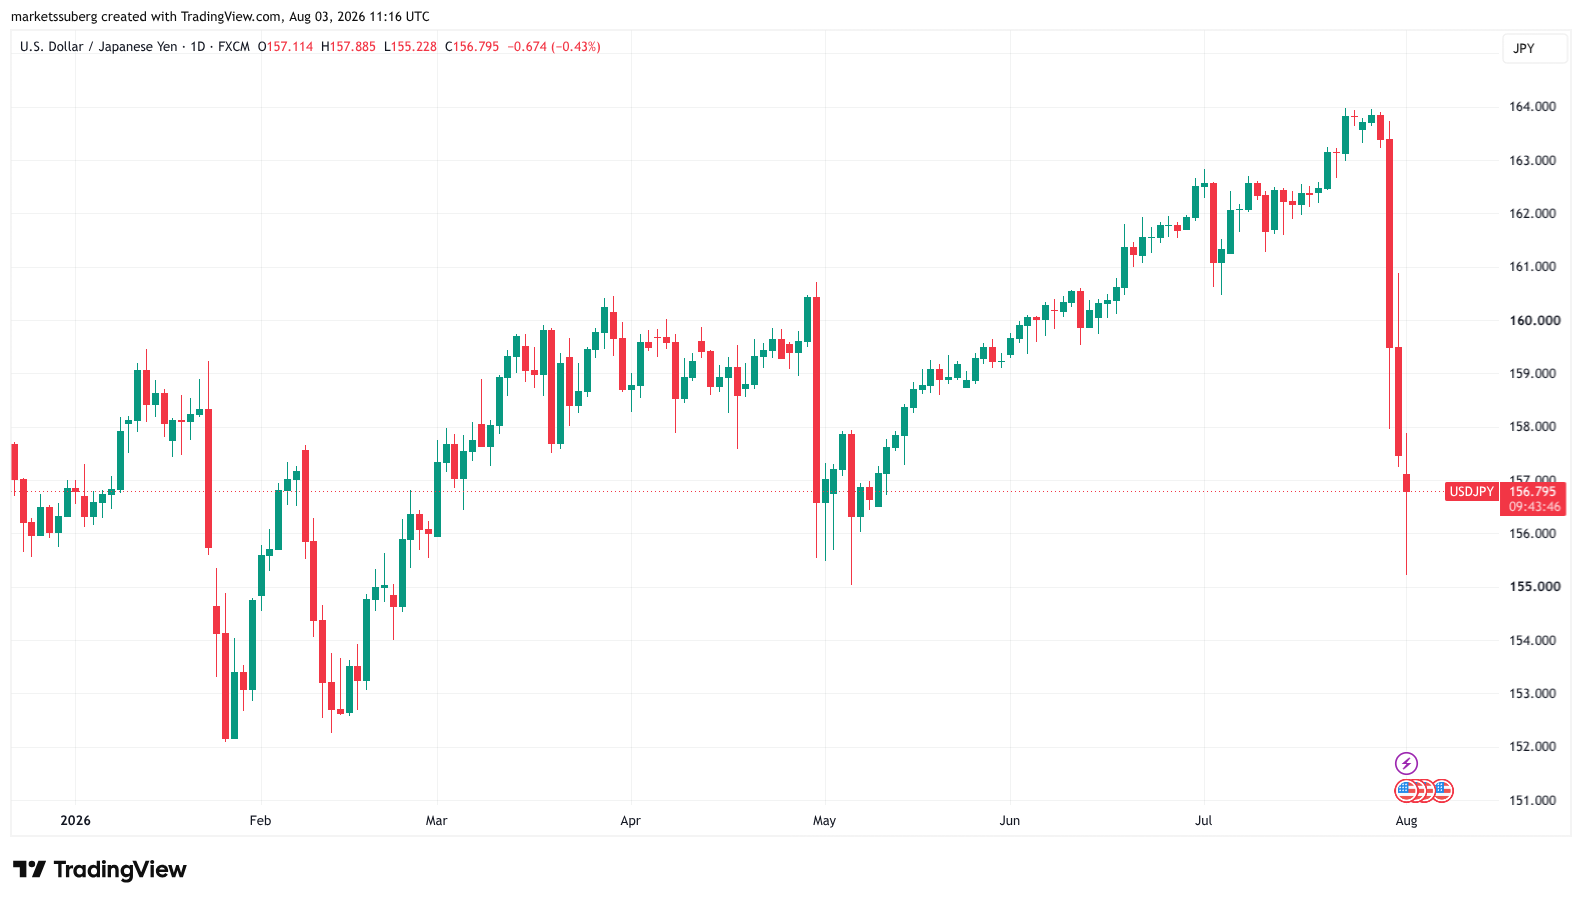
Concerns over US Treasury markets were behind the US decision to intervene in the Japanese yen last week. Washington engaged in a rare operation to support the yen after USD/ JPY had reached almost 164 last week, per data from TradingView.
USD/JPY one-day chart. Source: Cointelegraph/TradingView
“It was the first coordinated US–Japan foreign-exchange intervention since 2011 and the first joint operation specifically supporting the yen since 1998,” crypto trading company QCP Capital noted in analysis released on Monday.
“The distinction matters. The New York Fed acted as the Treasury’s fiscal agent rather than as an independent monetary-policy decision by the Federal Reserve. The operation therefore highlights how institutions outside the FOMC can also influence currencies, liquidity and broader financial conditions.”
Speaking to mainstream media, industry insiders placed emphasis on the desire to avoid Japan selling large amounts of US Treasuries. The use of the Fed’s Foreign and International Monetary Authorities (FIMA) repo facility, which allows a handful of foreign central banks to access dollar liquidity without selling Treasuries, supports the theory.
“There is a self-preservation element here. Volatile markets driven by potentially fiscally-aggressive policies from Japan could extend to the U.S. Treasury markets, destabilizing the dollar,” Louise Loo, head of Asia economics at Oxford Economics, told CNBC.
In a post on X, Treasury Secretary Scott Bessent argued that FIMA could make further appearances going forward.
“Friday’s coordinated foreign exchange actions countered disorderly yen movements. Treasury remains attentive and in close communication with our counterparts at MOF and BOJ. We will not hesitate to participate in further joint intervention. The FIMA Repo Facility is an important backstop. We would encourage it to be upsized in the coming months,” he wrote.
Oil dives as Trump teases hope of Iran deal
US nonfarm payrolls data is the main point of interest for crypto and risk asset traders this week. Due on Thursday, the numbers will shed light on the strength of the labor market as recent US inflation prints have delivered mixed signals.
Last month, nonfarm payrolls came in far lower than expected. Only 57,000 jobs were added in June, short of the 114,000 anticipated, while the previous two months’ numbers were revised down by a combined 74,000 jobs. Bitcoin jumped on the news, because weaker labor-market conditions put pressure on the Federal Reserve to soften its stance on rate hikes.
Some market participants expect a rebound in July’s payrolls data. However, macro research firm Continuum Economics simultaneously projects an uptick in unemployment.
“We expect July’s non-farm payroll to rise by 120k overall and by 110k in the private sector, a significant improvement from June’s respective gains of 57k and 49k but largely explained by a recovery in leisure and hospitality. We expect unemployment to rise to 4.3% from 4.2%, reversing a June decline, and an in line with trend 0.3% rise in average hourly earnings,” it forecast last week.
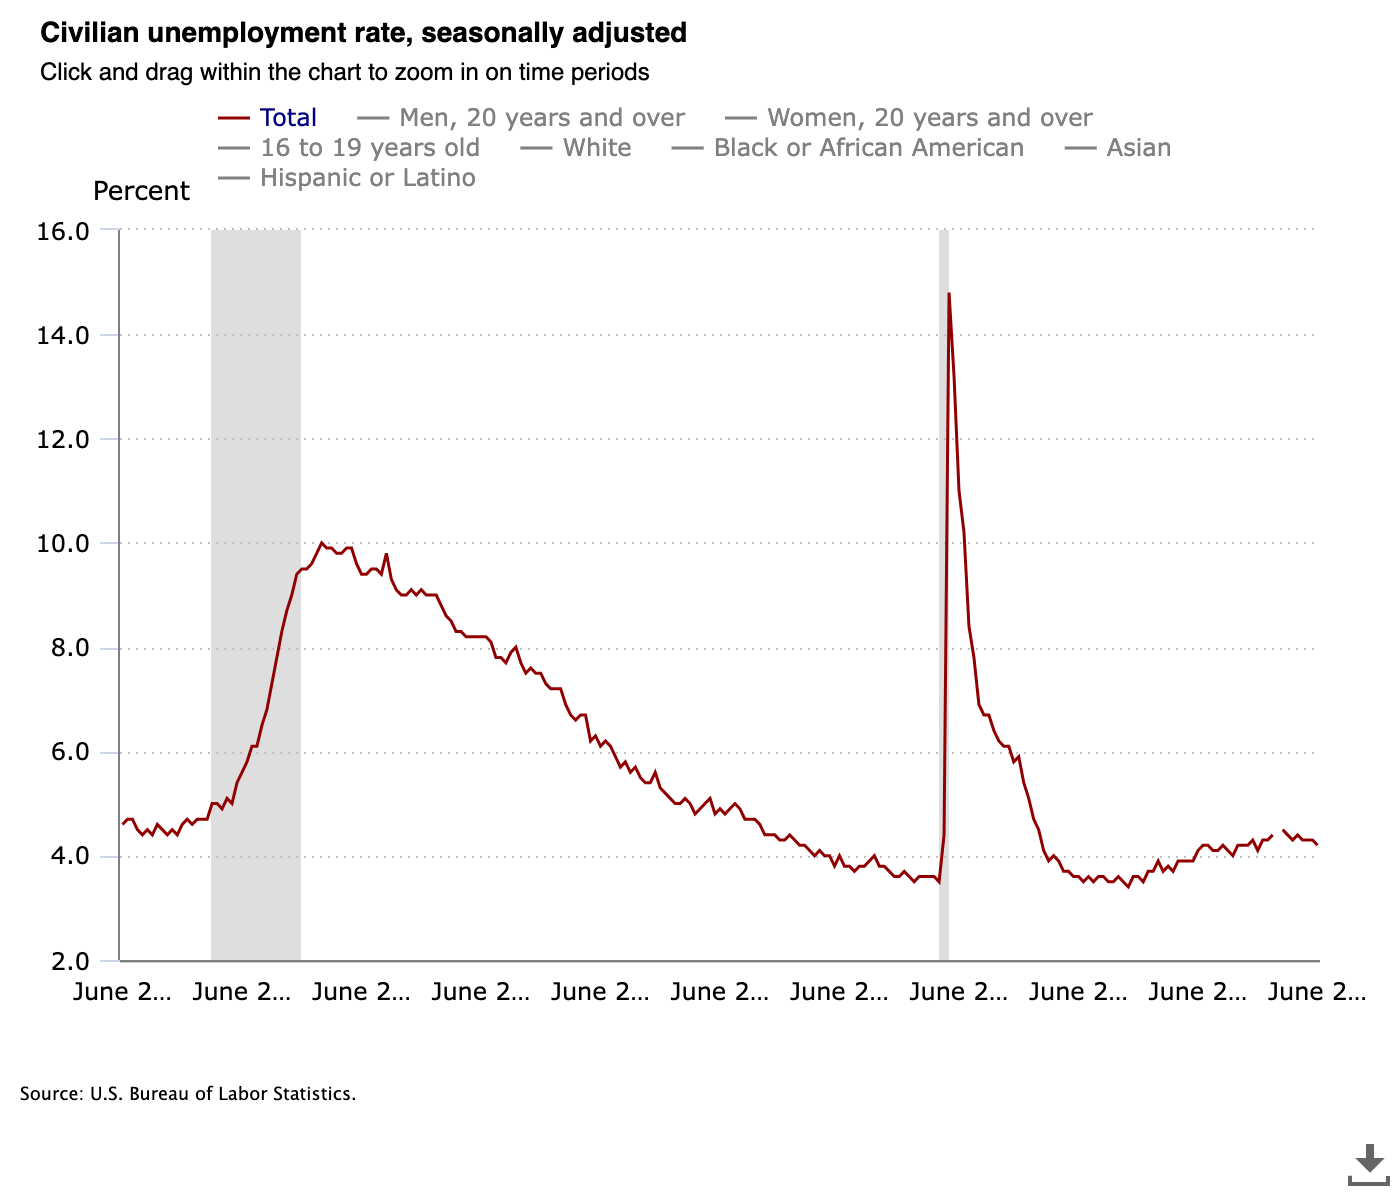
US civilian unemployment rate. Source: Bureau of Labor Statistics
Macroeconomic data prints form just one locus of potential risk-asset volatility as markets look for cues for a lasting ceasefire between the US and Iran.
In a post on Truth Social on Sunday, US president Donald Trump revealed a delay to further strikes on Iranian territory, with a potential deal on the table.
“This would include the Immediate, Complete, and Total OPENING OF THE HORMUZ STRAIT, and an end to Iran’s nuclear threat. Based on this request, I have agreed, for the future benefit of the WORLD and, likewise, the survival of a successful and prosperous Iran, to cancel the attack, subject to being able to rapidly make a DEAL,” he wrote.
Oil prices fell immediately as the week began, with WTI and Brent crude both down more than 8% on Monday.
Stocks face tough seasonality into US Midterms
US stocks face seasonal friction between now and October, in the run-up to the US Midterm elections, analysis from trading resource Mosaic Asset Company warns.
The S&P 500 finished July down 0.8%, while the tech-heavy Nasdaq Composite Index saw its worst July losses since 2006 at -3.2%.
In the latest edition of its regular newsletter, The Market Mosaic, flagged seasonal changes as a major hurdle for equities beginning this month.
“Based on multiple lookback periods, seasonality becomes a much stronger headwind over the next couple months,” it wrote, with data indicating that it could take until the start of Q4 for the situation to improve.
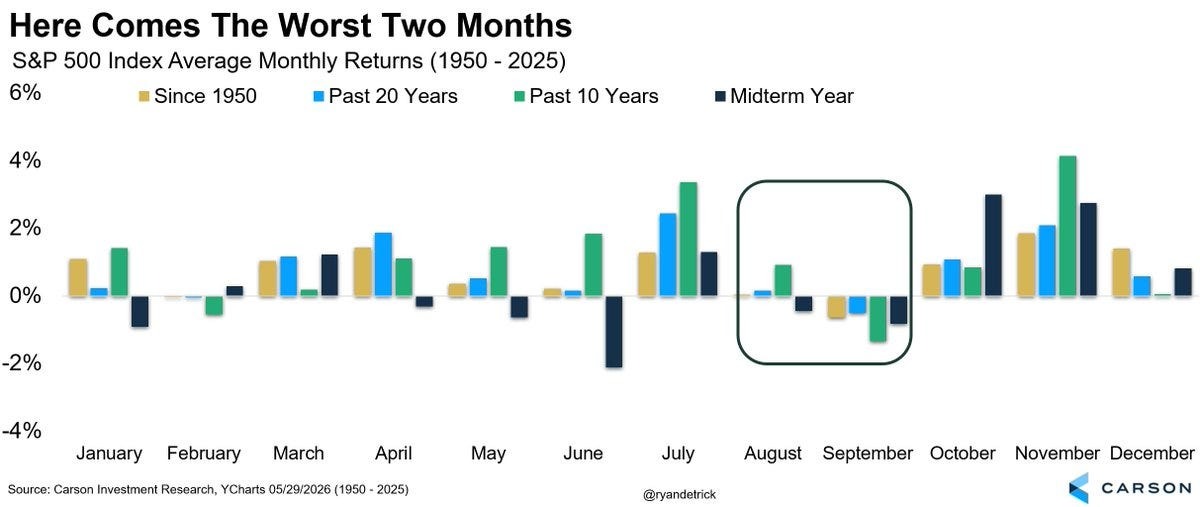
S&P 500 average monthly returns. Source: Mosaic Asset Company
US equities failed to mount a meaningful comeback into the monthly close, even as Asia markets rebounded from a major sell-off centered around semiconductor stocks. Missed earnings and concerns over debt obligations fueled a $620 billion wipeout over just two days. This comes as combined 2026 capex guidance from Alphabet, Microsoft, Amazon, and Meta is now tracking toward $730 billion.
For Bitcoin itself, the picture has a familiar precedent, analyst Benjamin Cowen, founder and CEO of quantitative analysis platform Into the Cryptoverse argued.
“Bitcoin is still generally tracking the average of prior midterm years (only slightly elevated off of that average),” he reported on X while tracking year-to-date return on investment.
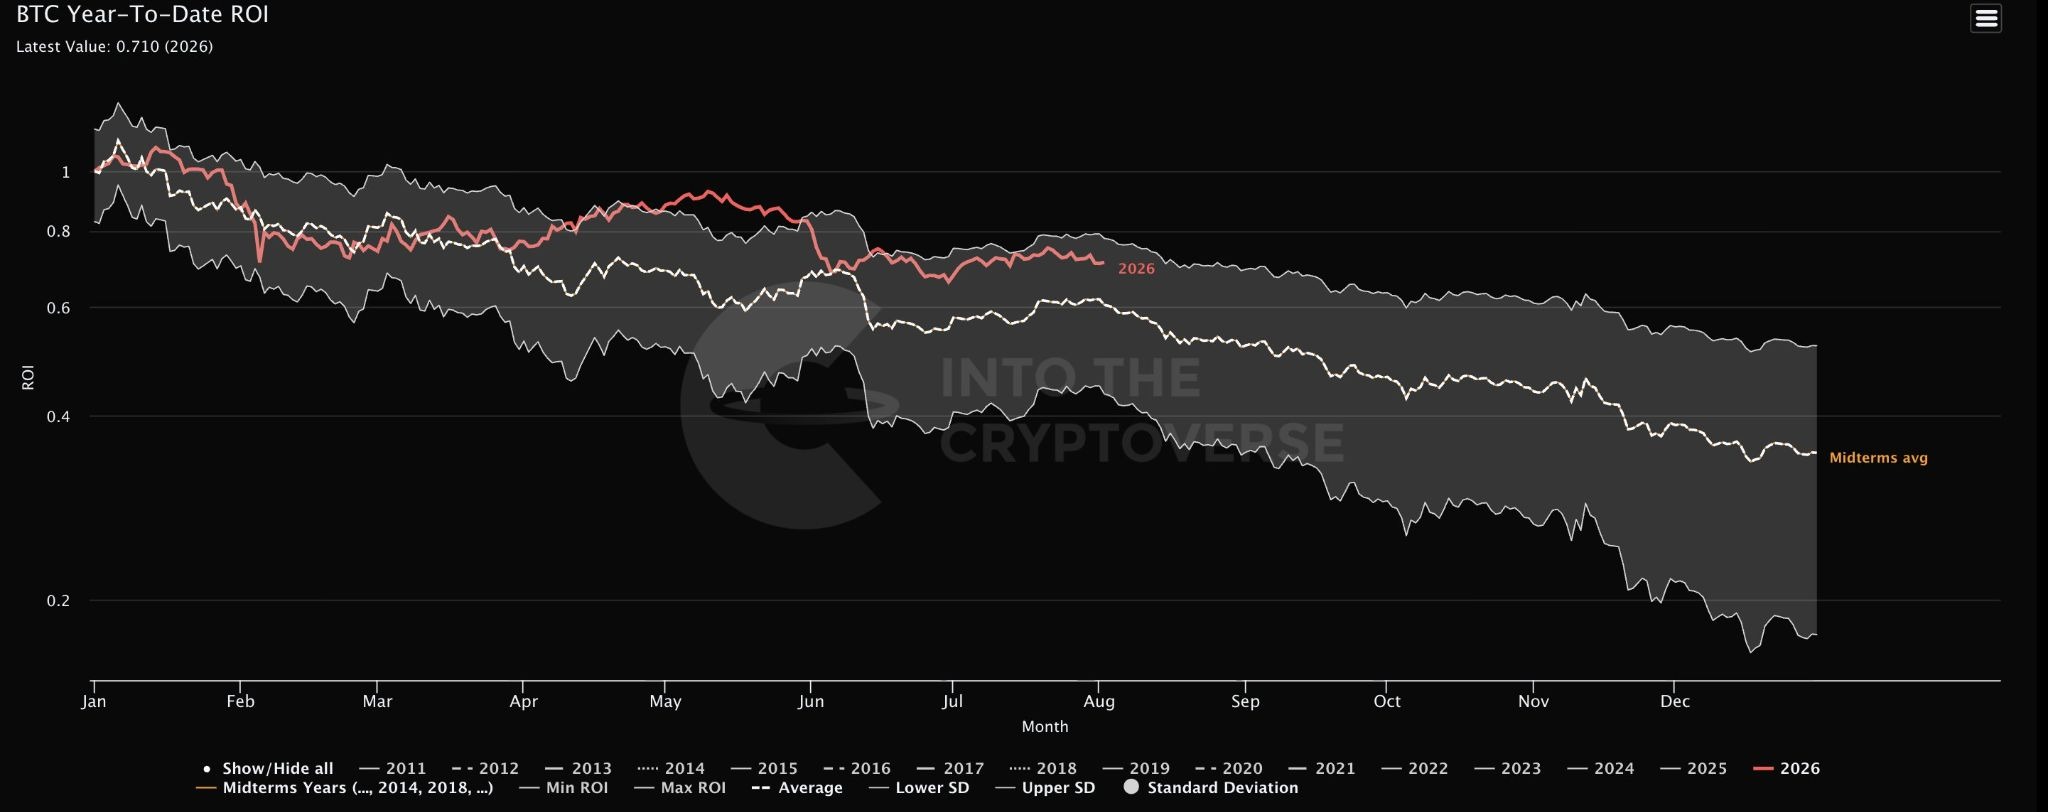
Bitcoin RoI comparison. Source: Benjamin Cowen on X.com
Exchange flows cool after Coldcard shock
Bitcoin investors continue to react to the low-entropy bug in Coldcard hardware wallets as funds are being stolen for a fourth consecutive day. The hack, which appeared to be centered on a security vulnerability originating in 2021, had drained BTC worth nearly $90 million as of Sunday.
Alex Thorn, head of firmwide research at crypto and blockchain research platform Galaxy Research, told Coldcard users to move funds “ASAP” and employ high transaction fees to reduce the remaining time spent interacting with Coldcard wallets to a minimum.
Exchange transaction data, however, does not show a mass influx of BTC from users seeking a temporary alternative to hardware wallet storage or converting their funds to ETFs. Data from CryptoQuant shows net inflows of 34,932 BTC on Friday and 8,768 BTC on Sunday. While this constitutes a significant inflow day, it is not out of the ordinary and matches the levels seen throughout the month.
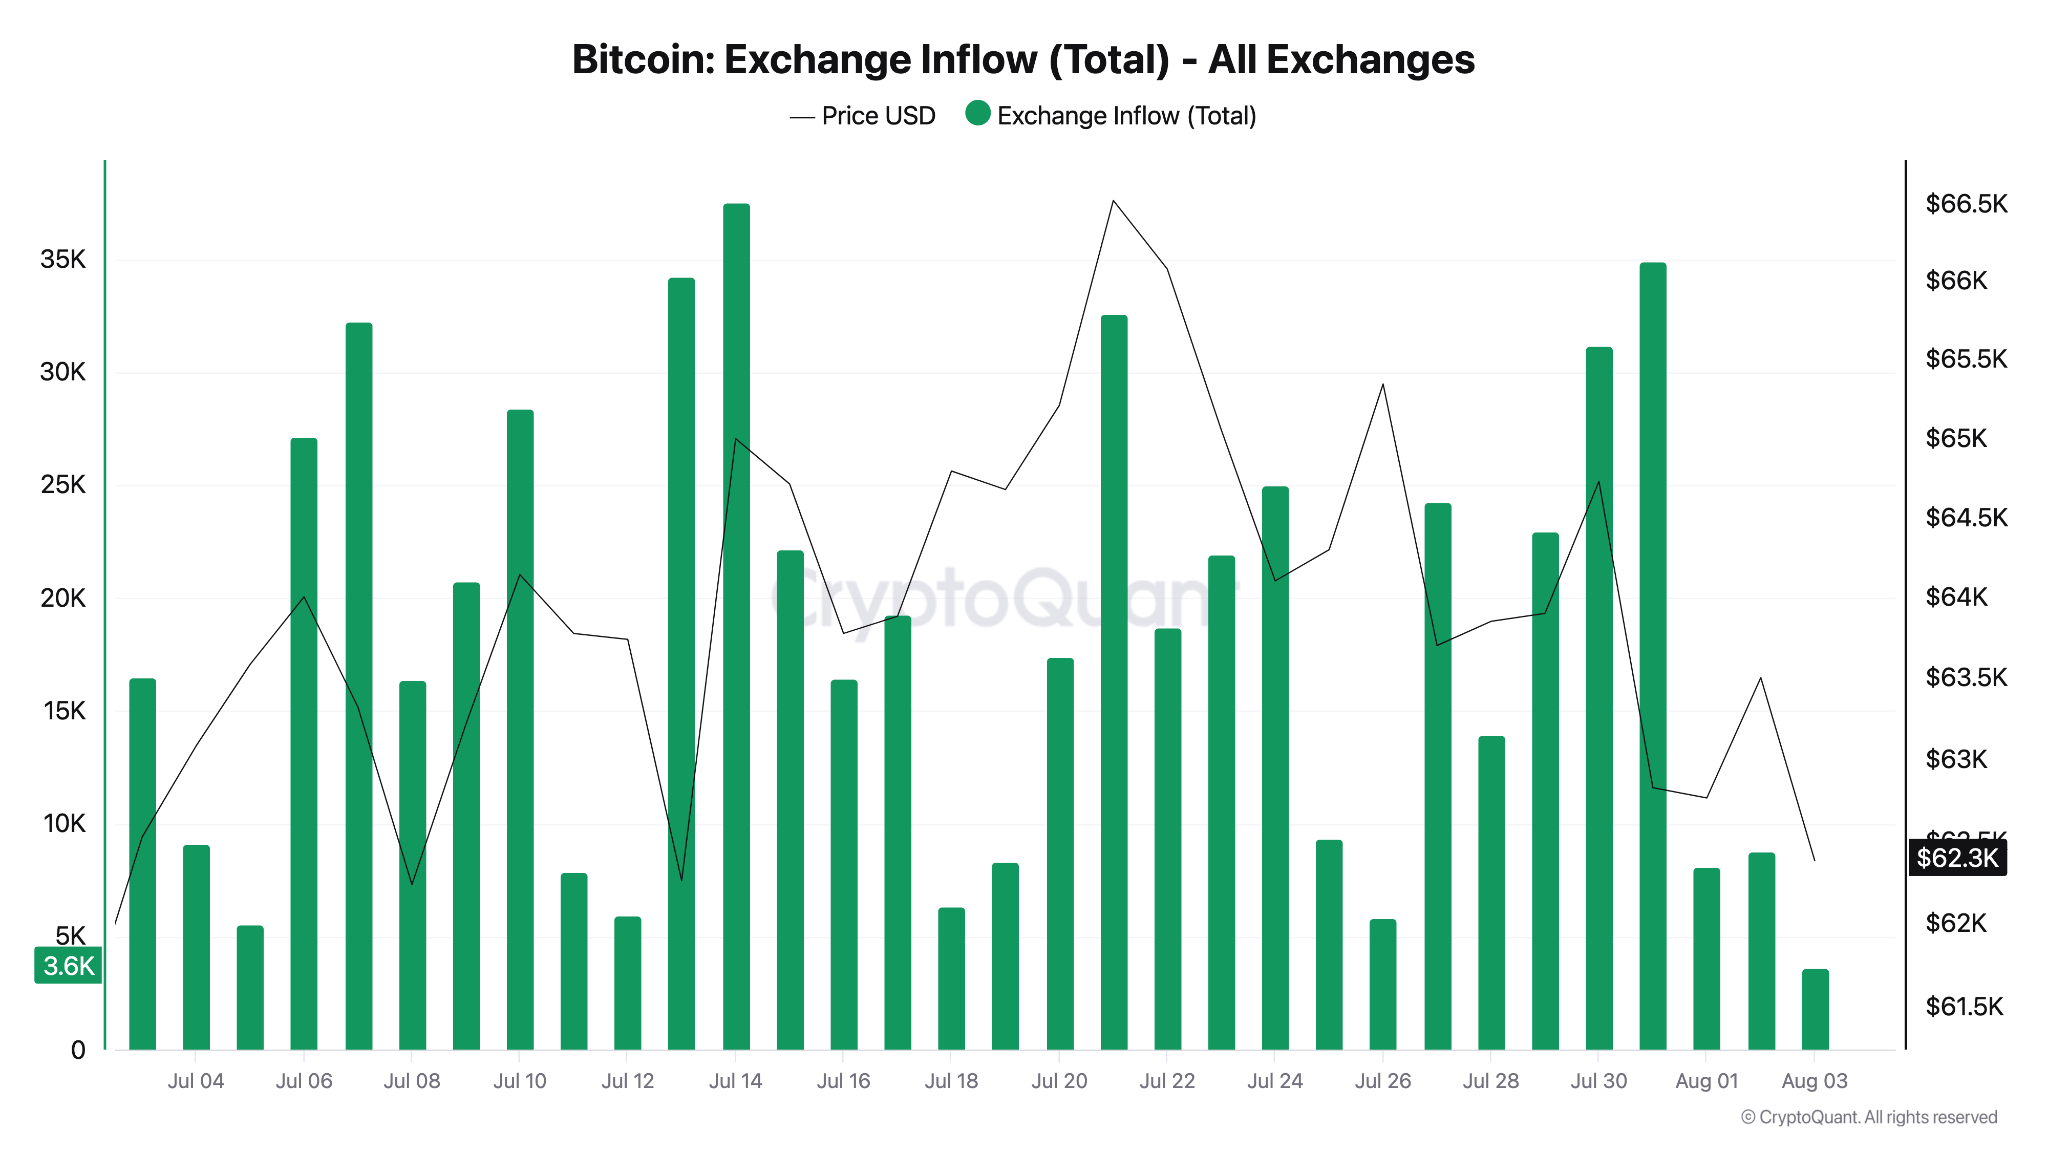
Bitcoin exchange inflows. Source: CryptoQuant
The number of depositing transactions saw a more pronounced reaction, spiking to match some of its highest daily totals since March before dropping significantly over the weekend. Exchanges recorded 31,217 inbound BTC transactions on Friday, while on Sunday, the number fell to 19,537.
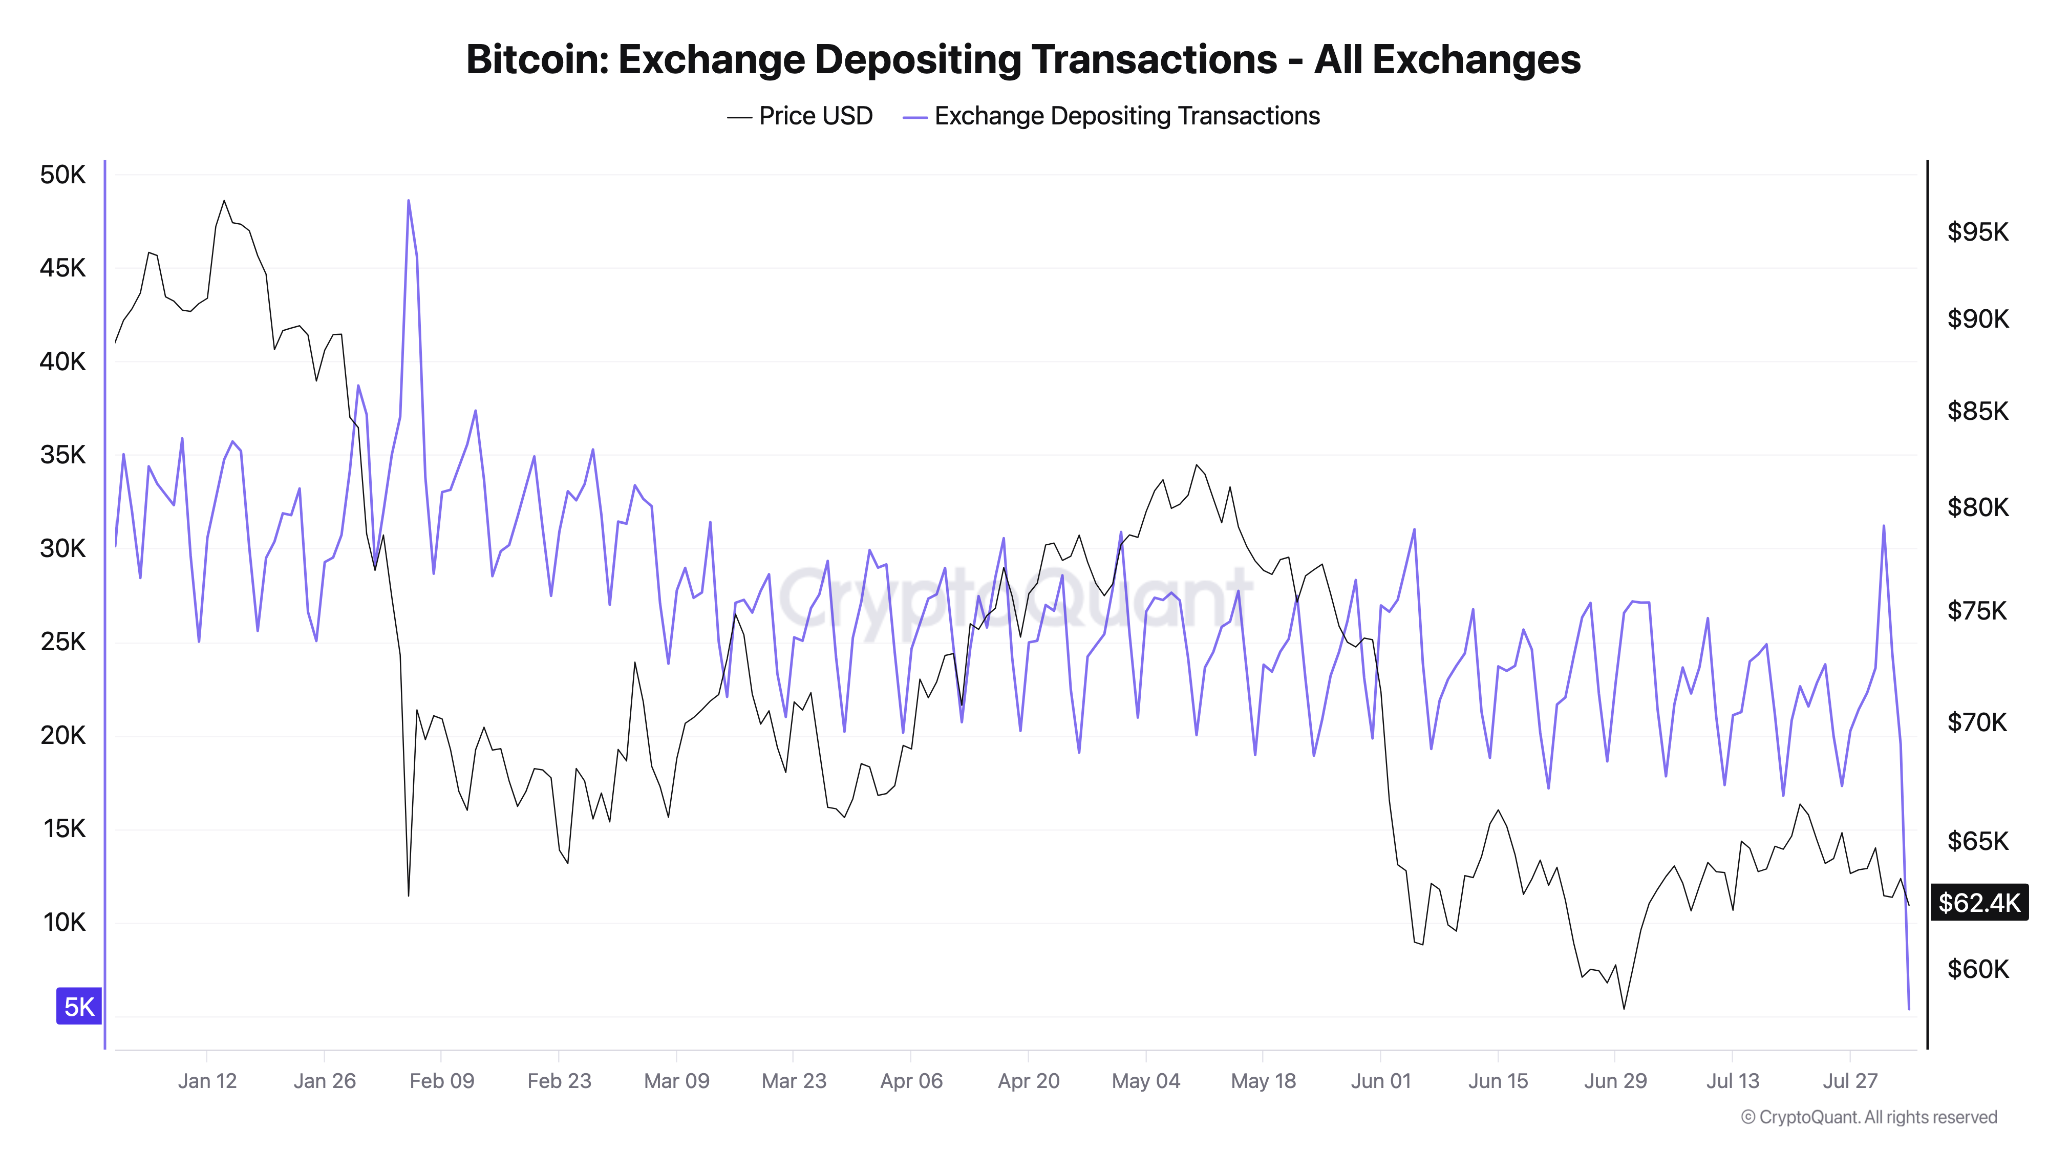
Bitcoin exchange deposit transactions. Source: CryptoQuant
Responding, CryptoQuant head of research, Julio Moreno, revealed that the influx was driven by transactions of between 1 and 10 BTC. At around 7,300, these saw their highest daily total since early February.
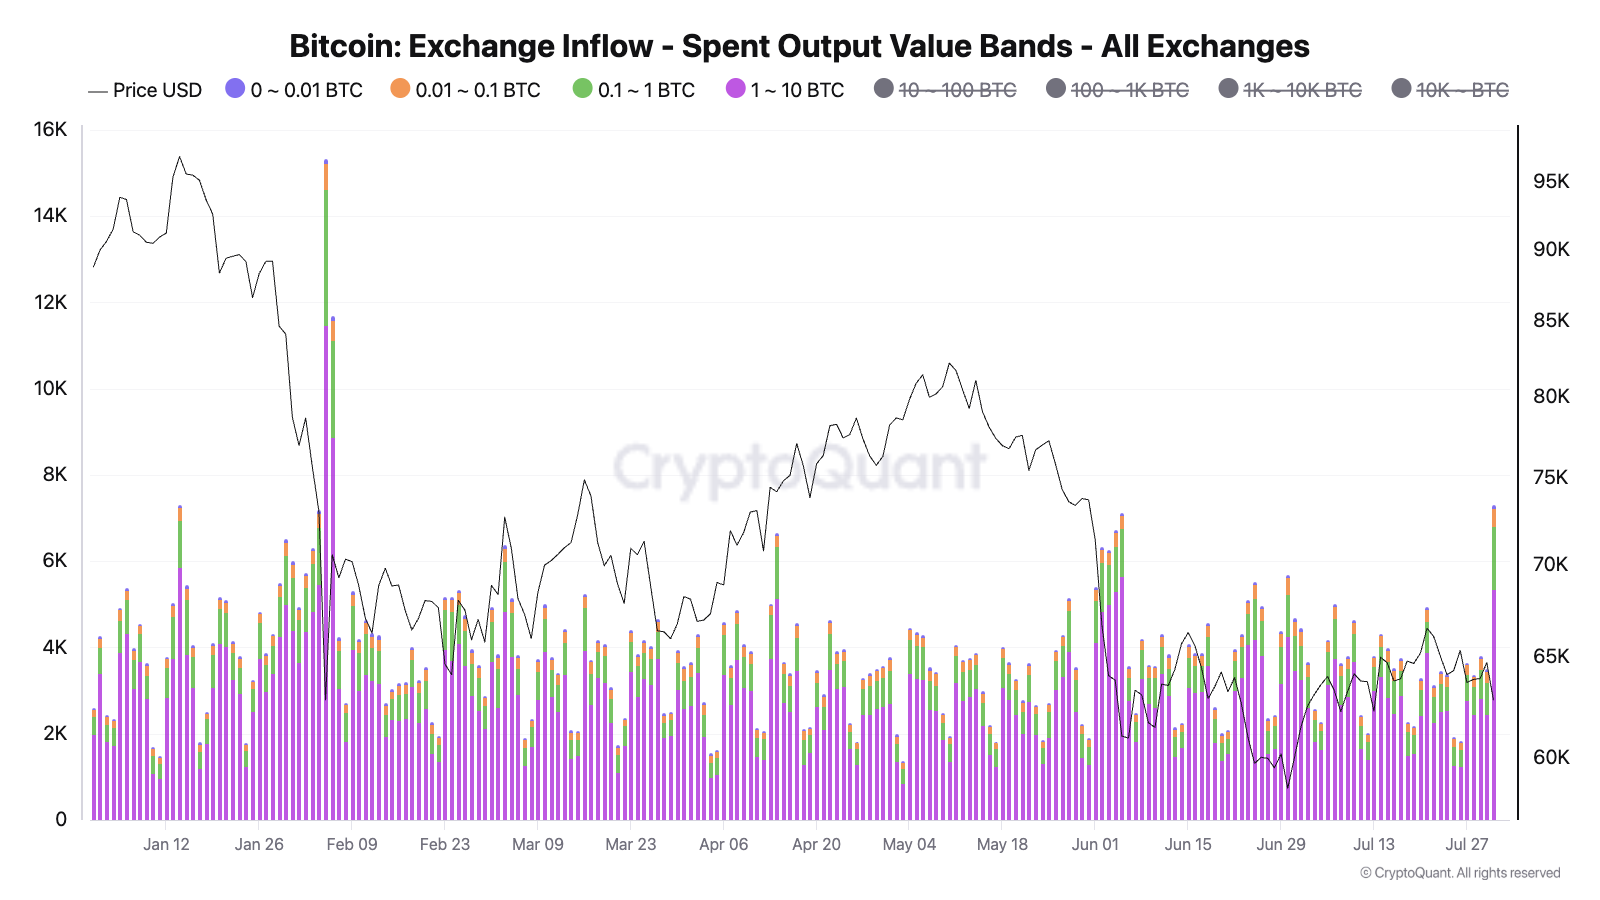
Bitcoin exchange inflows by transaction size. Source: Julio Moreno on X.com
In some of its latest analysis released on Monday, CryptoQuant observed that on a rolling 30-day basis, Bitcoin’s long-term holders (LTHs) remained in a broad accumulation phase.
“Data shows that the BTC LTH Accumulation & Distribution (30D) indicator is currently recording LTH Supply Inflow of around 220.4K BTC. This suggests that the amount of Bitcoin flowing into the Long-Term Holder cohort continues to outweigh the amount being distributed back to the market,” it wrote.
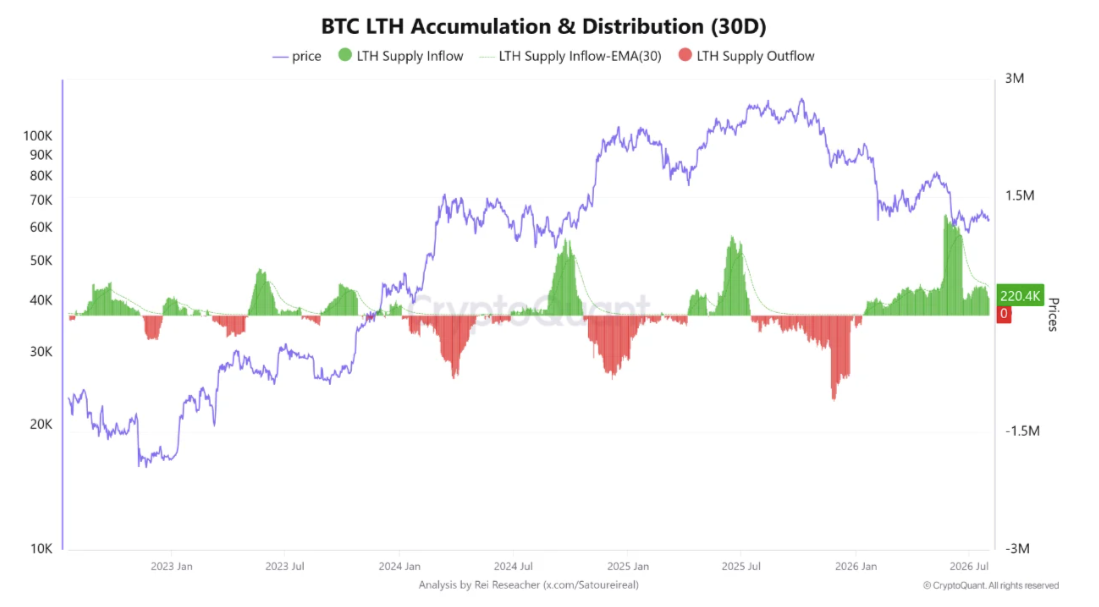
Bitcoin 30-day LTH accumulation and distribution (screenshot). Source: CryptoQuant
Trader consensus sees a “red” August for Bitcoin
Bitcoin continues to see key trend lines act as resistance into August as market participants warn over bear-market history repeating. BTC/USD finished July up 7.4%, slightly below its 2025 performance, per data from CoinGlass.
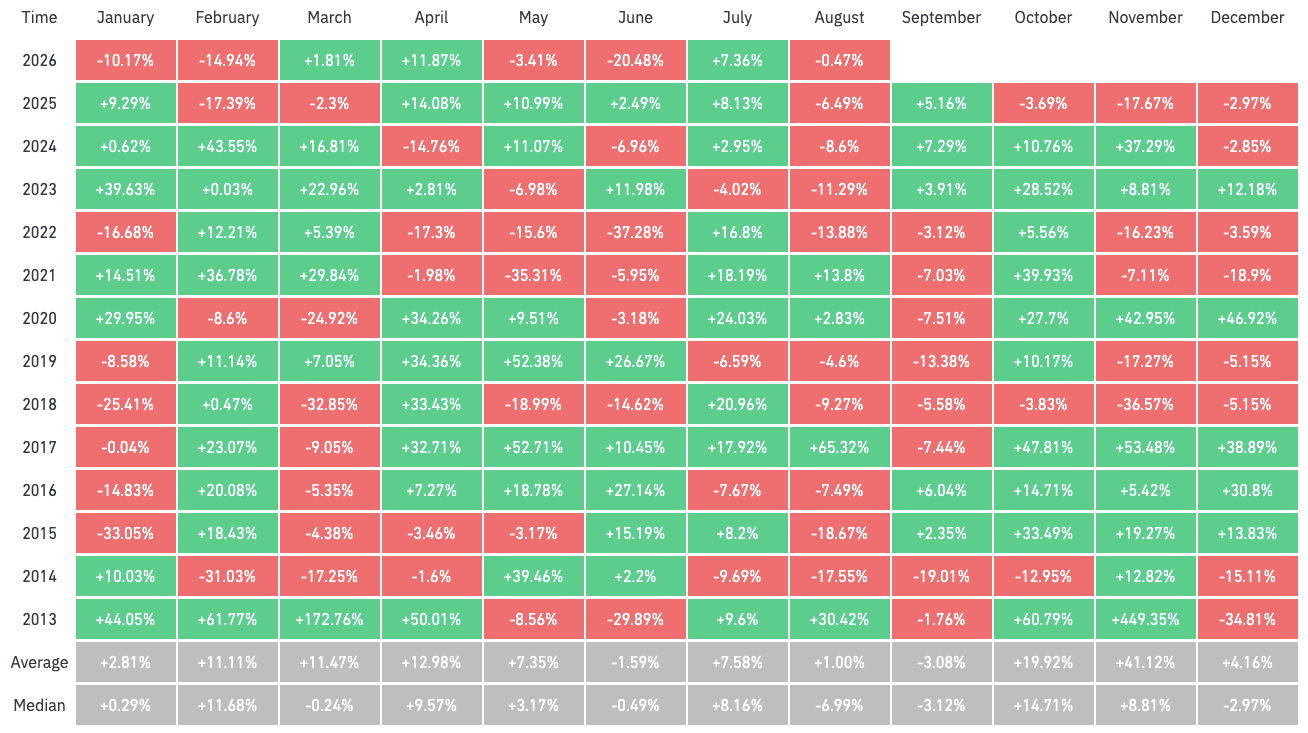
BTC/USD monthly returns (screenshot). Source: CoinGlass
Despite this, expectations remain for downside BTC price pressure to return this month, keeping the 2026 bear market in line with historical patterns. The 50-month exponential moving average (EMA) at $65,827 is an important psychological level for traders.
“It has been confirmed. The 50-Month EMA continues to act as resistance,” trader and analyst Rekt Capital wrote in an X post on Sunday.
“Continued rejection from the 50 EMA would set price up for downside continuation over time.”
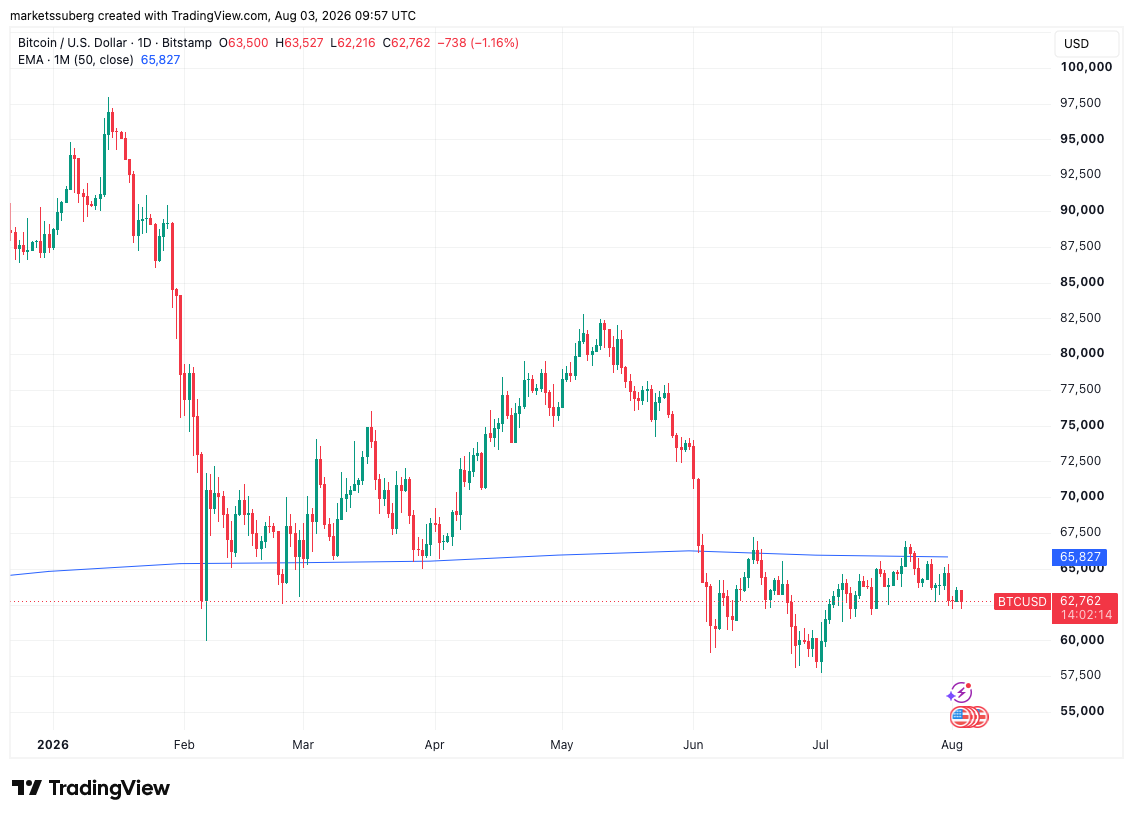
BTC/USD one-day chart with 50-month EMA. Source: Cointelegraph/TradingView
On shorter time frames, CoinGlass data that tracks clusters of high-leverage BTC bets in the derivatives market showed $64,200 as a potential area of forced liquidations should price reverse higher.
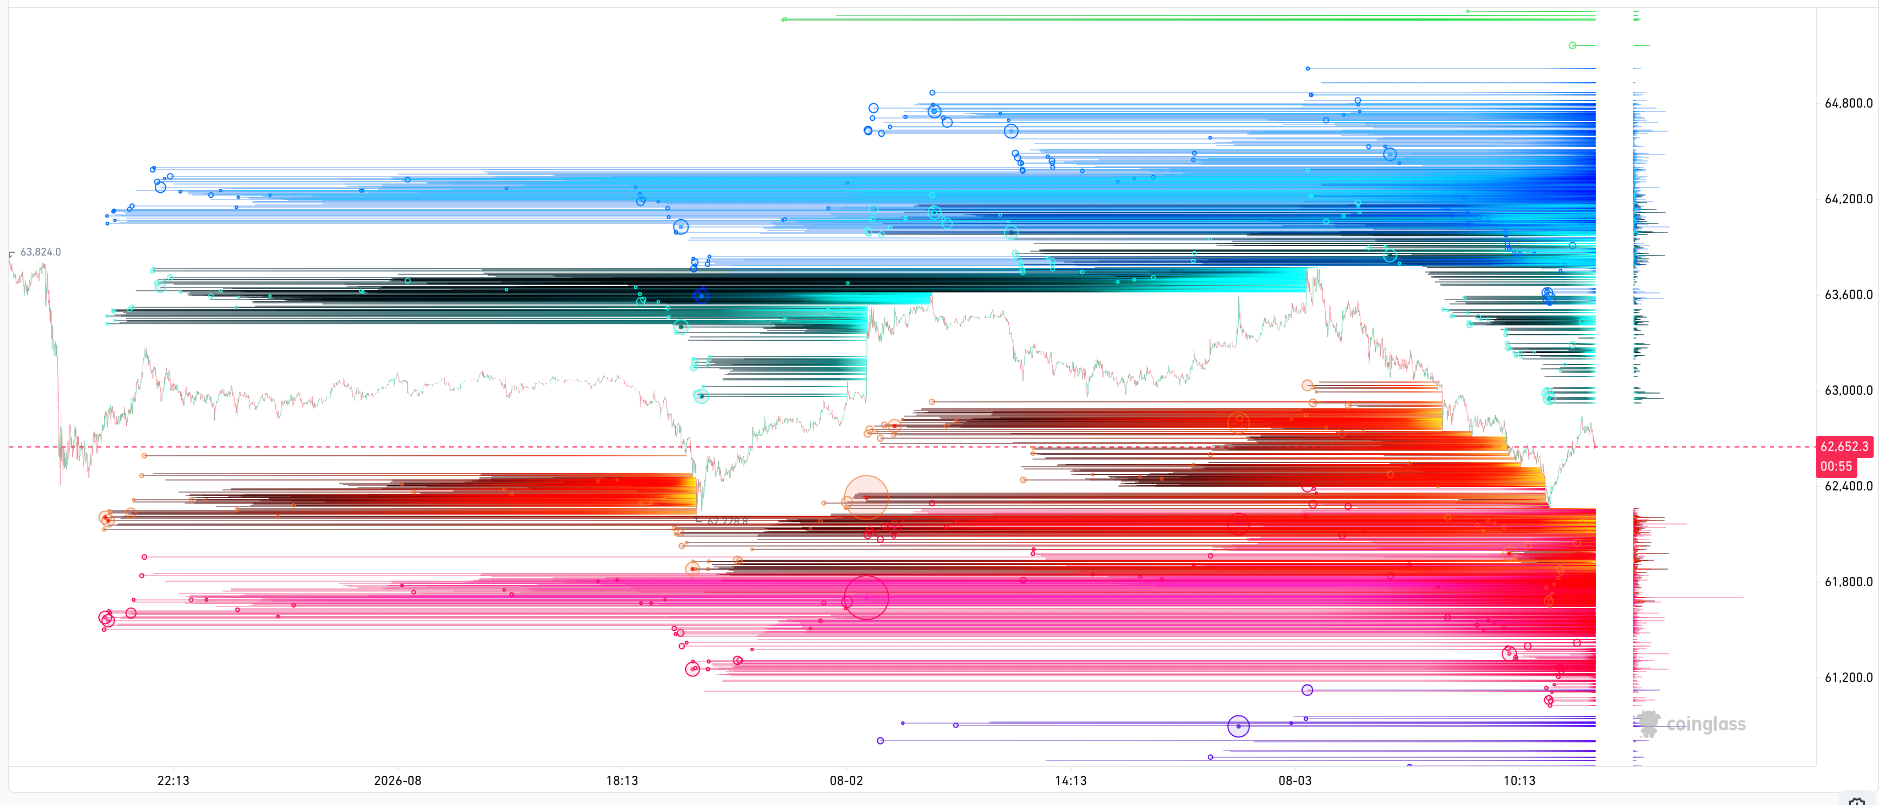
BTC liquidation heatmap. Source: CoinGlass
Quant analyst David Eng described the price as “sitting on its long-term statistical floor” near $63,000. Eng uploaded data from the power law model, which sees price growing as a power of time.
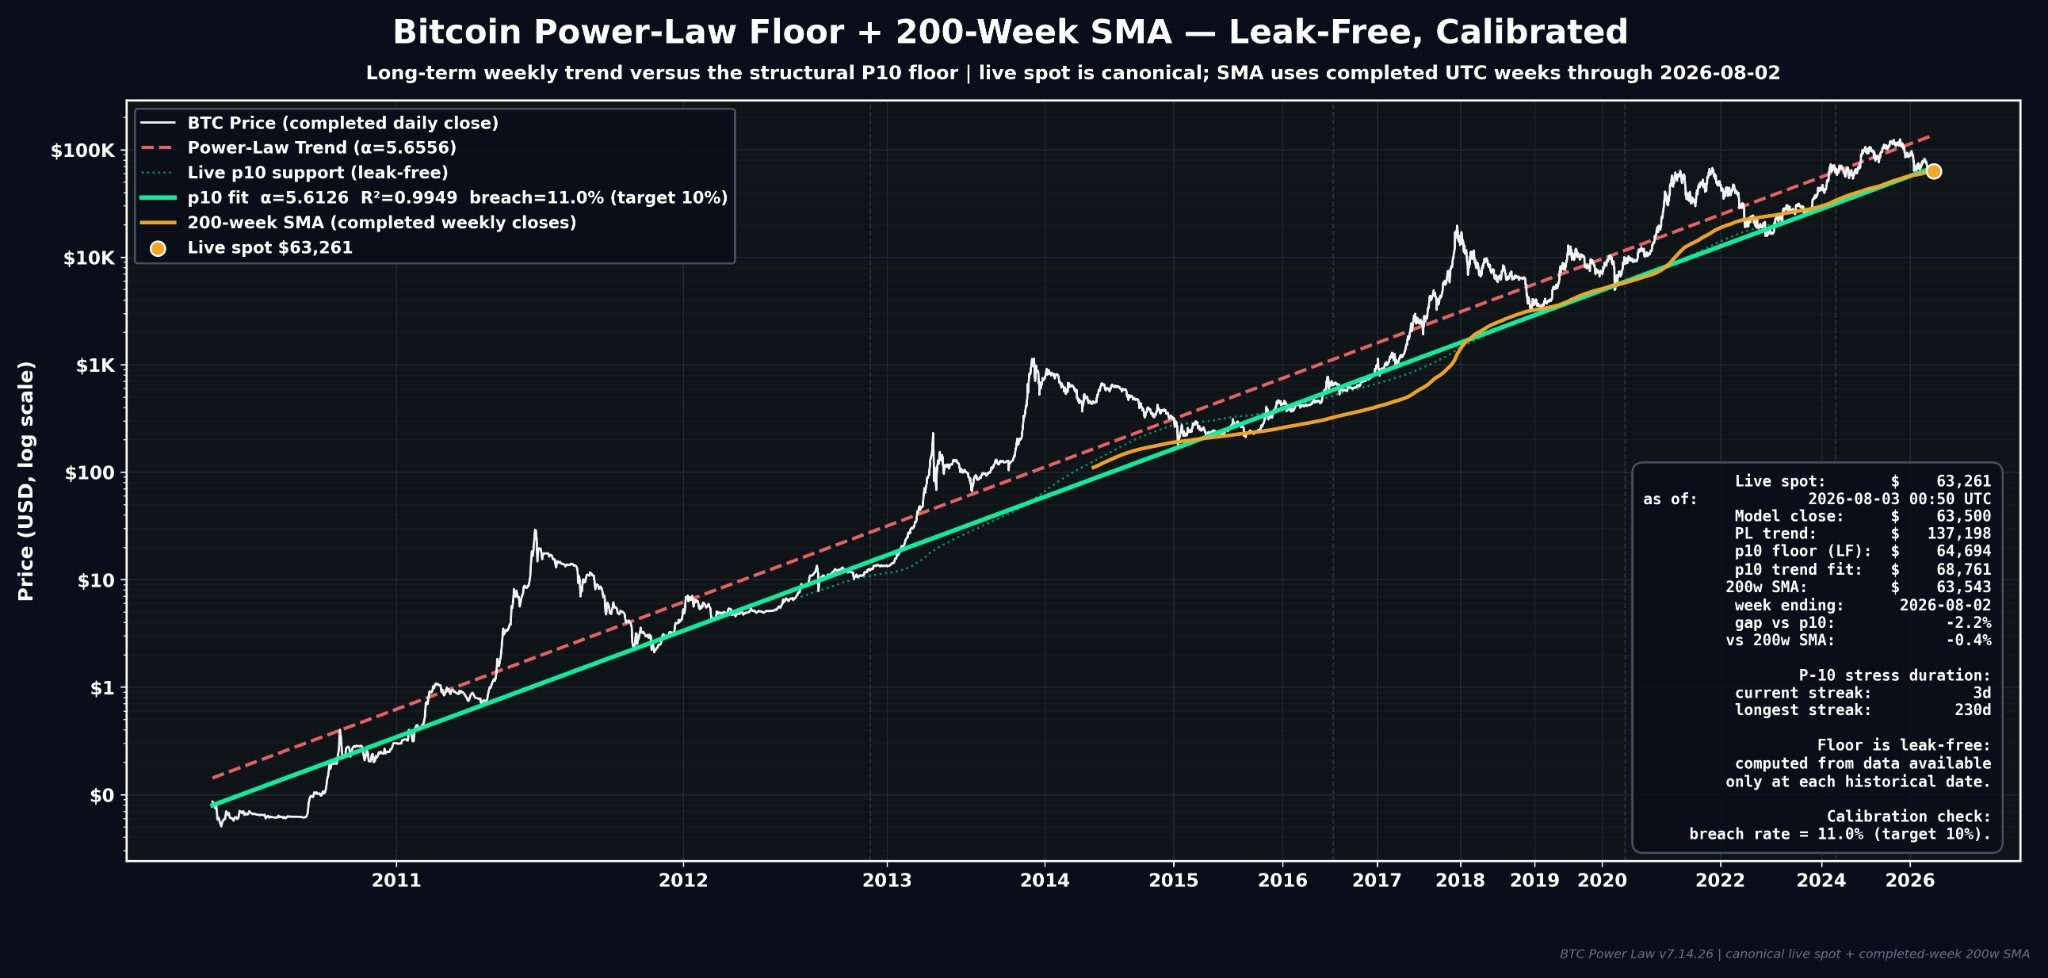
Bitcoin Power Law data. Source: David Eng on X.com
Bitcoin heads into August with long-term holders quietly accumulating even as short-term charts flash caution. Whether the month breaks its historical pattern of weakness will likely come down to how the next few macro data points land.
PIVX (PIVX), Vulcan Forged PYR (PYR), and four other lesser-known digital assets have posted substantial losses today (August 3), and the main culprit behind the decline appears to be Binance.
Over the past several weeks, the world’s largest crypto exchange announced several other platform amendments that have affected multiple altcoin traders and investors.
Goodbye to These Tokens
Binance carried out another review to ensure that all cryptocurrencies listed on its platform meet the necessary standards and industry requirements. As a result, it revealed that it will terminate all services with Across Protocol (ACX), Hashflow (HFT), PIVX (PIVX), Vulcan Forged PYR (PYR), Vanar (VANRY), and Viction (VIC).
The delisting is scheduled for August 17, but the news has already impacted the prices of the aforementioned tokens. PIVX and PYR are the biggest losers from the pack, both nosediving by 20%, while the rest have recorded more modest decreases.

Withdrawing support from Binance inevitably leads to reduced availability, thinner liquidity, and reputational damage, so the price reaction isn’t exactly surprising. Something quite similar was observed towards the end of June when the company said goodbye to Alchemix (ALCX), Ardor (ARDR), NFPrompt Token (NFP), and Marlin (POND).
NFP absorbed the heaviest hit, with its valuation plunging by a sharp 21% in a single day, while the rest also entered red territory – though their declines were not that substantial.
Some of the Previous Updates
Binance has been wrestling with regulatory pressure in Europe lately, but that hasn’t stopped it from pushing forward with its global expansion. A month ago, it solidified its presence in the Philippines: a major crypto market with millions of users.
Later on, the exchange briefly paused deposits and withdrawals on the TRX and ZEC networks to support wallet maintenance and a hard fork, respectively. All operations were restored quickly, and there were no reports of any lingering issues.
The post Binance Triggers Major Collapse for These Altcoins: Details Inside appeared first on CryptoPotato.


Bitmine Immersion (BMNR), the largest Ethereum treasury company, bought 10,399 ether (ETH) during last week as Chairman Tom Lee pointed to ether’s strongest monthly performance against the Nasdaq in a year as evidence that crypto is recovering.
The purchase, worth roughly $19.1 million at ETH’s current price of $1,840, lifted Bitmine’s holdings to almost 5.8 million ETH, or about 4.8% of Ethereum’s circulating supply, according to the company’s Monday update.
The latest acquisition was broadly in line with the previous week’s 9,946 ETH purchase, extending Bitmine’s streak of weekly ether buys since adopting its Ethereum treasury strategy in June 2025.
The company also bought back 4.5 million shares of its common stock, bringing total recent repurchases to 16 million shares.
The update comes as Strategy (MSTR), the largest corporate bitcoin holder, disclosed another sale of bitcoin. The company trimmed its treasury by 1,638 BTC, worth about $105 million, while repurchasing $81.2 million of its STRC preferred stock. Strategy also raised $290 million through sales of common shares.
Lee tied the company’s outlook to ether’s relative strength against technology stocks.

Internet Says Threw Shots At Papoose At Angie’s BBQ

Princess Diana’s wedding dress designer recreates 40-foot veil after it goes missing

Santander TSB job cuts: unions open redundancy talks


-

 Business5 days ago
Why Trees Belong on the Risk Register
-

 Fashion3 days ago
Weekend Open Thread: Wit & Wisdom
-

 Politics3 days ago
Meta enters AI-training agreement with far-right ‘propaganda rag’ Newsmax
-
 Entertainment6 days ago
‘Stargate’ Creator’s New Sci-Fi Series Returns for Season 3 Tomorrow
-
 Crypto World2 days ago
MicroStrategy Post-Earnings CLARITY Act Push Could Add New Catalyst for Its Stock
-

 Politics6 days ago
The Part of the Electric Transition Nobody Wants to Discuss
-

 Business5 days ago
Major shareholder moves on Canyon
-

 Crypto World2 days ago
XRP Ledger v3.3.0 brings five institutional features
-

 News Videos4 days ago
Bitcoin Enters the 3rd Stage of the Bear Market
-

 Crypto World6 days ago
Kraken Enables Retail Access to Jersey Mike’s IPO via Tokenized Shares
-

 Tech7 days ago
New macOS Sequoia & Sonoma security updates for older Macs
-

 Politics4 days ago
Luke Littler’s dominance sparks GOAT debate
-

 News Videos6 days ago
Claude: Build Financial Dashboards in Minutes (2026)
-

 Business6 days ago
Johnson & Johnson agrees to $5.5B settlement over talc cancer claims
-

 Sports4 days ago
Seema Kaliramna Wins Discus Throw Bronze, Takes India’s CWG Medals Tally To 17
-

 Crypto World1 day ago
Crypto PAC spending tops $2M in Michigan House race
-

 Business3 days ago
Trump Announces Hamas Disarmament Agreement as Iran Strikes Kuwait Air Base and US Attacks Pause Overnight
-

 Crypto World3 days ago
New York sues Kalshi over prediction market gambling
-

 Tech5 days ago
Gemini can now summarize the messiest comment threads in Google Docs
-

 Tech1 day ago
ESET tracks rise in malicious AI skills and adaptable malware
You must be logged in to post a comment Login