
Crypto World
Kraken lets tokenized stocks power leveraged crypto trades


Kraken has started allowing eligible users to use select tokenized stocks and ETFs as collateral for futures and margin trading on Kraken Pro. The update gives traders a way to support leveraged crypto positions without selling those tokenized holdings first.
Summary
- Kraken allows ten xStocks as collateral, widening capital use for eligible non-US traders globally today.
- Broad-market ETFs carry lower haircuts, while volatile names like MSTRx and HOODx receive higher discounts.
- Related coverage shows Kraken moving tokenized assets toward collateral, cash management and institutional credit products.
The exchange said 10 xStocks assets are eligible at launch. The list includes SPYx, QQQx, AAPLx, GOOGLx, TSLAx, NVDAx, HOODx, MSTRx, GLDx and CRCLx.
The feature applies only to eligible users outside the United States. Futures collateral is available to eligible clients outside the U.S., including in the European Economic Area. Margin collateral is available to eligible clients outside the U.S., excluding the EEA.
Tokenized shares gain trading use
Tokenized stocks and ETFs are blockchain-based products that track traditional securities. Kraken’s xStocks product gives users exposure to U.S. names such as Apple, Tesla, Nvidia and broad-market ETFs through digital tokens.
Earlier xStocks coverage reported that Kraken has been trying to turn tokenized equities into parallel market rails. The product was described as offering more than 60 tokenized U.S. stocks and ETFs, backed 1:1, with 24/5 trading.
The latest update changes how traders can use those assets. A user who holds NVDAx, for example, may keep that exposure while using the same holding to support a leveraged position, subject to Kraken’s rules.
Kraken said eligible xStocks are recognized automatically as collateral wherever futures and margin trading are available on a user’s account. That means users do not need to move assets into a separate product before using them.
Haircuts and limits control risk
Kraken applies haircuts and collateral limits to each eligible asset. Broad-market ETFs such as SPYx and QQQx have a 10% haircut and a maximum collateral value of $1 million.
Most individual stocks, including AAPLx, GOOGLx, TSLAx and NVDAx, have a 20% haircut and a $250,000 collateral cap. Higher-volatility names such as HOODx and MSTRx carry a 30% haircut, while GLDx and CRCLx have lower collateral limits.
The exchange said these limits and haircuts may change over time. That gives Kraken room to adjust collateral treatment if market volatility, liquidity or risk conditions change.
Kraken also warned that leverage remains risky. The company said, “This is not a risk-free way to access leverage.” If collateral value falls, users may face margin calls or liquidation.
Tokenization push keeps widening
The move fits a wider push to bring traditional assets into crypto trading systems. A recent hackathon report said tokenized stock markets had reached roughly $1.2 billion in market cap, while xStocks had logged more than $25 billion in total transaction volume.
Kraken has also been building collateral and credit products beyond tokenized stocks. In May, Payward and Franklin Templeton announced a partnership to bring tokenized money market products into Kraken’s platform as collateral and cash management tools.
In June, Kraken and Maple launched an institutional lending model using a bankruptcy-remote vehicle for crypto-backed loans. That product focused on structured credit, while the new xStocks update focuses on trader collateral.
The result is a broader trading stack where tokenized assets can do more than track prices. For now, Kraken’s new feature gives eligible users another way to manage collateral, but it also adds leverage risk that traders must monitor closely.

PayPal has reported $486.4 billion in total payment volume for the second quarter on July 28, up 10% year over year. It also confirmed a reorganization that hands crypto its own division inside the company.
The unit, Payment Services & Crypto, sits alongside Checkout Solutions & PayPal and Consumer Financial Services & Venmo. In the same presentation, PayPal listed stablecoins as one of three areas it is expanding into under an “innovating with discipline” heading, next to agentic commerce and identity and biometrics.
Crypto Holdings Cost $81 Million
Further, revenue came in at $8.68 billion, up 5%. Non-GAAP earnings were $1.38 per share against analyst estimates near $1.28. Transaction margin dollars rose 1% to $3.9 billion, and adjusted free cash flow reached $1.83 billion. PayPal raised full-year transaction margin guidance to about $15.6 billion and lifted the low end of its EPS range to roughly $5.38.
Net losses on strategic investments and crypto assets held for investment came to $81 million in the quarter, added back in the reconciliation to non-GAAP net income. The same line ran $74 million in the first quarter. PayPal’s full-year 2025 GAAP earnings carried a positive impact of about $0.14 per share from that portfolio.
PYUSD supply sat near $2.8 billion in mid-July, down from more than $4 billion in March. The token went live natively on Polygon on July 9 through issuer Paxos, and PayPal has said the stablecoin reaches 70 markets.
YouTube began paying US-based creators in PYUSD in December. CryptoPotato has also reported on CoinGecko research showing PYUSD and Societe Generale’s EURCV taking little share while USDT and USDC hold 93.5% of fiat-backed stablecoin supply.
CEO Restructures After Rejecting Stripe
CEO Enrique Lores, who took the role on March 1 after Alex Chriss departed, is targeting at least $1.5 billion in gross run-rate savings over the next two to three years, with about $400 million reached by year-end.
The plan runs to 2029 across three drivers: a simplified structure, operational and portfolio optimization, and accelerated AI adoption, which PayPal expects to deliver around 40% of the savings.
The post PayPal Betting Big on Stablecoins After Disclosing Q2 Results appeared first on CryptoPotato.
Crypto World
Coldcard Exploit Sparks Bitcoin Flight, ‘Bullish’ Crypto Consolidation: Hodler’s Digest,

Cold storage fears after Coldcard users lose $90M in Bitcoin
After $90 million in Bitcoin was drained from Coldcard wallet users, small hodlers desperately sought refuge on centralized exchanges and via alternative custody methods.
Bitcoin transfers below 1 BTC climbed to their highest daily level since 2022 on Friday, with 39,600 BTC moved, according to data shared by CryptoQuant head of research Julio Moreno on Saturday.
The figure was just 300 BTC below the 39,900 BTC transferred on Nov. 16, 2022, days after FTX filed for bankruptcy.
Galaxy Research, the research arm of crypto investment company Galaxy Digital, reported Saturday that the third wave of attacks on users of the hardware wallet on the weekend brought estimated losses to 1,367 BTC ($88.6 million) across 4,585 addresses.
Alex Thorn, Galaxy Digital’s head of firmwide research, warned in an X post on Sunday that the attack was still ongoing and urged users to move funds from Coldcard-generated addresses immediately if they had not already done so. The exploit reportedly targets a flaw in the Coldcard seed generation process, that did not employ a genuinely random number generator.

Clarity Act clock running out: No vote, or ‘no’ vote?
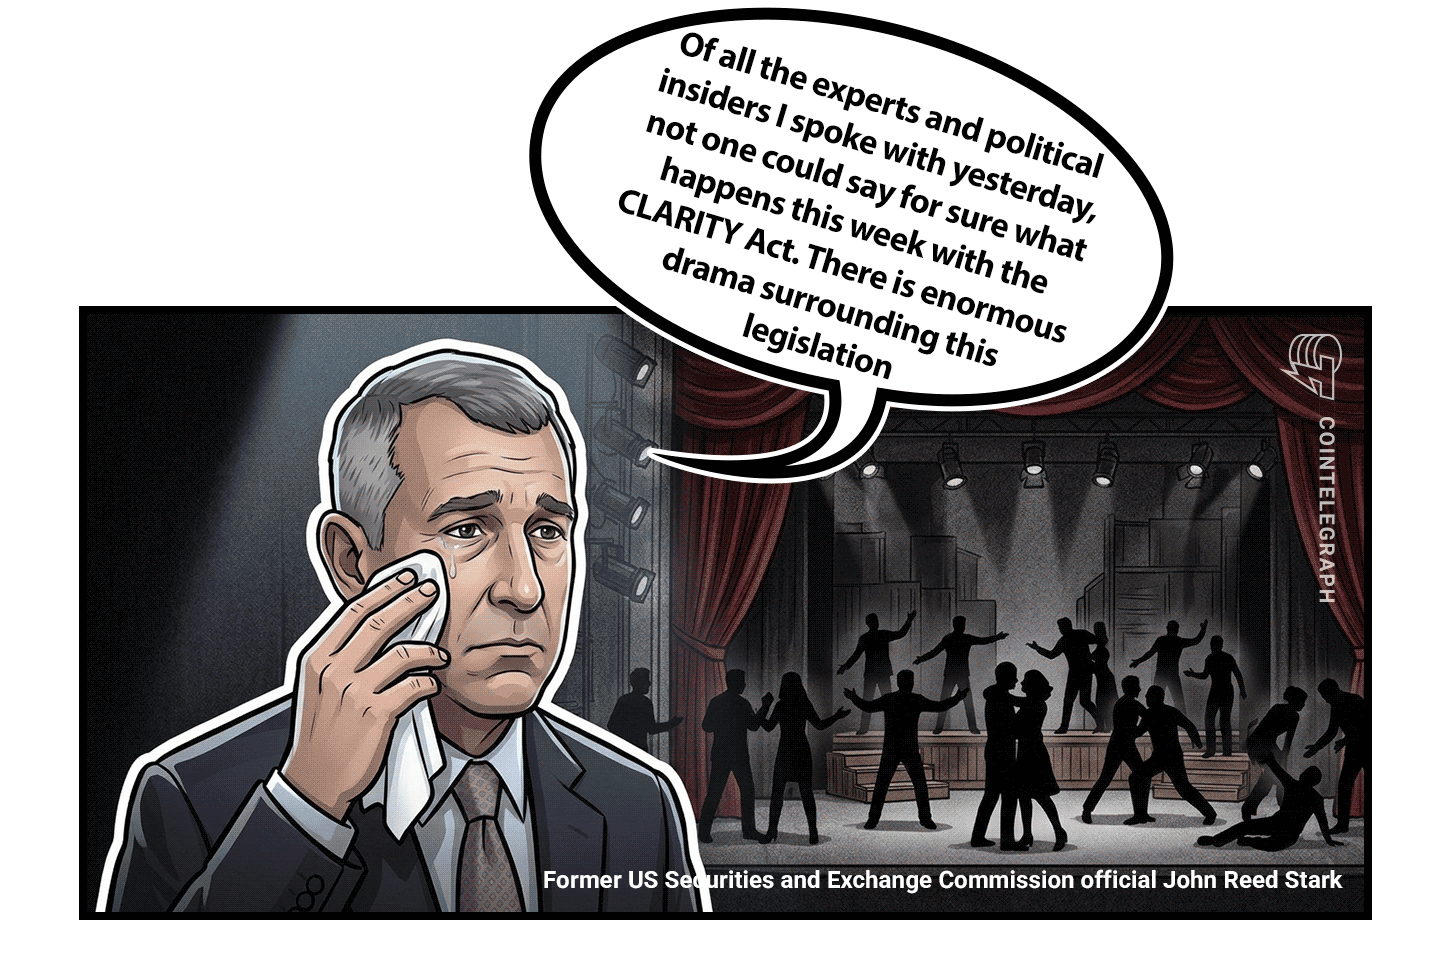
President Donald Trump is considering a revised ethics proposal for the Clarity Act that was devised by Senator Thom Tillis and Senator Ruben Gallego.
The original proposal Trump signed off on would have prevented elected officials from endorsing or profiting from crypto projects and would have been enforced by the Department of Justice. The Democrats don’t trust the DoJ and want the State Attorney Generals to enforce it. The compromise proposal would allow the State AGs to sue the DoJ if it does not properly enforce the rules, rather than allow them to sue elected officials *cough, Trump* directly.
With just five days left on the clock, the chances of any kind of Senate vote on the legislation are receding, much less the three separate votes required to pass the bill. Trump’s $1.4 billion in crypto profits are a particular sticking point, with Senate Minority Leader Chuck Schumer introducing a bill (with little hope of passing) called the Anti-Corruption Bureau Creation Act that targets “executive branch corruption.”
Ethics isn’t the only outstanding issue, with the banks still up in arms over paying any kind of yield on stablecoins, and law enforcement groups divided over the impact of the Blockchain Regulatory Certainty Act. Designed to protect blockchain developers, some argue it would thwart investigations into money laundering and fraud.
Changes to the BRCA proposed by the National Association of Assistant US Attorneys and the National District Attorneys Association look dead in the water. White House crypto advisor Patrick Witt scoffed at the proposals and the claim they resulted from “productive negotiations.”
”This is not even close,” he said.

Crypto ‘no earnings’ reports
Nobody is making much money in crypto right now it seems, at least according to this week’s corporate earnings reports for the second quarter.
Coinbase generated roughly $1.2 billion in net revenue, down 19% from a year earlier. It reported a net loss of $359 million, significantly wider than analysts’ expectations for a $122 million loss. Transaction revenue, subscription and services revenue, and adjusted EBITDA all fell short of consensus estimates.
Strategy’s habit of smash-buying every Bitcoin top, helped it to record an $8.22 billion loss in the second quarter, driven almost entirely by its unrealized losses on its Bitcoin holdings. However, the company also said it has now built a $3.75 billion U.S. dollar reserve, which is enough to cover more than two years of preferred dividend payments and interest obligations.
Online brokerage Robinhood is making loads of money, but not much of it is attributable to crypto. The firm posted record second-quarter revenue and earnings, even as cryptocurrency transaction revenue fell 38% from a year earlier, from $160 million to $100 million.
Crypto enters biggest consolidation phase in history
ARK Invest analyst Lorenzo Valente says the cryptocurrency industry is entering its biggest consolidation phase yet, with revenue increasingly concentrated among a handful of dominant protocols.
Valente noted that perpetual futures exchange Hyperliquid and memecoin launchpad Pump.fun account for roughly 67% of total crypto application revenue between them. Including synthetic dollar protocol Ethena raises the top three’s combined share to nearly 80%.
Valente added that he expects the trend to accelerate in the coming months, leading to more mergers and acquisitions, Chapter 11 bankruptcies, project shutdowns and acqui-hires. Somewhat surprisingly, he concluded that “this is extremely bullish for the space.”
World Cup generated $20B in blockchain prediction market volume
The 2026 FIFA World Cup drove $20 billion in blockchain-based prediction market volume and $24 million in digital collectible trades, with more than 400,000 wallets participating in blockchain-based betting, according to a report from blockchain analytics firm Chainalysis.
The $20 billion figure includes trading before and during the tournament, with bettors placing roughly $5.7 billion in wagers over the five-week World Cup itself. World Cup-related markets accounted for about 63% of all prediction market activity during that period, the report said.
Winners and Losers
At the end of the week, Bitcoin (BTC) is down 3% to trade at $63,350, Ether (ETH) is down 3.5% to trade at $1,879 and XRP (XRP) is down 2.3% and is changing hands for $1.08. The total market cap is at $2.18 trillion, according to CoinMarketCap.
Among the biggest 100 cryptocurrencies, the top three altcoin winners of the week are Cardano (ADA) at 14.7%, Uniswap (UNI) at 8%, and Pi (PI) at 3.2%.
The top three altcoin losers of the week are Stable (STABLE) at -16%, Venice Token (VVV) at -14.6% and Lido DAO (LDO) at -14.1%.
Prediction of the Week
Bitcoin may have bottomed before its traditional cycle low
Crypto-focused asset manager Grayscale said that Bitcoin’s price may have bottomed earlier than the traditional four-year cycle, which would imply a cycle low in September or October.
Head of research, Zach Pandl, argued that Bitcoin (BTC) has “grown up” as an asset and is increasingly driven by macroeconomic factors.
“If the Fed forgoes rate hikes and economic growth holds up well, Bitcoin’s price may already have bottomed,” Pandl wrote in a report.
However, people have been peddling this hopium for months now. Earlier in July, crypto brokerage K33 pointed to more than 50% of the Bitcoin supply being held at a loss as another signal of an imminent market bottom. In June, Swan Bitcoin CEO Cory Klippsten told Cointelegraph that the holdings of long-term investors, which reached an all-time high of 14.7 million Bitcoin, were another signal of an imminent Bitcoin bottom.
Sooner or later, someone will be right.
Top FUD of the Week
The Russians… and the Australians… are after Telegram’s Pavel Durov
Russian authorities have placed Telegram founder Pavel Durov on an international wanted list as they escalate a criminal case accusing him of facilitating terrorist activity.
Russia’s Federal Security Service (FSB) said on Wednesday that it had charged Durov with facilitating terrorist activity and issued an international warrant for his arrest, local news agency Interfax reported.
The FSB alleged that Telegram failed to remove channels, chats and bots that Ukrainian intelligence services, alleged terrorist groups and extremist organizations used to coordinate attacks, recruit operatives and conduct cyber fraud.
A defiant Durov said on Thursday the Russians had become “confused about who can ban whom from the Internet.”
Meanwhile the Australian eSafety Commisioner has launched court proceedings against Telegram seeking civil penalties, alleging the platform failed to remove terrorism-related content.

Pump.fun laid off workers before they received millions in PUMP tokens
Solana-based memecoin launchpad Pump.fun reportedly fired employees two months before they were due to receive PUMP tokens worth millions of dollars.
According to a Friday Sandmark report, at least one Pump.fun worker was due to receive PUMP tokens worth in the seven-figure range.
The employees were reportedly fired in April, just two months before they were due to start receiving the company’s tokens based on agreements signed in 2025.
Trump teleprompter operator accused over Kalshi bets leaves government
A White House teleprompter operator accused of using inside knowledge to profit from prediction market bets on President Donald Trump’s speeches no longer works for the federal government, according to the Associated Press.
Perez was accused of using nonpublic information to make more than $100,000 betting on Kalshi prediction markets tied to Trump’s speeches, according to an earlier ABC News report.
Best Magazine Stories of the Week

Crypto’s fundamentals have never been stronger, yet degens keep chasing hot new narratives. Behavioral finance may explain why get-rich-quick stories continue to beat substance.
DeFi projects that survived the fallout from the Terra and FTX collapses in 2022 are dying out in 2026. But analysts say it’s not a case of industry consolidation — but the opposite.
Cointelegraph publishes long-form journalism, analysis and narrative reporting produced by Cointelegraph’s in-house editorial team with subject-matter expertise. All articles are edited and reviewed by Cointelegraph editors in line with our editorial standards. Some articles contain affiliate links, from which Cointelegraph may earn a commission. These relationships do not influence which products we review or our editorial conclusions. Content published in here does not constitute financial, legal or investment advice. Readers should conduct their own research and consult qualified professionals where appropriate. Cointelegraph maintains full editorial independence.
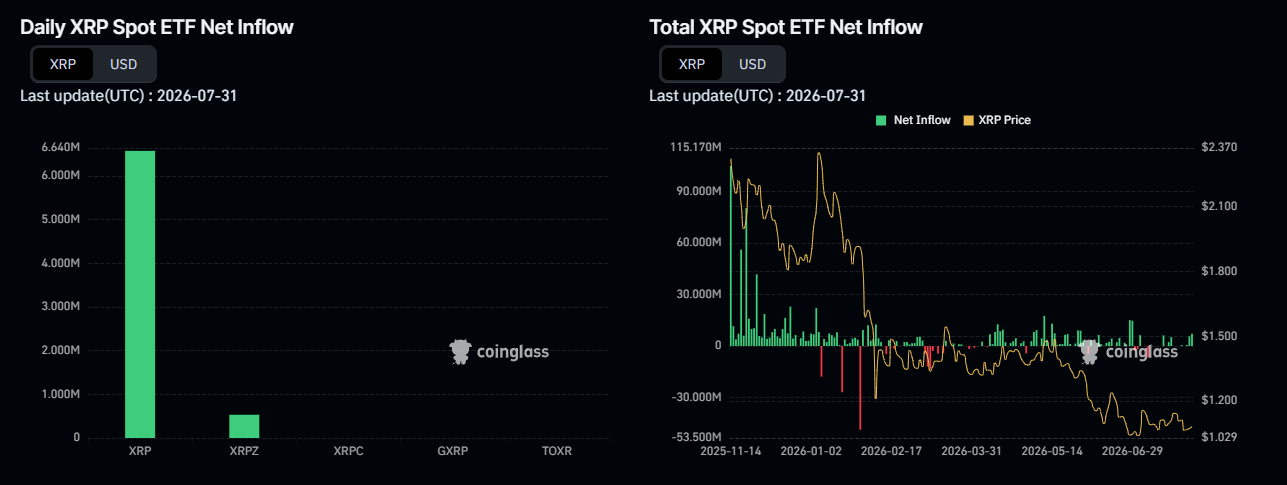
XRP-backed exchange-traded funds (ETFs) pulled in $27.29 million in July, marking a fourth straight month of net inflows.
The token itself trades near $1.08, down roughly 40% since the start of the year, in line with a generally poorly preforming crypto market. But many expect intuitional money and these products to be bolstering XRP, and others.
Instituional Money
Cumulative XRP ETF inflows now sit near $1.5 billion, the largest total among altcoin products. The price keeps sliding anyway.
XRP funds have ranked first or second in monthly inflows since April, without barely any outflows. Inflows ran $81.59 million in April, $131.94 million in May, $59.46 million in June, and $27.29 million in July, showing the pace has cooled even as the streak holds.

That steady buying stands out against a market where fresh capital keeps concentrating in a handful of tokens. Several smaller altcoin funds recorded no net flows in July. XRP kept adding, even at a slower pace.
Why the Price Isn’t Following the Flows
Steady ETF demand alone hasn’t lifted XRP’s price. Some of the pressure traces to a specific seller. Grayscale chief executive Peter Mintzberg filed to sell XRP ETF shares he acquired before the fund’s listing. He priced the sale at $20.45 a share, about half what earlier Grayscale insiders got in January.
Momentum indicators tell a similar story. XRP recently hit its most oversold readings on record. Traders remain split on whether the sell-off has finished.
Competition for capital plays a role too. Solana funds have pulled in about $1.15 billion since launch, edging back into second place in July. Hyperliquid funds added roughly $293 million in May and June before posting a first monthly outflow in July.
Bitcoin (BTC) and Ethereum (ETH) funds still dominate the category. They pulled in $172 million and $365 million in July, respectively.
Steady ETF buying shows institutional appetite for XRP has not faded. Whether that demand eventually lifts the price may depend on the broader altcoin market finding its footing first.
The post XRP ETFs Keep Drawing Cash, So Why Is the Price Down 40%? appeared first on BeInCrypto.
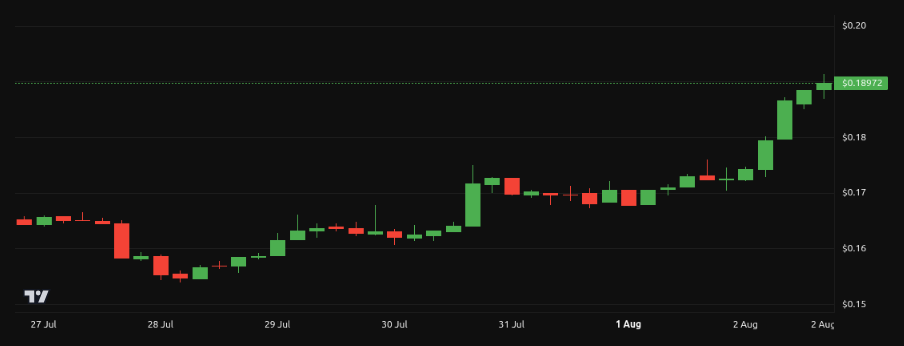
Cardano (ADA) price jumped nearly 10% in 24 hours to around $0.189, as the network turned its attention to the Dijkstra era following the van Rossem upgrade.
The rally suggests investors are pricing in the scalability roadmap rather than the upgrade already delivered.

What the Dijkstra Era Will Bring to Cardano
The Dijkstra era refers to Cardano’s next major development phase. Intersect, the organization supporting the network’s open development and governance, confirmed planning has begun.
The timing follows a completed milestone. The van Rossem hard fork, enacted on July 18, upgraded the protocol to Version 11, improving Plutus performance, ledger consistency, and node security.
Dijkstra will arrive in phases rather than as a single event. Key features include Nested Transactions, Linear Leios and Peras, all part of the broader Ouroboros Leios research programme.
The goal is throughput without compromise. Those upgrades aim to increase transaction capacity and support more complex applications while preserving decentralization and security.
Follow us on X to get the latest news as it happens.
A concrete deadline exists. The Haskell node team aims to deliver Nested Transactions and Linear Leios to the mainnet by the end of 2026. Governance work runs alongside the roadmap. Intersect defines a process that lets stakeholders shape the scope of hard forks beyond the initial Dijkstra release.
Even the name remains open, with discussions leaning toward Alexander Esgen and Fabian von Bergen as alternatives.
Can the Roadmap Sustain ADA’s Rally
Cardano researcher Dr. Cuadrado framed the distinction clearly. Van Rossem improved core performance and security, while Dijkstra addresses significantly higher transaction volumes and more sophisticated on-chain applications.
He emphasized the network’s deliberate, research-driven approach, contrasting it with projects that prioritize marketing over architectural rigor.
Other items appeared in Intersect’s latest weekly update. A new minPoolCost and Plutus memory parameter action is open for voting, alongside audited Constitutional Committee election results. Infrastructure progress continued, too. The CAP Portal reached alpha launch, and the Eryx ZK Bridge was completed.
The market response looks constructive but deserves context. ADA still trades roughly 95% below its record high of $3.09, set in September 2021, and a 10% daily move remains modest against the token’s historical volatility.
Roadmap announcements carry execution risk. Cardano upgrades have frequently generated initial enthusiasm followed by consolidation when timelines stretch.
The end-of-2026 target leaves ample room for slippage. Nested Transactions and Linear Leios both depend on research that continues evolving.
Sustained price gains will likely require measurable adoption. Developer activity, new applications, and rising total value locked matter more than announcements alone.
For now, the rally reflects renewed confidence in Cardano’s technical direction. Whether that confidence translates into lasting demand depends on what actually ships over the coming months.
Subscribe to our YouTube channel to watch leaders and journalists provide expert insights.
The post ADA Price Jumps 10% While Cardano Turns Toward Its Next Big Upgrade Era appeared first on BeInCrypto.
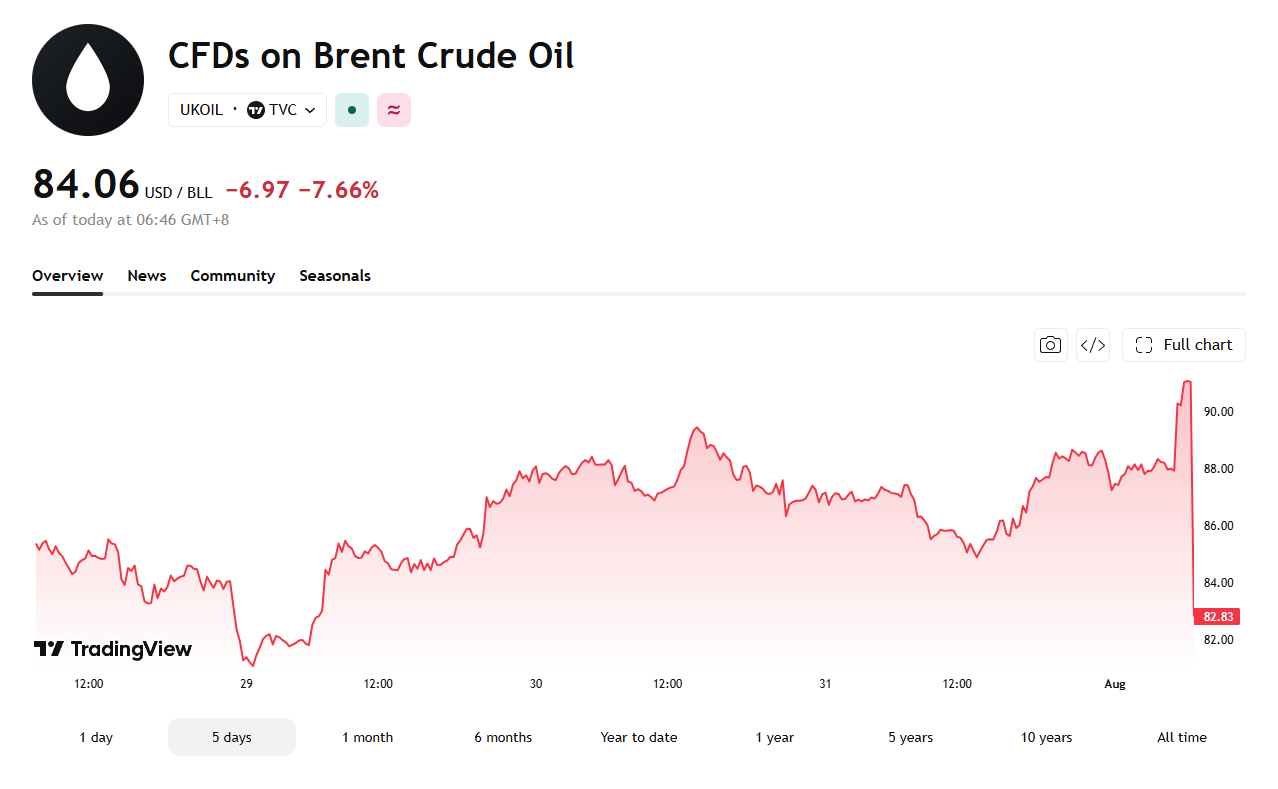
Brent crude tumbled 9% intraday on Sunday evening. It slid from a previous close of $91.03 to a low of $82.83 after US President Donald Trump said talks with Iran to reopen the Strait of Hormuz begin Monday afternoon.
The price later clawed back some ground to trade near $84.06, still down 7.66% on the day.
Another Walk-Back, or Real Peace?
Trump told reporters aboard Air Force One that negotiations start the following afternoon. He made the comment a day after he called off what he described as a massive planned attack on Iran.
Trump said Saudi Arabia, the United Arab Emirates, Qatar, and Iran itself all asked him to hold off. He said the request signals every side expects a Hormuz deal, with a separate nuclear agreement to follow.

Saudi state media confirmed part of that account. It reported that Crown Prince Mohammed bin Salman pushed Trump toward deescalation in a weekend phone call. Iran tells a different story.
State media gave no sign Tehran had shifted its stance on the strait. The semi-official Fars news agency went further and denied Iran ever asked Trump to pause the strikes, mocking his account directly.
“Trump the fool has run out of steam!”
— Fars news agency, via CNN
Uncertainty Continues to Plague the Markets
The exchange fits a pattern. Trump credits regional pressure, not his own advisers, each time he delays a strike. He still maintains on social media that US forces stand ready to resume action at any moment.
Any nuclear deal would build on the memorandum of understanding both sides signed in June. That agreement gave both sides 60 days to negotiate, and the window is now closing.
The uncertainty already hits consumers and markets on both sides. Americans pay more at the pump as shipping and output disruptions persist. Months of conflict have strained Iran’s own economy.
Every Trump signal has whipsawed oil traders since, including Wednesday’s 9.6% Hormuz-linked jump that preceded this latest reversal.
Monday’s talks may still produce only another delay. Tehran remains publicly unmoved, and the MoU clock keeps running out.
The post Oil Plunges 9% as Trump Sets Monday Talks to Reopen Hormuz appeared first on BeInCrypto.
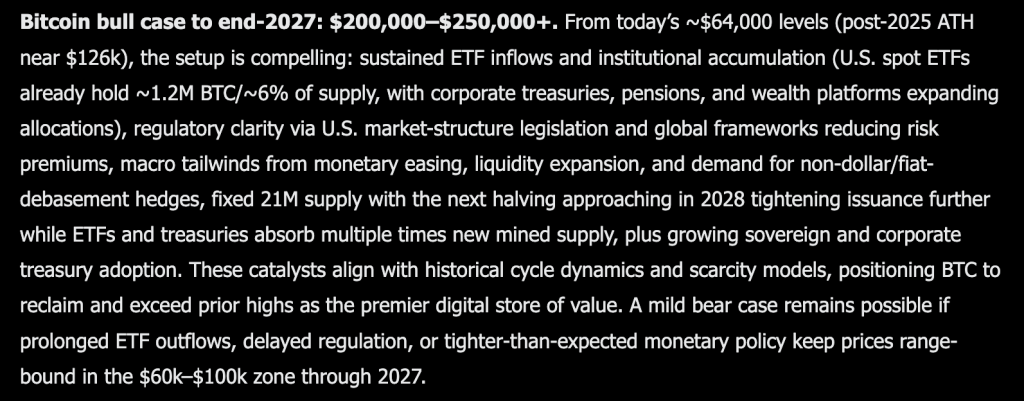
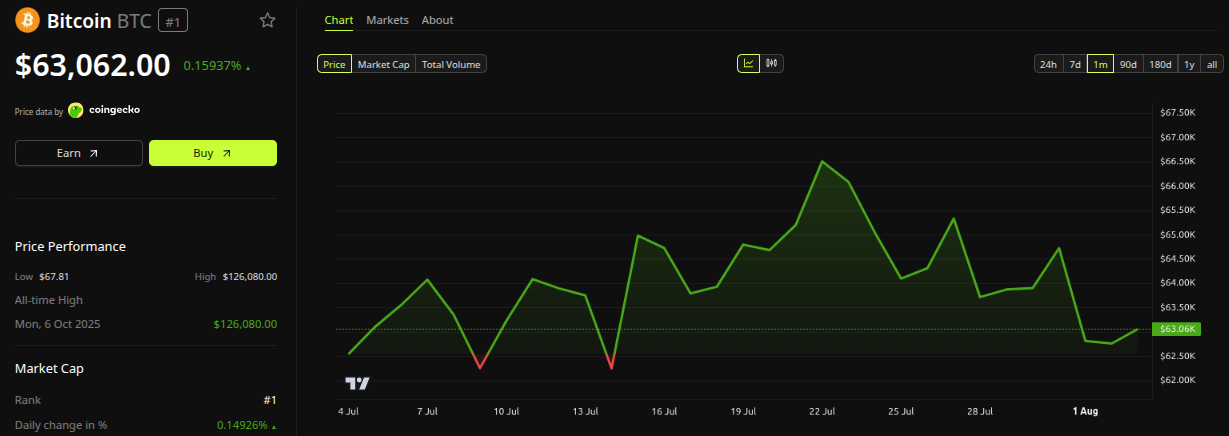
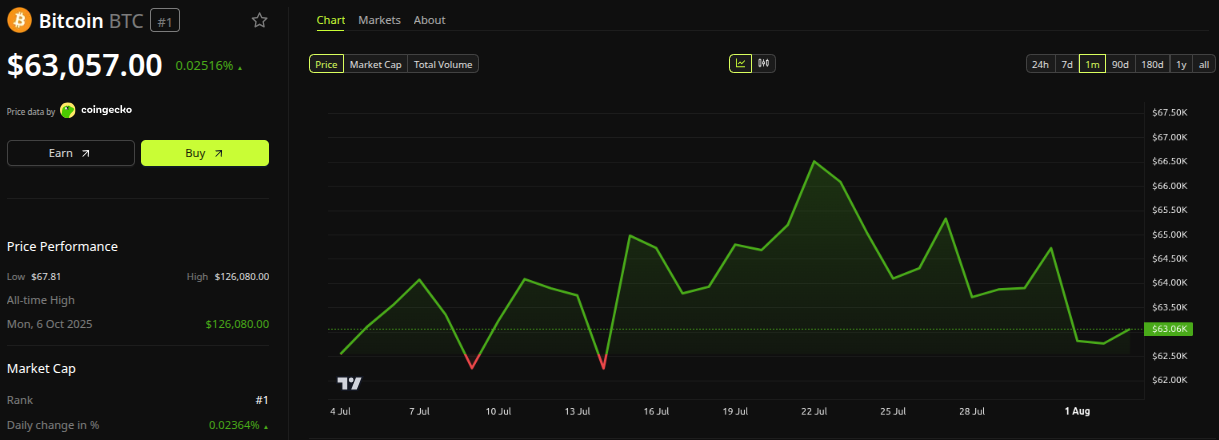
Grok AI predicts a major re-rating for Bitcoin, and this price prediction is unusual in its timeframe, targeting the end of 2027 rather than 2026. From today’s roughly $64,000 levels, well below the 2025 all-time high near $126,000, the bull case runs to $200,000 to $250,000 or higher.
The setup rests on sustained ETF inflows and institutional accumulation continuing to build. US spot ETFs already hold approximately 1.2 million BTC, roughly 6% of total supply, with corporate treasuries, pensions, and wealth platforms all expanding their allocations at the same time.
Regulatory clarity is named as a second major pillar. US market structure legislation, combined with global regulatory frameworks, is expected to reduce the risk premium investors have historically attached to holding Bitcoin.

Macro tailwinds round out the case with monetary easing, broader liquidity expansion, and rising demand for hedges against non-dollar and fiat debasement. Grok also points to the fixed 21 million coin supply, with the next halving approaching in 2028, tightening issuance even further, while ETFs and treasuries are already absorbing multiple times the amount of newly mined supply entering the market.
Growing adoption of sovereign and corporate treasuries is framed as the final piece. Grok argues these catalysts align with historical cycle dynamics and established scarcity models, positioning Bitcoin to reclaim and exceed its prior highs as the premier digital store of value.
The bear case here is treated as mild but genuinely possible. If ETF outflows persist for a prolonged period, regulation gets delayed, or monetary policy stays tighter than expected, Grok sees Bitcoin remaining range-bound in the $60,000 to $100,000 zone straight through 2027.

Bitcoin Price Prediction: BTC Has Spent Six Months Rebuilding From The Same Low Twice, Can Grok AI Predicts Work out?
Price closed at $63,931, down 1.21%, during a session that ranged between $63,547 and $65,340. That quiet red day sits almost exactly on top of a level this chart has visited and defended more than once this year.
Zoom out, and the shape since October 2025 has been a long, uneven decline. Bitcoin peaked near $128,000 that month, then broke down hard through January, gapping from above $92,000 to under $76,000 in a matter of weeks.
Since that crash, price built a rounded recovery through spring, peaking near $99,000 in April, then rolled over into a sharp flush down to $60,000 in June. A second recovery attempt through May pushed toward $82,000 before failing and dragging the price back down to retest that same $60,000 floor in June and July.
That is two separate visits to the same support level within a matter of months, which makes $60,000 one of the more tested lines on this entire chart. Support sits right there at $60,000, with limited recent history below it, before the price moves into territory not seen this year.
Resistance stacks at $66,000, then $70,000, then the heavier April ceiling near $99,000 that has already rejected two full rally attempts. Momentum here is mildly negative after today’s session, consistent with a market still consolidating rather than committing to a clear direction.
For Grok’s bull case to gain real traction over its multi-year timeframe, Bitcoin eventually needs to clear $99,000, a level this exact chart has failed at twice already. Until that happens, the current price action looks much closer to the bear-case range this prediction lays out than to the start of a run toward six figures.
Being Right and Getting Paid Aren’t the Same Thing. Claim up to $25 From Kalshi
You read the analysis. You form a view. The market proves you correct, and buying spot means you were exposed to a dozen things you had no opinion on.
Kalshi is a CFTC-regulated exchange for event contracts: one question, one outcome, one settlement. Trade the Fed, inflation, crypto price levels, and the events that actually move the market.
Contracts can resolve against you and go to zero, so size accordingly.
→ Get up to $25 to trade your first market
The post Grok AI Predicts Bitcoin Will Blow Past Its Old Record by End of 2027 appeared first on Cryptonews.
Japan could formally confirm joint currency action with Washington on Monday, and one official told Reuters the operation is still ongoing, turning the announcement into a live market event.
Bitcoin trades near $63,000, exposed to a bond market problem most crypto traders have not priced.
The Bond Market Reason Behind the Cooperation
The 2011 comparison matters more than it appears. That year the Group of Seven (G7) sold yen to stop it rising, meaning this is the first coordinated effort in 15 years pushing the currency the opposite direction.
Finance Minister Satsuki Katayama will make the announcement, two officials told Reuters. Her top currency diplomat, Atsushi Mimura, signaled the ministry now works in close coordination with monetary policy.
That phrasing carries weight. It suggests Tokyo will pair intervention with the rate hikes the Bank of Japan hinted at last week, rather than relying on purchases alone.
A quieter development may matter more. Japan’s finance ministry made a rare English-language post on X noting it holds a broad range of tools, including access to the Federal Reserve repurchase facility.
The mechanism deserves attention. Introduced in 2020, the facility lets Japan raise dollar liquidity without selling US Treasuries outright.
Follow us on X to get the latest news as it happens.
Critics flagged exactly that constraint. Funding intervention by liquidating Japan’s enormous Treasury holdings risks triggering a selloff in American debt and spiking yields.
Washington’s motivation becomes clearer through that lens. Analysts see the cooperation driven partly by concern over rising Treasury yields, which would worsen if Tokyo failed to stabilize both the yen and Japanese government bonds.
Former Bank of Japan official Nobuyasu Atago framed the logic directly. Both countries risk inflation running hot and leaving their central banks behind the curve, so they see merits in cooperating.
What Bitcoin Traders Should Watch on Monday
Tokyo is managing domestic pressure too. Economy Minister Minoru Kiuchi said Sunday the government will improve market communication, stressing the importance of maintaining trust in Japan’s fiscal sustainability.
Bitcoin traders should care about that bond angle specifically. Rising global yields compete directly with non-yielding assets, and Japanese government bond stress has repeatedly spilled into crypto this year.
“How will global risk assets respond if the world’s largest carry trade begins to unwind? The answers won’t come overnight. But one thing is clear. A story that started in the currency market could end up influencing everything from stocks to Bitcoin…,” Wise Advice said on X.

Positioning amplifies the risk. Non-commercial yen short contracts reached 163,412 by late July, leaving substantial leverage exposed to any sudden reversal. The immediate question is credibility rather than firepower.
Markets will test whether Monday’s confirmation carries a rate commitment or only a purchase pledge.
A hawkish pairing changes the calculus considerably. Rate differentials close permanently when policy shifts, whereas interventions fade once the buying stops.
That distinction shapes both scenarios for Bitcoin. Aggressive yen appreciation forces leveraged unwinding across risk assets, while gradual strengthening alongside a softer dollar could expand liquidity instead.
Timing determines everything here. Asian markets open first on Monday, and any gap in USD/JPY will reach crypto before American traders react.
“If the US sells dollars to buy yen, the dollar weakens and USD/JPY falls. Normally, this supports Bitcoin, gold and tech stocks. But there is a major catch: A rapid yen rally could unwind one of the world’s largest carry trades. Investors who borrowed cheap yen to buy stocks, crypto and other higher-yielding assets may be forced to sell…,” Coin Bureau noted.
The rate gap remains the structural anchor. Japan holds policy at 1% against a considerably higher US ceiling, and no intervention closes that on its own.
Watch the Japanese bond market alongside the currency. If yields stay contained after the announcement, the coordinated defense is working, and Bitcoin’s macro headwind eases with it.
Subscribe to our YouTube channel to watch leaders and journalists provide expert insights.
The post Japan Could Trigger the Biggest Market Shock of 2026: How Might Bitcoin React? appeared first on BeInCrypto.

“This is what modern warfare looks like, and it further illustrates there’s no plan to win a war with Iran,” Walz said.
Emphasizing comments that he recently shared on X, Trita Parsi, Executive Vice President of the Quincy Institute for Responsible Statecraft, said that it would be reasonable for Iran to attempt cyber attacks as a “warning” that it is prepared to retaliate for U.S. strikes.
And Parsi tells TIME that Iran is more than capable of fulfilling the threat.
“Iran is a highly capable cyber power, only one tier below the U.S., China, and Russia, and in some aspects on par with Israel,” he says. “It has in the past demonstrated a clear ability to target industrial control systems, water facilities, and energy infrastructure.”
The joint statement issued last week by federal agencies also underscored Iran’s cyber capabilities. “Iranian cyber actors continue to target U.S. critical infrastructure,” said Assistant Director Brett Leatherman of the FBI’s Cyber Division. However, he added, “The FBI is committed to identifying, disrupting, and imposing costs on those responsible. Sharing timely, actionable intelligence is a critical part of that work.”
Crypto World
Robinhood’s Q2 Revenue Hits Record $1.31B as Prediction Markets Fuel 10x Surge in Event Contracts

Robinhood posted record second-quarter net revenue of $1.31 billion, up 32% year-over-year, as activity across prediction markets, options, and equities helped offset a sharp decline in crypto income.
The company’s transaction-based revenue jumped 44% to $776 million during the quarter. Event contracts emerged as one of its fastest-growing businesses.
In fact, revenue from event contracts reached $156 million, more than 10 times higher than a year earlier. The number of contracts traded also surged more than 10x to a record 13.6 billion.
Prediction Markets Steal the Spotlight
Speaking about the growth of prediction markets, Chairman and CEO Vlad Tenev said that the space has grown steadily since March and expects the momentum to continue. Robinhood launched Rothera, a CFTC-licensed exchange and clearinghouse, in June through its joint venture with Susquehanna International Group. The company said more than 3.5 billion event contracts had been traded to date.
Meanwhile, options remained another major contributor, generating $342 million in revenue. This figure was up by 29% year-over-year. Equities revenue climbed even more sharply, rising 95% to $129 million as equity notional trading volumes reached a record $956 billion, an 85% increase from the same period last year.
The strong performance across these businesses came despite weaker cryptocurrency activity. Robinhood’s crypto revenue fell 38% year-over-year to $100 million, while crypto notional trading volume stood at $40 billion, including $18 billion from its app and $22 billion from Bitstamp.
Global Push
The online brokerage is pushing deeper into blockchain and digital assets internationally. It unveiled the public mainnet for Robinhood Chain, an Ethereum Layer 2 network designed for financial services and real-world assets, while also announcing stock tokens for eligible users in more than 120 countries.
In May, it launched Agentic Trading, which allows customers to use AI-powered agents to trade equities, options, and crypto. Nearly 100,000 customers have opened Agentic Trading accounts so far, with more than $100 million in assets under custody.
During the quarter, the company expanded its international footprint by closing its acquisition of WonderFi, a Canadian digital asset products and services platform. The move marked its official entry into the Canadian market.
Tenev also pointed to the broader expansion strategy, saying
“Whether it’s the Robinhood Chain, Robinhood Ventures, or Trump Accounts, our product velocity is focused on one goal: making everyone an owner. Broad ownership is essential to a free, stable, and prosperous society.”
The post Robinhood’s Q2 Revenue Hits Record $1.31B as Prediction Markets Fuel 10x Surge in Event Contracts appeared first on CryptoPotato.
Craig Wright, the Australian who long claimed to be Satoshi Nakamoto, resurfaced with a sharp critique of Bitcoin current governance.
His argument centers on a single idea: the base protocol should never change, and anyone who can change it holds too much power.
Why Wright Wants Bitcoin Rules Permanently Fixed
Protocol immutability means the fundamental rules of a blockchain remain permanently fixed, with no upgrades altering how the system works. Wright argues that the principle defines genuine decentralization.
In a series of posts on X, the self-proclaimed Satoshi targeted what he described as control by a small circle of developers. Bitcoin, he wrote, was designed as the opposite of a system in which a group can rewrite the rules and isolate dissenters.
Follow us on X to get the latest news as it happens.
The protocol must remain immutable, according to Wright, so no developer, miner, exchange, or corporation can alter it for private gain. Stable rules would create a level playing field.
Businesses could then compete without fearing that a future upgrade undermines their investments. Innovation, in his view, belongs at the application layer.
He expanded on the point in a follow-up post, highlighting what he sees as a contradiction. Many who called him a fraud for defending fixed rules simultaneously defend developers who can restrict capacity and set consensus.
Wright also challenged the popular narrative around running a full node. A home node without hash power cannot produce blocks, order transactions, or compel the network to follow its preferences, he said.
“…Bitcoin was never supposed to depend upon trusting the correct developers. It was designed to remove that power entirely. The rules are fixed; everyone competes above them. If you opposed me because I wanted an open protocol that no individual could change, ask yourself what you were actually defending—and who truly benefited from it…,” Wright exposed on X.
Why the Satoshi Controversy Undermines Wright’s Argument
Node operation may verify data for its owner, he argued, but it does not govern. Running nodes has been marketed as a form of sovereignty, while economic power has shifted toward exchanges and custodians.
Capacity limits push ordinary users away from direct on-chain transactions and toward centralized services, he claimed, reversing the system’s original intent.
His posts also addressed Bitcoin’s evolving public story. The marketing moved from electronic cash to digital gold, then to a store of value, and recently toward promises of generational wealth.
“…the limits pushed ordinary users away from direct transactions and towards exchanges, custodians, payment channels and other middlemen. You were taught that running powerless software at home made you independent while the economic system became increasingly dependent upon centralised services…,” Wright noted.
Wright dismissed that framing as unrealistic. A multi-trillion-dollar asset cannot repeat its early exponential returns, and market capitalization does not equal cash realizable without collapsing prices.

The critique arrives with substantial baggage, however. A United Kingdom High Court ruled in 2024 that Wright is not Satoshi Nakamoto, finding he had forged documents on an extensive scale.
He later received a suspended prison sentence for contempt of court after breaching orders related to that case. Those rulings undercut the authority his claims once carried within the industry.
The underlying debates remain genuine nonetheless. Scaling, protocol rigidity, and the balance of power between developers, miners, and users have divided Bitcoin for a decade.
Whether his comments shift any minds seems doubtful. They do reaffirm a position he has held consistently, regardless of what courts concluded about his identity.
Subscribe to our YouTube channel to watch leaders and journalists provide expert insights.
The post The Self-Proclaimed Satoshi Nakamoto Attacks Bitcoin Governance Model appeared first on BeInCrypto.

Best Car Vacuums (2026): Handheld, Cordless, Shopping Tips

Rebecca Ferguson’s 152-Minute Stephen King Thrill Ride Is Officially Making a Comeback

Biggest financial mistake #shorts


-

 Business4 days ago
Why Trees Belong on the Risk Register
-

 Fashion2 days ago
Weekend Open Thread: Wit & Wisdom
-

 Politics2 days ago
Meta enters AI-training agreement with far-right ‘propaganda rag’ Newsmax
-
 Entertainment5 days ago
‘Stargate’ Creator’s New Sci-Fi Series Returns for Season 3 Tomorrow
-

 Politics7 days ago
Luke Littler dismantles Gerwyn Price to retain title in Blackpool
-
 Crypto World1 day ago
MicroStrategy Post-Earnings CLARITY Act Push Could Add New Catalyst for Its Stock
-

 Politics6 days ago
The Part of the Electric Transition Nobody Wants to Discuss
-

 Business5 days ago
Major shareholder moves on Canyon
-

 Crypto World2 days ago
XRP Ledger v3.3.0 brings five institutional features
-

 News Videos4 days ago
Bitcoin Enters the 3rd Stage of the Bear Market
-

 Crypto World5 days ago
Kraken Enables Retail Access to Jersey Mike’s IPO via Tokenized Shares
-

 Tech6 days ago
New macOS Sequoia & Sonoma security updates for older Macs
-

 News Videos5 days ago
Claude: Build Financial Dashboards in Minutes (2026)
-

 Politics3 days ago
Luke Littler’s dominance sparks GOAT debate
-

 Business5 days ago
Johnson & Johnson agrees to $5.5B settlement over talc cancer claims
-

 Sports3 days ago
Seema Kaliramna Wins Discus Throw Bronze, Takes India’s CWG Medals Tally To 17
-

 Crypto World15 hours ago
Crypto PAC spending tops $2M in Michigan House race
-

 Business2 days ago
Trump Announces Hamas Disarmament Agreement as Iran Strikes Kuwait Air Base and US Attacks Pause Overnight
-

 Tech5 days ago
Gemini can now summarize the messiest comment threads in Google Docs
-

 Tech19 hours ago
ESET tracks rise in malicious AI skills and adaptable malware
You must be logged in to post a comment Login