

Crypto World
LMAX Unveils Digital Asset Collateral Platform for Institutions

LMAX Group has unveiled Kiosk, a hosted portal designed for institutional clients to deposit digital assets into LMAX Custody and use them as collateral across a broad trading universe that spans spot foreign exchange, precious metals, CFDs, perpetual futures, and digital-asset markets. The platform, announced on Tuesday, provides tools for deposits and withdrawals, API credential management, WalletConnect, security controls, and treasury management, delivering an integrated on-ramp for traditional and crypto trading workflows.
Hyper-efficient collateral will be the foundation of modern, converged capital markets, and Kiosk offers a compliant way for institutions to integrate digital assets into their core trading infrastructure.
David Mercer, CEO of LMAX Group, described the platform as a practical step toward merging digital assets with conventional market infrastructure, underscoring the emphasis on compliance and operational readiness for institutions venturing into on-chain collateral.
The launch aligns with LMAX’s broader strategic push to connect traditional and digital markets, enabling crypto holdings to back trading activity across multiple asset classes. By turning digital assets into usable collateral within a regulated framework, the firm aims to streamline liquidity and custody without forcing clients to abandon established processes.
The move sits within a wider industry trend where core financial gatekeepers are exploring tokenized and on-chain collateral assets. Earlier in February, Franklin Templeton announced an institutional collateral program with crypto exchange Binance that lets clients use tokenized money market fund shares as collateral while the underlying assets remain in regulated custody. The model is designed to let institutions earn yield on regulated MMF holdings while leveraging the same assets to support digital-asset trading, without relinquishing custody arrangements.
In another signal of growing momentum, the Depository Trust & Clearing Corporation (DTCC) disclosed plans on May 4 to test tokenized securities in a pilot set to begin in July, with a broader rollout targeted for October. The plan emphasizes that tokenized real-world assets would carry the same protections and ownership rights as their traditional counterparts, a message likely to reassure institutions wary of custody and governance risk in on-chain assets.
Key takeaways
- LMAX’s Kiosk enables institutional clients to post digital assets as collateral for a wide range of trading activities, including spot FX, metals, CFDs, perpetual futures, and digital assets, via a hosted portal connected to LMAX Custody.
- The platform integrates deposits/withdrawals, API credential management, WalletConnect, security controls, and treasury management to streamline on-chain collateral within a regulated framework.
- The rollout reflects a broader trend of major financial players exploring tokenized collateral and on-chain assets to support multi-asset trading without disrupting custody arrangements.
- Franklin Templeton’s collateral program with Binance and DTCC’s tokenized-securities pilot illustrate the sector-wide shift toward on-chain collateral while maintaining traditional investor protections and custody standards.
- Regulatory and governance considerations, as well as adoption pace, will shape how quickly such cross-asset collateral facilities scale across institutions and asset classes.
LMAX’s Kiosk in the context of converged markets
LMAX frames Kiosk as a pivotal piece in its effort to blend traditional and digital asset ecosystems. By enabling institutions to deposit digital assets into custody and simultaneously deploy them as collateral for conventional and crypto-native trading, the firm signals a growing appetite among incumbents to leverage crypto liquidity within established risk and compliance frameworks. The product’s design emphasizes practical interoperability, including WalletConnect support and API credential management, which reduces friction for institutions transitioning to on-chain collateral while preserving operational controls and security standards.
On-chain collateral as a growing institutional theme
The Kiosk launch comes amid a broader industry arc where large financial players are trialing tokenized and on-chain collateral solutions. Franklin Templeton’s collaboration with Binance illustrates how tokenized money market fund shares can function as collateral, with the underlying assets retained in regulated custody to address risk and custody concerns. This approach aims to deliver yield opportunities on traditional assets while simultaneously expanding the set of assets usable as collateral for digital trading activity.
DTCC’s announced tokenized-securities pilot further underscores the sector’s shift toward on-chain representation of real-world assets. Scheduled for a July pilot with an October full launch, the plan envisions tokenized securities offering the same investor protections and ownership rights as their conventional counterparts, potentially accelerating cross-border settlement, custody, and liquidity among a broader ecosystem of market participants.
What this means for markets and participants
For institutions, Kiosk represents a practical pathway to harmonize digital-asset holdings with existing risk controls and trading workflows. If such platforms prove scalable and compliant at a broad scale, firms could see faster collateral turnover, improved capital efficiency, and new avenues to monetize crypto holdings without compromising custody or governance standards. Traders and fund allocators may gain more flexible access to collateralized liquidity, while custodians and fintech providers are pushed to strengthen security, governance, and interoperability across on-chain and off-chain environments.
However, the convergence of traditional markets with on-chain collateral also raises questions about regulatory alignment, disclosure expectations, and liability in the event of asset price swings or platform outages. As DTCC and other regulators explore tokenized assets and cross-asset collateral, market participants will closely watch how safeguards evolve, how risk is measured across multi-asset positions, and how enforceable protections translate into real-world trade execution and settlement.
For now, Kiosk stands as a concrete example of how institutions are experimenting with using digital assets to support broad collateral needs, rather than merely holding crypto for speculative purposes. The pace of adoption will hinge on continued clarity from regulators, the robustness of custody solutions, and the interoperability of cross-asset platforms with existing risk management frameworks.
Readers should keep an eye on next steps from LMAX and its peers, including how the DTCC tokenized-securities program progresses and how Franklin Templeton’s model unfolds in practice. These developments will shape the trajectory of converged capital markets and influence the evolving role of on-chain collateral in traditional finance.


Botanix Labs is winding down its Spiderchain Bitcoin Layer 2, giving users until July 9 to withdraw all assets before the network goes dark. The Polychain-backed project cited insufficient demand for Bitcoin-native DeFi as the reason it could not sustain itself economically. In a post on X Tuesday,… Read the full story at The Defiant


Curve Finance has launched Llamalend v2 on Optimism with support for isolated lending markets and non-crvUSD borrowing pairs, opening the first phase of a lending system upgrade ahead of a planned Ethereum mainnet rollout later this year.
Summary
- Curve has launched Llamalend v2 on Optimism, expanding lending beyond crvUSD-only borrowing markets.
- Users can now use Curve LP tokens as collateral while maintaining exposure to liquidity pool rewards.
- The rollout starts with three isolated markets and a 250,000 OP incentive program ahead of an Ethereum mainnet launch.
According to Curve Finance, the new version removes a key limitation from Llamalend v1, which was built around crvUSD as the borrowed asset. Markets can now be created using supported assets on both sides of a lending pair, subject to governance approval, allowing collateral and borrowed assets to be selected without requiring crvUSD.
The deployment begins on Optimism, where Curve said users will initially be able to access three isolated markets: ETH against wstETH, wstETH against USDC, and WBTC against USDC.
All three markets will launch with borrow caps set at zero, meaning users can lend assets but cannot borrow until governance approves debt limits through a DAO vote expected to take about seven days.
LP tokens can now support borrowing activity
Alongside the expansion beyond crvUSD markets, Curve has introduced support for LP tokens as collateral. According to the protocol, liquidity providers can deposit Curve LP tokens, continue earning trading fees from liquidity pools, and borrow against those positions simultaneously.
The update ties lending activity more closely to Curve’s exchange infrastructure. Curve said the framework could also support other productive collateral types in the future, including yield-bearing vault assets and principal tokens used in fixed-yield strategies.
Llamalend v2 retains the liquidation model introduced with the original protocol in early 2024. Rather than liquidating a position at a single price point, the system uses a liquidation range that gradually converts collateral into the borrowed asset as prices move through predefined levels.
Curve previously said the design was created to reduce concentrated liquidation pressure during periods of market stress and give borrowers more time to manage positions.
Risk controls remain separated on a market-by-market basis. According to Curve, each lending market carries its own collateral asset, borrowed asset, oracle configuration, borrowing limits, and risk parameters. Borrow caps start at zero and must receive governance approval before debt can accumulate.
LlamaRisk reviews markets before borrowing begins
For the initial rollout, Curve said LlamaRisk will review proposed collateral assets and oversee market assessments before markets move through governance. The protocol noted that isolated markets reduce the possibility of risks spreading between unrelated lending pairs.
Support for the launch includes a 250,000 OP token grant from the Optimism Foundation, according to Curve’s announcement. The incentives are expected to be distributed over roughly two months to encourage liquidity and participation.
Curve’s technical documentation also states that an initial incentives campaign will distribute 100,000 OP tokens through Merkl across the first markets.
Before enabling borrowing, Curve said it chose to deploy on Optimism to observe contract behavior, integrations, and user activity in a lower-risk environment. A launch on the Ethereum Mainnet is expected during the second half of the year.
The rollout follows other recent lending-related initiatives from Curve. As previously reported by crypto.news, the protocol introduced a bad-debt recovery framework for LlamaLend markets that converts distressed lending positions into tradable on-chain claims.
Curve founder Michael Egorov described that mechanism as an investment tool that could eventually be applied to other markets if successful.

Binance has moved its tokenized-equity program from announcement to live product, introducing bStocks, a first batch of five US equities that eligible users can convert into on-chain tokens and trade around the clock, seven days a week. The exchange posted the launch Wednesday to its official… Read the full story at The Defiant
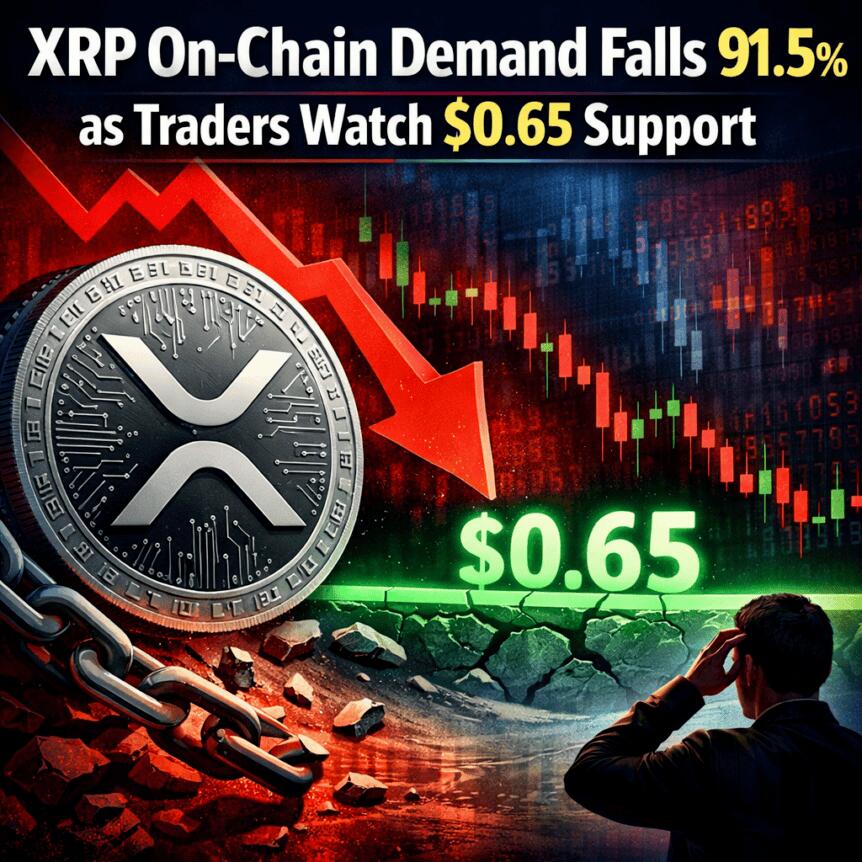
XRP’s on-chain activity has cooled dramatically since its 2025 surge, according to Glassnode’s latest on-chain metrics. The 90-day average of total XRP network fees has plunged to about 500 XRP from roughly 5,900 XRP in February, a 91.5% drop that points to a sharp slowdown in on-chain demand after the mid-2025 price spike that briefly pushed XRP above $3. The pullback in on-chain activity mirrors a broader shift in trader behavior and market structure after a period of intense speculation.
Compounding the view of a cooling market, XRP’s 90-day realized profit-to-loss ratio has collapsed to 0.38, suggesting that more coins are being realized at losses than profits on-chain. At the height of its price run in January and July 2025, when XRP traded near $3.40, the ratio reached around 50 as profit-taking dominated flows. The current regime, by contrast, signals a possible capitulation environment where selling pressure is less about wholesale distribution by big holders and more about risk-off sentiment and leverage-driven liquidations.
Key takeaways
- On-chain demand for XRP has slumped sharply since the 2025 rally, with the 90-day average of network fees falling 91.5% to around 500 XRP.
- The 90-day realized profit-to-loss ratio has fallen to 0.38, indicating losses are being realized more than profits as investors exit positions.
- Exchange-related activity shows a cooling dynamic: large XRP transfers to centralized venues like Binance have declined since the 2025 peak, hinting at a shift away from mass whale distribution.
- A defined accumulation zone between roughly $1.00 and $0.65 is taking shape, anchored by technical levels such as a fair value gap and a high-volume node around $0.50–$0.65.
- Despite near-term weakness, a subset of analysts maintains a longer-term bullish thesis, with a target range of about $15–$18, underscoring the ongoing debate over XRP’s eventual fundamental trajectory.
On-chain activity and what it signals
Glassnode’s analysis stresses that XRP’s on-chain activity has cooled substantially after the explosive run that pushed the token above $3 in the first half of 2025. The drastic drop in the 90-day fee average—from thousands of XRP to a few hundred—suggests a cooling in the network’s transaction activity and a retrenchment of speculative demand. In practical terms, the fee data are often treated as a proxy for everyday transactional use on the XRP ledger, and the current readings imply a lull in users and a normalization after a period of exuberant activity.
Observers are watching whether this cooling translates into a more stable or even depressed price regime. The price action that followed the mid-2025 spike created a technical environment where traders now see a broad band between $1.00 and $0.65 as a critical zone. The question is whether buyers will accumulate enough demand to defend that range or if the market will test lower levels in a broader risk-off cycle.
Profit dynamics: from profit-taking to capitulation?
The realized profit-to-loss ratio offers a window into how investors are managing their XRP positions as market conditions shift. The ratio’s plunge to 0.38 means that for every $1 of realized profit, approximately $2.63 of losses have been realized, a pattern often observed when a market moves from a distribution phase into capitulation, albeit without the same intensity of selling by large holders as in prior cycles.
For context, the ratio reached about 50 during the weeks when XRP hovered near $3.40 in 2025, indicating heavy profit-taking at those price points. The reversal to a low ratio is consistent with a broader shift away from aggressive on-chain profit-taking and toward a more cautious posture among market participants. While this doesn’t preclude a return to stronger hands pushing prices higher, it does highlight a renewed emphasis on risk controls and stop-out dynamics in a market that has already experienced substantial speculative fervor.
Whale flows, exchanges, and the bigger picture
On the exchange-front, data from CryptoQuant offers a complementary view to Glassnode’s on-chain activity. Analysts have flagged a decline in transfers of XRP to major exchanges, particularly among the higher-cohort holders. Notably, inflows of 100,000–1,000,000 XRP and those above 1,000,000 XRP have weakened since the 2025 peak, with declines of about 15% and 20%, respectively, since October 2025. The trend points to a reduction in the step-like distribution that often accompanies top-of-cycle sell-offs.
Analysts caution that the near-term price weakness appears more connected to leverage-driven liquidations and a risk-off mindset than to a broad, coordinated dump by large holders. In other words, while large holders are still active participants in the space, their activity does not appear to be the dominant force shaping XRP’s price action at this juncture. The combination of fading on-chain demand and shifting exchange dynamics creates a nuanced backdrop for traders who must weigh potential liquidity gaps against the possibility of renewed demand in a broader crypto-market upcycle.
In terms of regional and behavioral signals, the XRP ecosystem still shows a classic pattern: from a few clear acceleration points to a more cautious phase where traders hunt for lower-risk entries. CryptoQuant’s analysis highlights how inflows to exchanges from large holders have cooled, which historically has preceded or accompanied broader corrections in the XRP market. Yet, as ever in volatile crypto markets, these trends must be contextualized within macro conditions, liquidity cycles, and evolving regulatory dynamics that continue to shape investor risk appetite.
Technical map: where buyers are watching
From a chart perspective, XRP has been consolidating within a zone that many traders view as a potential bottoming region. The weekly price action points to a cluster of technical levels between $1.00 and $0.65. A notable fair value gap created during XRP’s late-2024 rally spans roughly $0.63 to $1.00, and price has shown movement back toward this zone after breaching the $1.40 level on the downside. Visible-range volume profile data indicate relatively light activity below current prices until a high-volume node sits around $0.50–$0.65, suggesting a meaningful area of liquidity in that neighborhood.
The point of control—the price area with the most traded volume—sits near $0.52–$0.55, reinforcing the idea that this range has become a magnet for immediate supply and demand. In addition, XRP’s five-year ascending trendline projects to intersect near $0.60–$0.65 in the coming months, a confluence of support that could anchor a potential bounce if macro conditions support renewed risk appetite.
On the community front, market observers have begun highlighting the $0.60–$0.65 band as a practical accumulation zone. Traders such as Crypto Patel have identified $1.00–$0.60 as a preferred range to accumulate, while others like Javon Marks continue to model a longer-term bull scenario with a target of roughly $15–$18 per XRP—a move that would imply roughly 1,100% upside from current levels. While such a trajectory remains contingent on a sustainable macro and market-driven re-pricing of risk, the convergence of on-chain, exchange, and technical signals keeps the narrative alive for those investors betting on a reacceleration in XRP’s adoption and liquidity cycle.
What to watch next
As the market digests a quieter on-chain environment and a shift in exchange activity, XRP traders will be closely watching whether demand can re-emerge around key support around $0.60–$0.65 and whether buying interest can sustain a move back toward the $1.00 threshold and beyond. The overarching question remains whether the longer-term bull thesis can absorb another round of macro shocks or if a fresh catalyst—regulatory clarity, improved liquidity conditions, or institutional participation—could reframe XRP’s trajectory in 2026.


Japan's three largest banks have moved from exploratory talks into formal infrastructure deployment, establishing a joint stablecoin council targeting live transactions by March 2027. Mitsubishi UFJ Bank (MUFG), Mizuho Bank, and Sumitomo Mitsui Banking Corporation (SMBC) published a joint press… Read the full story at The Defiant


Brad Garlinghouse has endorsed claims that Wall Street firms are increasingly pursuing the same institutional finance strategy that XRP was once criticized for supporting.
Summary
- Brad Garlinghouse backed Hugo Philion’s claim that Wall Street and crypto firms are increasingly adopting XRP’s institutional finance vision.
- Philion said Ripple’s payments strategy has remained consistent despite years of regulatory challenges and industry criticism.
- The comments come as the XRP Ledger prepares its v3.2.0 upgrade and Ripple supports Mastercard’s new AI payments network.
According to comments shared on X, Ripple CEO Brad Garlinghouse responded with a one-word endorsement after Flare co-founder Hugo Philion argued that many parts of the crypto industry are now embracing the bank-focused approach that XRP and Ripple promoted from the beginning.
The exchange began after an X user highlighted remarks Philion made during a recent interview discussing Ripple’s long-standing role in digital payments. The user wrote that parts of the crypto sector had mocked XRP’s institutional vision in the past but were now attempting to replicate it. Garlinghouse replied simply, “True.”
Philion’s comments centered on how perceptions of Ripple have changed over time. During the interview, he said XRP and Ripple were once criticized for working closely with banks and financial institutions. According to Philion, many projects across the crypto market are now seeking similar relationships with traditional finance firms.
Ripple’s institutional strategy gains fresh attention
Speaking in the interview, Philion said he had always been interested in XRP and viewed Ripple’s payments strategy as being largely on the right track. He argued that regulatory challenges have created more obstacles for the company than issues related to its business model.
While discussing the criticism Ripple faced in its early years, Philion said XRP was often labeled a “banker coin.” He contrasted that view with the current market environment, where many crypto companies are actively pursuing partnerships with banks, payment providers, and financial institutions.
Philion also stated that Ripple has remained consistent with its original objective of improving payments infrastructure. According to his comments, the company has continued building around that use case while maintaining one of the most active communities in the digital asset industry.
Recent developments involving Ripple have added context to the discussion. As previously reported by crypto.news, Mastercard recently launched an AI-powered payments network called Agent Pay for Machines with support from more than 30 companies, including Ripple, Coinbase, the Solana Foundation, Stripe, Adyen, Cloudflare, and OKX.
According to Mastercard, the platform is designed to allow autonomous software agents to carry out transactions, settlements, and machine-to-machine payments. Ripple said fast settlement infrastructure remains an important component for such systems, reinforcing the company’s long-standing focus on payment efficiency.
XRP Ledger prepares next software release
Alongside the renewed debate over Ripple’s role in financial infrastructure, development work on the XRP Ledger continues ahead of a scheduled software update.
According to the XRP Ledger Foundation, version 3.2.0 is expected to be released on June 15 following last month’s rollout of version 3.1.3. The previous release included updates affecting NFTs, Multi-Purpose Tokens, Vaults, the Lending Protocol, and Permissioned Domains.
One of the most notable changes in the upcoming release is a rebranding of the network’s core server software. According to the XRP Ledger Foundation, the software currently known as “rippled” will be renamed “xrpld.”
The foundation said the change is intended to better represent the expanding open-source ecosystem surrounding the XRP Ledger.
Long-dormant Cardano wallets are suddenly moving ADA again, according to Santiment data, right after Charles Hoskinson’s bold reappearance claiming the network can “run the world.”
Is it the bullish reversal signal investors have long awaited, or simply a dead cat bounce before more distribution?
What the Cardano Dormant Wallet Activity Reveals
Cardano dormant wallets are addresses holding ADA that have stayed inactive for long periods. Santiment data show these older holdings are suddenly becoming active again, a behavioral shift that has historically appeared around major reversal points.
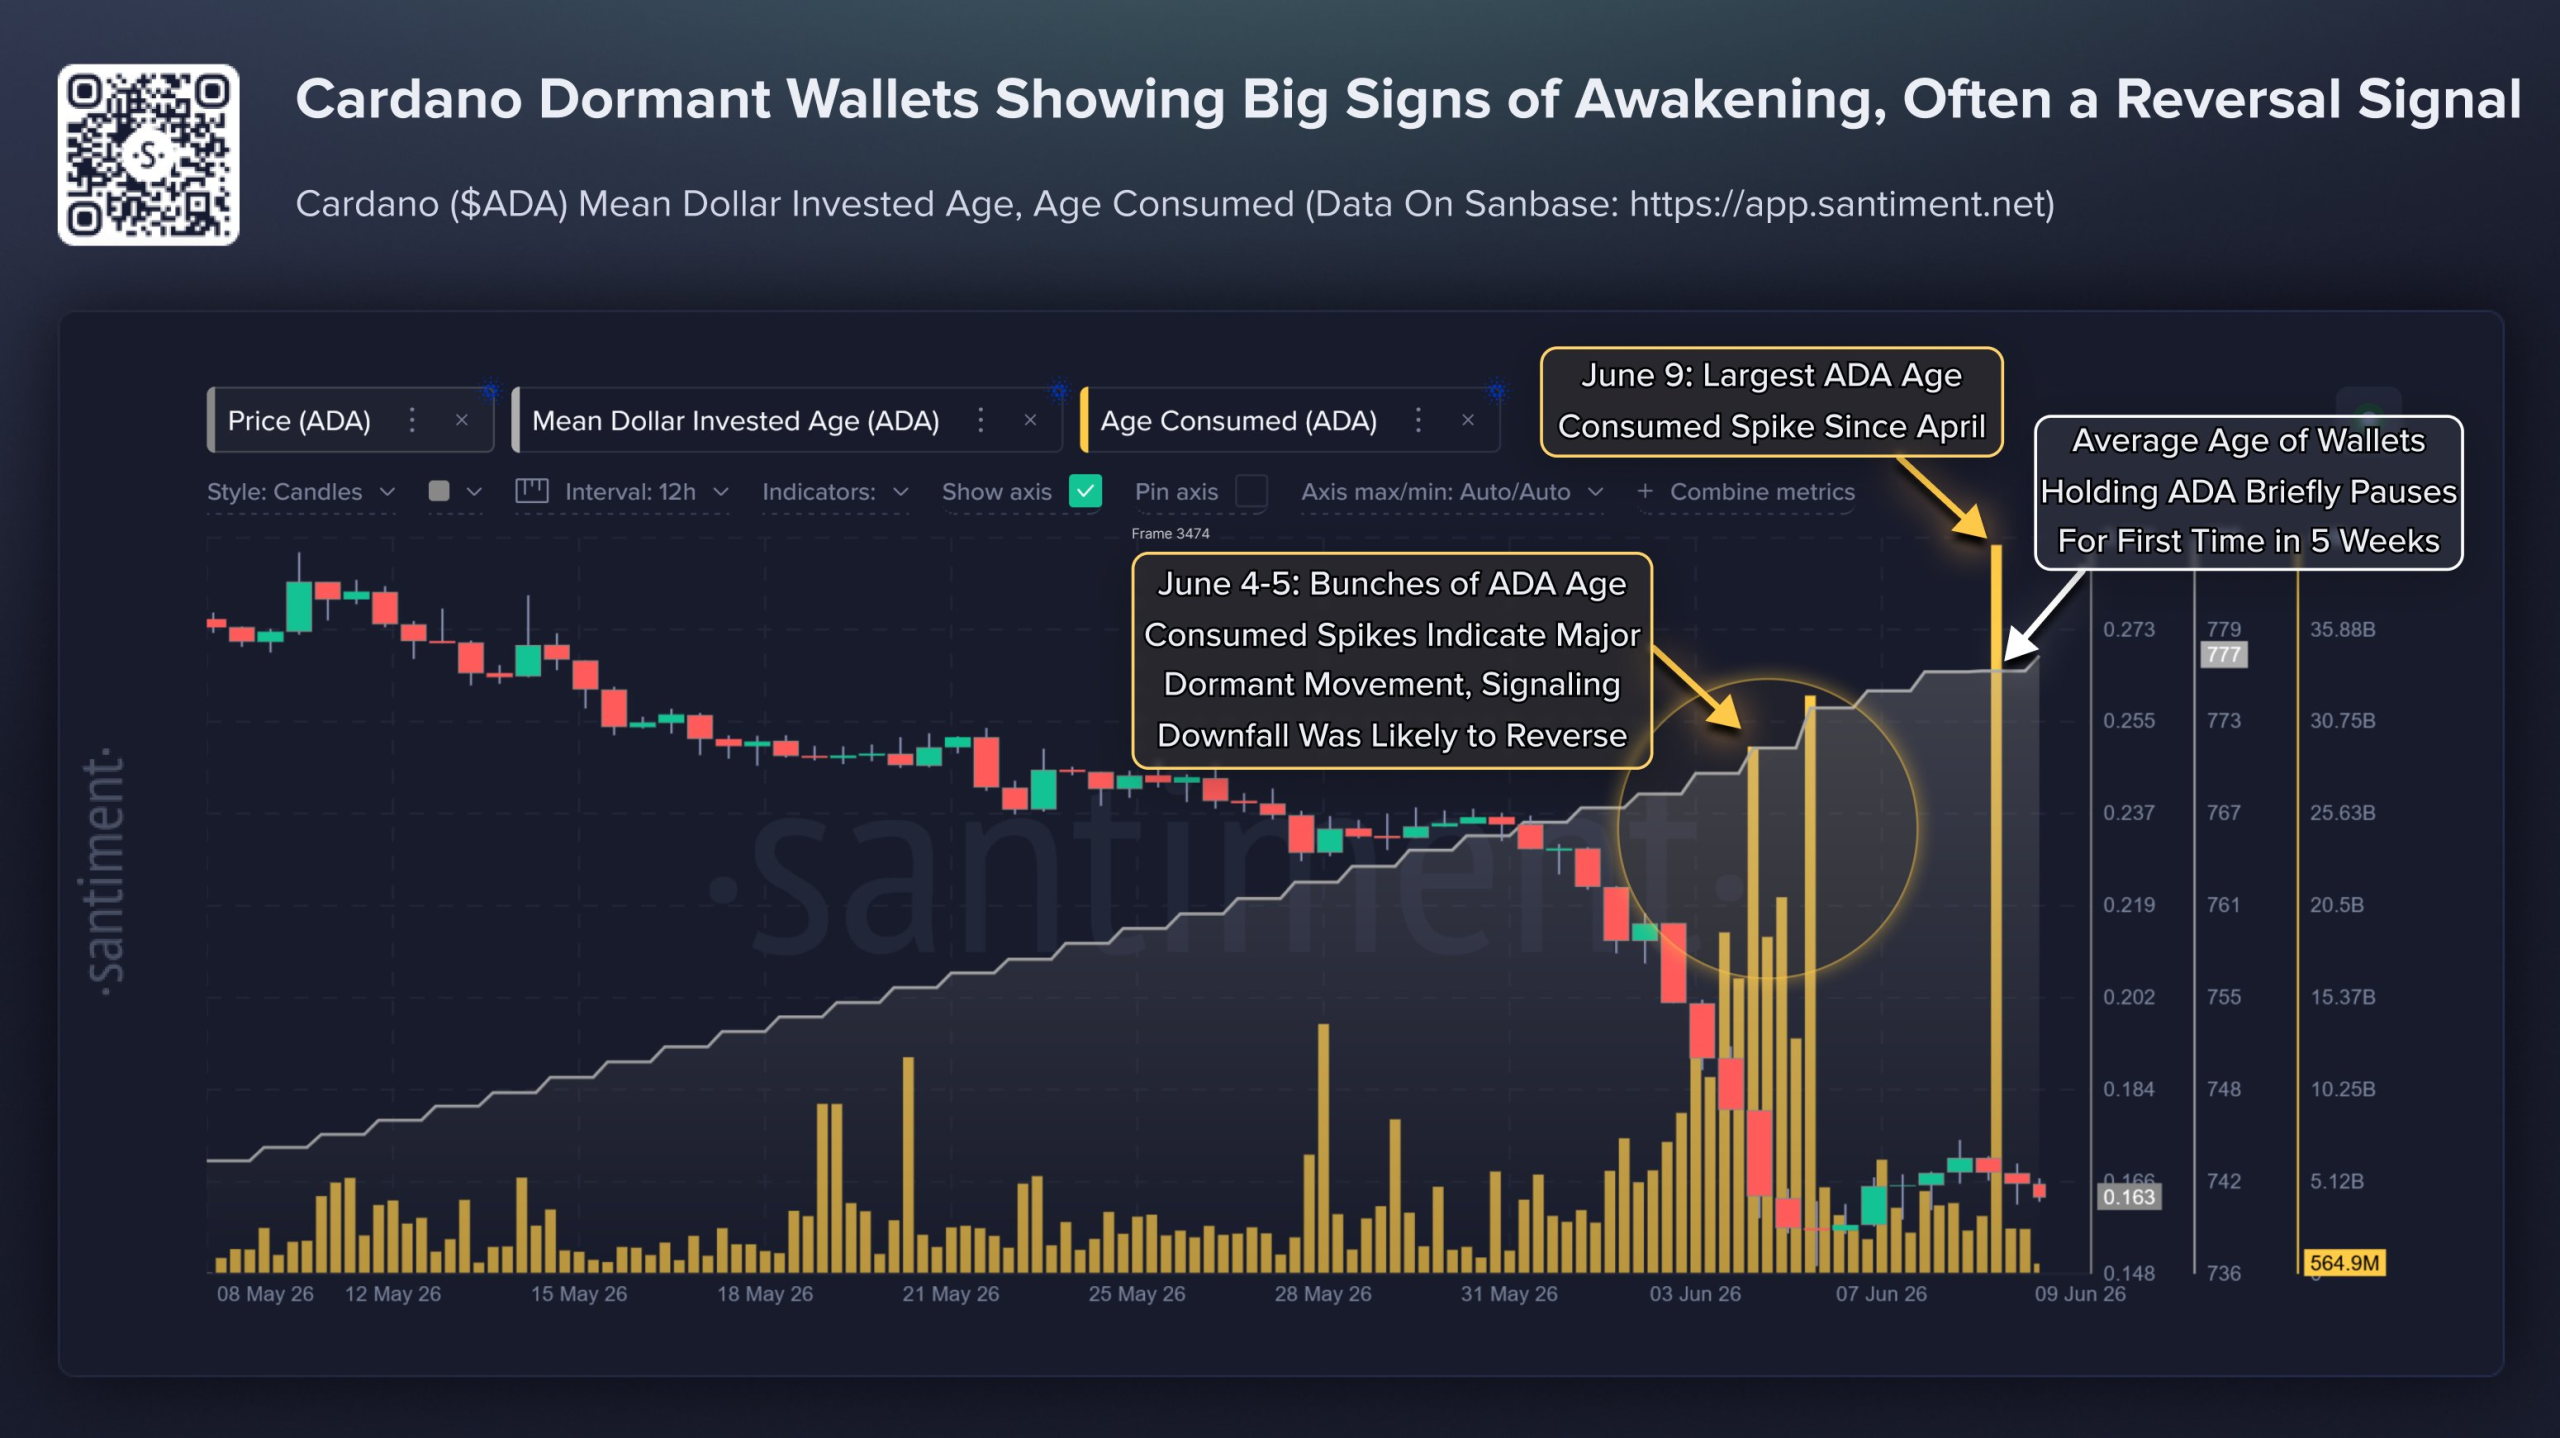
Cardano’s Mean Dollar Invested Age, which tracks the average age of capital held across ADA wallets, had been rising steadily since early May. That trend paused for the first time in five weeks, signaling that older coins are now changing hands.
Follow us on X to get the latest news as it happens

At the same time, the Age Consumed metric spiked sharply between June 4 and June 9. The largest surge happened on June 9, marking the strongest reading since April and confirming dormant ADA holdings are entering circulation.
Age Consumed measures how many tokens moved and how long they were held before moving. A sharp spike means coins that have sat idle for long periods suddenly become active, which often coincides with shifts in the broader market direction.
“These signals don’t automatically mean a reversal is coming, but they do indicate that something has changed beneath the surface. Historically, clusters of Age Consumed spikes paired with a pause (or downturn) in Mean Dollar Invested Age have often appeared around key market turning points,” Santiment said.
The timing matters. ADA trades near $0.16, down roughly 94% from its all-time high of $3.09, and the recent price capitulation may be motivating long-term holders to start moving their tokens again.
CoinGlass data adds another layer. Roughly 20 million ADA (~ $34 million) left exchanges for self-custody wallets in the past 24 hours, reinforcing the narrative that participants are buying the dip rather than distributing into broader market weakness.

Why Hoskinson’s Return Strengthens the Bullish Thesis
Charles Hoskinson reappeared with a bold message on June 8. The Cardano founder argued the blockchain has the potential to become the foundational operating system for the entire globe, solving a multi-trillion-dollar global trust crisis.
He identified four core pillars that he believes make Cardano uniquely different. These include the Ouroboros consensus protocol, the extended UTXO accounting model, the modularity of partner chains like Midnight, and a decentralized governance structure.
Hoskinson also criticized rival networks for sacrificing decentralization in favor of speed. He framed Cardano as playing a different long-term game focused on solving real problems rather than chasing the flavor of the week across crypto markets.
“…When I look at the competitors, we’re playing a different game than them. And that’s why we’re going to win… They’re chasing the flavor of the week, the company of the week, the announcement of the week. And we want to change the world. We want the world to be a better place,” Hoskinson argued.
He urged the Cardano community to stop focusing solely on metrics such as Total Value Locked or short-term token prices. His broader pitch ties Cardano’s mission to global trust, economic value creation, and even what he described as world peace.
The combination of his message and the dormant wallet activity creates an interesting setup. Long-term ADA holders appear to be repositioning just as the founder reasserts the long-term vision, a move that has historically signaled accumulation phases.
The signals are not bulletproof. Dormant coins moving could also reflect distribution rather than accumulation. Yet exchange outflows, capitulation-level prices, and renewed founder communication suggest the bullish reading currently outweighs the bearish interpretation for ADA across the coming weeks.
Subscribe to our YouTube channel to watch leaders and journalists provide expert insights.
The post Large Dormant Cardano Wallets Move as Hoskinson Reappears: Reversal Signal? appeared first on BeInCrypto.
A popular analyst has said that right now, Ethereum (ETH) is the better trade for shorter-term players, but Ripple’s ts2qaXRP has more upside for anyone willing to hold through the current cycle.
That call is coming at a time when the two assets have been posting double-digit losses across several timeframes.
ETH Now, XRP Later
The discussion was kick-started when an X user asked analysts CrediBULL Crypto and Bobby A whether they would fancy XRP over Ethereum.
CrediBULL responded, saying that he prefers ETH over XRP for shorter-term trading, but if the XRP/ETH ratio fell by 30% or so to reach a midrange level, then the cross-border token would become the better near-term bet.
The analyst also argued that the pair may have already formed its macro bottom and could eventually print a higher low before XRP begins outperforming ETH again. And for investors buying spot and holding through the cycle, he believes XRP has “more overall upside potential” from current levels.
On Ethereum specifically, CrediBULL had posted earlier that he was happy with recent ETH buys, noting that calls for $0 ETH appearing on his social feed were a contrary signal that the token was likely to move higher soon.
Fellow market watcher Bobby A suggested that the world’s second-largest cryptocurrency may have already bottomed out and could range between roughly $1,550 and $1,650 for a few weeks before reversing higher.
But CrediBULL said that he didn’t expect a drop below $1,380 and thinks that a hold at current levels on the lower timeframe could lead to a push toward $2,500 to $2,600 before the next meaningful pullback.
Meanwhile, several XRP-focused analysts are also optimistic about the token’s future, with one of them, ChartNerd, suggesting that the implementation of the GENIUS Act and CLARITY Act could strengthen XRP’s role within the financial system.
On his part, EGRAG CRYPTO pointed to a combination of technical indicators that he believes are converging around a major decision point for the Ripple token. According to him, a breakout above the $1.66-$2.00 range could activate higher targets. However, he cautioned that a failure to hold support could first send the token lower.
What the On-Chain Data Shows
Both ETH and XRP have been under real pressure, with the former trading just above $1,600 at the time of writing. That’s a 3% drop in 24 hours and a 31% dip over 30 days, with the asset more than 67% below its August 2025 all-time high.
XRP has also dropped in the same manner and was trading around $1.11 at press time, off 5% on the day and almost 24% in the last month.
On the Ethereum side, Santiment data shows that the coin has fallen into an “extreme fear zone,” with positive-to-negative commentary at one of its lowest levels of the year.
However, the firm noted that a similar sentiment collapse in April last year saw ETH’s value triple over the next four months, eventually hitting an all-time high.
For XRP, data from Glassnode shows that the 90-day moving average of its realized profit-to-loss ratio was around 0.38, meaning holders are getting only 38 cents of profit for every dollar of loss recorded on-chain.
The post XRP vs. ETH: One Analyst Sees a Clear Short-Term Favorite appeared first on CryptoPotato.
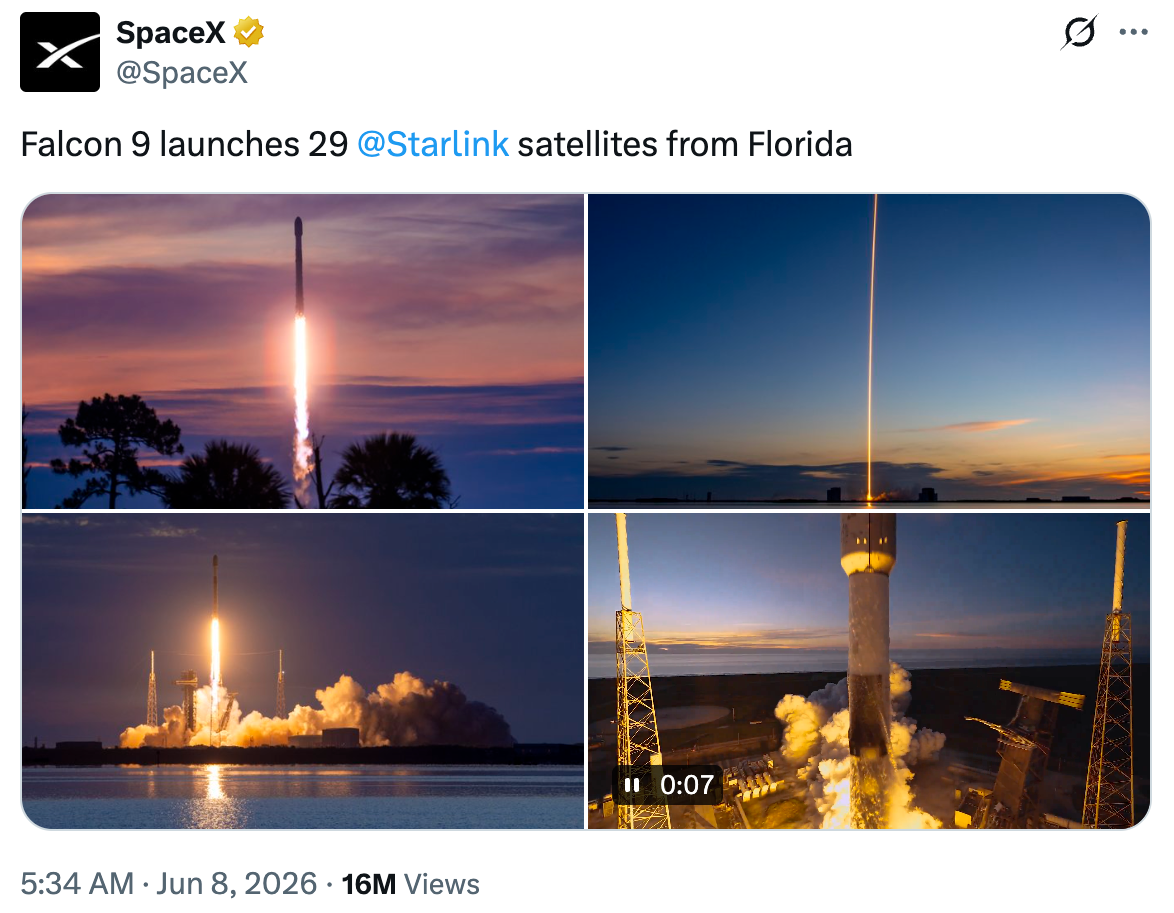
Blockchain.com has launched 24/7 perpetual trading for institutional clients through its OTC desk, offering around-the-clock exposure to stocks, equity indices, commodities, foreign exchange markets and pre-IPO companies.
The rollout includes a SpaceX-linked perpetual contract, allowing eligible investors to take positions tied to the aerospace company’s anticipated public listing. According to the company, the contract is already live through its OTC desk.
Blockchain.com said the new service is intended for institutions seeking continuous market access outside traditional trading hours. The company said clients can use the platform to hedge or adjust positions across multiple asset classes, including on weekends when most traditional markets are closed.
The firm cited use cases including options desks managing exposure, macro funds trading across asset classes and investors seeking exposure to anticipated public listings.
Blockchain.com’s announcement tweet Tuesday to its 1.3 million followers.
Source: Blockchain.com on X.com
The move follows Blockchain.com’s April launch of perpetual futures trading through its self-custody wallet. At the time, the company said it planned to expand beyond crypto markets into stocks, commodities and foreign exchange.
In May, Blockchain.com confidentially filed paperwork with the US Securities and Exchange Commission for its own proposed initial public offering.
Related: Senator Elizabeth Warren questions Elon Musk about X Money
Pre-IPO trading emerges as a new crypto battleground
Bloomberg reported in April that SpaceX had confidentially filed for an IPO and was considering a valuation of more than $1.75 trillion, potentially making it one of the largest public listings in US history. Anticipation around the company’s expected June 12 market debut has since fueled a wave of pre-IPO products from crypto exchanges.
Binance last month introduced pre-IPO perpetual futures tied to private companies, beginning with a SpaceX-linked contract settled in USDT. The derivatives allow traders to speculate on a company’s expected valuation before and after an IPO without owning the underlying shares.
Last week, crypto exchange Kraken announced that SpaceX would become the first company offered through its xStocks IPO Access platform, allowing eligible users in more than 110 markets to participate through tokenized shares backed 1:1 by the underlying stock. Once issued, the tokens can be traded around the clock on Kraken and other xStocks-supported platforms.
Bybit followed days later, indicating it would also offer access through xStocks, marking the first IPO available through the exchange’s new tokenized equity program.

Source: SpaceX
Coinbase has also launched pre-IPO markets for international users through a perpetual futures contract tied to SpaceX’s estimated private-market valuation. The USDC-settled product is designed to convert into a post-IPO contract if the company ultimately begins trading on public markets.
Investor demand for the offering has continued to accelerate. On Tuesday, Reuters reported that the IPO was running three and a half to four times oversubscribed, with demand exceeding $250 billion for an offering expected to raise $75 billion.
Magazine: Bitcoin miners are pivoting to AI, so why is the hashrate near ATHs?
Crypto World
Humanity Protocol Traces $36M Hack to Single Malware-Infected Machine That Held Seven Keys


Humanity Protocol published a forensic incident report Tuesday tracing its $36 million breach to a single malware-infected developer machine that stored backups of seven private keys, giving an attacker unilateral control over the protocol's Ethereum and BNB Smart Chain infrastructure. The keys,… Read the full story at The Defiant

Botanix Shuts Down Bitcoin L2 Spiderchain After Four Years
The Mancunian Way: Clashes, Dolly and Mrs T
Gold rises from 6-mth low amid heightened Iran tensions, Fed rate concerns


-

 Fashion5 days ago
Weekend Open Thread: Evereve – Corporette.com
-
 Crypto World6 days ago
Jensen Huang Approves Samsung, SK Hynix, and Micron for NVIDIA (NVDA) HBM4 Memory Supply
-

 Crypto World3 days ago
Anatomy of the June crypto crash: Fed, Iran, Saylor
-
 Entertainment4 days ago
The Best Mystery Series of All Time Is Surging on Streaming 30 Years After It Ended
-

 NewsBeat3 days ago
Alexander Zverev wins the French Open to finally earn a 1st Grand Slam title
-

 Tech5 days ago
Suspicious Polyfill login prompts pop up on Toshiba, Muji websites
-
 Crypto World4 days ago
Senator Cynthia Lummis Calls CLARITY Act the Most Consequential Financial Legislation of This Generation
-

 Tech6 days ago
Microsoft launches MXC, an OS-level sandbox for AI agents, with OpenAI and Nvidia already on board
-
 Tech4 days ago
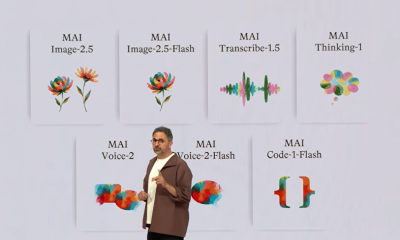
Microsoft unveils seven homegrown AI models in new bid for ‘long term self-sufficiency’
-

 Business6 days ago
(VIDEO) Justin Bieber Delivers Surprise Happy Birthday Serenade to Diners at Los Angeles Mexican Restaurant
-
 Business4 days ago
The Pain Points Taking a Fragile Tech Rally Down a Notch
-
 Crypto World3 days ago
Eli Lilly (LLY) Stock Surges 4% Following Breakthrough Sleep Apnea Trial Results
-
Crypto World6 days ago
LBank Surpasses 25 Million Users Worldwide as AFA Partnership Continues to Drive Global Growth
-

 Tech5 days ago
Von der Leyen’s AI envoy pick draws conflict-of-interest fire
-

 Tech6 days ago
Meta steals a tactic from Tesla and builds data centers in tents
-

 Crypto World4 days ago
Trump’s AI Ownership Plan Could Benefit Anthropic at OpenAI’s Expense
-
 Sports1 day ago
Bangladesh beat Australia after 20 years in ODIs, register only their second win over six-time world champions | Cricket News
-

 Business3 days ago
High Stakes for Wembanyama as New York Pushes for 3-0 Lead
-

 Tech5 days ago
Hackers now exploit SolarWinds Serv-U flaw to crash servers
-

 Tech3 days ago
Notion restores access to Anthropic after service disruption
You must be logged in to post a comment Login