
Crypto World
Microsoft Shares Two Days Ahead of Earnings Release

In January, Microsoft shares came under pressure following the company’s earnings report. Although both revenue and earnings per share exceeded analysts’ expectations, growth in the Azure cloud platform slowed to 39% year-on-year from 40% in the previous quarter—enough to disappoint investors. The market is now preparing for the next release: on 29 April, after the close of trading, Microsoft will publish results for the third quarter of its 2026 financial year. Analysts forecast adjusted EPS at $4.04, up 17% from the same period last year. The focus remains on Azure’s performance and the expansion of the paid user base for Copilot within Microsoft 365.
Technical Overview
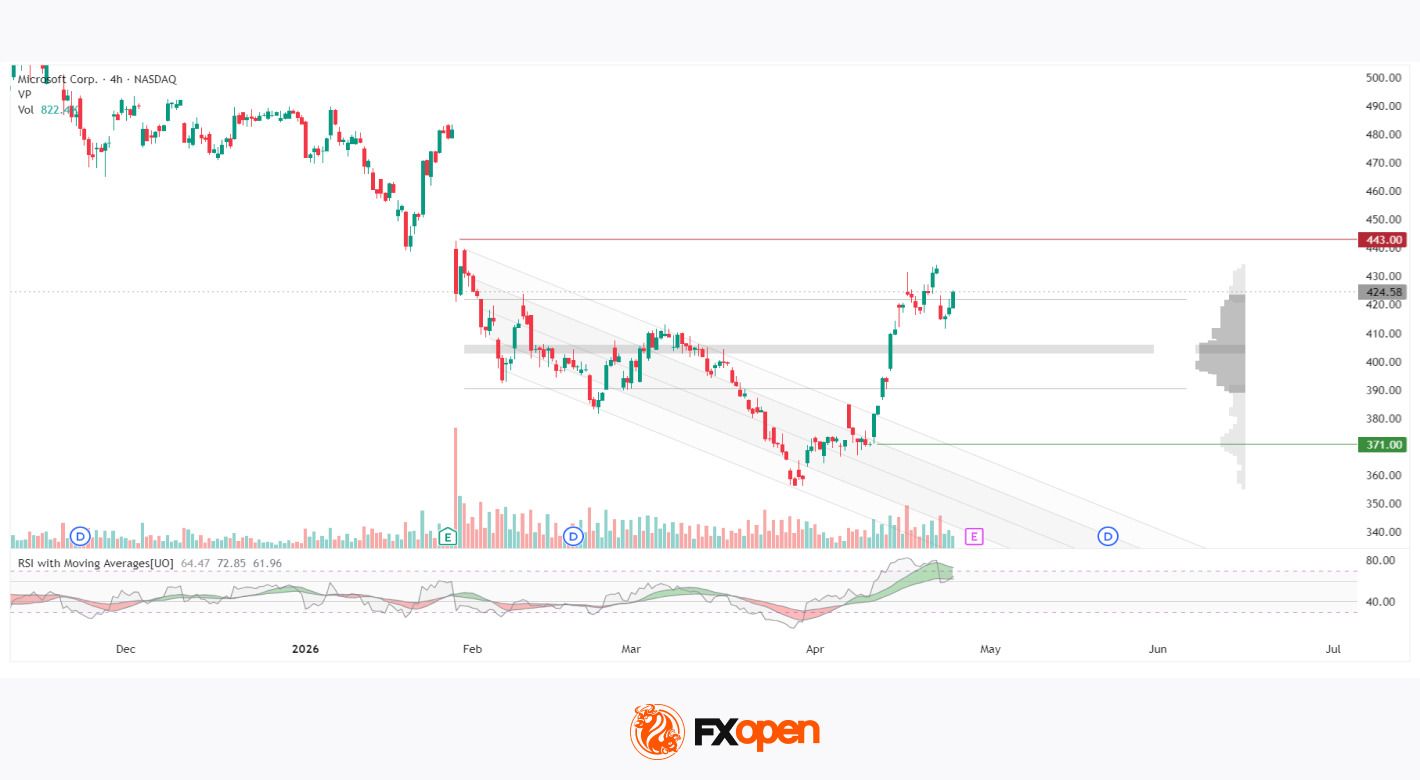
Until late January, Microsoft shares moved sideways, but the 29 January earnings release triggered a sharp gap down accompanied by an abnormal surge in vertical volume, prompting a rapid repricing of the asset. This move laid the foundation for a well-defined downward channel, with the price steadily declining along its boundaries to a low near 357 by the end of March. In April, a recovery pushed the price to around 433, followed by consolidation within the 412–433 range, where it remains ahead of the upcoming earnings announcement.
The horizontal volume balance zone is located at 403–406, with the broader market profile spanning 390–422—current prices are trading above the bulk of accumulated volume. The nearest significant resistance stands at 443, while support levels are seen at 390 and 371. The RSI with moving averages shows readings of 64 / 72 / 61: the oscillator sits between two upward-sloping moving averages, reflecting a bullish bias within the consolidation phase.
Summary
The 412–433 consolidation range is forming just ahead of the 29 April earnings release—an event similar to the one in January that triggered a two-month decline. The volume profile indicates that prices remain above the balance zone at 403–406, while RSI holds in positive territory. The market’s reaction to the upcoming results will determine whether the recovery extends further or the price returns to the prior accumulation range.
Buy and sell stocks of the world’s biggest publicly-listed companies with CFDs on FXOpen’s trading platform. Open your FXOpen account now or learn more about trading share CFDs with FXOpen.
This article represents the opinion of the Companies operating under the FXOpen brand only. It is not to be construed as an offer, solicitation, or recommendation with respect to products and services provided by the Companies operating under the FXOpen brand, nor is it to be considered financial advice.


Cutting Through the Illusion of “Easy Yield” in Decentralised Finance
Decentralised Finance (DeFi) has reshaped how individuals interact with money—removing intermediaries, enabling permissionless access, and introducing new forms of earning. Yet beneath the surface of high annual percentage yields (APYs) and “passive income” narratives lies a more complex reality. Many participants chase returns without fully understanding where those returns originate—or the risks attached.
This article breaks down practical DeFi strategies that actually make sense, separating sustainable mechanisms from misleading hype.
1. Yield Farming: Real Returns vs. Inflated APYs
Yield farming refers to deploying crypto assets across DeFi protocols to earn rewards, often in the form of additional tokens. While advertised APYs can appear extremely attractive—sometimes reaching triple or even quadruple digits—these figures are often misleading.
Where real yield comes from:
- Trading fees generated by decentralised exchanges
- Interest paid by borrowers in lending markets
- Protocol revenue shared with liquidity providers
Where “fake” yield comes from:
- Token emissions (printing new tokens as rewards)
- Short-term incentives designed to attract liquidity
- Unsustainable reward structures that collapse once incentives are reduced
The key distinction is sustainability. If returns rely primarily on newly minted tokens rather than real economic activity, the yield is likely temporary. Once token prices drop or emissions slow, returns can evaporate quickly.
2. Liquidity Providing and Impermanent Loss (Explained Clearly)
Providing liquidity involves depositing token pairs on decentralised exchanges such as Uniswap. In return, users earn a share of trading fees.
However, this strategy introduces a critical risk known as impermanent loss.
What is Impermanent Loss?
Impermanent loss occurs when the prices of the deposited assets change relative to each other. The automated market maker (AMM) adjusts token ratios to maintain balance, which can result in a lower value compared to simply holding the assets.
Simple Example:
- You deposit ETH and USDC into a pool
- ETH price doubles
- The pool automatically sells some ETH to maintain balance
- You end up with less ETH than if you had just held it
Even though you earn fees, they may not always offset the loss—especially during volatile market conditions.
Key Insight:
Liquidity providing works best in low-volatility pairs (e.g., stablecoin pairs) or when trading volume is high enough to generate meaningful fees.
3. The “Passive Income” Myth in DeFi
DeFi is often marketed as a source of passive income, but this framing can be misleading.
In reality, DeFi requires:
- Active monitoring of positions
- Understanding of smart contract risks
- Awareness of changing incentives and tokenomics
- Risk management during market volatility
Returns are not fixed. Strategies that appear profitable today may become unviable tomorrow due to:
- Declining token prices
- Reduced trading volume
- Protocol changes or exploits
Calling DeFi “passive” is like calling trading “set-and-forget”—technically possible, but rarely wise.
4. Core Platforms Explained Simply
Uniswap
A decentralised exchange (DEX) that allows users to swap tokens directly from their wallets. Instead of traditional order books, it uses liquidity pools. Users who provide liquidity earn fees from trades executed in those pools.
Use Case:
- Token swaps
- Liquidity provision for fee generation
Aave
A lending and borrowing protocol where users can deposit assets to earn interest or borrow against collateral.
How it works:
- Lenders supply assets and earn interest
- Borrowers take loans by overcollateralizing their positions
Use Case:
- Earning yield through lending
- Leveraging positions without selling assets
5. What Actually Makes a DeFi Strategy “Sensible”?
A strategy in DeFi is not defined by its APY, but by its risk-adjusted return and sustainability.
Sensible strategies tend to:
- Rely on real economic activity (fees, interest)
- Avoid excessive dependence on token emissions
- Account for downside risks (price volatility, smart contract failure)
- Align with long-term protocol viability
Unsensible strategies often:
- Chase the highest APY without understanding the source
- Ignore risks like impermanent loss or liquidation
- Depend entirely on market hype and token inflation
Conclusion
DeFi offers powerful tools for generating yield, but it is not a shortcut to effortless wealth. Most returns come from identifiable sources—trading fees, borrowing demand, or incentives—and each carries trade-offs.
Understanding where yield originates is the difference between informed participation and speculation.
The reality is simple:
If the yield looks too good to be true, it usually is—and in DeFi, the market corrects that illusion faster than most expect.
REQUEST AN ARTICLE

France’s crackdown on violent, wallet-targeting crimes linked to crypto ownership has intensified, with 88 individuals indicted — including 10 minors — in connection with wrench attacks. National prosecutors say 75 suspects are in pre-trial detention, in a wave of arrests tied to 12 cases overseen by specialized investigating judges at the Paris Judicial Court and monitored by the National Prosecutor’s Office for Organized Crime (PNACO).
Wrench attacks are defined as the use of physical force to access a victim’s crypto wallet, often unfolding as home invasions, kidnappings or extortion attempts. PNACO data show a troubling rise in such incidents: 18 in 2024, 67 in 2025, and 47 already in 2026. Security firm CertiK noted a 75% increase in wrench-attacks worldwide in 2025 versus the prior year, underscoring a global expansion of this criminal tactic. The prosecutions, Perrée stressed, involve acts that are particularly serious due to both harm to individuals and the coercive methods used to obtain crypto transfers under duress.
Key takeaways
- 88 individuals indicted in France over wrench attacks against crypto owners, including 10 minors; 75 in pre-trial detention; 12 cases under investigation.
- Investigations indicate organized, structured networks rather than isolated incidents, with case consolidations revealing repeat offenders across multiple events.
- Global trend shows surging wrench-attacks: 2024 (18 incidents), 2025 (67), and 2026 (47 so far), with CertiK reporting a 75% rise in 2025 year-over-year.
- Officials caution crypto holders about visibility on social media and warn of impersonation scams targeting victims in the wake of investigations.
France expands a state-led effort to dismantle wrench networks
Perrée’s office disclosed that the arrests span a broad spectrum of cases that are now being examined by Paris’s specialized investigating judges, with PNACO supervising. The pre-trial detention rate — 75 suspects — signals strong judicial momentum as authorities pursue charges including arrest, abduction, organized group sequestration, extortion and attempted extortion. The prosecutor stressed that these acts are grave not only for the immediate harm inflicted on victims but also for the chilling effect they have on the crypto ecosystem and the willingness of individuals to engage in on-chain activity under duress.
Law enforcement have begun stitching together the threads of multiple cases after uncovering overlaps where some defendants appear in several wrench incidents. Perrée said that this consolidation, enabled by linking recurrent individuals across cases, reveals the existence of structured networks operating with shared tactics and potentially coordinated financial channels. Investigations remain ongoing under the authority of the investigating magistrates, with aims to identify all participants, map the flow of funds and dismantle the networks involved. Jameson Lopp, chief security officer at Casa, has long maintained a global ledger of wrench-attacks dating back to 2014, with 29 such incidents recorded this year.
Rising threat, rising awareness: what it means for users
The outbreak of wrench-attacks is not merely a courtroom matter; it has real implications for crypto holders who may face duress-based coercion when transferring assets. Perrée urged crypto owners and their families to exercise heightened vigilance and to avoid overexposure on social networks, which could make them targets. She also warned against scammers posing as investigative services or judicial authorities seeking to obtain information under false pretenses.
The broader context for this trend includes research from security firms noting the reasons wrench attacks have proliferated. TRM Labs highlighted last year that wrench-attacks have been rising due to perceived pseudonymity on the blockchain, visible wealth online and the ease with which attackers can harvest personal data. In related chatter around the motives, Telegram founder Pavel Durov attributed some of the uptick in France to alleged misuse of crypto investors’ tax data by a former tax official, a claim that fed into the ongoing public discourse around risk and protection in crypto-related crime.
From a policy perspective, the surge in wrench attacks has already prompted discussions about additional measures to safeguard crypto owners. France’s response appears to be moving toward stronger enforcement and public awareness campaigns designed to reduce the vulnerability of individuals, as authorities pursue reforms and deterrence at the intersection of finance, technology and criminal law. For context, policymakers have referenced broader developments around crypto safety and legality as they weigh new regulations intended to curb violent crypto crime.
Data points cited by security researchers also underscore the evolving nature of this threat. A list maintained by Lopp shows 29 wrench-attacks recorded in 2026 so far, illustrating the spread of incidents beyond Europe and highlighting ongoing global exposure. The April period alone saw five recorded wrench-attacks, reflecting the persistence of this crime wave and the ongoing need for awareness and protective measures among crypto users.
What to watch next
As investigations continue, prosecutors are signaling a sustained effort to pierce the networks behind wrench-attacks and to trace the financial channels that move crypto under duress. Investors and users should monitor updates from PNACO and French authorities, along with regulatory and security community guidance on risk mitigation, including cautious social-media behavior and vigilant verification when dealing with requests for information or transfers. The case also serves as a reminder of the real-world risks associated with financial sovereignty in crypto — and the importance of combining legal enforcement with practical security practices to protect assets and personal safety.
Readers should stay tuned for any new measures announced by French government officials in response to these kidnappings and extortion cases, as well as for continued reporting on how networks are being dismantled and how financial trails are being traced and disrupted.


Luxor Technology Corporation has expanded its partnership with MicroBT through a $100 million commitment to buy WhatsMiner bitcoin mining rigs.
Summary
- Luxor will buy $100 million worth of MicroBT WhatsMiner rigs under an expanded partnership.
- MicroBT signed a term sheet to invest in Luxor, though the investment size was not disclosed.
- Luxor will add LuxOS firmware support for WhatsMiner rigs to improve mining operations.
The deal strengthens ties between the mining infrastructure firm and the hardware maker. The companies announced the expanded agreement on Sunday. Luxor said the purchase commitment forms part of a broader plan to support miners using MicroBT machines.
As part of the agreement, MicroBT signed a term sheet to invest in Luxor through its investment manager, Inflection Technology Ltd. The companies did not disclose the size of the planned investment.
The move adds a financial link to the existing commercial relationship. It also places MicroBT closer to Luxor’s mining software, hardware and service operations.
LuxOS support expands to WhatsMiner rigs
Luxor will also add support for MicroBT WhatsMiner machines through its LuxOS firmware. The company said the rollout will happen in phases across supported mining rigs.
LuxOS can help miners manage power changes during curtailment periods while rigs continue hashing. Luxor said the firmware can complete power target changes within 30 to 60 seconds and improve ramp-up times.
Miners gain access to Luxor services
Operators using LuxOS on WhatsMiner rigs will also gain access to Luxor’s wider service suite. These services include its mining pool, hashrate derivatives, energy services and Luxor Commander for fleet management.
Lauren Lin, Luxor’s head of hardware and software, said,
“Our clients have been asking for WhatsMiner firmware for years, and we have shipped a product that is going to help deliver significant profitability and usability benefits.”
Luxor said its firmware already runs on more than 300,000 bitcoin mining rigs globally. The company has also expanded beyond mining hardware into GPUs, servers, storage and networking for miners building AI and high-performance computing systems.

French law enforcement agencies have been investigating wrench attacks and found that some of the alleged offenders were involved in multiple incidents
GBP/USD is showing positive signs above 1.3500 and 1.3525. EUR/GBP declined and is now consolidating losses below 0.8700.
Important Takeaways for GBP/USD and EUR/GBP Analysis Today
· The British Pound started a fresh increase above 1.3500 to enter a positive zone.
· There was a break above a key bearish trend line with resistance at 1.3510 on the hourly chart of GBP/USD at FXOpen.
· EUR/GBP is trading in a bearish zone below the 0.8685 pivot level.
· There is a connecting bearish trend line forming with resistance near 0.8665 on the hourly chart at FXOpen.
GBP/USD Technical Analysis
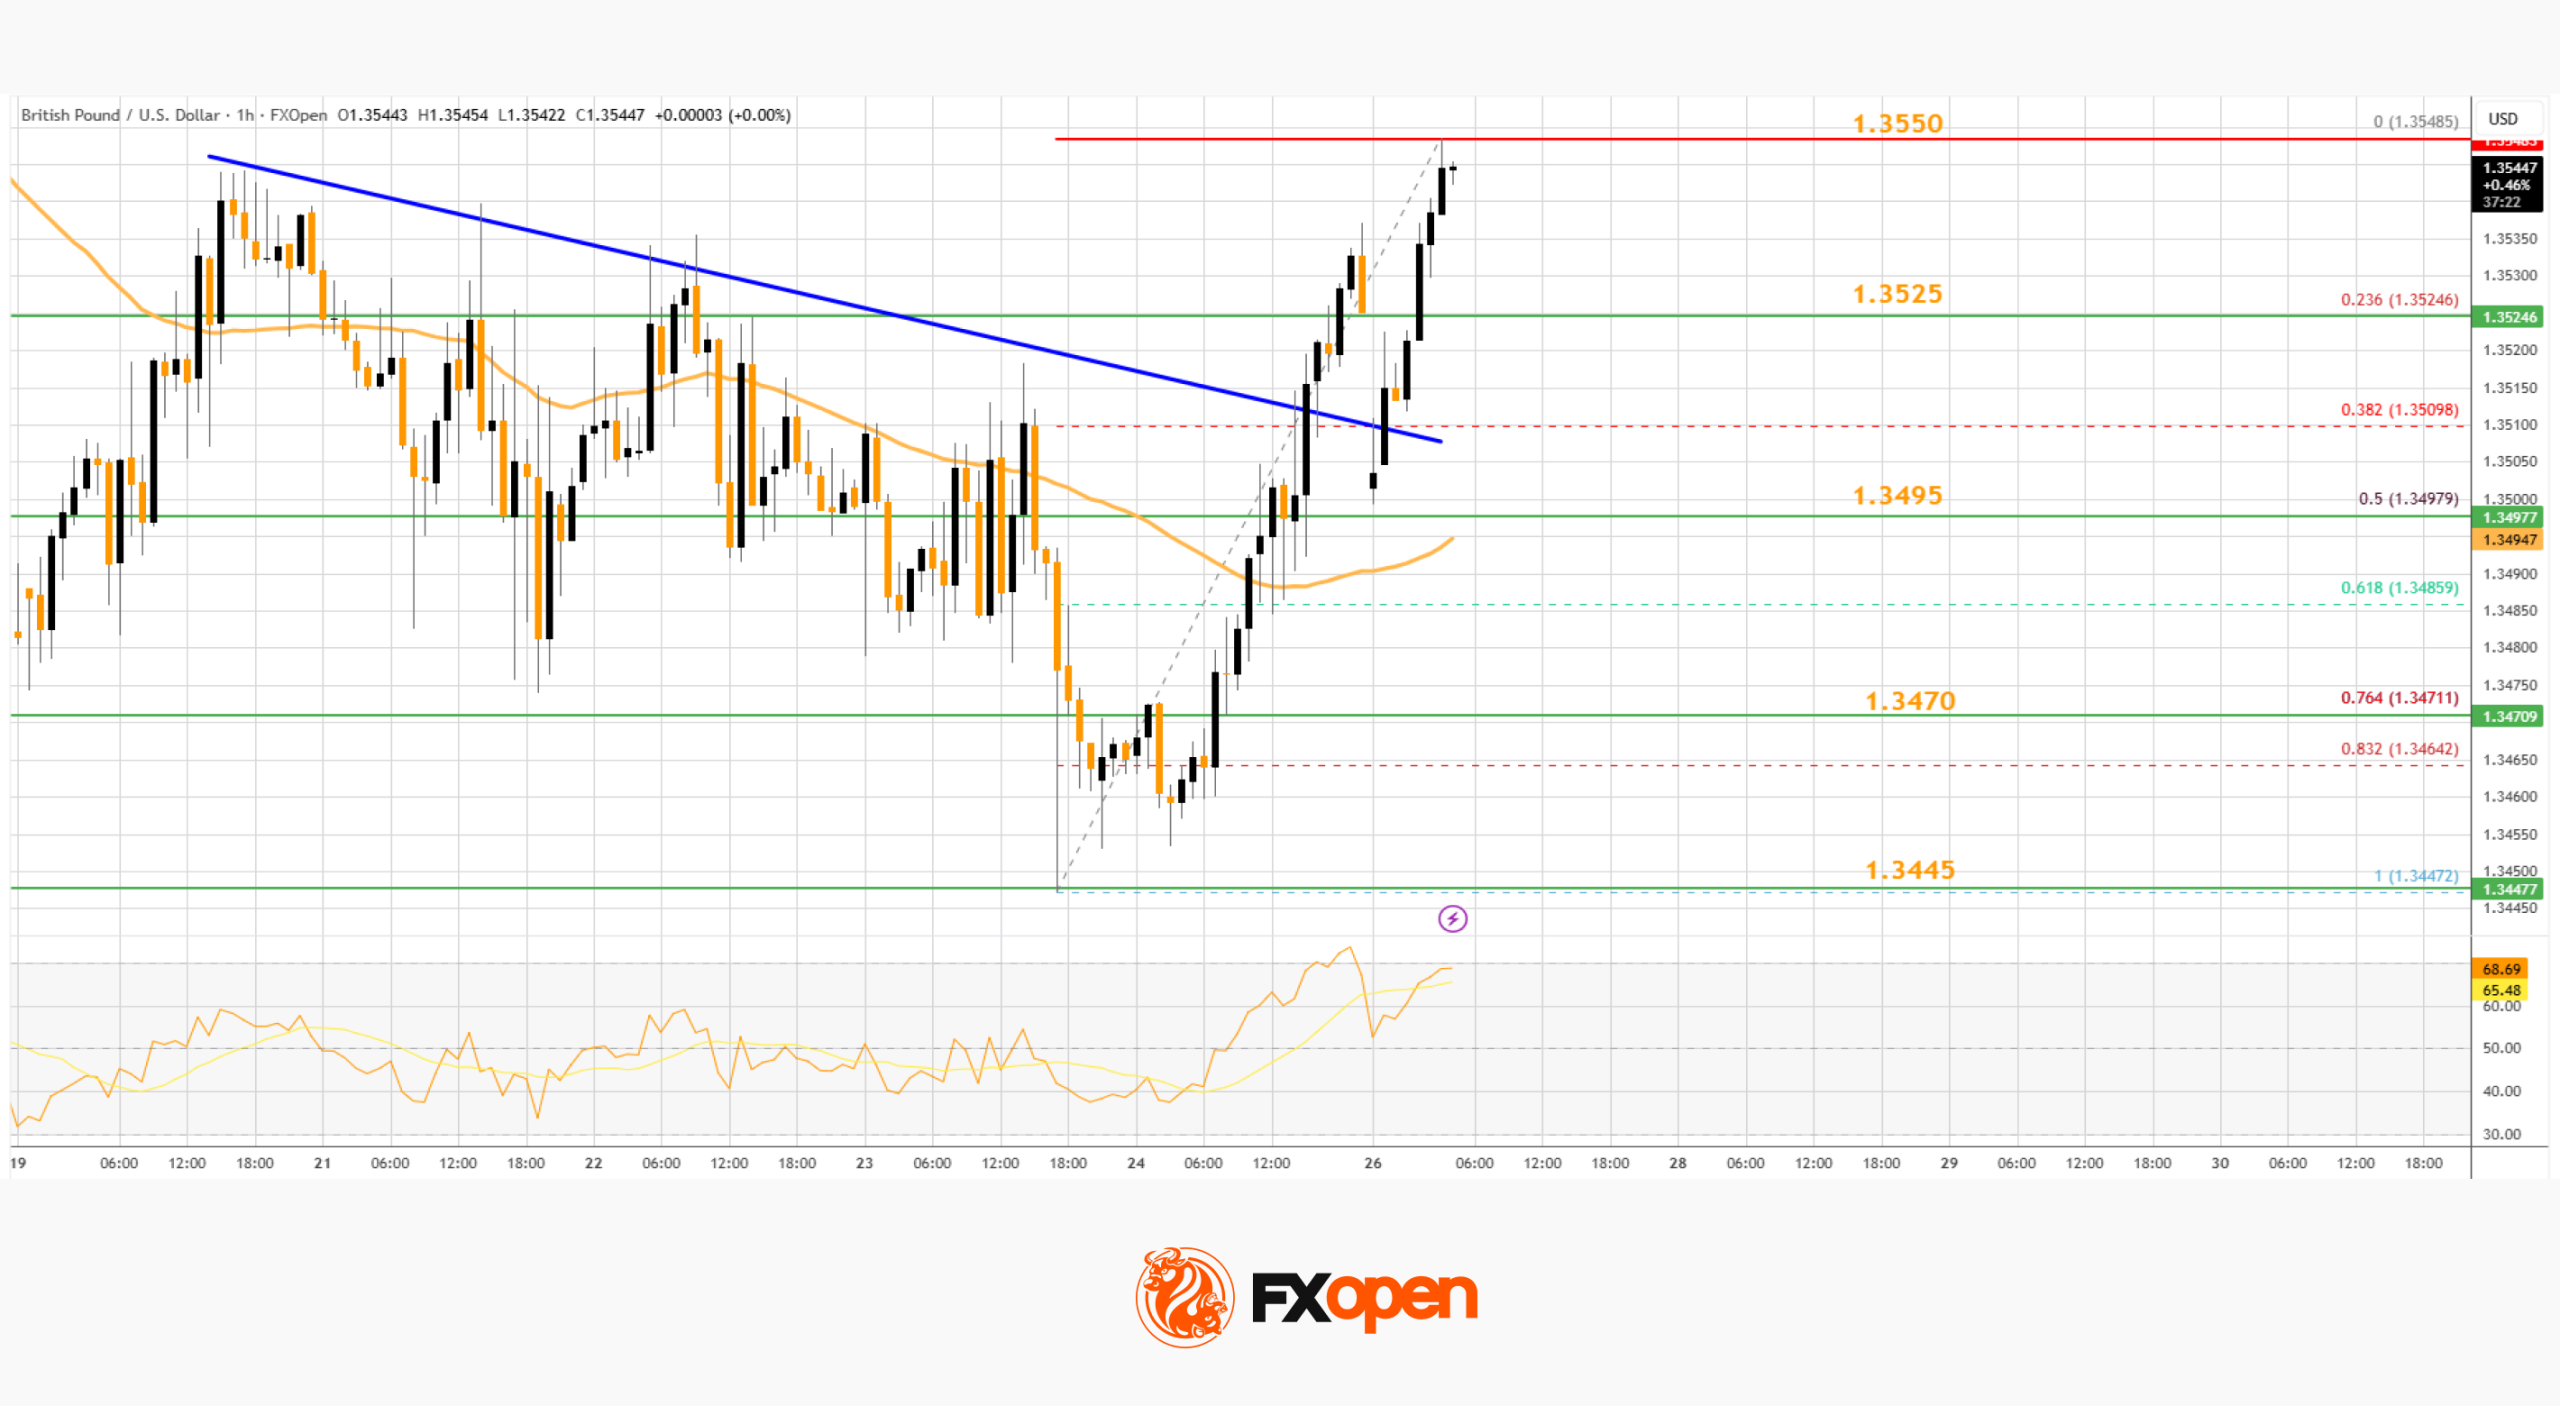
On the hourly chart of GBP/USD at FXOpen, the pair remained well-bid above 1.3450. The British Pound started a decent increase above 1.3470 against the US Dollar.
The bulls were able to push the pair above the 50-hour simple moving average and 1.3500. The pair even climbed above a key bearish trend line with resistance at 1.3510. A high was formed at 1.3548, and the pair is now consolidating gains above the 23.6% Fib retracement level of the upward move from the 1.3447 swing low to the 1.3548 high.

On the upside, the GBP/USD chart indicates that the pair is facing resistance near 1.3550. The next hurdle for the bulls could be 1.3565. A close above 1.3565 could open the doors for a move toward 1.3600. Any more gains might send GBP/USD toward 1.3660.
On the downside, the bulls might remain active near 1.3525. If there is a downside break below 1.3525, the pair could accelerate lower. The first major support is at 1.3495 and the 50% Fib retracement, below which the pair could test 1.3470.
The next key area for the bulls could be 1.3445, below which the pair could test 1.3400. Any more losses could lead the pair toward 1.3350.
EUR/GBP Technical Analysis
On the hourly chart of EUR/GBP at FXOpen, the pair started a steady decline from well above 0.8720. The Euro traded below 0.8695 against the British Pound.
The EUR/GBP chart suggests that the pair even declined below 0.8670 and the 50-hour simple moving average. A low was formed at 0.8650, and the pair is now consolidating losses. There was a move above 0.8665 and toward the 23.6% Fib retracement level of the downward move from the 0.8720 swing high to the 0.8650 low.
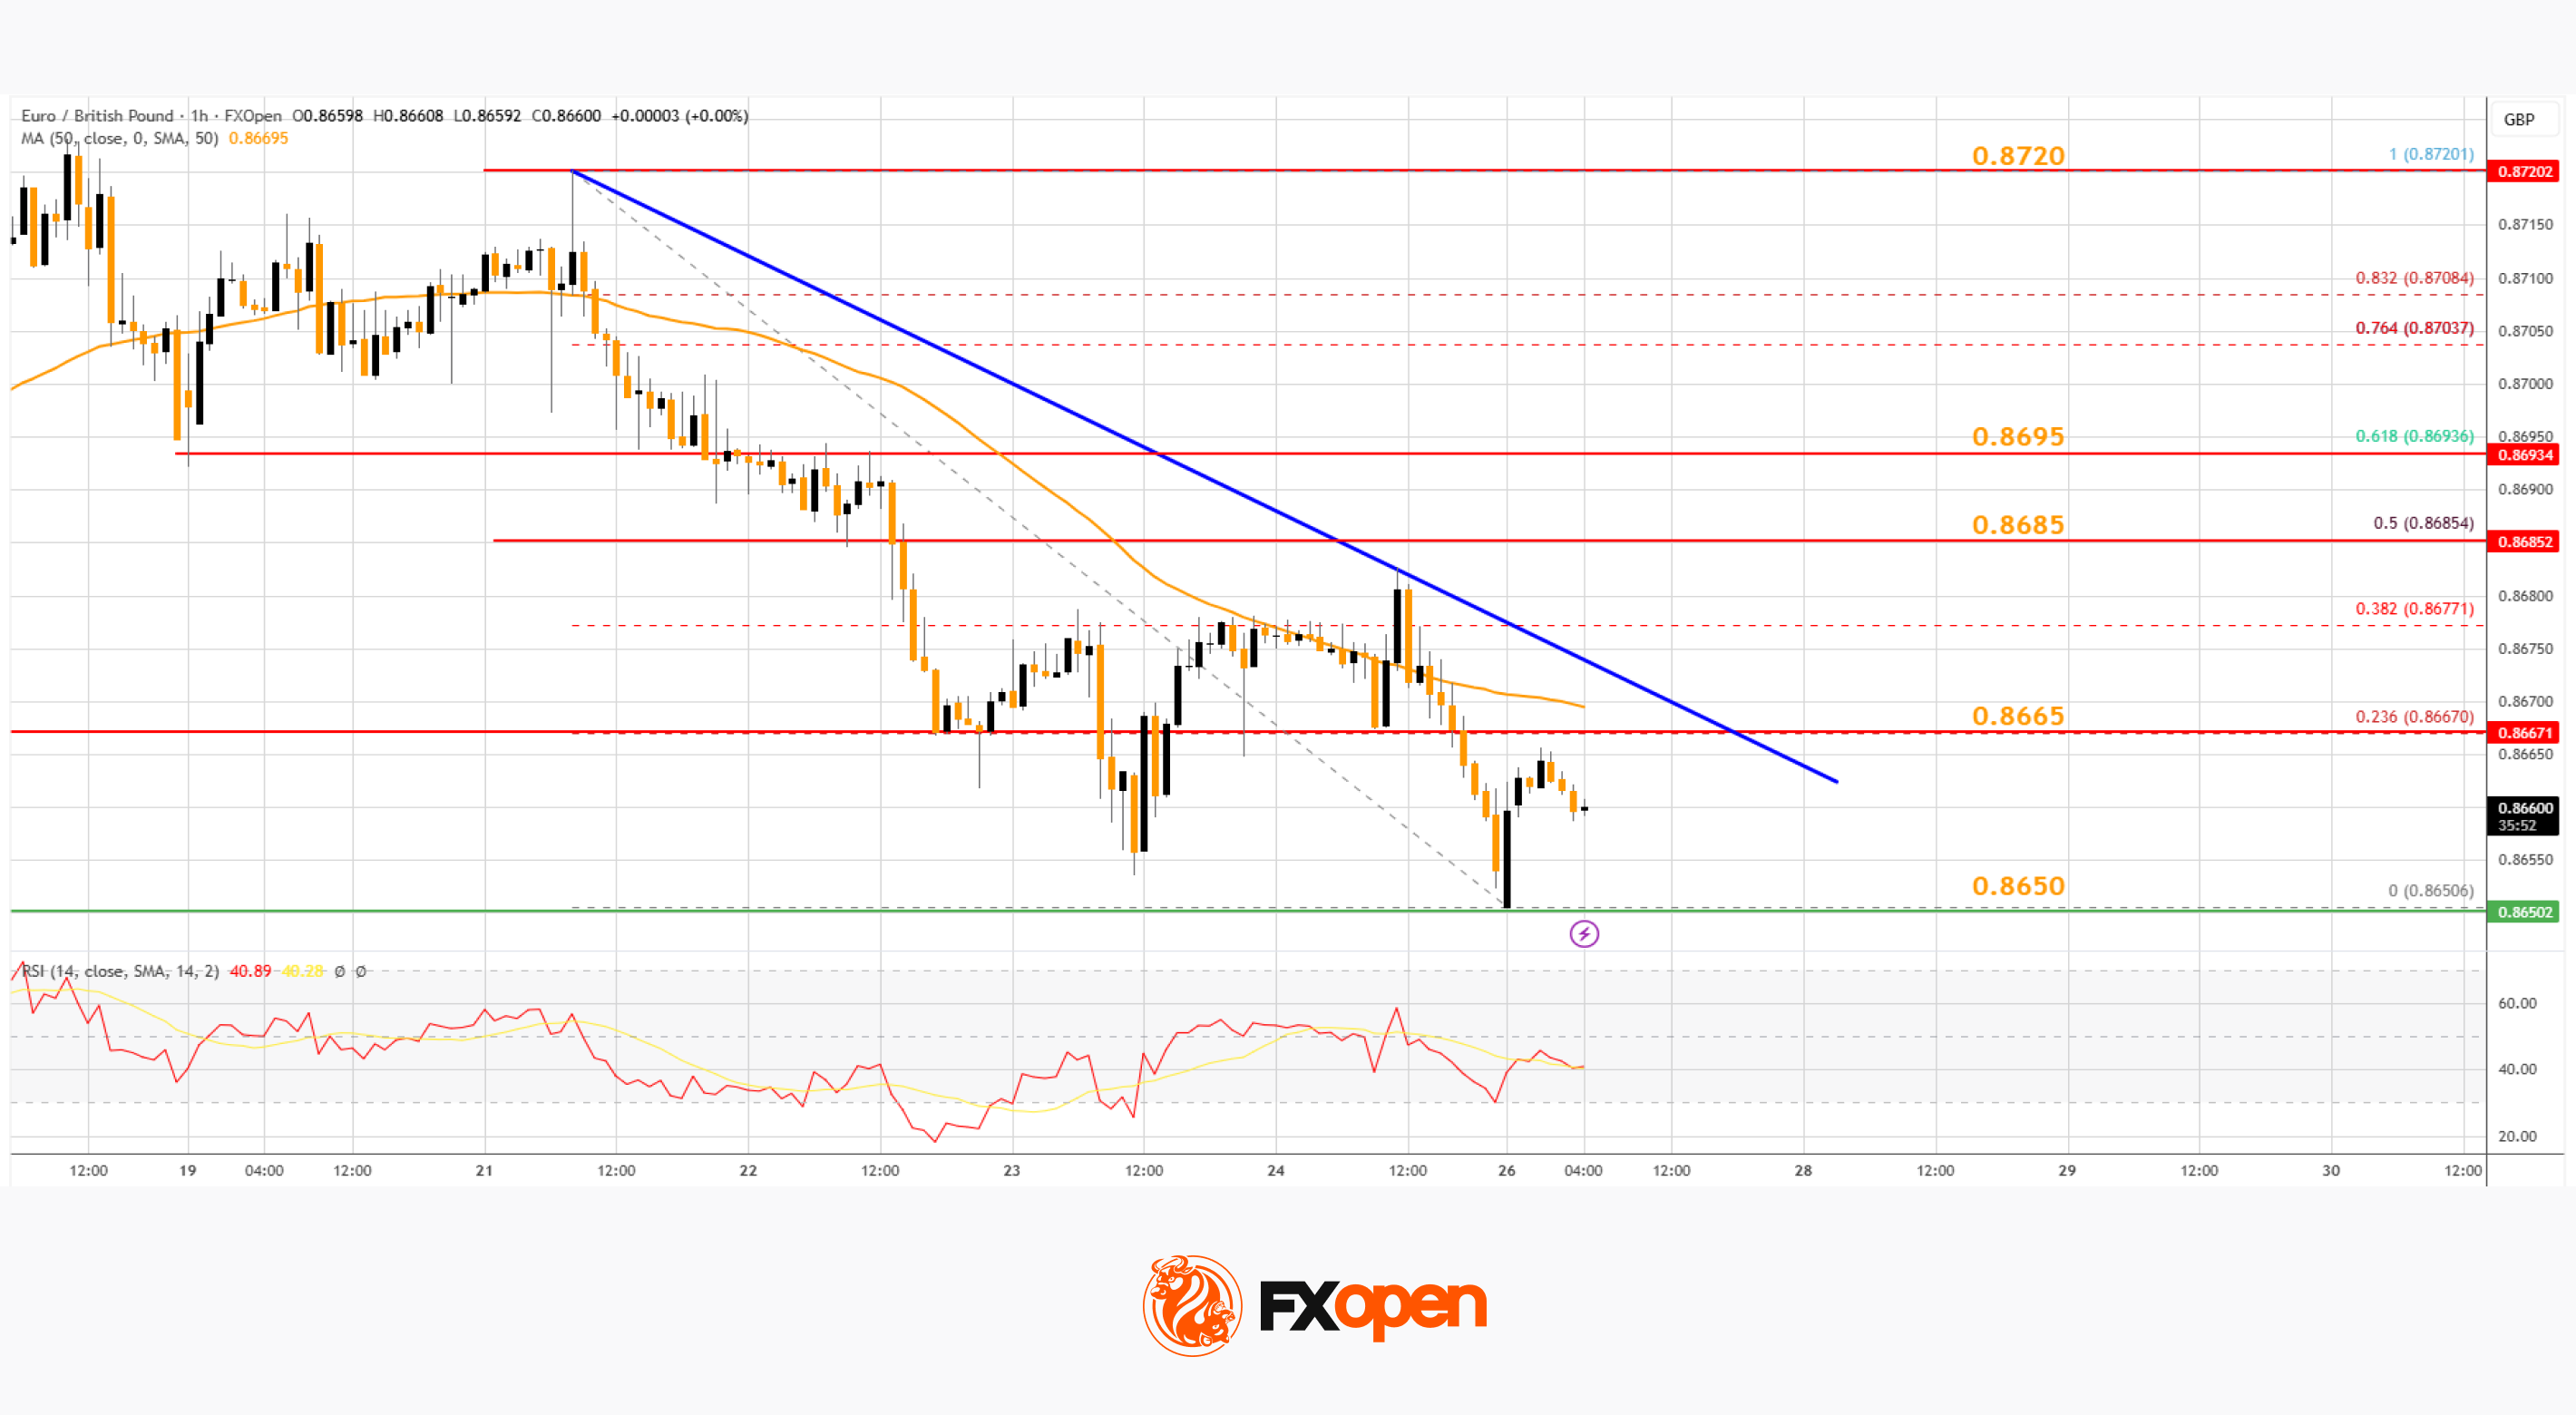
The pair is now facing resistance near a connecting bearish trend line at 0.8665. The next major barrier for the bulls could be 0.8685 and the 50% Fib retracement.
A close above 0.8685 might accelerate gains. In the stated case, the bulls may perhaps aim for a test of 0.8695. Any more gains might send the pair toward the 0.8720 pivot.
Immediate support sits near 0.8650. The first key zone sits at 0.8620. A downside break below 0.8620 might call for more downsides. In the stated case, the pair could drop toward 0.8565.
Trade over 50 forex markets 24 hours a day with FXOpen. Take advantage of low commissions, deep liquidity, and spreads from 0.0 pips (additional fees may apply). Open your FXOpen account now or learn more about trading forex with FXOpen.
This article represents the opinion of the Companies operating under the FXOpen brand only. It is not to be construed as an offer, solicitation, or recommendation with respect to products and services provided by the Companies operating under the FXOpen brand, nor is it to be considered financial advice.
Institutional prediction around Ethereum price is quietly building even as Arthur Hayes fires bearish salvos at its long-term market position. Bitcoin, meanwhile, drops under $78,000, pressing resistance that has capped every rally since November.
Hayes, BitMEX founder and one of crypto’s most-watched macro voices, argued this week that AI-focused tokens like Render and Fetch could displace Ethereum from the top three by 2030, citing AI crypto’s 250% gain in H1 2024 against ETH’s comparatively modest 40%.
He explicitly ruled out Solana as the flipper. The comments ricocheted across Crypto X within hours. But Hayes simultaneously holds a $10,000–$20,000 ETH price target by the next U.S. presidential election. Bearish on rank, bullish on price.
In the background, oil near $97 per barrel, gold above $4,700, and a fragile Iran ceasefire keep macro risk elevated. Bitcoin is testing the $78,000–$80,000 zone where large sell orders are clustered on order books.
Discover: The best pre-launch token sales
Ethereum Price Prediction: $2,400 Still Acts as Heavy Resistance Since Forever
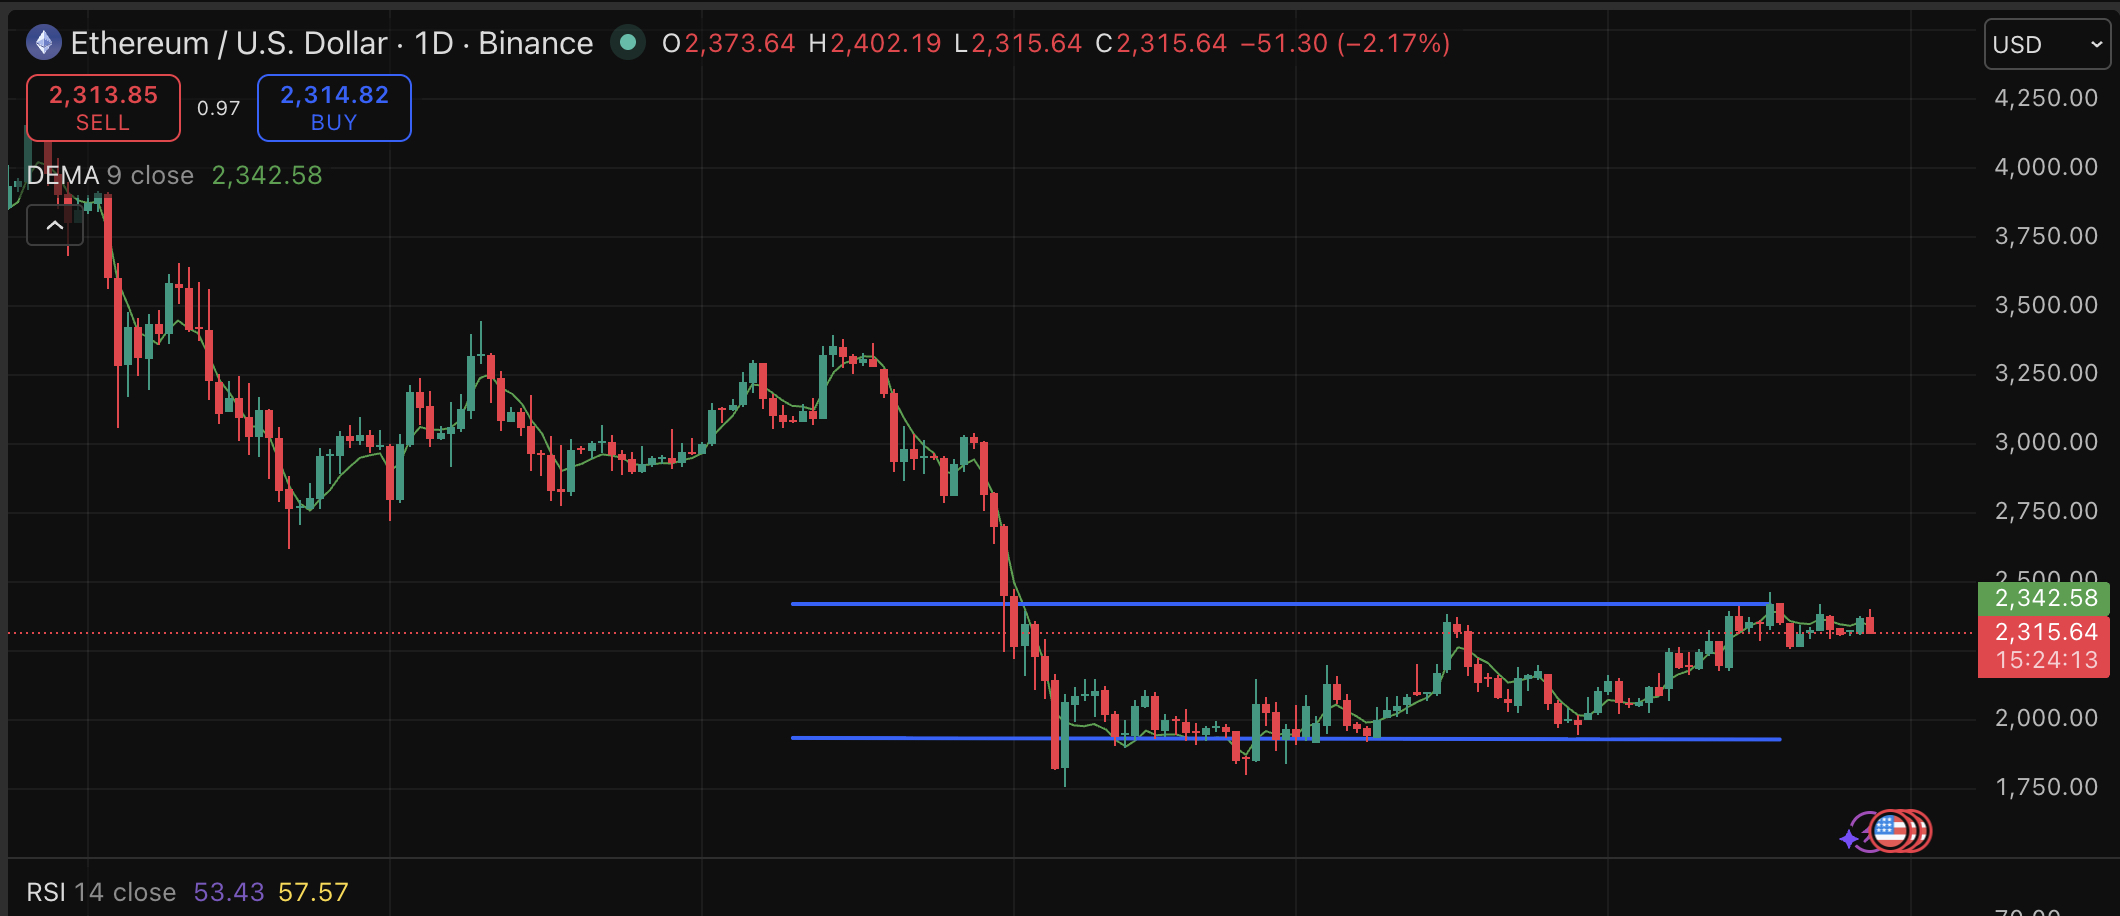
ETH has been locked in a $2,100–$2,400 corridor since February, with $2,100 acting as hard support and $2,400 as the cap that keeps rejecting breakout attempts. A recent 8% relief rally stalled just under that ceiling.
The bull case is tied to two hard catalysts. The Glamsterdam upgrade is imminent, adding scalability that could meaningfully tighten circulating supply. Institutional accumulation is accelerating; firms, including BitMine, are adding ETH exposure at current levels. Standard Chartered has a $15,000 target by 2027, while Hayes’ floor sits at $10,000.

ETH likely holds $2,100, consolidates through Q3, and attempts a clean breakout above $2,400 once Bitcoin resolves its own resistance test. ETF inflows remain a structural tailwind that didn’t exist in the previous cycle.
But a weekly close below $2,100 could reopen $1,800 and likely trigger altcoin liquidations. If Bitcoin fails at $80,000 and rolls over, ETH would not be insulated.
Discover: The best crypto to diversify your portfolio with
Maxi Doge Presale Approaches $5M as ETH Whales Hunt Early-Stage Upside
Here’s the uncomfortable truth for late ETH buyers: even a clean breakout to $3,000 from current levels represents roughly 26% upside. That’s a solid trade, but not a life-changing one. Those looking for asymmetric exposure in an Ethereum-correlated environment are rotating toward early-stage projects on the same chain, where the math still looks different.
Maxi Doge ($MAXI) is one presale capturing that attention. Built on Ethereum as an ERC-20 token, it combines meme-driven community energy with structured trading mechanics like holder-only competitions with leaderboard rewards, a Maxi Fund treasury for liquidity and partnerships, and a 1000x leverage trading culture distilled into what the project calls a “240-lb canine juggernaut.”
The tagline is blunt: never skip leg day, never skip a pump.
Current presale price is $0.0002815, with a total raised of $4.7 million, with more than 60% staking APY available to participants. https://x.com/MaxiDoge_/status/2048084804206252332?s=20The presale is approaching the $5M milestone, compressing the early-entry window.
Research Maxi Doge before the presale closes.
The post Ethereum Price Prediction: Hayes Bearish, But Data Backs ETH to Outlast BTC appeared first on Cryptonews.

A new study from London Business School and Yale University challenges the notion that prediction markets reflect crowd wisdom. Focusing on Polymarket, the researchers argue that a small cadre of well-informed traders drives most price discovery on these platforms.
According to the paper, roughly 3.5% of accounts generate the bulk of price discovery on Polymarket. The remaining majority trades actively but contributes little information; their losses tend to accrue to the informed minority. The study, authored by Roberto Gomez-Cram, Yunhan Guo, Theis Ingerslev Jensen, and Howard Kung and revised on April 25, relies on a sign-randomization approach that re-samples each account’s past trades 10,000 times to simulate profit and loss.
“Prediction market accuracy thus reflects the wisdom of an informed minority, not the wisdom of the crowd.”
Polymarket and other prediction markets have surged in crypto circles, with industry data suggesting monthly trading volumes commonly around $15 billion across markets spanning sports, elections, corporate results, and cultural events.
However, the rise of these platforms has drawn regulatory scrutiny amid concerns that insider trading could exploit confidential information. The authors note that prediction markets operate with less oversight than traditional securities markets, in part because many users are pseudonymous and contracts are narrowly defined around specific events.
“These features make prediction markets an attractive venue for trading on private information,” the authors write, highlighting a salient tension between market efficiency and potential misuse.
The “informed minority” and outsized profits
The study identifies the informed minority as comprising market makers and “skilled takers,” together capturing over 30% of total gains on prediction markets. On average, market-maker accounts earned about $11,830 per account in the period studied.
By contrast, roughly 69% of profit-takers fall into a category the authors call the “lucky winners,” who account for about 29% of all accounts. The remaining participants are the “unlucky losers,” who absorb the aggregate losses.
These dynamics echo earlier research suggesting that a small subset of traders can dominate profitability on Polymarket. A separate analysis published earlier this month by crypto analyst Andrey Sergeenkov estimated that just 0.015% of Polymarket traders achieve profits large and consistent enough to contemplate leaving their day jobs.
The broader takeaway is clear: while prediction markets can show high activity and liquidity, the actual informational value often hinges on a narrow group of participants rather than a democratic crowd signal.
Regulatory spotlight and market design implications
The authors’ findings arrive at a moment of intensified regulatory attention toward crypto prediction markets. Insiders trading on platforms like Polymarket and Kalshi has become a focal point for policymakers, who are weighing how to balance innovation with safeguards against confidential-information trading. The study notes that pseudonymity and narrowly defined contracts create structural vulnerabilities that could complicate enforcement and oversight.
For platform operators, the results raise practical questions about design choices, such as how to encourage broader participation without diluting the precision of price signals, and what kinds of disclosure or verification might enhance market integrity without eroding user trust.
Investors and users, meanwhile, should consider that a large portion of trading volume may reflect participation by less information-rich actors. As price discovery appears concentrated within a minority, capital decisions tied to these markets could be influenced more by information asymmetries than by the crowd-sourced wisdom some proponents hoped to see.
What to watch next
As regulators scrutinize insider-trading risk and as exchanges iterate on their market designs, readers should monitor how policy, enforcement, and platform innovations shape the accessibility and integrity of prediction markets. The core question remains whether safeguards can widen the circle of informed participation without dampening the very signals that keep these markets functional.
Source data and the study’s methodology are documented in the authors’ paper, which is available for reference as a revision published on April 25. For broader context on market volumes, industry data place monthly prediction-market activity around the $15 billion mark across the sector.
Crypto World
Cardano Is Coiling Beneath a Key Trendline as Short Positions Rise: Is a Breakdown or Breakout Coming?

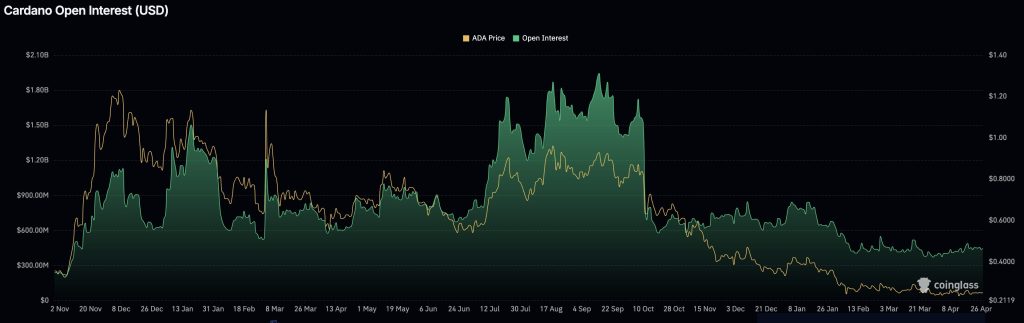
Cardano price is pressing against a wall, with the ADA price trading between $0.24 and $0.25 as of April 27, with price coiling beneath a descending trendline resistance near $0.28, a level that could define the next significant directional move for the asset.
Whether this consolidation resolves as a breakout or another rejection is the question every ADA holder is sitting with right now.
Derivatives data shows stable Open Interest alongside rising short positions, a combination that typically signals bearish conviction among active traders.
Broader altcoin markets remain cautious, with Bitcoin’s own near-term price path continuing to set the tone for risk appetite across the sector. ADA’s resolution of this trendline test will carry implications well beyond the Cardano ecosystem.
Can Cardano Price Break $0.28 Resistance This Week?
ADA is sitting in a neutral zone, slightly leaning bearish but not breaking down, with RSI just under 50 and price stuck below the 50-day average, which is acting as short-term resistance.
The structure is tight. Support sits around $0.241–$0.244, and that is the level holding things together. Resistance is right above, around $0.254 up to $0.28, which is the real barrier that needs to be broken to shift momentum.
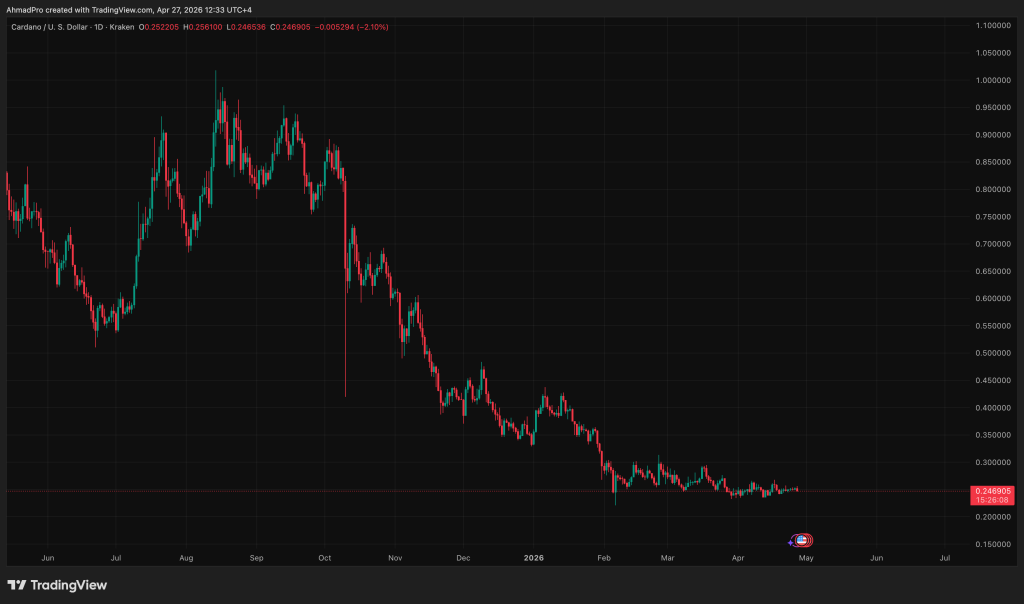
If ADA can push above $0.28 with volume, thatis when the trend flips and opens a move toward $0.30–$0.32.
More realistically, though, this just looks like a sideways chop, with the price hovering around $0.25 while the market waits for direction.
The risk is if $0.241 breaks, because that is the floor, and once it goes, selling can accelerate quickly.
So this is a patience setup, not a conviction trade, and the next move depends entirely on which side breaks first.
Can This New Bitcoin Layer 2 Project Outperform Cardano?
ADA is doing what late-cycle alts often do: tight range, low volatility, and very limited upside per move, so even a clean setup does not translate into meaningful returns in the short term.
That is where attention starts shifting to earlier-stage plays, where the gap between current price and potential value is wider.
Bitcoin Hyper is trying to sit in that space, building a Layer 2 on Bitcoin with SVM integration to bring faster execution and smart contracts into the Bitcoin ecosystem. The angle is straightforward: fix Bitcoin’s limitations while keeping its security.
The presale is already showing strong traction, with over $32.5M raised and pricing at around $0.0136792, suggesting steady accumulation rather than a one-off spike. The infrastructure thesis is interesting, especially with developer activity clustering around faster chains.
But it is still early, and that comes with the usual risks, execution, liquidity at launch, and how the market reacts once tokens unlock.
So the contrast is clear, ADA offers stability with limited short-term upside, while something like Bitcoin Hyper offers higher potential, but with much higher uncertainty.
The post Cardano Is Coiling Beneath a Key Trendline as Short Positions Rise: Is a Breakdown or Breakout Coming? appeared first on Cryptonews.

XRP price has been consolidating over the past week, holding the $1.40 support despite market volatility. But now a potential bearish MACD crossover threatens a breakdown below the major support level.
Summary
- XRP price trades in a tight $1.40–$1.46 range after a 17% rally, with buyers failing to reclaim the $1.45 resistance level.
- On-chain and derivatives data point to weakening momentum, with falling network growth, reduced whale activity, and a long/short ratio below 1.
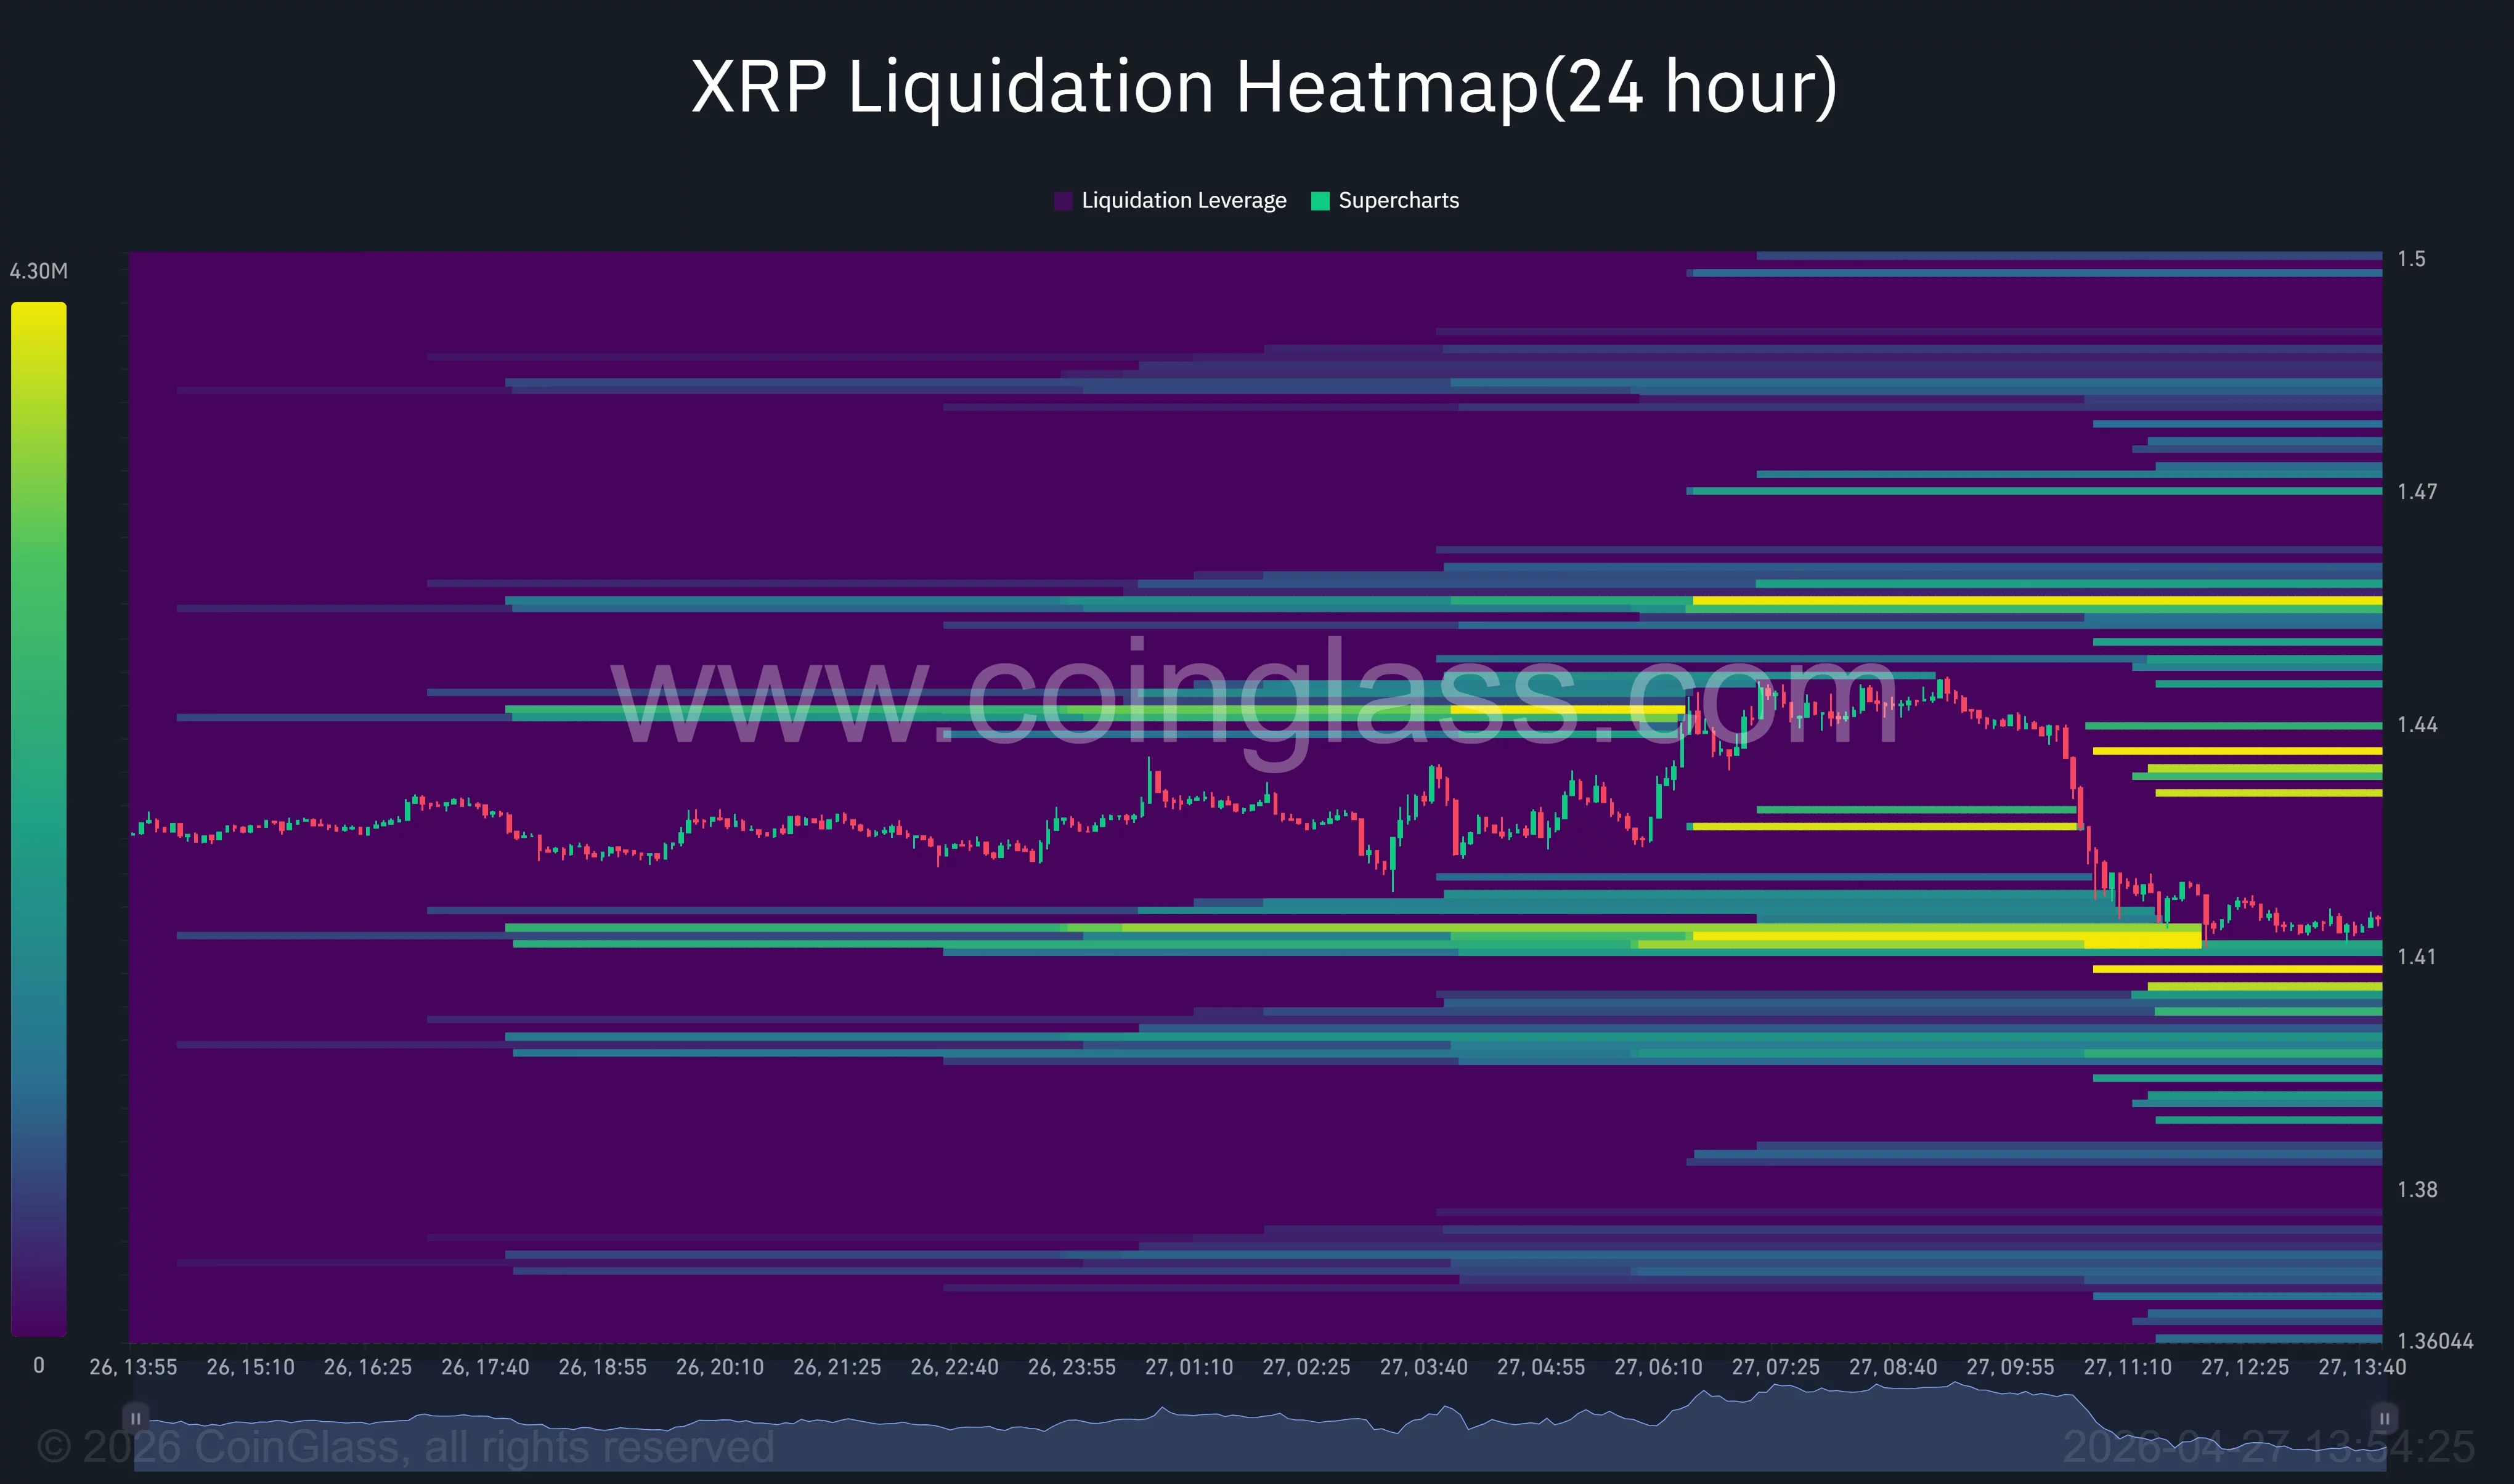
- A potential bearish MACD crossover and a liquidation cluster at $1.40 signal risk of a breakdown toward the $1.30 support level.
According to data from crypto.news, XRP (XRP) price rallied 17% to a monthly high of $1.50 in April before entering consolidation within the $1.40-$1.46 range for the past week as investors remained cautious amid no progress in peace talks between the U.S. and Iran, whose war has been impacting the Strait of Hormuz region, a key maritime waterway for global oil and energy flows.
Unlike Bitcoin (BTC), which has been in an uptrend since the beginning of April, XRP has so far failed to sustain its momentum, with buyers unable to push the asset past the $1.45 resistance zone.
Now, on-chain data suggest that the token is positioned to lose the $1.40 support soon, which can be attributed to a significant drop in network growth and declining whale accumulation. CoinGlass data show that a massive liquidation cluster has formed at $1.40, which acts as a price magnet for market makers seeking liquidity.
Meanwhile, charts also indicate that the token could be entering a distribution phase as trading volume thins out. On the XRP daily chart, the MACD lines are close to confirming a bearish crossover, which often signals strong downside over the following sessions.
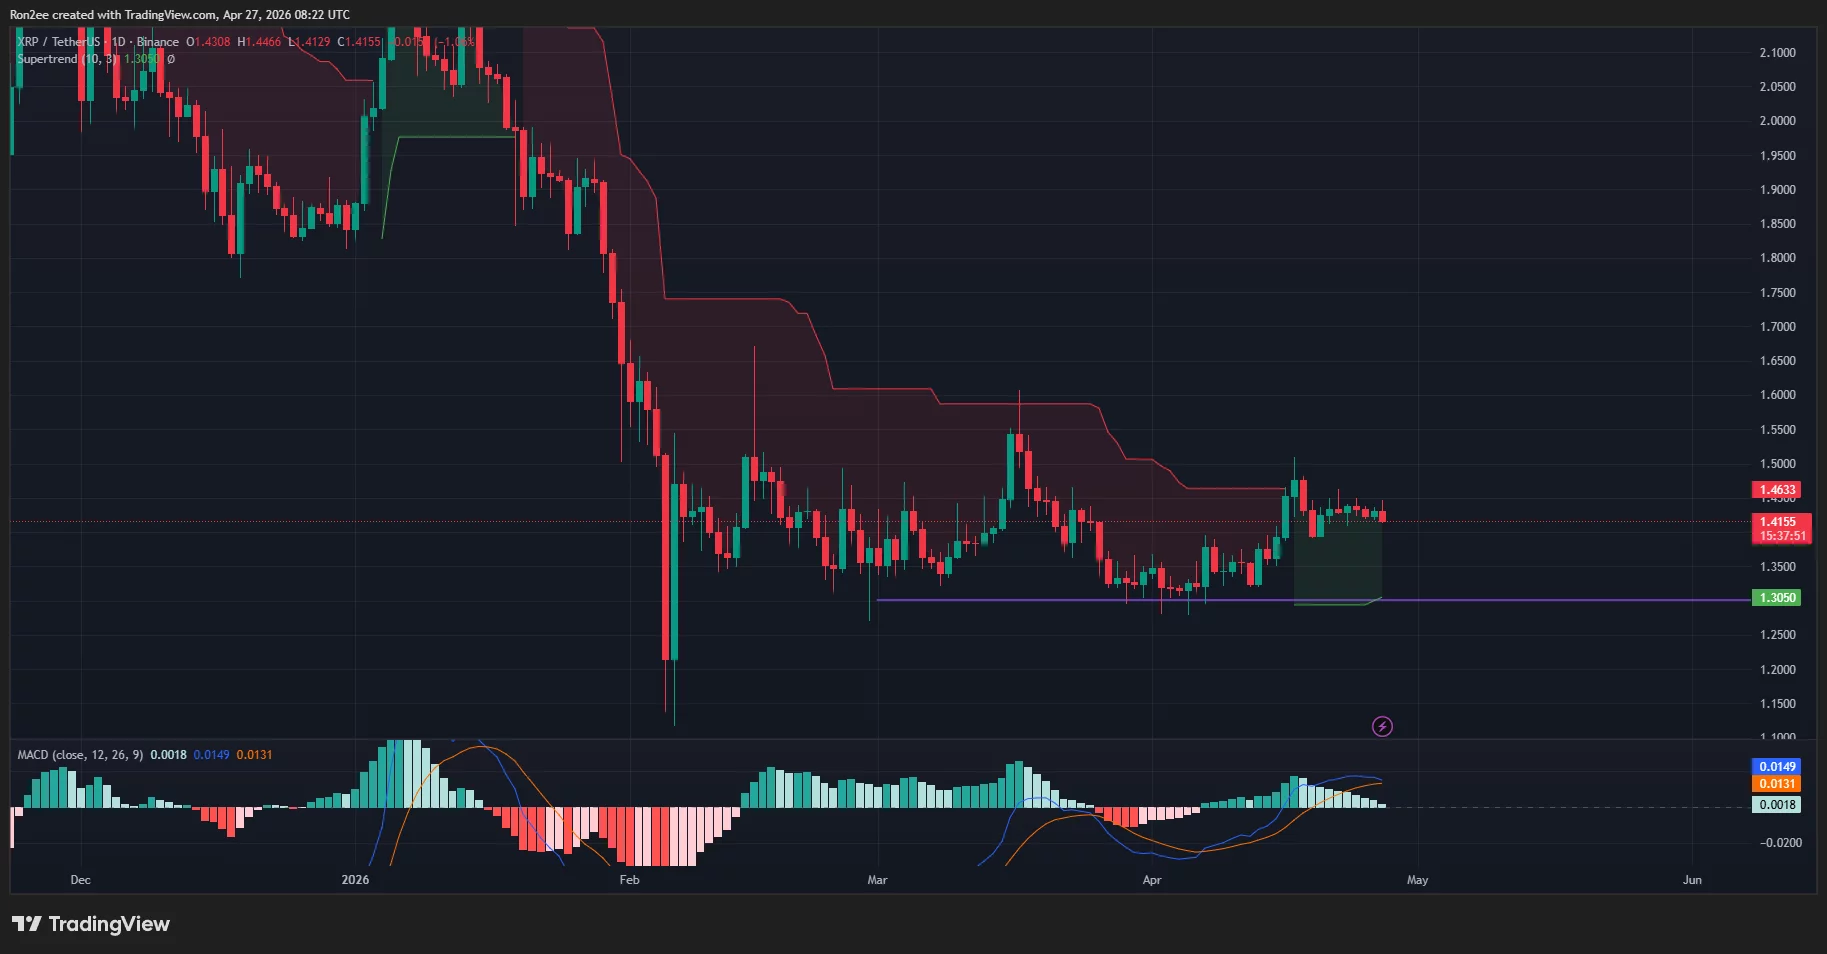
At the same time, the Supertrend indicator has flipped green, a sign that the local trend is still technically bullish, but this conflicting signal suggests a high-stakes battle between bulls and bears.
Hence, once the MACD crossover is confirmed, XRP price would drop to $1.30, the next major psychological support level, and potentially lower if broader market sentiment continues to sour.
Derivative traders have already been positioning for this shift as CoinGlass data show that the long/short ratio of XRP futures has fallen below 1, a telltale sign that more traders are now betting on further price declines.
Disclosure: This article does not represent investment advice. The content and materials featured on this page are for educational purposes only.

Key Takeaways
- Michael Burry revealed a fresh Microsoft position through his Cassandra Unchained Substack on April 23
- The purchase followed a software sector decline triggered by disappointing IBM and ServiceNow earnings guidance
- Burry dismisses concerns about AI disruption undermining traditional software companies
- Microsoft shares have declined approximately 25% from July 2025 highs and roughly 13% year-to-date
- Burry simultaneously increased stakes in Adobe, Autodesk, Veeva Systems, MSCI, and PayPal
Michael Burry has established a long position in Microsoft (MSFT), incorporating the tech giant into his expanding portfolio of discounted software investments.
The investment was made public through Burry’s Cassandra Unchained Substack newsletter on April 23. While the precise stake size remains undisclosed, Burry confirmed he has “gone long on Microsoft” following what he described as “forensic” analysis of the company.
The entry point was strategic. Software equities experienced significant pressure that day following weak forward guidance from IBM and ServiceNow. Market participants interpreted the results as evidence that artificial intelligence tools are cannibalizing traditional enterprise software revenue.
Burry interpreted the situation through a different lens. He characterized the selloff as excessive and identified opportunities in what he termed “bombed out software and payment stocks.” Notably, he maintained all existing software holdings throughout the decline.
The approach reflects Burry’s contrarian investment philosophy — accumulating positions when market sentiment turns negative.
The Microsoft Investment Case
Microsoft has experienced significant valuation compression. Shares have retreated approximately 25% from the July 2025 all-time high and declined roughly 13% on a year-to-date basis. Despite an 18% rebound from recent lows preceding Burry’s announcement, the stock remains substantially below peak levels.
The current forward price-to-earnings ratio stands near 26x, representing a considerable discount to the five-year median P/E of 34x, per GuruFocus data.
For Burry, this valuation disconnect represents an attractive entry opportunity. His investment thesis centers on acquiring a proven cash-generating business trading below historical multiples, rather than speculating on AI narrative.
Microsoft’s commercial cloud operations — encompassing Azure, Office 365, and Dynamics — operate on subscription models generating predictable recurring revenue. Azure ranks among only two true hyperscale cloud infrastructure platforms globally. The corporation produces tens of billions in annual free cash flow.
Burry’s perspective is direct: the underlying business fundamentals remain intact, while current pricing reflects emotional selling rather than deteriorating economics.
Expanded Software Sector Accumulation
The Microsoft investment forms part of a broader strategic initiative. Throughout recent weeks, Burry has systematically accumulated positions across multiple software companies.
He established new positions in Adobe (ADBE), Autodesk (ADSK), and Veeva Systems (VEEV). Additionally, he expanded existing holdings in MSCI and PayPal.
His investment rationale remains consistent across these positions — artificial intelligence disruption concerns have compressed valuations of high-quality software businesses to levels that undervalue their fundamental earnings capacity.
Institutional investors have predominantly moved in the opposite direction, reducing software exposure based on concerns that AI applications will erode traditional software economics. Burry’s Substack communications center on positioning contrary to this consensus view.
Sell-side analysts maintain constructive views on Microsoft aligned with Burry’s perspective. The stock holds a consensus Strong Buy rating from 37 analysts — including 34 Buy ratings and three Hold ratings. The mean price target of $581.61 suggests potential upside of approximately 56% from current trading levels.
Burry initiated his Microsoft stake on April 23, 2026, coinciding precisely with the software sector decline following IBM and ServiceNow’s guidance announcements.


DeFi Strategies That Actually Make Sense

‘Summer House’ Leak Mystery Ends With Shocking Reveal

Zack Polanski Snaps On ITV’s Good Morning Britain
Manchester United reach agreement with Casemiro over contract clause amid transfer speculation

US brings back mandatory military draft registration

Steven Gerrard disagrees with Gary Neville over ‘shock’ Chelsea and Arsenal claim | Football


-

 Politics7 days ago
Gary Stevenson delivers timely reminder to register to vote as deadline TODAY
-

 Fashion3 days ago
Weekend Open Thread – Corporette.com
-
 Crypto World2 days ago
Hyperliquid $HYPE Rally Builds Momentum as AI Sector Enters Prove-It Phase
-
Crypto World7 days ago
Bank of Hawai’i (BOH) Q1 2026: Net Income Drops to $57.4M as Net Interest Margin Expands
-

 Politics5 days ago
Making troops accountable for war crimes threatens US alliance, ex-SAS colonel warns
-

 Politics5 days ago
Disabled people challenge government SEND proposals over segregation concerns
-

 Business5 days ago
Rolls-Royce Voted UK’s Most Iconic Trade Mark as IPO Register Hits 150
-

 Business3 days ago
Patterson-UTI Energy, Inc. (PTEN) Q1 2026 Earnings Call Transcript
-

 Politics5 days ago
Zack Polanski responds to home secretary’s taser threat
-
 Crypto World6 days ago
Five Value Stocks with Recovery Potential in 2026: PayPal (PYPL), Nike (NKE), and More
-
 Sports21 hours ago
IPL 2026: Ruturaj Gaikwad registers slowest fifty of the season, enters all-time unwanted list | Cricket News
-
Politics5 days ago
Wings Over Scotland | How To Get Away With Crimes
-

 Politics5 days ago
Starmer handler McSweeney to be dragged from shadows by Foreign Affairs Committee
-

 Crypto World5 days ago
New York sues Coinbase, Gemini over prediction market offerings
-
Entertainment6 days ago
Sydney Sweeney cameo cut from “The Devil Wears Prada 2”, source explains why (exclusive)
-
 Business5 days ago
HCL Tech share price tank over 9% after weak Q4. JPMorgan, HSBC & 3 others cut target price
-

 Politics5 days ago
‘Iran is still a nuclear threat’
-

 Crypto World5 days ago
Crypto’s great hope in Senate’s Clarity Act still has a path to survive tight calendar
-

 Fashion6 days ago
Kilkenny Design New Beauty Arrivals for Spring 2026
-
 Sports4 days ago
Tim Bradley names the current best in the world: “Better than Inoue and Usyk”
You must be logged in to post a comment Login