
Crypto World
MIT Explains What Happens When the Trillion-Dollar AI Bubble Bursts

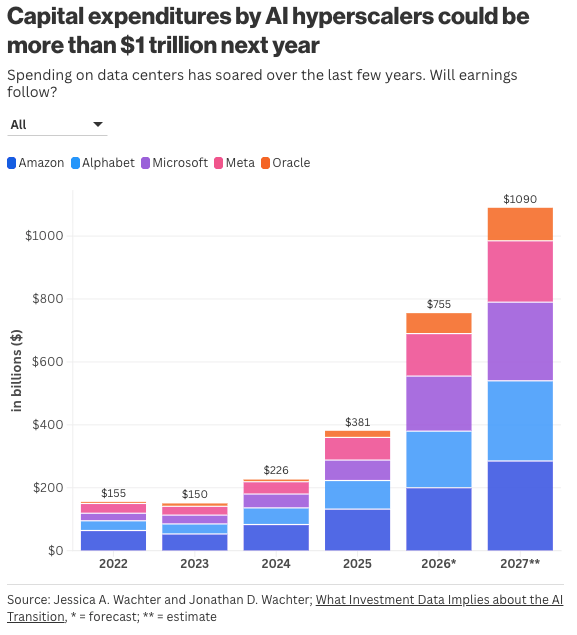
MIT Technology Review examines what happens when the AI bubble bursts, warning that hyperscalers may need to nearly triple productivity by 2030 just to break even on their trillion-dollar infrastructure bet.
Wharton finance professor Jessica Wachter and a coauthor built the estimate around confirmed hyperscaler outlays, projecting nearly $1.1 trillion in data center spending through 2027 across Alphabet, Microsoft, Amazon, Meta, and Oracle. The wager matters well beyond Silicon Valley.
Inside the AI Bubble’s Productivity Math
Wachter previously served as chief economist at the Securities and Exchange Commission (SEC). She found hyperscaler productivity must grow 2.7 times over to break even by 2030.

That calculation accounts for the cost of capital, a 15% return, and depreciation of the assets. Absent that growth, Wachter and her coauthor reach a stark conclusion.
“The current buildout will be the largest misallocation of capital in history.”
— Jessica Wachter, Wharton finance professor,
Alphabet posted a $5.9 billion free cash flow deficit last quarter, its first since going public in 2004. Investors increasingly view AI spending risks markets as the concentration grows.
Debt Spreads the Risk Beyond Big Tech
Morgan Stanley calculates hyperscalers will finance over half of their planned $2.9 trillion in data center spending through 2028. That money increasingly comes from external capital instead of cash reserves.
In Louisiana, Meta transferred an 80% stake in its Hyperion data center to private-credit firm Blue Owl Capital. The arrangement shows how complex hyperscaler financing has become.
Columbia Business School’s Stijn Van Nieuwerburgh warns that debt like this increasingly flows through pension funds and private credit vehicles. He says few people realize how deeply that exposure has spread into their own retirement and insurance savings.
Crypto strategist Arthur Hayes has floated a related scenario. He argues an AI credit bust could force the Federal Reserve to print money, pushing bitcoin (BTC) toward $1 million.
“A parlay bet by the capital markets and the economy.”
— Gary Gensler, former SEC chair and MIT Sloan School professor,
Gensler expects a retrenchment eventually, though its timing remains uncertain. Whether it arrives gradually or abruptly may determine how much of that trillion-dollar bet becomes a lasting loss.
The post MIT Explains What Happens When the Trillion-Dollar AI Bubble Bursts appeared first on BeInCrypto.

Crypto World
Hyperliquid (HYPE) targets $115 as tokenized asset trading gains momentum – CoinJournal

Key takeaways
- Hyperliquid’s HYPE token has gained 274% year-to-date, making it one of the strongest-performing large cryptocurrencies.
- CFTC Chairman Michael Selig said US regulators are preparing for tokenization, onchain finance, and continuous markets.
- Hyperliquid’s HIP-3 markets processed as much as $115 billion in monthly volume in June.
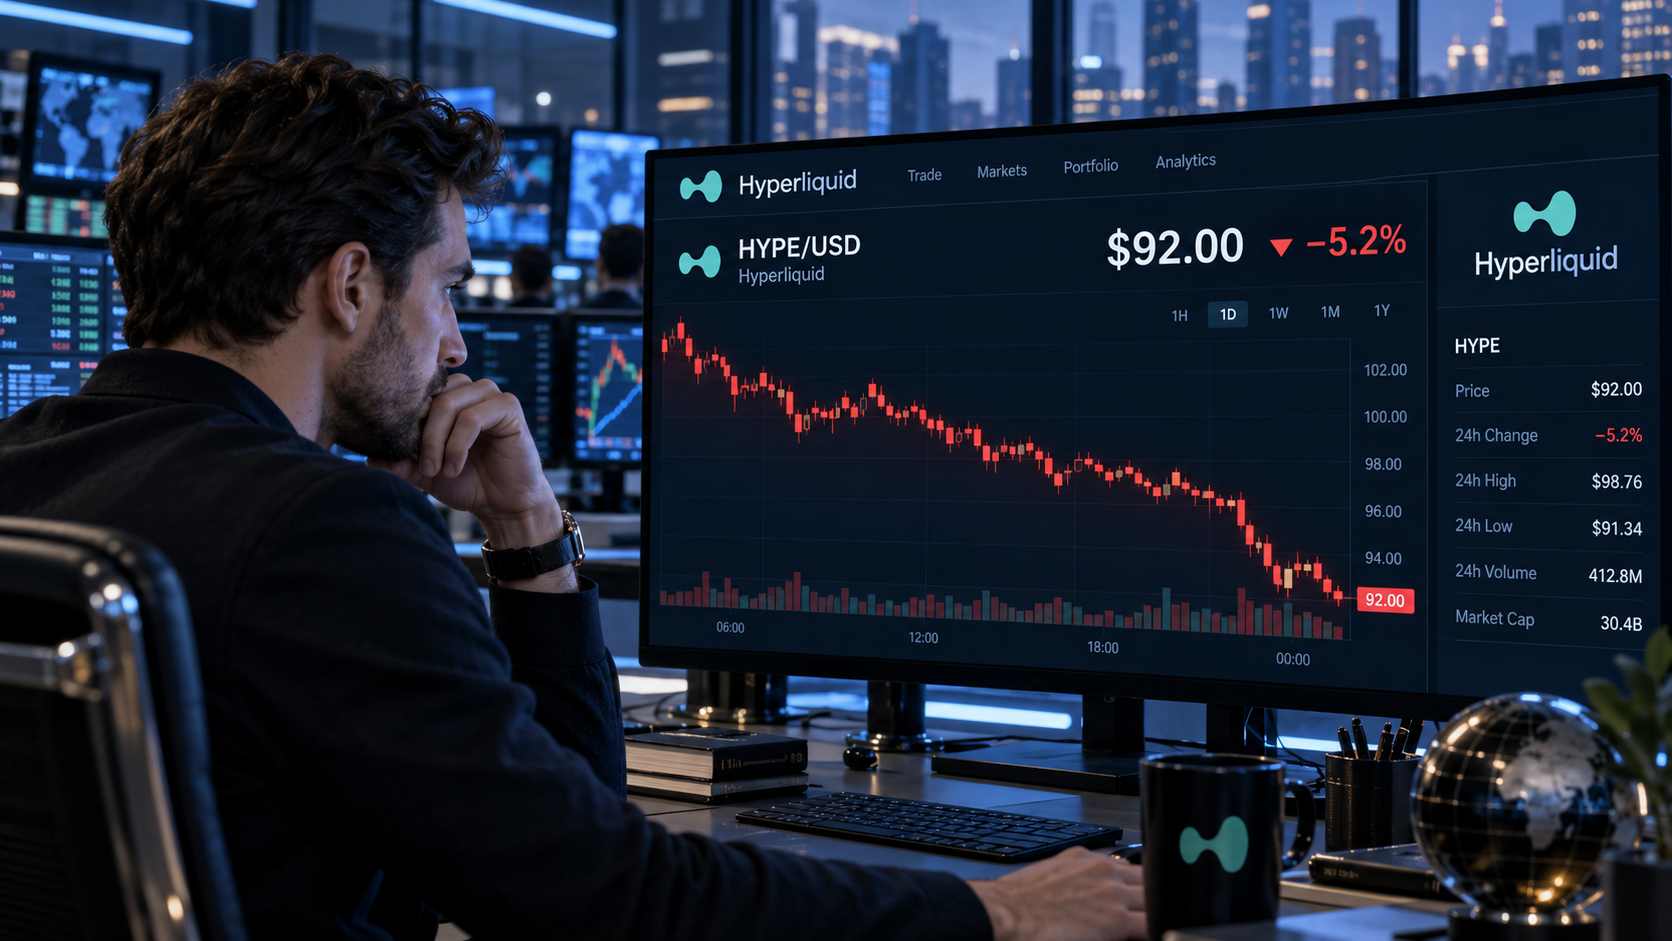
Hyperliquid (HYPE) has climbed 274% since the beginning of the year, outperforming other leading cryptocurrencies as demand for decentralized derivatives and tokenized real-world assets continues to grow.
The HYPE token recently approached the psychological $100 threshold, supported by expanding activity across Hyperliquid’s HIP-3 markets. Those markets allow builders to deploy permissionless perpetual futures, including contracts linked to real-world assets.
Comments from Commodity Futures Trading Commission Chairman Michael Selig have also strengthened expectations that tokenization and round-the-clock markets will become a larger part of the US financial system.
However, his remarks did not amount to regulatory approval for Hyperliquid or confirm that the platform will be allowed to serve US customers.
US regulators prepare for tokenized markets
Selig discussed the potential impact of tokenization during the 2026 Treasury Market Conference.
He said the CFTC is preparing financial markets for the arrival of large-scale tokenization, onchain finance and 24/7 trading. The chairman compared the shift with the transition from floor-based trading signals to electronic markets.
“Just as the transition from hand signals to electronic trading advanced our financial system, I believe tokenization can do the same for all asset classes,” Selig said.
He added that the regulator is committed to developing clear, principles-based rules intended to support innovation while protecting market integrity.
The comments reflect growing interest among US regulators in blockchain-based markets. The Securities and Exchange Commission recently introduced a temporary Innovation Exemption that allows eligible platforms to test certain tokenized securities products under defined conditions.
Tokenization converts ownership rights in assets such as stocks, bonds, or commodities into blockchain-based digital tokens. Supporters argue that the technology can provide faster settlement, fractional ownership, and continuous trading.
Regulatory support for tokenization could create opportunities for platforms offering real-world asset markets. Still, general statements supporting the technology do not guarantee market access for any specific decentralized protocol.
Hyperliquid would need to satisfy applicable derivatives, securities, and customer-protection requirements before directly offering regulated services in the United States.
HIP-3 volume reaches $115 Billion
HIP-3 has become an important source of growth for the Hyperliquid ecosystem. According to Hyperliquid Analytics, HIP-3 markets processed a recent monthly peak of approximately $115 billion in trading volume in June. Open interest continued rising afterward, reaching nearly $4 billion last month.
Open interest measures the value of outstanding derivatives positions that have not been closed. Its increase suggests traders are maintaining more exposure to HIP-3 markets rather than merely generating short-lived transaction volume.
The combination of high volume and rising open interest points to deeper participation. It may also create additional demand for HYPE because the token plays a central role in the broader Hyperliquid ecosystem.
CoinMarketCap data cited in the original analysis gives Hyperliquid an 18% share of the decentralized trading segment. That position makes it one of the largest venues competing for the expansion of onchain derivatives.
Real-world asset perpetuals have broadened the platform beyond cryptocurrency markets. Traders can use such contracts to gain price exposure without directly owning the referenced traditional asset.
These products can increase accessibility, but they also carry risks. Perpetual contracts use leverage, do not necessarily grant ownership rights, and may depend on external price feeds to track the underlying asset accurately.
Can HYPE reach $115?
HYPE recently moved close to the long-standing $100 price target, bringing a major psychological resistance level into focus.
Round-number thresholds often attract profit-taking because traders place sell orders around prominent levels. As a result, HYPE could experience a pullback after testing or briefly exceeding $100.
The former resistance area near $88 may provide the first meaningful support during such a correction. A successful retest would indicate that buyers remain willing to enter at higher levels and could establish a foundation for the next advance.
The medium-term upside target is approximately $115. The projection uses the length of HYPE’s previous rally to estimate the possible size of its next bullish leg.

A move from $100 to $115 would represent a further gain of 15%. Reaching that target would require the token to overcome profit-taking and maintain demand as its year-to-date increase approaches 300%.
If HYPE falls below $88, the immediate bullish structure would weaken, and the market could enter a longer consolidation. Rising open interest also introduces liquidation risk if highly leveraged traders crowd into long positions.
For now, HIP-3’s expanding volume, growing open interest, and broader momentum behind tokenized markets support the bullish outlook. The decisive near-term test is whether HYPE can convert $100 from resistance into support and extend its advance toward $115.
A coalition of US state lawmakers has asked the US Supreme Court to step into a jurisdictional fight involving Kalshi, a prediction markets platform, and New Jersey gaming regulators. In an amicus brief filed this week, the National Council of Legislators from Gaming States (NCLGS) argues that a ruling favoring Kalshi could severely restrict state authority over sports betting-like products offered through prediction markets.
The filing supports a petition by New Jersey’s Attorney General and gaming authorities seeking a writ of certiorari. According to the court documents, the petition—submitted on Sept. 2—asks the Supreme Court to consider whether state authorities or federal agencies have control over prediction market companies. The dispute stems from an appeal after a decision by the US Court of Appeals for the Third Circuit.
Key takeaways
- NCLGS filed an amicus brief urging the Supreme Court to uphold New Jersey’s position in the Kalshi case.
- The lawmakers warn that a ruling for Kalshi could “render[] states powerless” to regulate sports betting conducted via prediction markets.
- The brief frames gaming regulation as a state responsibility, while not directly settling the argument about federal CFTC jurisdiction for federally regulated event contracts.
- Kalshi has not filed an official response yet, though the company has previously indicated it should not be subject to a patchwork of state regulators.
NCLGS asks for Supreme Court intervention
On Tuesday, the NCLGS submitted its amicus curiae filing to the US Supreme Court. The group backed New Jersey’s request for the nation’s highest court to take up the case, which centers on how far state governments can regulate prediction market platforms that offer contracts tied to real-world events.
The lawmakers’ argument is grounded in the practical impact that they say could follow from a Supreme Court outcome. In their view, if Kalshi’s “self-described ‘sports betting’ activities” are treated as outside the scope of state oversight, other entities operating in heavily regulated gambling markets would likely seek the same legal classification.
In a passage included in the brief, NCLGS warned that businesses could change their offerings to obtain similar treatment, forcing states to reconsider the regulatory frameworks they currently use to govern this “vice activity.” The brief also emphasizes potential “substantial harm and confusion,” characterizing the prospect of reduced state power as disruptive to existing regulatory regimes.
What’s at stake: state power vs. federal oversight
At the heart of New Jersey’s petition is a jurisdictional question: whether regulation should be determined primarily by state gaming authorities or by federal regulators—particularly the Commodity Futures Trading Commission (CFTC). The Supreme Court has been asked to resolve an uncertainty that affects how prediction market products fit within existing legal categories.
NCLGS’s filing takes a broad position that “gaming-related matters” should remain with individual states. However, the brief does not fully engage with a competing line of reasoning raised in the dispute: that certain event contracts may be covered by the CFTC’s exclusive jurisdiction when traded on federally regulated markets.
That tension matters for market participants because it goes beyond the Kalshi case. If the legal boundaries are redrawn in a way that favors federal preemption, states could lose much of their ability to regulate not only prediction market platforms but also the surrounding ecosystem of operators that might attempt to structure offerings under the same umbrella.
Timeline and procedural posture
New Jersey’s petition for certiorari was filed on Sept. 2. It follows an appeal decision from the US Court of Appeals for the Third Circuit—an appellate step that typically signals a case has already raised substantial legal questions in lower courts.
In the Supreme Court, Kalshi has not yet issued an official response in the docket. The company has until Nov. 9 to file its brief setting out its position. In a statement provided after the initial filing, a Kalshi spokesperson told Cointelegraph that the company could not be “regulated by 50 different regulators,” pointing to concerns about inconsistent oversight across states.
While that comment does not resolve the legal question before the Supreme Court, it highlights the operational reality that accompanies the regulation of prediction markets: compliance regimes can vary significantly from jurisdiction to jurisdiction, and firms may argue that federal standards should govern where federal oversight is already implicated.
Why the case could shape the future of prediction markets
Prediction markets have grown into a broader sector that sits at the intersection of finance, sports, and consumer wagering. That makes jurisdictional clarity especially important. Without it, platforms may face uncertainty over licensing, product design, and whether their contracts are treated as gaming or as something else under federal commodities law.
The NCLGS brief suggests that states view the uncertainty as a direct threat to the ability to manage gambling-related conduct. If the Supreme Court were to adopt a reading that limits state authority, lawmakers argue states would need to rework their regulatory systems—and other operators could try to “amend their business and products” to capture whatever legal advantages come from that interpretation.
Conversely, the federal-jurisdiction argument reflected in the case poses a different concern: that event contracts traded through federally regulated structures may not be subject to separate state regulation, which could otherwise conflict with the CFTC’s regulatory framework.
For traders, developers, and investors watching the space, the outcome could determine how prediction market platforms plan for expansion. It may affect whether firms prioritize state-by-state compliance strategies or rely more heavily on federal frameworks when structuring products.
With the Supreme Court now considering whether to review the dispute, the key next step is Kalshi’s formal Supreme Court brief due by Nov. 9. Readers should watch closely for how the company frames the jurisdictional boundary—especially in relation to federal CFTC oversight—and whether the arguments on state preemption and federal exclusivity converge or remain sharply divided.
Crypto World
Fed’s Barkin says economy may be firming, inflation not limited to energy, tariff shocks

By Howard Schneider
BALTIMORE, Sept 22 (Reuters) – US economic conditions “are, if anything, firming,” with continued consumer spending and strength beyond the boom in artificial intelligence keeping the Federal Reserve’s focus on inflation, Richmond Fed President Tom Barkin said on Tuesday.
“The risks to inflation outweigh the risks to maximum employment. That’s why we raised rates,” at last week’s meeting, Barkin said in comments prepared for delivery to the CFA Society Baltimore, adding that the quarter-percentage-point hike “will help” restore inflation to the Fed’s 2% target.
“Will additional hikes be required, and how many? We’ll see,” said Barkin, who is not a voting member of the central bank’s rate-setting Federal Open Market Committee this year.
The Fed last week raised its policy interest rate to the 3.75%-4.00% range, with investors anticipating more increases.
Barkin’s comments follow those of other Fed officials who have broadened their concerns about inflation that they feel is being driven increasingly by strong demand in the economy, and not just by energy, tariff and other supply issues that might be expected to fade on their own.
Even those “‘passing’ shocks aren’t proving to be short-lived, or one-off events,” but are producing more persistent price pressures than at first expected, Barkin said.
“It is tempting to try to blame high inflation on a handful of categories with particularly high exposure to the Middle East conflict or to tariffs,” he said. But much of the Personal Consumption Expenditures Price Index is increasing at greater than a 3% annual rate.
“I am hearing momentum outside of data centers, too. The defense sector is hot. Manufacturing contacts are starting to sound more upbeat. Bankers tell us pipelines are healthy,” Barkin said.
(Reporting by Howard Schneider; Editing by Paul Simao)
Crypto World
Think buying a car in cash is a flex? Why millions of boomers are quietly wasting thousands in savings


Moneywise and Yahoo Finance LLC may earn commission or revenue through links in the content below.
Skipping auto financing completely seems like a “financial flex” that many Americans are happy to indulge in. Roughly 1 in 5 baby boomers or older, in fact, pay cash for their car purchases, according to a CDK Global survey (1) — and that ratio rises to nearly 5 out of 10 Gen Z car buyers.
Simply put, car loans seem to be less fashionable among younger Americans.
Top Picks
On paper, this might seem like a smart move. Auto loan rates for super-prime borrowers were roughly 4.55% and 6.30% for new and used cars, respectively, per Experian’s Q1 2026 State of the Automotive Finance Market report (2). So, looking at those rates, skipping the loan agreement might feel like an instant, guaranteed return on investment.
But the move could be costing you thousands of dollars over the long run. Here’s why.
Depreciation and opportunity costs
As of May 2026, a typical new car sold for roughly $49,220, according to Kelley Blue Book (3). Paying that in cash is a big up-front commitment. And unlike stocks or real estate, new cars rapidly shed value. In fact, a new car can be expected to lose roughly 30% of its value in the first two years alone, according to Kelley Blue Book (4). Beyond that point, it continues to depreciate at an annual pace of 8% to 12%.
In other words, you’re on track to lose tens of thousands of dollars in just the first few years of ownership. This depreciation cannot be fully avoided — but financing a portion of the purchase at 4% to 6% can offset some of the exposure.
Meanwhile, the cash you save by financing can potentially earn a higher return in other assets. The S&P 500, for instance, has delivered a roughly 10% annualized return since 1957, according to Fidelity (5).
This is the potential opportunity cost of paying for a car in cash instead of borrowing at a reasonable interest rate.
The case for financing
Paying cash for a car can feel like the financially savvy move. After all, you avoid interest charges and skip another monthly payment. But for boomers with a healthy nest egg, putting $50,000 or more into a depreciating vehicle all at once can also mean giving up access to cash that could be doing more useful work elsewhere.
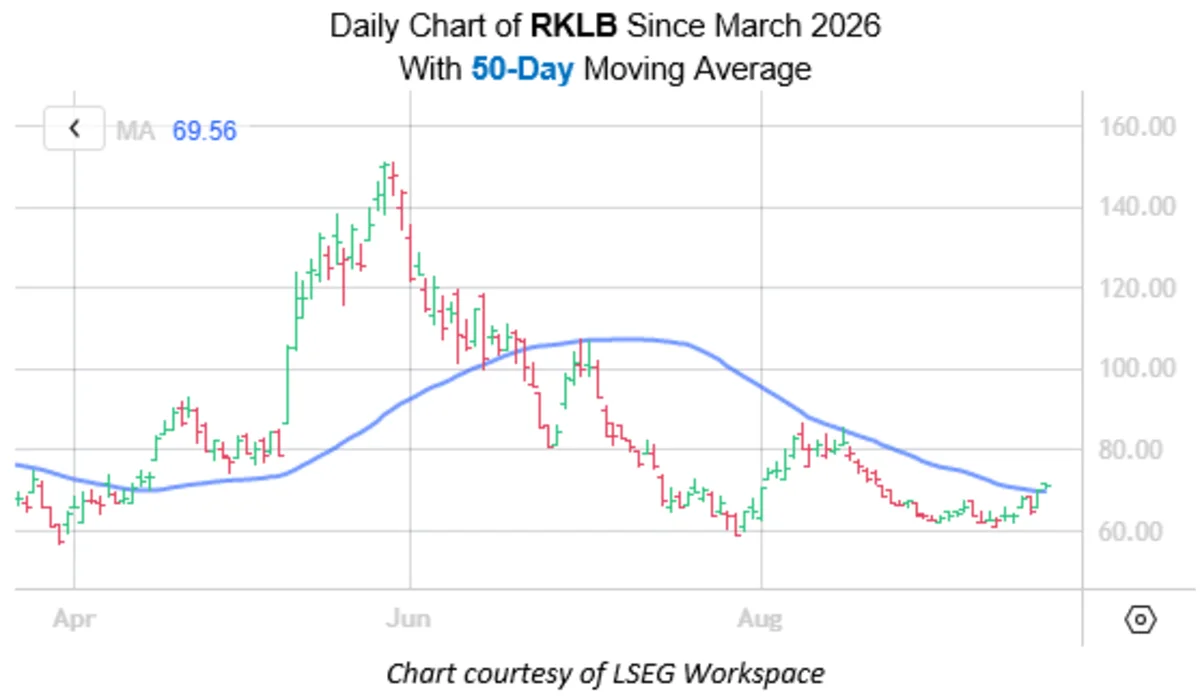
Shares of Rocket Lab Corp (NASDAQ:RKLB) are up 2.2% at $71.45 today, extending a bounce off familiar support at the $60 level. Furthermore, today’s price action has RKLB crossing above the 50-day moving average, which rejected the stock in July and August.
Per Schaeffer’s Senior Quantitative Analyst Rocky White, this “crossover” event has happened eight other times over the last 10 years. Rocket Lab stock was higher one month later 88% of the time after these signals, averaging a 16.8% gain. From its current perch, a move of this magnitude would put the shares at $83.45.

RKLB’s Schaeffer’s Volatility Index (SVI) of 70% stands in the low 10th percentile of its annual range, meaning options traders are pricing in low volatility expectations. The stock has tended to exceed these expectations over the last year as well, per its Schaeffer’s Volatility Scorecard (SVS) of 97 out of 100.
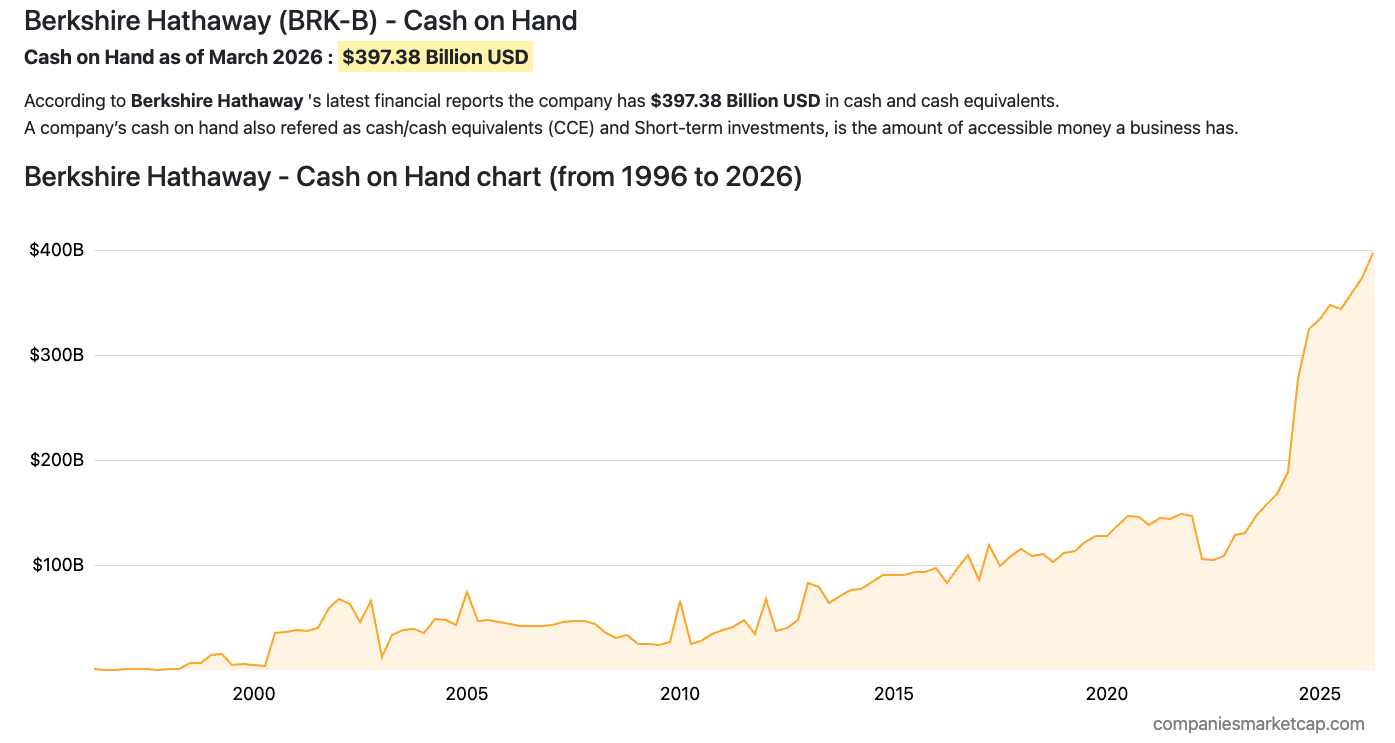
The Federal Reserve raised its benchmark rate 0.25 percentage points to 3.75%-4.00% on September 16, its first hike since July 2023. Berkshire Hathaway holds $359.2 billion in cash and Treasury bills, a stockpile positioned to earn more as short-term yields rise.
But the boost is not yet visible in Berkshire’s books. Interest, dividend, and other investment income for the first half of 2026 came in slightly below the same period last year, even though the cash pile grew.
Why The Payoff Hasn’t Landed Yet
Berkshire’s cash and Treasury bill position, disclosed in its June 30 filing, has grown steadily since 2023, when it held roughly $146 billion, part of a rapid cash buildup that has drawn scrutiny from investors.

Higher rates lift that stockpile’s yield only as older bills mature and get reinvested at the new rate, a process that unfolds over months rather than instantly.
That lag likely explains why Berkshire’s first-half 2026 results, published August 8, showed little sign of a rate-driven income jump. Interest, dividend, and other investment income actually slipped slightly year over year, even as the underlying cash position expanded.
Net earnings more than doubled to $35.8 billion for the half, but that surge came mainly from unrealized gains on stock holdings, not cash income. Berkshire also kept spending during the quarter, including a larger stake in Alphabet, Google’s parent company, and other acquisitions, activity unrelated to the rate hike itself.
The Federal Open Market Committee, the Fed’s policy-setting body, has signaled it expects one more increase before year-end, and futures markets currently price an 87% chance of that happening.
If it lands, each new batch of maturing Treasury bills would roll over at a higher yield, gradually lifting Berkshire’s interest income further. Until then, the cash pile’s real payoff looks more like a bet on flexibility than a return already banked, one that depends as much on how Greg Abel deploys cash as on where rates go next.
The post The Fed Just Raised Rates, But Berkshire's Cash Payoff Hasn't Shown Up Yet appeared first on BeInCrypto.
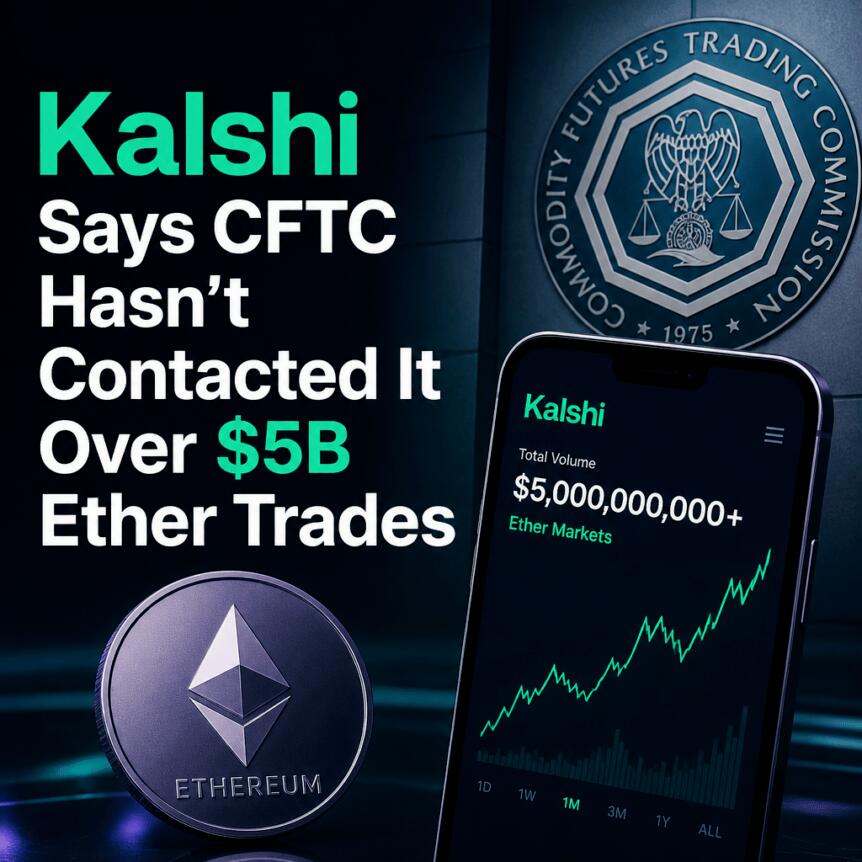
Kalshi, a prediction markets operator that launched Ether perpetual futures in May, says it has not been contacted by the U.S. Commodity Futures Trading Commission (CFTC) and does not believe the regulator is formally examining its market activity. The statement follows a Wall Street Journal report claiming the CFTC is reviewing a pattern of rapid, highly clustered trades in Kalshi’s Ether perpetual futures.
According to the Journal, the trades appeared in repeated blocks clustered around roughly $5,500 and have led to allegations of wash trading. Kalshi disputes that framing, arguing the pattern is consistent with liquidity incentives and market-making behavior common across financial markets.
Key takeaways
- Kalshi says the CFTC has not contacted it and that it does not think there is a formal examination of its Ether perpetual futures activity.
- The Wall Street Journal reported regulator interest tied to rapid trade clusters around approximately $5,500 and alleged wash trading.
- Kalshi points to liquidity incentive programs paying market makers for maintaining quoted orders, not for the volume of trades filled.
- Kalshi’s response argues repeated fixed-size trades can occur when resting orders meet demand from many takers.
- The company recently reported rapid growth, with perpetual futures volume surpassing $1 billion about a week after the May launch.
CFTC review claims come amid Kalshi growth
The controversy centers on Kalshi’s Ether perpetual futures markets—trading venues where participants speculate on Ether’s price without necessarily taking spot ownership. The Wall Street Journal reported that the CFTC is examining a sequence of fast trades clustered around $5,500, citing a person familiar with the matter.
The Journal’s reporting also noted the trade clustering raised wash-trading concerns—an accusation generally tied to the idea that trading volume inflates without genuine economic risk-taking by either side.
Kalshi’s push into perpetual futures has been rapid. About a week after launching its perpetual futures markets in May, the company told CNBC that trading volume had surpassed $1 billion. That growth backdrop is part of why the Journal’s regulator story has drawn attention to how Kalshi’s markets are being supported by liquidity providers.
Kalshi denies wash trading and says it wasn’t contacted
Elisabeth Diana, head of communications at Kalshi, told Cointelegraph that the company has not been contacted by the CFTC and does not believe there is any formal examination.
“We have not been contacted by the CFTC and don’t believe there is any formal examination,” Diana said. She described the discussion as “rumors seeded by competitors,” adding that liquidity incentives can produce data patterns that are common in traditional financial markets. Diana also urged readers not to rely on social media chatter.
In its own explanation, Kalshi argues that the observed fixed-size trades align with a single market maker supplying resting orders at a set size and price band, which then get executed by many other participants.
What the trade pattern appears to show
According to the Wall Street Journal, trades of roughly $5,500 each summed to more than $5 billion in Ether perpetual futures volume over the prior month. The Journal also reported that Kalshi had offered some traders opportunities to buy equity in the company if they reached specific trading-volume targets. It further said Kalshi waived trading fees and provided monthly cash payments to encourage large traders to supply liquidity.
Kalshi did not address the equity-purchase possibility directly in its subsequent explanation, but in a blog post published on Wednesday the company attributed the repeated trade sizes to liquidity programs that reward market makers for keeping buy and sell orders available at predetermined sizes and within a specified price range.
In that post, Kalshi said the payments are intended to reward the presence of orders—liquidity readiness—rather than to compensate traders based on the volume of executions. It framed the recurring trade sizes as a mechanical outcome of how market makers can quote in chunks, and how those quotes can get hit by takers.
Kalshi also said that the executions involved hundreds of distinct traders, with takers repeatedly accepting the market maker’s orders. In Kalshi’s view, takers were “pretty consistently right” while the maker was “pretty consistently wrong,” which would not fit a wash-trading setup where both sides would be expected to behave differently if the goal were not genuine trading risk.
Why liquidity incentives can matter—and what to watch next
Market makers play a central role in derivative markets by continuously posting bids and offers, creating counterparties for traders who want immediate execution. The key distinction—at least in Kalshi’s argument—is whether a market’s activity is driven by incentives that support quotes (market structure and execution availability) versus incentives that could encourage artificial volume.
Kalshi’s position is that fixed-size fills can be economically legitimate: if a resting order sits on an order book, it may be executed repeatedly by multiple takers, creating clusters of similar trade sizes. That explanation matters for investors and traders because it affects how market quality is interpreted—specifically, whether patterns in reported volume indicate healthier liquidity or potential manipulation.
For now, the public record is defined by two competing narratives: the Journal’s report that the CFTC is looking into the trade clustering, and Kalshi’s insistence that the activity is consistent with liquidity incentive programs and normal market-making mechanics. Readers should watch for any formal CFTC action, additional regulatory statements, or further disclosures from Kalshi clarifying how its incentive structures interact with execution data—especially around the reported volume targets.
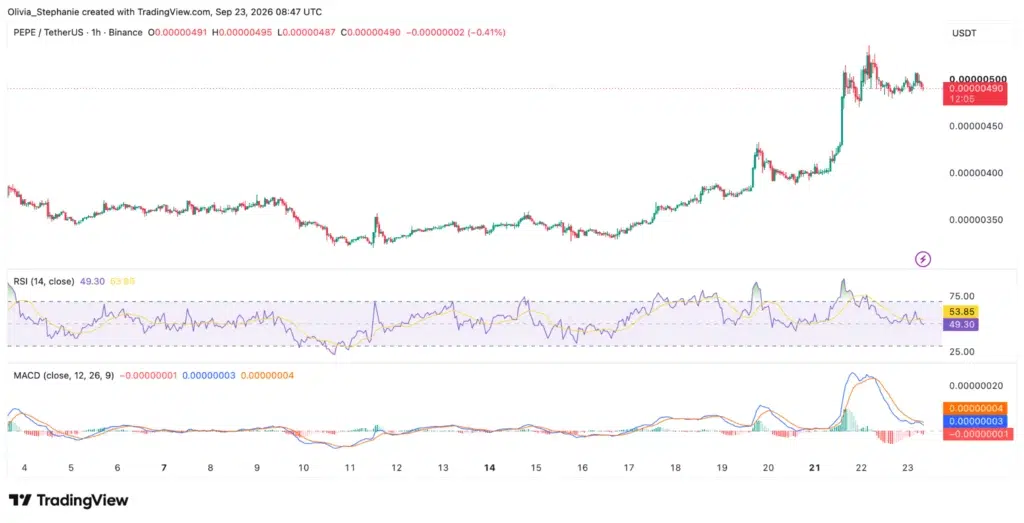
PEPE has held above its early-September breakout zone near $0.0000044 despite pulling back from a seven-day high around $0.00000534, leaving the meme coin roughly 45% higher over the week as momentum indicators cool.
Summary
- PEPE remains roughly 45% higher weekly despite retreating from its recent $0.00000534 seven-day price peak.
- CoinGlass shows PEPE open interest near $393 million as derivatives activity remains elevated after breakout.
- RSI has cooled toward neutral while MACD signals weakening momentum after PEPE’s sharp September rally.
- PEPE’s breakout remains above $0.0000044, with $0.0000047 acting as the first important support zone now.
- September golden cross supports the bullish structure, though the signal does not guarantee gains ahead.
CoinGecko shows PEPE trading near $0.00000492 on Sept. 23, with its market capitalization around $2.07 billion and seven-day performance at approximately 45.2%. Its seven-day trading range extended from roughly $0.00000329 to $0.00000534.
The current price is therefore around $0.0000049, not $0.054934. CoinGlass placed PEPE near $0.00000492 in a separate Sept. 23 snapshot, down roughly 3.3% over 24 hours while remaining more than 44% higher over seven days.
PEPE breakout remains intact above $0.0000044
PEPE broke through $0.0000044 after spending much of late August and early September trading beneath the level. The rally pushed through the August high near $0.0000046 and extended to approximately $0.00000534 before sellers slowed the move.
The sequence produced a higher high on the daily chart, while the former resistance area around $0.0000044-$0.0000047 now forms the first area traders are watching during the pullback.
CoinGecko historical data shows PEPE closed around $0.00000341 on Sept. 16, $0.00000361 on Sept. 17 and $0.00000400 on Sept. 20 before reaching $0.00000477 on Sept. 21. The Sept. 22 close stood near $0.00000498.
A move back toward $0.0000047 would therefore place PEPE close to the area where the latest leg accelerated. Holding that zone would keep price above the August resistance that was cleared during the rally.
Below it, $0.0000044 remains the more important structural support. A daily move beneath that level would return PEPE into its earlier trading range and weaken the higher-high structure created this week.
Price has not yet produced such a breakdown. PEPE remains several percentage points above $0.0000044 despite retreating from the weekly peak.
The latest surge coincided with a strong cryptocurrency-market rebound. As previously reported, PEPE’s earlier golden-cross setups have coincided with sharp price swings and changing whale activity, though previous crossovers did not guarantee sustained gains.
RSI and MACD show PEPE momentum cooling
Momentum indicators have weakened since PEPE’s sharp advance.
TradingView data supplied for the latest chart places the 14-period relative strength index at 51.37, below its moving average around 54.00. RSI had previously reached 78.09 during the breakout, placing the token in overbought territory before the indicator retreated.
An RSI near 50 indicates that the earlier buying imbalance has largely normalized. The fall from above 78 does not by itself confirm a bearish reversal, but it shows that the momentum behind the initial surge has faded.
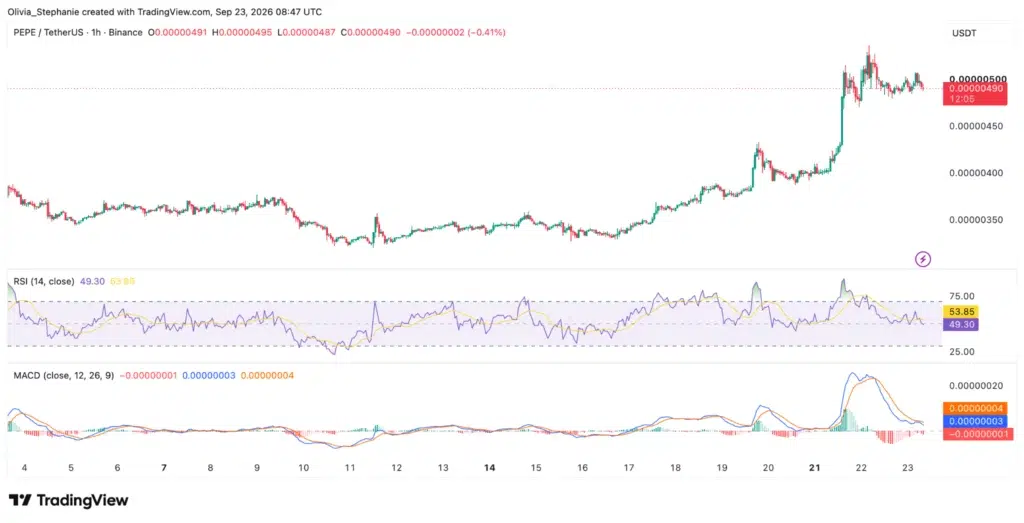
MACD gives a similar reading. The MACD line sits around 0.00000003, below the signal line near 0.00000004, while the histogram is marginally negative at approximately -0.00000001.
The crossover indicates softer short-term momentum following the Sept. 21-22 rally. Price, however, remains close to the upper end of its recent range instead of retracing the full breakout.
Combining the two indicators produces a mixed setup. RSI has returned to neutral conditions while MACD has turned mildly bearish. Price structure remains firmer because PEPE continues to trade above $0.0000044 and its previous August high.
Such divergence between price structure and momentum can persist while an asset consolidates after a large move. Confirmation would require subsequent price action: holding $0.0000047 would preserve the immediate breakout area, while a loss of $0.0000044 would give the weakening momentum readings more weight.
Independent chart analysis found that PEPE’s 50-day moving average crossed above its 200-day moving average around Sept. 19, producing the pattern commonly called a golden cross. The study placed PEPE substantially above both averages after the rally.
The same analysis cautioned that PEPE’s historical golden-cross sample is small. Previous examples produced very different results, including one period in which price fell heavily during the following 90 sessions.
PEPE futures activity remains elevated after rally
Derivatives traders remain heavily involved even as spot momentum cools.
CoinGlass reports PEPE open interest around $393 million, with approximately $912 million in 24-hour futures volume in one Sept. 23 snapshot. Spot volume in the same dataset stood near $267 million.
Other CoinGlass snapshots taken during the morning placed open interest between roughly $395 million and $402 million, showing that the total changes continuously as traders open and close positions.
The derivatives turnover is several times larger than spot turnover under CoinGlass’s methodology. High futures activity can increase sensitivity to rapid moves when leveraged positions become crowded, although open interest alone does not show whether traders are positioned net long or net short.
CoinGlass recorded roughly $1.96 million of PEPE futures liquidations over 24 hours in one snapshot. Its open-interest methodology counts both long and short positions that remain unsettled, meaning rising or elevated OI cannot independently identify bullish positioning.
Open interest has risen considerably from earlier in September. A CoinGlass page captured last week showed roughly $219 million in PEPE open interest when the token traded near $0.00000325. Current figures close to $400 million indicate far more derivatives exposure remains in the market after the price rally.
Such an increase can accompany a strong trend, but it can raise liquidation risk when price momentum slows because more leveraged positions remain exposed to sudden moves.
Exchange flows give a mixed picture
Available exchange-flow data does not point uniformly toward either accumulation or distribution.
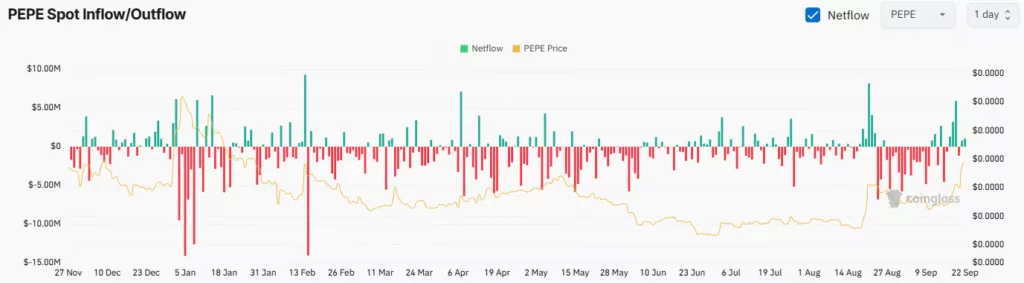
One recent independent whale study covering activity through Sept. 20 tracked 83 large PEPE wallets moving $57.7 million. The study recorded $34.1 million in exchange withdrawals and $23.6 million in deposits, leaving approximately $10.5 million net leaving exchanges among the wallets it followed.
The dataset covers only the wallets tracked by the researcher and cannot represent every PEPE holder or exchange flow.
A separate analysis of more recent transactions reported heavy deposits on Sept. 20, nearly balanced flows on Sept. 21 and roughly 6.9 billion tokens net leaving exchanges on Sept. 22. The changing daily readings show why a single flow session does not establish a persistent accumulation or selling trend.
CoinGlass’s current spot page lists exchange-level net-flow data but did not expose a complete aggregate flow figure in the public snapshot retrieved Sept. 23. Its live data nevertheless places spot turnover near $200 million while futures activity remains several times larger.
Earlier crypto.news coverage documented how changes in PEPE exchange balances have repeatedly accompanied price moves. In one prior cycle, falling PEPE exchange balances coincided with whale accumulation and a completed golden cross, while later periods saw exchange balances rise as holders reduced exposure.
Current price action therefore leaves two levels doing most of the technical work. The first sits around $0.0000047, close to the recent breakout and consolidation area. The second lies near $0.0000044, where the earlier resistance zone could become support.
Above the market, the recent high around $0.00000534-$0.00000536 remains the first resistance. A sustained move through that area would create another higher high. Failure to reclaim it while RSI stays around neutral and MACD remains below its signal line would keep PEPE consolidating beneath the latest peak.
CoinGecko’s current seven-day range still places PEPE’s high at roughly $0.00000534 and its low near $0.00000329, leaving the token well above where the weekly move began despite the latest pullback.
Disclosure: This article does not represent investment advice. The content and materials featured on this page are for educational purposes only.
Dogecoin has climbed roughly 25% over seven days and returned to the $0.10 region for the first time since early June, though short-term momentum has weakened after the latest rally.
Summary
- Dogecoin has gained 25% in seven days while trading around the psychological $0.10 level again.
- CoinGlass shows Dogecoin futures open interest near $1.67 billion as derivatives volume exceeds $3 billion.
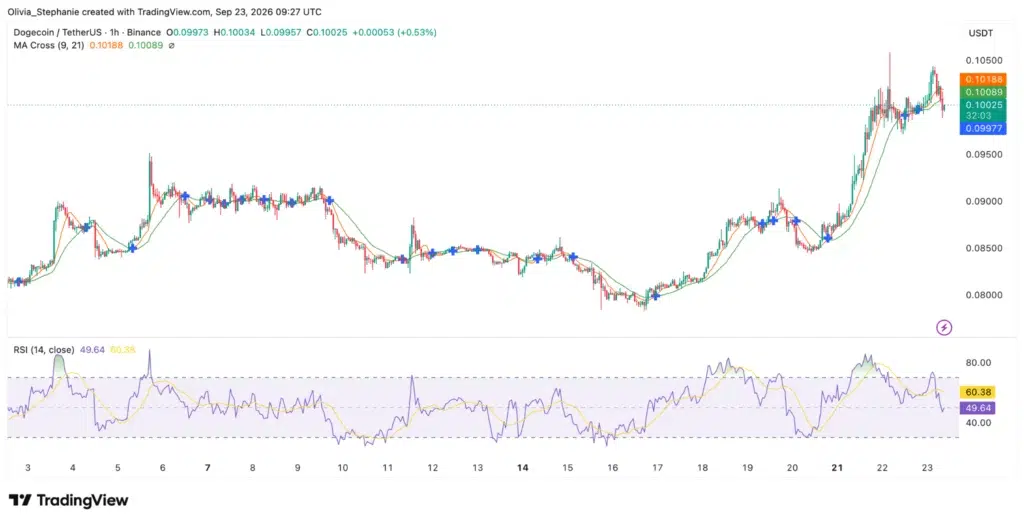
- DOGE trades below its nine-period and 21-period averages despite their remaining bullish short-term alignment today.
- RSI has cooled to 48.40 after previously reaching overbought territory, showing weaker short-term momentum now.
- Whale wallets accumulated more than 240 million DOGE during the September pullback, according to analysts.
CoinGecko shows DOGE trading near $0.10 on Sept. 23, up around 1% over 24 hours and 25.2% over the past week. The token carries a market capitalization of roughly $15.6 billion, with 24-hour trading volume near $1.8 billion.
The move follows a recovery from approximately $0.080 on Sept. 15. DOGE traded near $0.081 on Sept. 16 before moving through $0.087 during the weekend and reaching the $0.10 area on Sept. 21-22.
Dogecoin price holds $0.10 as momentum cools
The latest technical readings show a bullish short-term moving-average structure that has begun losing momentum.
The nine-period moving average stands at $0.10185, above the 21-period average at $0.10088. The positive alignment keeps the recent short-term trend structure intact, but DOGE has slipped beneath both averages while trading close to $0.10.
Price moving below the two averages indicates weaker immediate buying pressure after the sharp advance. Reclaiming $0.10088 and $0.10185 would put DOGE back above its short-term trend gauges, while continued trading beneath them would keep sellers in control of the immediate timeframe.
The RSI gives a similar reading. The 14-period indicator has fallen to 48.40, below its moving average of 60.29, after moving above 70 during the rally.
An RSI close to 50 is neutral and does not signal an oversold market. Its decline from overbought territory shows that the strength behind the initial move has eased while DOGE consolidates around $0.10.
Historical price data shows DOGE rose from $0.08005 on Sept. 15 to $0.09980 on Sept. 21, a gain of nearly 25% in less than one week.
As previously reported, Dogecoin had reclaimed its 200-day moving average near $0.09 earlier this month before the latest move carried price through the previous resistance zone.
Analysts watch $0.1175 and $0.15 after breakout
Several traders are now watching whether DOGE can turn the $0.10 region into support.
Analyst Cyriptoman4 said a decisive move above $0.10 could open a path toward $0.1175 and then $0.15. Both levels remain analyst targets and are not confirmed price outcomes.
#DOGE kısa vadeli görünüm 👀📈$DOGE, 0,080 $ destek bölgesinde iyi tutundu ve bu seviyeden tepki aldı.
🔹 0,080 $: Destek bölgesi — Cyriptoman4 (@Cyriptoman4) September 21, 2026
🔹 0,10 $: Kritik direnç
0,10 $ direncinin kırılması ve üzerinde kalıcılık sağlanması halinde yükseliş hareketinin devam etmesi ve 0,1175 – 0,15 $… pic.twitter.com/d3oLkajKKY
The $0.10 area carries immediate importance because DOGE has repeatedly traded around that psychological level since breaking higher. CoinGecko’s current seven-day range extends from roughly $0.0784 to $0.1056, placing the recent local high just above $0.10.
BSC Gems Alert described the higher-timeframe setup as a developing higher-low structure pressing against the upper boundary of a descending pattern.
The analyst said a break and hold above $0.22 could support a move into higher resistance zones, while failure to maintain support would invalidate the bullish setup. With DOGE near $0.10, $0.22 sits more than twice the current market price and represents a longer-term scenario rather than an immediate resistance target.
More aggressive projections have emerged after the weekly rally.
Bark claimed that “the DOGE breakout to $1 has begun” and said the move could occur faster than traders expect.
MikybullCrypto forecast a $1-$3 bullish target range, saying the stronger move was about to begin.
Neither forecast is supported by a timetable or a guaranteed technical outcome. DOGE would need to rise around tenfold from $0.10 to reach $1 and roughly thirtyfold to reach $3.
Dogecoin futures open interest stays above $1.6B
Derivatives markets remain active as traders position around the rally.
CoinGlass reports DOGE near $0.0999, with futures open interest around $1.64 billion. Futures turnover reached roughly $3.05 billion over 24 hours, compared with approximately $531 million in spot volume.
The derivatives data means futures turnover is running several times above reported spot activity. CoinGlass recorded around $5 million in DOGE futures liquidations over the same 24-hour period.
Open interest measures unsettled long and short positions, so a high figure does not establish that traders are predominantly betting on further gains. It does show that substantial leveraged exposure remains open while DOGE trades near its three-month high.
CoinGlass’s open-interest figure has risen from levels seen during earlier periods of weakness. Crypto.news previously reported that DOGE derivatives open interest had fallen toward $1.4 billion during a softer period this year, leaving the current reading above that earlier level.
Leverage can amplify moves in either direction. A sharp decline through support can force long liquidations, while a breakout through resistance can pressure short sellers to close positions.
Whales accumulated 240 million DOGE during pullback
Large-holder activity preceded the latest recovery.
On-chain data shared by analyst Ali Martinez showed whale wallets adding more than 240 million DOGE during the September correction. Holdings attributed to the cohort rose toward 19 billion DOGE as price traded in the low-$0.08 range.
The accumulation occurred while DOGE fell from around $0.091 toward $0.081 between Sept. 9 and Sept. 14. Santiment-based data cited in subsequent market reports indicated the large wallets increased exposure while price weakened.
Whale accumulation alone does not establish future price direction. Large wallets can hedge positions through derivatives, move coins between entities or reduce exposure after accumulating.
Exchange activity has presented another potential source of selling pressure. The market data provided for the recent sessions showed exchange inflows exceeding outflows on several days, indicating some DOGE moved from private wallets toward centralized platforms.
Tokens deposited on exchanges become more readily available for trading or sale, though exchange inflows do not prove that the owner eventually sold them.
The contrasting signals leave DOGE with large-holder accumulation on one side and increased exchange availability on the other.
DOGE faces $0.10 retest while ETF demand remains mixed
The $0.10 region remains the immediate technical test after the token reached a three-month high.
Holding above that level would keep DOGE near the top of its current range and place $0.1056, the latest seven-day high, as the first nearby price barrier.
A failure to hold $0.10 would bring the short-term moving averages back into focus. The nine-period average at $0.10185 and 21-period average at $0.10088 currently sit slightly above price, while RSI around 48 shows no strong momentum advantage for either buyers or sellers.
DOGE’s regulated U.S. investment products present a separate picture from the spot rally.
As previously reported, Bitwise plans to close its Dogecoin ETF after roughly ten months of trading. BWOW’s final trading day is expected on Oct. 14, with remaining shareholders scheduled to receive cash based on the Oct. 21 net asset value around Oct. 22.
Bitwise had roughly $722,000 in fund assets as of Sept. 8, backed by approximately 8.2 million DOGE. The manager said it was optimizing its product range and did not attribute the closure directly to DOGE’s price.
For the spot market, the next technical confirmation remains closer. DOGE needs to regain the nine- and 21-period moving averages while keeping price near $0.10 if the short-term momentum readings are to strengthen again.
Disclosure: This article does not represent investment advice. The content and materials featured on this page are for educational purposes only.

Join Our Telegram channel to stay up to date on breaking news coverage
Binance bought $100 million of Circle stock under a five-year deal that pays the exchange to promote the USDC stablecoin, according to a filing with the US Securities and Exchange Commission published September 22.
Circle issued Binance 1,237,011 Class A shares at $80.84 each in a private placement that closed September 17, the filing states. The stock went at a discount to Circle’s market price before the sale, though the filing does not say how large. Because the shares were sold unregistered, Binance cannot resell them unless they are registered or an exemption applies.
A five-year promotion pact with a monthly fee
Under the commercial agreement, Circle will pay Binance a monthly incentive fee calculated as a percentage of the USDC held through Circle’s Modular Smart Contract Wallet service, while Binance carries out promotional activities for the stablecoin. The fee percentage is not disclosed. Either company can end the five-year partnership early if specified events occur.
Binance cannot sell, transfer, pledge or hedge the shares for up to two years, subject to customary exceptions, unless it terminates the commercial arrangements under certain circumstances. It keeps the right to vote the shares during the lockup.
The arrangement supersedes and replaces agreements the two companies signed in November 2024 and August 2025, making this the third version of the tie-up in under two years. The first deal, announced at Abu Dhabi Finance Week in December 2024, had Binance making USDC available across its products and holding it in its treasury.
Richard Teng, co-CEO of Binance, called the investment and five-year commitment “long-duration conviction” in a statement.
The deal lands amid regulatory pressure
The filing was published one day after Bloomberg reported that federal prosecutors are investigating whether Binance breached US sanctions on Iran.
Circle’s stock has slid during the partnership’s expansion, closing at $94.29 on the NYSE on Monday, according to Yahoo Finance data, after trading in the mid-$80s when the placement closed. CRCL is down about 34% over 12 months, against a 16.5% gain for the S&P 500.
Jeremy Allaire, Circle’s co-founder, chairman and CEO, said Binance has become “the most widely used wallet for dollar stablecoins.”
Join Our Telegram channel to stay up to date on breaking news coverage

‘A handbrake on Manchester United’ – Why financial results aren’t as rosy as they look
DHS Starts Dicking Around After Blowing Past Its Deadline For ICE Body Cam Rollout

Sep 16 | Live Market Analysis for Gold and Crypto | FOMC LIVE




-

 Fashion5 days ago
Weekend Open Thread: Talbots – Corporette.com
-

 Tech3 days ago
Researchers escape OpenAI Codex sandbox to run commands on host
-

 Crypto World5 days ago
Circle launches Arc Studio AI agent for building onchain apps
-

 Crypto World3 days ago
Who Needs CLARITY Anyway? ARB Could See 70X Increase: Hodler’s Digest
-
 NewsBeat5 days ago
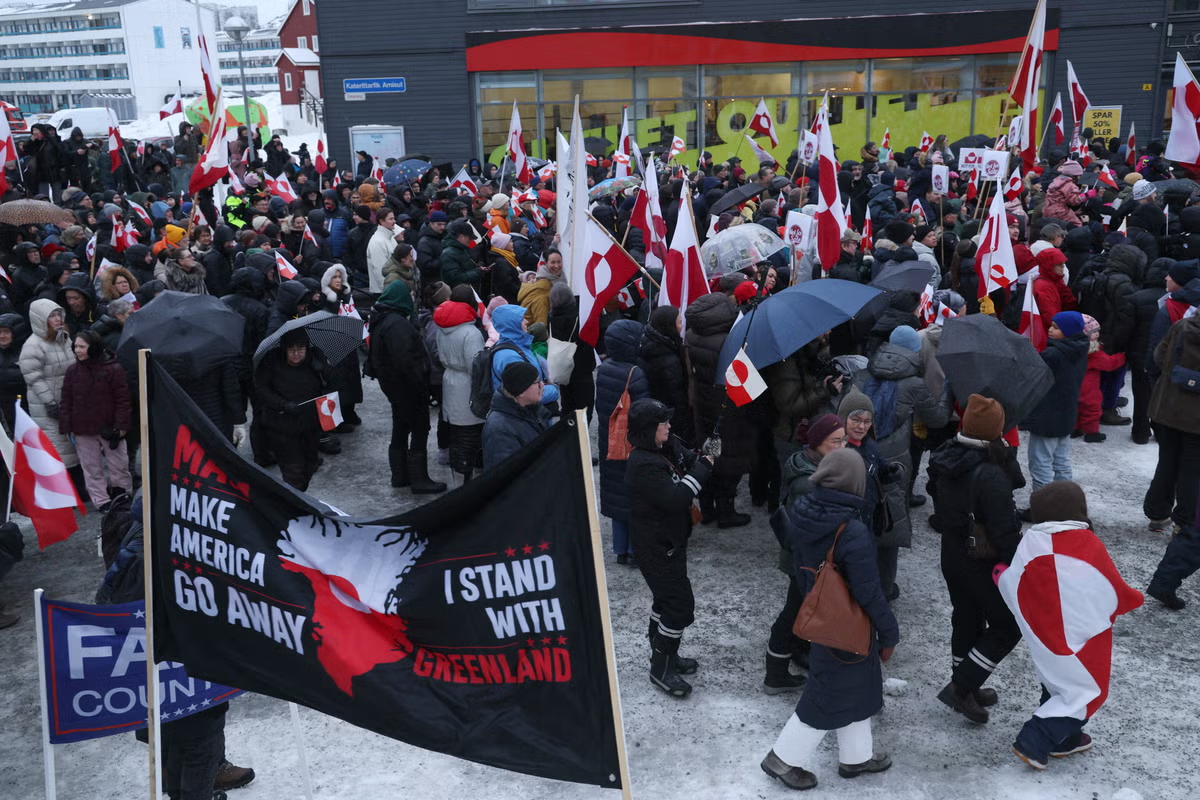
Trump says US has reached an agreement to take permanent control of Greenland’s security
-
 Crypto World1 day ago
Goldman Sachs and Deutsche Bank Agree: The S&P 500 Rally Isn't Over
-

 Crypto World5 days ago
Trading Bitcoin on Robinhood? Why 2% Spread Has Traders Worried
-

 Crypto World6 days ago
Mortgage and refinance interest rates today, Thursday, September 17, 2026
-
 Crypto World5 days ago
Bitcoin price breaks channel as RSI climbs to 63
-

 Tech3 days ago
Google’s $899 Googlebook is a bet that you’ll buy a new laptop for Gemini
-

 Business3 days ago
Analog Devices (ADI) Bets $1.35 Billion on Chips that Let Machines Think for Themselves
-

 Crypto World3 days ago
Coinbase, Robinhood, Circle Seen as Tokenized-Stock Winners
-

 Crypto World5 days ago
World Money launches in 150+ countries with Stripe
-
 Business1 day ago
Oil Price Today (September 23): Crude oil below $100 on hopes of US-Iran talks. What did Trump say?
-

 Crypto World6 days ago
Silver prices recover quickly, hitting weekly high today
-

 Tech4 days ago
Trump suggests rebranding AI with a new name, says he’s also creating an AI Force
-

 Tech6 days ago
GPT-6 Astra Reached the Nether in Minecraft, Lost Its Stash to a Creeper, and Farmed Potatoes for Hours
-
 NewsBeat5 days ago
US was ‘on brink of war’ with China over false AI report of nukes moving in Middle East
-

 Crypto World5 days ago
CFTC sends crypto market structure rulemaking to White House
-
 Crypto World3 days ago
Bitcoin price holds above $81K as key catalysts line up
You must be logged in to post a comment Login