

Crypto World
Moderna (MRNA) Stock Soars 13% on In Vivo CAR-T Breakthrough and Flu Vaccine Progress

Key Takeaways
- Shares of Moderna surged approximately 13% to $67.50, marking the highest closing price since September 2024, driven by announcements at its investor day presentation.
- The biotech firm introduced mRNA-6007, its inaugural in vivo CAR-T therapy program, aimed at autoimmune conditions such as lupus, with clinical trials scheduled to start in 2027.
- A unanimous 9-0 vote from an FDA advisory committee supported approval of Moderna’s influenza vaccine for individuals aged 50 and above, with a final FDA ruling expected on August 5, 2026.
- Jefferies analyst Andrew Tsai increased his price target to $53 from $45, while Piper Sandler’s Edward Tenthoff boosted his to $77, reaffirming an Overweight stance.
- Overall Street sentiment remains neutral with a Hold consensus rating and an average price target of $45.42 — suggesting potential downside from current price levels.
Shares of Moderna (MRNA) experienced a substantial rally on Friday, climbing roughly 13% to reach $67.50, positioning the biotech stock for its strongest close since September of last year. The impressive gain made MRNA the standout performer within the S&P 500 during the trading session. Intraday, shares briefly spiked nearly 15%, approaching the $69 level.
The surge was triggered by Moderna’s investor day presentation, during which the company unveiled an extensive expansion of its drug development pipeline that reaches far beyond its COVID-19 vaccine foundation.
MRNA has now advanced approximately 42% over the past 30 days, indicating a notable shift in market sentiment toward the stock.
The marquee reveal was mRNA-6007, Moderna’s inaugural in vivo CAR-T therapy program. The company intends to initiate clinical development by 2027, with an initial focus on B-cell-driven autoimmune disorders, particularly systemic lupus erythematosus.
Unlike conventional ex vivo CAR-T treatments that require removing patient T-cells, engineering them in laboratory settings, and reinfusing them, in vivo CAR-T therapy reprograms T-cells directly within the patient’s body. This approach offers greater efficiency and reduced costs.
Moderna isn’t the only pharmaceutical company pursuing this cutting-edge technology. Earlier this year, Eli Lilly acquired Orna Therapeutics primarily to gain access to its in vivo CAR-T platform. Notably, Lilly shares also rose 6% on Friday, boosted by favorable feedback from European regulators regarding its oral cancer treatment.
Strategic Roadmap Divided Into Three Phases
Moderna presented its strategic vision organized into three separate “horizons.” The initial phase emphasizes advanced, near-commercial assets, including current marketed products and late-stage pipeline candidates.
Jefferies analyst Andrew Tsai projects the company could launch more than seven new products spanning respiratory, oncology, and rare disease categories within the next two years. This would represent a significant expansion from its current portfolio of three approved vaccines.
Tsai highlighted Phase III melanoma trial results, anticipated in the latter half of 2026, as a critical upcoming milestone, describing it as “a major event” for shareholder value. He maintains a Hold rating while elevating his price target to $53 from the previous $45.
Another program drawing considerable attention is mRNA-4194, Moderna’s pioneering cancer prevention therapy designed for Lynch syndrome patients. Additionally, the company is progressing with mRNA-1195, its multiple sclerosis candidate, which should generate preliminary data later in 2026.
Influenza Vaccine Provides Additional Momentum
Beyond oncology and autoimmune therapeutics, Moderna received encouraging news regarding its flu vaccine candidate mRNA-1010 when an FDA advisory committee delivered a unanimous 9-0 vote recommending approval for adults 50 years and older.
The FDA’s final determination is scheduled for August 5, 2026. Approval would provide the company with another revenue-generating product independent of its COVID franchise.
Piper Sandler analyst Edward Tenthoff elevated his price target to $77 from $69 and maintained an Overweight rating, citing the substantial progress showcased during the investor day event.
However, despite positive reactions from select analysts, the broader Wall Street consensus remains at Hold, comprising two Buy ratings, 19 Hold ratings, and three Sell ratings across the past three months. The consensus price target of $45.42 suggests more than 31% potential downside from current trading levels.


The best government bond market may be outside the United States.
Allspring Global Investments’ George Bory is pushing clients toward countries whose central banks are raising interest rates or have different inflation dynamics.
“Bond markets everywhere have rushed to price inflation. Places like the UK, certainly across Europe, even places like Australia — we’ve seen a material run-up in central bank tightening expectations,” he told CNBC’s “ETF Edge” this week. “Now, some of that’s been delivered on already. The ECB raised rates just a few weeks ago. The expectation is they will do a bit more. But unless the Fed is going to validate those moves, they’re going to have to move at a slower pace than perhaps what’s priced in.”
Bory works as chief investment strategist in fixed income at Allspring — an asset management firm primarily focused on fixed income, money markets, and stocks. According to Allspring’s website, clients range from consultants and financial advisors to corporations and financial institutions.
“Short to intermediate duration global government developed market bonds [are] not a bad spot to be, especially for those central banks that are really tethered to inflation,” he said. “If they’re going to move aggressively, that will help bond investors. And so, adding that international duration … mixing it with some U.S. duration. Now we’re playing different rate cycles, and that works really, really nicely.”
The Fed hasn’t hiked rates in the U.S. since July 2023. The CME Group’s FedWatch gauge as of late Friday shows a 78% chance the Fed will hike rates in December. The odds dipped to 68% in January 2027.
Meanwhile, Bory highlights the European Central Bank’s move earlier this month. The ECB raised its rates 25 basis points to 2.25% on June 11 — the first rate hike since Sept. 2023.
Steve Laipply, the global co-head of iShares Fixed Income ETFs at BlackRock, also sees advantages for investors going abroad. He points to fixed-income securities issued in Europe that offer lower risk and higher yields.
“Many of our clients, many bond investors, [are] very US-centric,” Bory added. “It’s a big world out there, you know. The global bond market is massive, and diversifying both your duration, your credit risk, and even your security selection can do … good things for your portfolio.”


Providing liquidity to a decentralized exchange looks like easy passive income, until you withdraw and find you have less than if you had simply held your tokens. That gap is impermanent loss, the most misunderstood risk in DeFi. This guide explains what causes it, how to calculate it, and how to limit it.
Summary
- Impermanent loss is the opportunity cost a liquidity provider suffers when the value of tokens deposited in a liquidity pool ends up lower than if the same tokens had simply been held in a wallet.
- It is caused by price divergence: as the prices of the two paired tokens move apart, the automated market maker rebalances the pool, leaving the provider with more of the falling asset and less of the rising one.
- It is called “impermanent” because the loss reverses if prices return to their original ratio, and it only becomes permanent when the provider withdraws.
- Trading fees and token rewards offset impermanent loss, and a position is profitable when those earnings exceed the loss, but studies show that for many liquidity providers, the loss outweighs the fees.
- The main ways to limit it are choosing stablecoin or correlated pairs, which barely diverge, and understanding the trade-off before providing liquidity to volatile pairs.
Impermanent loss is the opportunity cost a liquidity provider suffers when the value of the tokens they deposited into a decentralized exchange’s liquidity pool ends up lower than it would have been had they simply held those same tokens in their own wallet. It is one of the simplest-sounding yet most misunderstood risks in decentralized finance, and it catches a great many people who are drawn to liquidity provision by the promise of passive income.
The mechanism trips people up because it is counterintuitive: you can deposit two tokens into a pool, watch their prices rise, earn fees the whole time, and still end up worse off than if you had done nothing at all. The word impermanent makes it sound harmless, almost like a temporary inconvenience, but for liquidity providers in volatile pools, it can be a substantial and very real drag on returns.
Understanding what causes it, how to estimate it, and how to limit it is essential for anyone thinking about supplying liquidity, because it is the single factor most likely to turn an apparently profitable strategy into a losing one.
The reason impermanent loss exists at all comes down to how decentralized exchanges work. Rather than matching buyers and sellers through an order book, most decentralized exchanges use automated market makers, pools of tokens governed by a mathematical formula that sets prices algorithmically. Liquidity providers fund these pools, and in return, they earn a share of the trading fees. The catch is that the same formula that lets the pool function also forces it to rebalance as prices move, and that rebalancing is what produces impermanent loss.
This guide walks through how liquidity pools and automated market makers work, exactly why price divergence creates the loss, a concrete worked example with numbers, how to calculate it, the role of fees and rewards in offsetting it, and the practical strategies that liquidity providers use to limit their exposure. The goal is to give you a clear enough mental model that you can judge, before committing any funds, whether providing liquidity to a given pool is likely to be worth it.
How liquidity pools and automated market makers work
To understand impermanent loss, you first have to understand the machinery that creates it, which is the automated market maker. A traditional exchange matches a buyer with a seller through an order book. A decentralized exchange built on an automated market maker, such as Uniswap or Curve, works differently: instead of matching counterparties, it holds pools of tokens that traders swap against directly, with prices set by a formula rather than by bids and offers.
To make this work, the pools need to be funded, and that is where liquidity providers come in. A liquidity provider deposits a pair of tokens into a pool, most commonly in a 50-50 split by value, and in exchange earns a portion of the fees that traders pay to swap against that pool.
The formula that governs the most common type of pool is elegantly simple. Many automated market makers use a constant product formula, often written as x*y = k, where x and y are the quantities of the two tokens in the pool and k is a constant that must stay the same. Because k cannot change, any trade that removes some of one token must add a corresponding amount of the other, and the ratio between the two tokens is what sets the price.
When a trader buys one token from the pool, they reduce its quantity and increase the other’s, which moves the price, and the formula guarantees the pool always quotes a price based on its current balances. This design is what makes decentralized trading possible without a central order book, and it works beautifully for traders.
For liquidity providers, however, the same rebalancing mechanism is the source of the problem, because it means the composition of their deposited tokens changes automatically as prices move, and not in their favor.
Why price divergence creates the loss
Here is the heart of the matter: impermanent loss arises specifically from divergence in the prices of the two tokens in a pool. When you deposit a pair of tokens, the automated market maker holds them in a balance dictated by its formula. If the market price of one token rises relative to the other, traders and arbitrageurs will buy the now-underpriced token from the pool until the pool’s price matches the wider market. That arbitrage is essential to keeping the pool’s prices accurate, but it has a consequence for you as a provider: the pool sells off some of the token that is rising in value and accumulates more of the token that is falling. In other words, the rebalancing leaves you holding more of the loser and less of the winner compared to what you started with.
When you later withdraw your liquidity, you receive your share of the pool in its rebalanced composition, and the total value of those tokens is less than the value you would have had if you had simply held your original deposit untouched. That shortfall is the impermanent loss. The critical insight is that it is driven entirely by how far the two tokens’ prices move relative to each other: the larger the divergence, the larger the loss, and it can occur whether the pool’s assets are rising or falling, because what matters is the change in the price ratio between them, not the direction.
The reason it is called impermanent is that the loss is only on paper as long as you stay in the pool; if the prices happen to return to the ratio at which you deposited, the loss disappears. It becomes a permanent, realized loss only at the moment you withdraw while the prices are still diverged. This is why impermanent loss is best understood not as money stolen from you but as an opportunity cost, the gap between what your pooled position is worth and what holding the tokens would have been worth.
A worked example with real numbers
Numbers make the concept click, so consider a concrete example. Suppose you want to provide liquidity to an Ether and dollar-stablecoin pool, and at the time you deposit, Ether is worth $1,600. Following the standard 50-50 split, you deposit 1 Ether and $1,600 of the stablecoin, for a total deposit worth $3,200. The pool now holds your tokens alongside everyone else’s, governed by the constant product formula.
Now suppose the price of Ether rises to $2,000 on the wider market. Arbitrageurs will buy Ether from the pool because it is briefly cheaper there, until the pool’s price catches up to $2,000. This rebalancing means the pool now holds less Ether and more of the stablecoin than before, and your share reflects that new mix. When you withdraw, you receive, say, an amount of Ether and stablecoin that together is worth less than if you had just held your original 1 Ether and $1,600.
Had you simply held, your 1 Ether would now be worth $2,000 and your stablecoin still $1,600, totaling $3,600. Your pooled position, after the rebalancing, might be worth around $3,500. That roughly $100 gap, before counting any fees, is the impermanent loss: the cost of having provided liquidity rather than held.
As a rule of thumb, when the price ratio between the two tokens doubles, the impermanent loss is around 5.7%, and the loss grows as the divergence grows. The example shows the unsettling truth that you can be up in dollar terms, since your position rose from $3,200 to $3,500, and still have lost relative to the simpler choice of holding.
How to calculate impermanent loss
For those who want to move beyond intuition to a precise figure, impermanent loss can be calculated with a standard formula, and understanding it helps demystify the phenomenon. The common estimator depends only on the price ratio, written as r, which is the ratio of the token pair’s price at the time of withdrawal to its price at the time of deposit.
The formula is:
Impermanent Loss = (2 × √r ÷ (1 + r)) − 1
The result is a negative percentage representing how much worse the liquidity position performed compared with simply holding the assets.
Using the doubling example:
- r = 2
- √2 ≈ 1.414
- 2 × 1.414 ≈ 2.828
- 2.828 ÷ 3 ≈ 0.943
- 0.943 − 1 ≈ -0.057
This equals an impermanent loss of approximately 5.7% before fees.
The formula also confirms several useful observations:
- If r = 1, meaning prices have not changed relative to one another, impermanent loss is zero.
- As r moves further away from 1, the loss increases.
- The formula depends on relative price movement, not whether prices rise or fall.
Many online calculators can perform this calculation automatically, but understanding the formula and remembering the 5.7% loss when prices double provides a useful mental shortcut when evaluating liquidity pools.
How fees and rewards offset the loss
Impermanent loss is only half the story, because liquidity providers are not giving their tokens away for nothing; they earn in return, and whether a position is profitable depends on the balance between what they earn and what they lose.
The primary source of earnings is trading fees. Every time a trader swaps against the pool, they pay a fee, and that fee is distributed to the liquidity providers in proportion to their share of the pool. In an active pool with heavy trading volume, those fees accumulate and can offset, or more than offset, the impermanent loss, leaving the provider with a net profit.
This is the entire economic proposition of providing liquidity: you accept the risk of impermanent loss in exchange for a stream of fee income, and you come out ahead when the fees exceed the loss.
Many protocols sweeten the deal further with additional token rewards, distributing their own governance or incentive tokens to liquidity providers on top of the trading fees, a practice often called yield farming or liquidity mining. These rewards can substantially boost returns and are frequently used by new protocols to attract liquidity. Some protocols also offer explicit impermanent loss protection, a form of insurance that partially reimburses providers for losses, typically funded by token emissions or a reserve pool, though the terms and caps vary.
The crucial point, however, is that the offsets are not guaranteed to win. Research on real pools has found that for a large share of liquidity providers, in some major pools, more than half, the impermanent loss actually exceeded the trading fees they earned, meaning they would have been better off simply holding.
This is the sobering reality behind the passive-income pitch: the fees are real, but so is the loss, and in volatile pools, the loss can swallow the fees. The honest way to approach liquidity provision is to weigh the expected fee income against the likely impermanent loss for a given pair before committing, instead of assuming the fees will automatically make it worthwhile.
How to limit your exposure
Because impermanent loss is driven by price divergence, the most effective ways to limit it all come down to choosing pairs whose prices move together, and understanding the trade-offs involved. The single most powerful technique is to provide liquidity to stablecoin pairs, such as a $1 stablecoin paired with another.
Because both tokens are pegged to the same dollar value, their prices barely diverge, which means the impermanent loss is close to 0. The trade-off is that such pools typically generate lower fee income, since they attract less volatile trading, but for a provider whose priority is avoiding impermanent loss, stablecoin pairs are the safest choice.
A related approach is to use pairs of assets that are closely correlated or pegged to each other, such as a token and its wrapped equivalent, where the two are designed to hold the same value and therefore experience essentially no divergence.
Beyond pair selection, some automated market makers allow providers to deposit in ratios other than the standard 50-50, or to concentrate their liquidity within a chosen price range, which can change the risk profile, though concentrated liquidity can also intensify impermanent loss if the price moves outside the chosen range.
Researching the historical volatility and price correlation of a potential pair before committing, and running the numbers through an impermanent loss calculator under different price scenarios, lets a provider find a pair that fits their risk tolerance.
The overarching principle is straightforward: the more the two tokens in a pool can move apart in price, the greater the impermanent loss risk, so providers who want to minimize that risk favor pairs that stay close in value, while those willing to accept more risk in pursuit of higher fees go in with clear eyes about the trade-off. There is no way to eliminate impermanent loss entirely on volatile pairs, but there are clear ways to manage and reduce it.
Risks and common mistakes
Beyond the mechanics, a few risks and recurring mistakes are worth flagging directly, because they are where liquidity providers most often get hurt. The most common mistake is treating advertised yields as guaranteed profit.
A pool may advertise an attractive annual yield from fees and rewards, but that headline figure does not account for impermanent loss, which can quietly erode or exceed it, so the real return can be far lower or even negative. Anyone evaluating a pool should mentally subtract the likely impermanent loss from the advertised yield to get a truer picture.
A second mistake is providing liquidity to highly volatile or uncorrelated pairs without appreciating the risk. The greater the price divergence between the two tokens, the larger the impermanent loss, so pairing a stablecoin with a volatile small-cap token, or two unrelated volatile tokens, exposes a provider to potentially severe losses if one moves sharply.
A third risk is withdrawing at the wrong moment, since impermanent loss only becomes permanent on withdrawal; pulling liquidity while prices are heavily diverged locks in the loss, whereas waiting, if the prices later converge, can reduce or erase it, though there is no guarantee they will.
Underlying all of this is the smart contract risk inherent in any decentralized finance protocol, since the pool is governed by code that could contain bugs or be exploited, a risk entirely separate from impermanent loss but always present.
The disciplined approach is to understand that providing liquidity is an active risk decision, not a passive income button: choose pairs deliberately, account for impermanent loss when judging returns, and recognize that the convenience of earning fees comes with a genuine cost that, in volatile pools, can outweigh the reward.
Frequently Asked Questions
What is impermanent loss in simple terms?
It is the opportunity cost you incur when you deposit tokens into a decentralized exchange’s liquidity pool and end up with less value than if you had simply held those tokens in your wallet. It happens because the pool automatically rebalances as the two tokens’ prices diverge, leaving you with more of the token that fell and less of the one that rose. It is called impermanent because the loss reverses if prices return to their starting ratio, and it only becomes a real, permanent loss when you withdraw your liquidity while the prices are still diverged.
Why does impermanent loss happen?
It happens because of how automated market makers work. These pools use a formula, commonly the constant product formula, that keeps the pool balanced by adjusting the ratio of the two tokens as their prices move. When one token’s price rises, arbitrageurs buy it from the pool until the pool’s price matches the market, which leaves the pool, and therefore your position, holding less of the rising token and more of the falling one. When you withdraw, that rebalanced mix is worth less than your original deposit would have been if simply held. The loss is driven by how far the two prices diverge.
How is impermanent loss calculated?
A common formula is:
Impermanent Loss = (2 × √r ÷ (1 + r)) − 1
where r is the ratio between the token pair’s price at withdrawal and its price at deposit.
For example, if the price ratio doubles (r = 2), the formula produces an impermanent loss of approximately 5.7% before fees.
When the ratio remains unchanged (r = 1), impermanent loss equals zero.
As the ratio moves farther away from one, the loss increases.
Many online calculators can perform this calculation automatically, but remembering the 5.7% benchmark is useful for quick estimates.
Can you avoid impermanent loss?
You cannot eliminate it entirely on volatile pairs, but you can limit it substantially. The most effective approach is to provide liquidity to stablecoin pairs, where both tokens hold the same dollar value and barely diverge, keeping impermanent loss near 0, though such pools typically earn lower fees. Using closely correlated or pegged pairs, such as a token and its wrapped version, has a similar effect. Researching a pair’s historical volatility and correlation, and modeling scenarios with a calculator before committing, helps you choose pairs that fit your risk tolerance and avoid the worst exposure.
Does impermanent loss mean I always lose money?
No. Impermanent loss is offset by the trading fees and token rewards you earn as a liquidity provider, and a position is profitable when those earnings exceed the loss. In an active, high-volume pool, fees can more than cover the impermanent loss, leaving a net gain. However, research has found that for a large share of providers in some major pools, the impermanent loss exceeded the fees earned, meaning they would have done better simply holding. So whether you end up ahead depends on the balance between fees and loss, which is why choosing the pair and pool carefully matters so much.
What is the difference between impermanent loss and a regular loss?
A regular loss is a straightforward decline in the value of an asset you hold. Impermanent loss is an opportunity cost: it compares your pooled position against the alternative of simply having held the same tokens, and it can occur even when your position has risen in dollar terms, as long as it rose less than holding would have. It is called impermanent because it can reverse if prices return to their starting ratio, unlike a realized loss. It only becomes a permanent, realized loss at the moment you withdraw your liquidity while the token prices are still diverged from where you deposited.
This article is educational information, not financial advice. Decentralized finance involves significant risks, including impermanent loss, smart contract vulnerabilities, and the potential loss of funds. Figures and formulas are illustrative and reflect general information available as of June 26, 2026. Verify the specifics of any protocol from primary sources and consider your own circumstances before providing liquidity or making any decision.


Strategy's enterprise market-to-NAV (mNAV) ratio has crossed below 1 for the first time, as the company's combined debt, preferred stock, and equity now exceed the value of its bitcoin treasury. MSTR shares closed Thursday at $82.31, a 52-week low, amid a sustained slide in both the stock and its… Read the full story at The Defiant


Aave’s governance framework confirms that Aavenomics 3.0 is now active, with automated AAVE token buybacks running and DAO operational spending reduced, completing a governance roadmap the protocol has built toward since mid-2024. The activation follows passage of the Aavenomics Part One ARFC and… Read the full story at The Defiant

Key Takeaways
- CSCO shares declined 4.4% Friday, reaching an intraday low of $112.86, with trading volume exceeding twice the typical daily average.
- Third-quarter results surpassed expectations, delivering $1.06 earnings per share on revenue of $15.84 billion, representing 12% annual growth.
- Wall Street maintains a Moderate Buy rating with a consensus price target of $123.14; KeyCorp recently increased its forecast to $130.
- According to GuruFocus metrics, the stock appears significantly overvalued, trading 66.6% higher than its calculated fair value of $68.30.
- Recent insider transactions show approximately $7.2 million in stock sales during the past quarter, with no purchases recorded.
Shares of Cisco Systems (CSCO) experienced a significant selloff Friday, declining 4.4% and briefly touching $112.86 before settling at $113.77. The previous session ended at $118.97.
Trading activity revealed heightened investor interest. Approximately 50.1 million shares traded hands throughout the session — well over twice the standard daily average of 24 million. Such elevated volume typically signals significant market reaction to new information.
The selloff appears puzzling given the company’s recent financial performance. For its latest reporting period, Cisco delivered earnings of $1.06 per share, surpassing analyst expectations of $1.03. The networking giant generated $15.84 billion in revenue, topping forecasts of $15.56 billion and marking a 12% increase compared to the year-ago period.
Management provided forward guidance projecting Q4 2026 earnings between $1.16 and $1.18 per share, with full fiscal year 2026 estimates ranging from $4.27 to $4.29 per share.
The company announced a quarterly dividend of $0.42 per share, scheduled for payment on July 22 to shareholders registered as of July 6. This represents an annual yield of approximately 1.5%.
Wall Street Maintains Optimistic Outlook
Despite Friday’s price action, analyst coverage remains constructive. KeyCorp maintained its overweight stance while elevating its price objective to $130. Bank of America holds a buy recommendation with a $150 target. Goldman Sachs assigns a neutral rating alongside a $125 forecast. Barclays rates the shares equal weight with a $121 projection.
Across 25 covering analysts, the consensus stands at Moderate Buy, with an average target price of $123.14 — comprising two Strong Buy ratings, 15 Buy recommendations, and eight Hold ratings.
CICC Research upgraded its target to $125 with an outperform designation in May. Conversely, Zacks downgraded the stock from strong buy to hold in April.
The company commands a market capitalization of $448.42 billion, trades at a price-to-earnings multiple of 36.94, and carries a beta coefficient of 1.01. The 50-day moving average stands at $109.17, while the 200-day moving average registers $89.29.
Valuation Metrics Raise Concerns
GuruFocus presents a more cautious perspective. Its GF Value methodology calculates Cisco’s fair value at $68.30, suggesting the current market price exceeds this estimate by approximately 66.6%. This disparity results in a classification of “Significantly Overvalued.”
The stock’s present P/E ratio of 36.9x substantially exceeds its five-year median of 19.8x — representing a premium of roughly 87%.
The company achieves a GF Score of 81 out of 100, earning solid ratings for profitability (8/10) and growth (8/10), but receiving only 3/10 for valuation.
Insider transaction patterns warrant attention. During the previous three months, company insiders disposed of approximately $7.2 million worth of shares, with no documented purchases. EVP Thimaya Subaiya divested 7,127 shares on June 16 at an average price of $119.91. EVP Oliver Tuszik sold 2,607 shares on June 11 at $121.12. Both transactions occurred through predetermined Rule 10b5-1 trading arrangements.
Institutional ownership accounts for 73.33% of outstanding shares. Multiple major investment firms expanded their stakes during the fourth quarter, including Truist Financial, which maintains a position exceeding 4.3 million shares.
The stock’s 52-week trading range spans from $65.75 to $130.37, positioning Friday’s closing price toward the upper portion of this spectrum.

Key Highlights
- Citizens maintained its “Market Outperform” rating with a $100 price target for Uber (UBER)
- UBER shares surged 5.6% during Friday’s afternoon trading session, reaching approximately $75.94
- The firm highlighted expanding Waymo autonomous ride miles on Uber’s platform as a primary catalyst
- Waymo’s cumulative rider-only miles increased by 44.5 million in Q1 2026, marking a 134% year-over-year gain
- Despite recent gains, Uber trades 8.4% lower year-to-date and remains 24.1% off its 52-week peak of $100.10
Shares of Uber (UBER) rallied 5.6% during Friday’s afternoon session following Citizens’ reaffirmation of its “Market Outperform” rating alongside a $100 price objective, emphasizing robust expansion linked to Waymo’s increasing presence on Uber’s platform.
At the time of publication, the stock was changing hands at $75.94, representing a 24.1% discount from its 52-week peak of $100.10 reached in October 2025. Year-to-date, Uber shares have declined 8.4%.
The Citizens research team emphasized Waymo’s “rider-only miles” — journeys completed in Alphabet’s self-driving vehicles accessible through the Uber application — as a significant positive indicator. During Q1 2026, Waymo accumulated an additional 44.5 million rider-only miles compared to the previous quarter, representing a 14% sequential increase and a 134% jump from the prior year.
However, the pace of expansion has moderated. During Q4 2025, Waymo’s mileage expanded 40% quarter-over-quarter and 157% year-over-year, indicating a noticeable deceleration. Citizens pointed to supply limitations as Waymo moves from its fifth-generation Jaguar I-PACE fleet to its sixth-generation Ojai vehicles. Public rider trips in the Ojai commenced in May 2026.
Geographic Distribution Changes for Waymo
San Francisco and Los Angeles represented approximately 55% of Q1 2026 mileage, declining from 62% in Q4 2025. Atlanta appeared in the reporting data for the first time, accounting for 11% of Q1 miles. Additional markets such as Houston, San Antonio, and Orlando have yet to appear in Waymo’s published figures.
Citizens observed that these statistics likely underrepresent actual activity, as emerging markets divert capacity from mature locations while Waymo continues operating under supply constraints.
This wasn’t the sole positive development for UBER during the week. Just two days prior, shares advanced 5.8% after Uber announced the addition of five new retail collaborators to the Uber Eats platform — Kiehl’s, FedEx Office, Blick Art Materials, Academy Sports + Outdoors, and Choice Pet.
Additional Positive Developments
On that same trading day, Tigress Financial Partners elevated its price objective on UBER to $115. A regulatory disclosure revealed that U.S. Representative Nancy Pelosi initiated a new bullish position on Uber using long-dated call options. Additionally, Uber unveiled plans with partner WeRide to introduce a commercial robotaxi operation in Zurich, marking its second planned European market entry.
Regarding competitive positioning, Wells Fargo research indicated that Uber’s delivery platform experienced a modest 1% reduction in product pricing and consumer fees — differing from DoorDash, which increased fees by 21% while decreasing product prices by 4%.
Lime, the electric scooter and bicycle sharing company, identified Uber as an anchor investor in its forthcoming IPO.
Investors who allocated $1,000 to Uber five years ago would currently hold approximately $1,486.

Tether has expanded the use of its $23 billion gold reserves by bringing its tokenized product Tether Gold (XAUT) to crypto lender Ledn.
Ledn said it is adding support for XAUT, alongside bitcoin and Tether’s stablecoin USDT, with borrowing against XAUT expected later this year.
Tether is attempting to monetize what has become one of the world’s largely privately held gold reserves. The stablecoin company says it holds around $23 billion worth of physical bullion backing XAUT, with each token representing one troy ounce of gold stored in vaults in Switzerland.
Gold-backed lending is traditionally the realm of central banks, major financial institutions and bullion dealers. Tether and Ledn argue that by tokenizing physical gold, the asset can function more like physical bitcoin as digital collateral, unlocking liquidity without having to sell it.
This follows the model Ledn has used for bitcoin-backed loans for several years. Client collateral continues to be held 1:1, without being lent out or used to generate yield, Ledn said, seeking to draw a line between the services it offers and those of its former rivals that went to the wall in the crypto winter of 2022.

Michael Saylor and Strategy weren’t focused on the right features of bitcoin and how to build their own strategy around it, which is now hurting the overall cryptocurrency market, said Ripple’s CEO, Brad Garlinghouse.
In a recent interview with CNBC, he doubled down that the long-term value of a certain asset is its utility, not just speculative products made to accumulate it, referring to Strategy’s STRC.
They Hurt the Market
Ever since Strategy conducted its first BTC sale in four years by the end of May, it has become a hot topic of discussion within the cryptocurrency community despite its subsequent purchases, which were a lot larger. The latest to weigh in on the matter was Ripple’s CEO, who noted that Strategy’s purchases had “added some excitement on the way up and now that’s compounding on the way down as well.”
He focused on STRC, the company’s Stretch stock, which is used to raise funds by promising high yields, and deploy the proceeds to accumulate more bitcoin. Although Saylor has refrained from calling it leverage, Garlinghouse believes that’s exactly what it is, and the market has started to see how it can compound negatively when BTC’s price corrects.
STRC continues to trade 25% below its par price of $100, which Garlinghouse believes is a “pretty damning indictment, and I don’t think it has helped the market.” He added that creating long-term value should be the company’s focus, while “financial engineering” doesn’t.
“Long-term value of any digital asset is going to be driven by utility. If it’s solving a problem at scale for real customers, you are going to see liquidity, you are going to see demand, you are going to see trust in that asset. Those things compound in a positive way.”
He concluded that he remains bullish on bitcoin and believes investors should be greedy in the current market environment, given the asset’s 50%+ correction from its October 2025 top.
XRP in Focus
After commenting on how BTC should act as digital gold and how much easier it would be to move funds with Bitcoin rather than the precious metal, Garlinghouse turned his attention to Ripple’s native cross-border token and its utility. He explained that XRP’s utility is focused on payments and “leveraging the speed and efficiency of that blockchain for institutions.”
He added that the company has seen “tremendous demand” by clearing $16 trillion in payments in 2025 alone in the prime brokerage business, probably through acquisitions.
“Ripple’s strategy from the beginning has been how to bring traditional finance into the modern architecture of blockchain. And now, through some acquisitions, we have a tremendous opportunity to bring that in.”
The post Ripple CEO Praises XRP, Questions Strategy’s Impact on Bitcoin and Crypto appeared first on CryptoPotato.
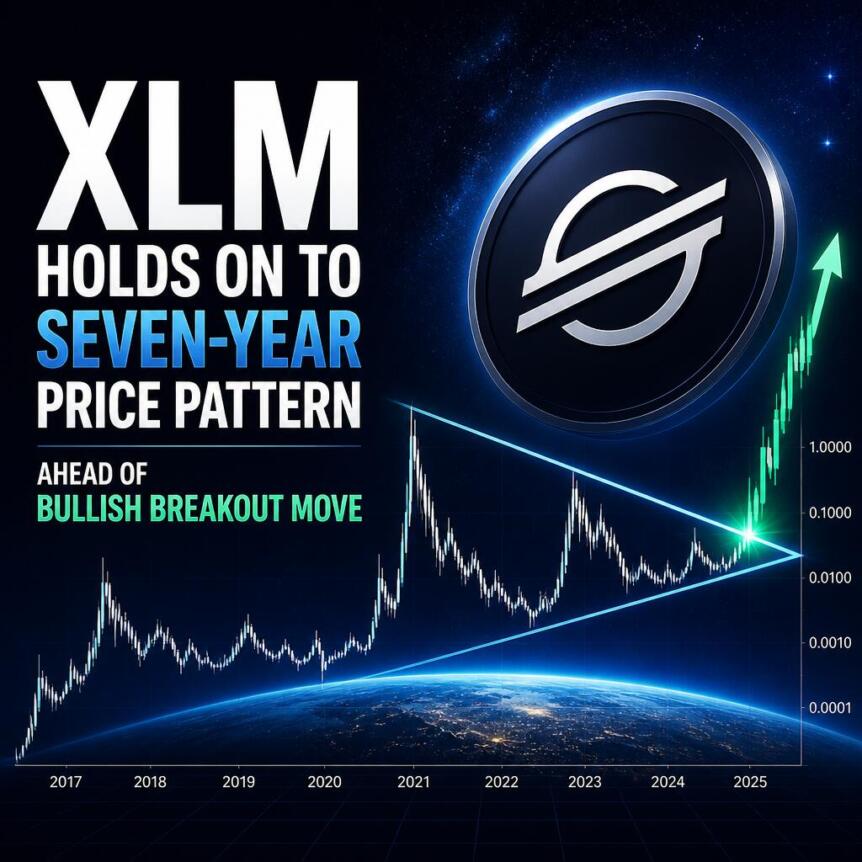
The Stellar cryptocurrency (XLM) has once again started catching the eyes of crypto market analysts due to its long-term market price structure that appears to mimic past price action in previous market cycles.
Despite negative market sentiment and persistent bearishness in the altcoin market, technical analysts claim that XLM is headed toward a major accumulation price level that has historically been seen just before a strong rally. Though there has not been a breakout yet, some analysts see the possibility of the asset being on the verge of its third major price expansion phase.
XLM Reverts to a Common Area for Accumulation
According to CoinMarketCap, XLM is currently trading at $0.17, falling more than 2% in the past 24 hours and around 20% in the last seven days. In spite of the recent dip in prices, the digital coin continues to show positive gains from a monthly perspective.
In one analysis, an analyst argues that XLM has reverted back to the common area from where all previous cycles of macro expansion have commenced. He views the current pattern as positive rather than bearish, since it appears to be another period of accumulation in preparation for a fresh move up. Nevertheless, the most important thing is that the breakout has not happened yet.
Bullish Trend Based on Long-Term Compressions
The current technical setup is the result of consolidation seen for several months, which is more typical of an accumulation pattern compared to distribution. In past market cycles, XLM has spent long periods consolidating in narrow ranges ahead of significant volatility to the upside.
The weakness of selling pressure and the compression of price volatility are two factors that often precede explosive price moves after breaking above resistance.
Rather than exhaustion, the present technical setup seems to illustrate a growing balance between buyers and sellers competing inside a range. With a eventual takeover by buyers, a breakout could spark fresh momentum.
Resistance Levels That Will Define the Future Rally
In the event of a breakout by XLM, analysts have pinpointed key resistance levels that will help define the rally in the next bull phase. The initial target will be to recapture the heights seen early in 2025. Moving above those levels could foster more bullish sentiment and participation.
Moving further, technical analysts see $0.80 as the next key liquidity point, which was the peak level from the last cycle. Breaking above this resistance may shift focus toward the psychologically important $1 level. Though these resistance levels may seem speculative, they align with historical market patterns observed during past expansion phases.
Price Memory Has Been Consistent for Seven Years
One technical analyst highlights one of the most notable aspects of the XLM price chart: its consistent respect for price memory over the past seven years. Across many market cycles, the XLM price chart has repeatedly halted at the same level of historical resistance points before moving higher. Instead of just randomly trading through price levels, the asset continues to show consistency in treating certain points as key checkpoints in its journey upward.
This behavior supports the belief that historical market psychology still impacts XLM’s price movement. The analyst states that XLM is currently consolidating near the bottom end of its trading range. As long as the asset can breach the first resistance level at $0.35, then the path toward $0.63 becomes much clearer for XLM.
Will XLM Make History Once More
As with most aspects of investing and trading, past performance is no indication of future results. However, past price action can provide insight into investor psychology. The respect that XLM continues to show for key historical support and resistance areas creates a roadmap that has been tracked by numerous traders.

Key Takeaways
- GameStop has doubled down on its pursuit of eBay following the online marketplace’s dismissal of its approximately $56 billion combined cash-and-stock proposal
- The unsolicited offer was initially presented by CEO Ryan Cohen in May, with the rationale that a merged entity would pose stronger competition against Amazon
- The company indicated that “additional materials regarding the proposed transaction are forthcoming”
- GME shares finished Friday’s session up 3.57% at $21.76, followed by an additional 1.96% gain to $22.19 during after-hours activity
- The retailer anticipates adjusted EBITDA exceeding $600 million for fiscal 2026, representing substantial growth from the $345.4 million recorded in fiscal 2025
GameStop is refusing to walk away from its ambitious acquisition plans.
The video game specialty retailer submitted a regulatory disclosure on Friday reinforcing its determination to pursue eBay, despite the online auction platform’s previous rejection of the unsolicited proposal. GME shares ended Friday’s regular trading session with a 3.57% gain at $21.76, and continued climbing an additional 1.96% during extended trading hours to $22.19.
The proposal, initially put forward in May by CEO Ryan Cohen, places eBay’s valuation at approximately $56 billion — representing a target roughly five times GameStop’s current market capitalization. eBay turned down the offer during the same month it was presented.
GameStop’s Friday regulatory submission was concise. The filing noted that the “leadership team remains focused on advancing the proposed acquisition of eBay” and confirmed that “additional materials regarding the proposed transaction are forthcoming.” Neither a specific timeline nor fresh details were disclosed.
Earlier in the week, GameStop had committed to releasing a comprehensive presentation outlining the strategic justification and operational blueprint for the potential merger. That promised presentation remains unreleased.
Cohen’s rationale has remained unwavering: combining both platforms would establish a more formidable competitor to Amazon. He has additionally indicated his intention to personally lead the merged organization.
eBay declined to provide comment when contacted on Friday.
Financial Performance and Projections
Alongside the acquisition status update, GameStop provided shareholders with its fiscal 2026 financial outlook. The organization forecasts adjusted EBITDA surpassing $600 million for fiscal 2026, representing nearly double the $345.4 million figure achieved in fiscal 2025.
Earlier this month, GameStop announced its most profitable quarterly performance on record — delivering net income of $389.6 million against revenue of $835.3 million, marking a 14% year-over-year improvement.
This financial momentum appears to support Cohen’s acquisition strategy. A more robust balance sheet provides GameStop with enhanced credibility when pursuing an acquisition target as substantial as eBay.
Nevertheless, prediction market platform Polymarket currently assigns just 16% probability to the deal’s completion, with potential shareholder dilution representing a primary concern among doubters.
Looking Ahead
GameStop has not yet published the comprehensive presentation it committed to delivering earlier this week.
The retailer has not clarified what structure a revised offer might assume, or whether it intends to bypass eBay’s board and appeal directly to eBay shareholders.
Currently, the regulatory submission represents the full extent of GameStop’s public stance — a clear declaration that the acquisition proposal remains under consideration, with additional information pending.
GameStop currently holds a 96th percentile ranking for Growth based on Benzinga Edge Rankings, notwithstanding negative performance across short, medium, and long-term investment horizons.

JAPAN JUST BROKE COMPLETELY… THE XRP RESET IS HAPPENING! (THIS IS INSANE!)

United Airlines flight has near-collision with drone while landing at Newark Airport

US close to allowing Anthropic to restore Fable 5 model, Axios reports


-

 Entertainment7 days ago
Renter of Home in Anne Heche Crash Denies Settlement With Son
-
 Sports4 days ago
Two goals and an assist by sheer aura: Cristiano Ronaldo just entered the World Cup chat
-

 Tech5 days ago
Microsoft accidentally kills epic Outlook email threads
-

 Fashion22 hours ago
Weekend Open Thread: Staud – Corporette.com
-

 Business7 days ago
Soccer-U.S. defends Iran World Cup travel restrictions, says discussions ongoing
-

 Politics1 day ago
The House | Manchesterism won’t survive the painful trade-offs unless it gets citizens on board
-

 Politics2 days ago
Potential 2028er World Cup attendee leaderboard
-

 Business1 day ago
Asia stock markets slide as tech shares slump
-

 Tech2 days ago
A Look At A Gaggle Of Transputer Boards
-
Crypto World4 days ago
Bitcoin (BTC) Dips Below $62K, Ethereum (ETH) Plunges 6% Daily: Market Watch
-

 Crypto World3 days ago
Securitize Wraps Roubini's SEC-Registered ETF as Dubai VARA Digital Security
-
 Crypto World2 days ago
Dell (DELL) Shares Tumble Over 5% Following Analyst Downgrade to Hold
-
Business4 days ago
Entergy settles forward sale agreements, raises $672 million in cash proceeds
-

 Sports19 hours ago
FIH Pro League: India defeat Pakistan 7-1, register biggest win of campaign | Other Sports News
-

 Crypto World11 hours ago
Kraken's xStocks Opens Bending Spoons IPO Registration to EEA Retail
-

 Crypto World23 hours ago
RTX holders must register wallets before token distribution begins
-
 Crypto World1 day ago
Hyperliquid Named on Singapore MAS Investor Alert Register
-

 Sports2 days ago
India vs Bangladesh LIVE Score, Women’s T20 World Cup: Bangladesh Opt To Bat; India Enter ‘Do-Or-Die’ Stage As Semi-Final Race Heats Up
-
 Tech6 days ago
Signal’s Meredith Whittaker says AI chatbots ‘are not your friends’ and calls Copilot agents a backdoor
-
Crypto World1 day ago
The DATA Foundation Launches to Tackle AI’s Multi-Billion Dollar Training Data Bottleneck
You must be logged in to post a comment Login