
Crypto World
Morgan Stanley Emerges as Crypto Exchange Rival via Crypto Pilot

Morgan Stanley has rolled out a cryptocurrency trading pilot on its E*Trade platform, charging lower basic retail fees than some of the largest US crypto and brokerage platforms.
The Wall Street bank is charging clients 50 basis points on the dollar value of each crypto transaction, undercutting Coinbase, Robinhood and Charles Schwab on standard retail pricing, according to a Tuesday Bloomberg report.
The offering is currently in pilot mode, with E*Trade’s 8.6 million clients expected to gain access later this year, Bloomberg reported.
The pilot illustrates how major Wall Street firms are moving further into crypto trading as they compete with exchanges and fintech platforms for retail trading revenue. Still, Kraken Pro, Binance US and some Coinbase Advanced tiers offer lower fees for crypto traders.
A spokesperson for Morgan Stanley confirmed to Cointelegraph that the details and fee structure described in the Bloomberg report were accurate.
The latest crypto push by the bank comes about a month after Morgan Stanley launched a spot Bitcoin ETF (MSBT) that recorded $30.6 million in inflows on its first day of NYSE Arca trading.
Related: Crypto VC funding plunges to $659M in April, hits near two-year low
Wall Street giants venture into crypto trading
Morgan Stanley is not the only major financial institution expanding its crypto products for retail or institutional clients.
Charles Schwab, one of the largest US brokerage firms, announced the launch of spot Bitcoin and Ether trading for retail clients less than a month ago, Cointelegraph reported on April 16. The offering launched with a 75 basis points per transaction fee.
Goldman Sachs also filed with the US Securities and Exchange Commission in April to launch the Goldman Sachs Bitcoin Premium Income ETF, a proposed fund that would generate income by selling call options on Bitcoin exchange-traded products rather than investing directly in Bitcoin.
Earlier Wall Street crypto infrastructure efforts include BNY Mellon’s digital asset custody platform, which went live in the United States in October 2022 and allowed select clients to hold and transfer Bitcoin and Ether.
Magazine: Bitcoiners eye ‘sell in May,’ SBF’s bid for new trial shut down: Hodler’s Digest, April 26 – May 2


Key points:
- Bitcoin is expected to face selling at $84,000, but a shallow pullback increases the likelihood of an upside breakout.
- Several major altcoins are showing strength at lower levels, but the bears are expected to pose substantial challenges at the resistance level.
Bitcoin (BTC) rallied above $82,800 on Wednesday, but bulls were unable to hold the higher levels. However, a positive sign for the bulls is that BTC exchange-traded funds recorded $1.63 billion in net inflows in May, according to SoSoValue data. That suggests investors are building positions as they anticipate the uptrend to continue.
Analyst PlanC said in a post on X that BTC was about to enter its first supercycle, which began at the bear-market low of $16,000 in Nov. 2022. He expects BTC to rise above $250,000 in the second half of 2027 to the first half of 2028.

Crypto market data daily view. Source: TradingView
Not everyone is convinced that the bear market is over. Crypto investment company TradingShot said in a post on X that BTC’s rejection at the 200-day simple moving average ($83,313), which coincides with the previous low acting as target objective of $50,000.
Could BTC and the major altcoins break above their overhead resistance levels? Let’s analyze the charts of the top 10 cryptocurrencies to find out.
Bitcoin price prediction
BTC has been gradually rising toward the $84,000 level, indicating sustained buying by the bulls.
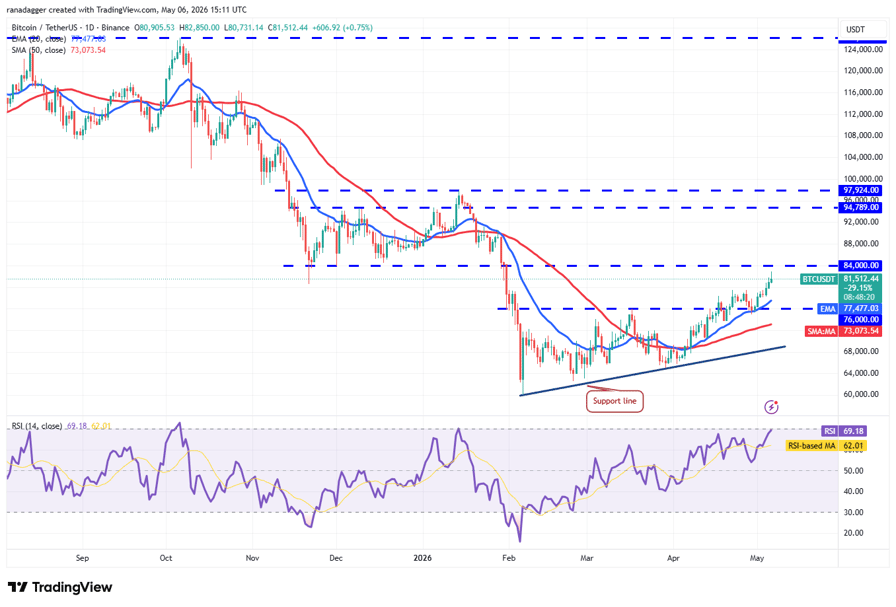
BTC/USDT daily chart. Source: Cointelegraph/TradingView
Sellers are expected to fiercely defend the $84,000 level, which could trigger a pullback toward the 20-day exponential moving average ($77,477). If the BTC price rebounds off the 20-day EMA with force, it signals a positive sentiment. That improves the prospects of a break above the $84,000 level. If that happens, the BTC/USDT pair may ascend to $92,000.
This bullish view will be invalidated in the near term if the price turns down and breaks below the $74,937 level. The pair may then decline to the 50-day SMA ($73,073) and later to the support line.
Ether price prediction
Ether (ETH) has been trading above its moving averages, but the bulls have failed to break $2,465 resistance.
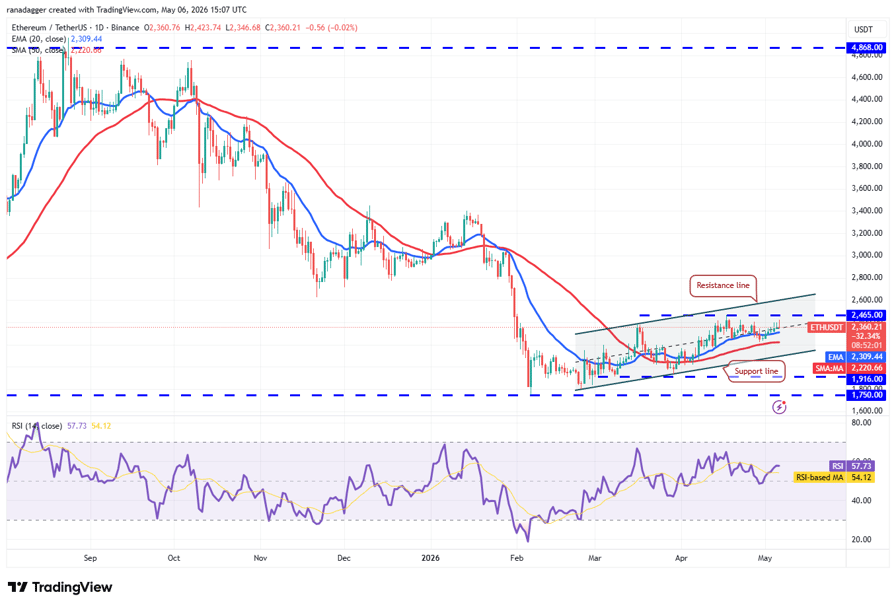
ETH/USDT daily chart. Source: Cointelegraph/TradingView
That suggests hesitation to buy aggressively at higher levels. Sellers will attempt to seize control by pulling the price below the moving averages. If they do that, the ETH/USDT pair may descend to the support line.
Buyers are likely to have other plans. They will attempt to maintain the ETH price above the 20-day EMA ($2,309) and overcome the resistance at that level. If they succeed, the pair may rally to $3,050.
XRP price prediction
XRP (XRP) closed above the moving averages on Tuesday, opening the gates for a rally to the downtrend line of the descending channel pattern.
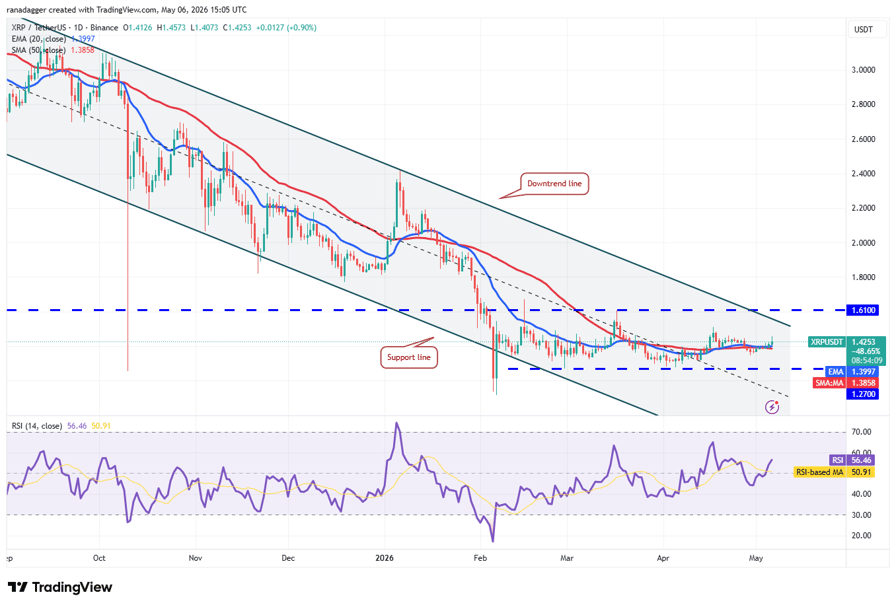
XRP/USDT daily chart. Source: Cointelegraph/TradingView
The downtrend line has acted as a stiff obstacle during previous recovery attempts and may do so again. If the price reverses from the downtrend line and breaks below the $1.27 level, it suggests the XRP/USDT pair may remain within the channel for a few more days.
On the other hand, a close above the downtrend line and the $1.61 resistance signal a potential trend change. The XRP price may then skyrocket to $2 and then to $2.40.
BNB price prediction
BNB (BNB) closed above the moving averages on Tuesday, indicating that the bulls are back in the game.
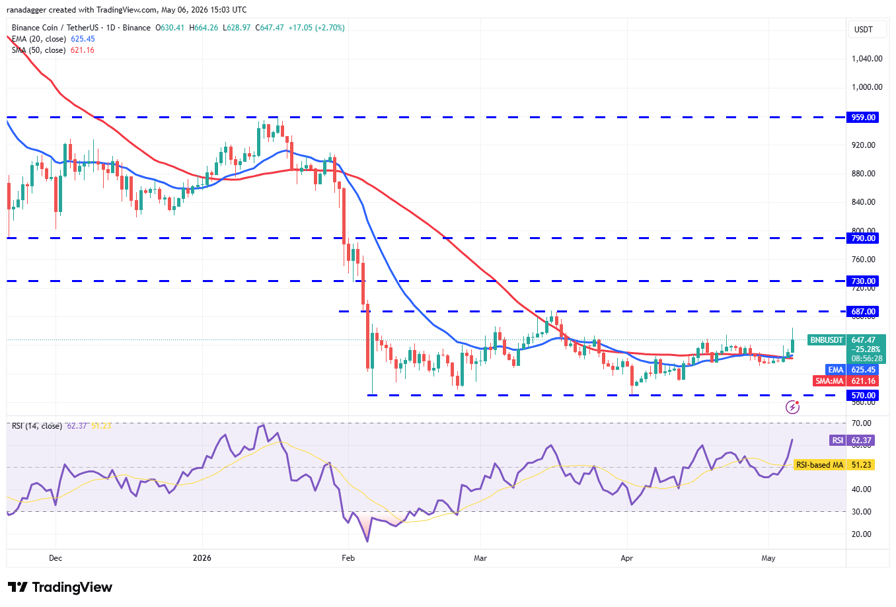
BNB/USDT daily chart. Source: Cointelegraph/TradingView
Buyers are attempting to overcome the minor resistance at $654. If they can pull it off, the BNB/USDT pair may reach $687. Sellers are expected to defend the $687 level with all their might, as a close above it could clear the path for a rally to $730 and, subsequently, to $790.
Conversely, if the BNB price turns sharply lower from the overhead resistance and breaks below the moving averages, it signals that the pair may continue its range-bound action between $570 and $687 for some time.
Solana price prediction
Solana (SOL) broke above the moving averages on Tuesday and rallied close to the $90.73 overhead resistance on Wednesday.
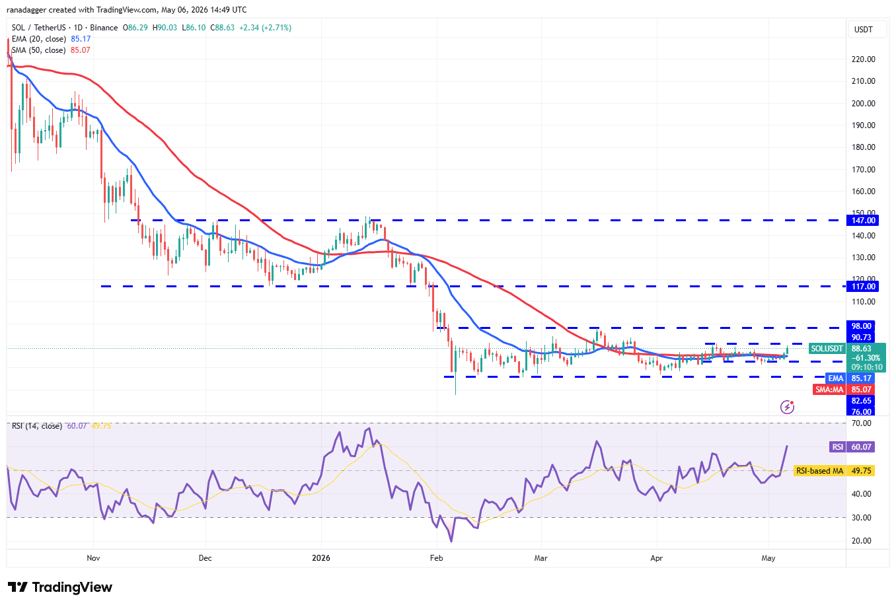
SOL/USDT daily chart. Source: Cointelegraph/TradingView
The flattish moving averages and the RSI in the positive territory indicate a slight edge to the bulls. If the $90.73 level is scaled, the SOL/USDT pair may rally to the stiff overhead resistance at $98. Sellers are expected to vigorously defend the $98 level, as a close above it may propel the SOL price to $117.
Instead, if the price turns down and breaks below the moving averages, it suggests the pair may remain within the $76 to $98 range for a few more days.
Dogecoin price prediction
Dogecoin (DOGE) continued its march toward the $0.12 resistance level, where sellers are expected to step in.
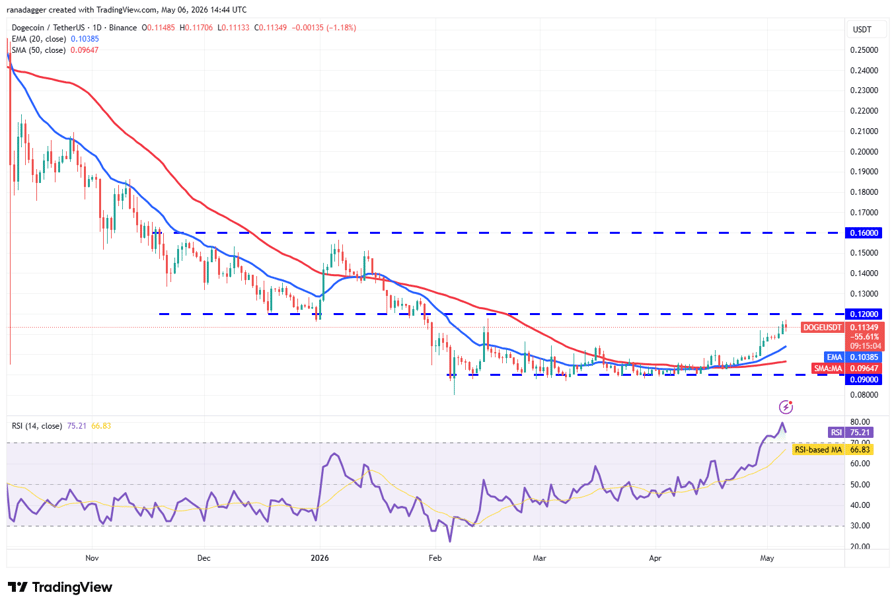
DOGE/USDT daily chart. Source: Cointelegraph/TradingView
A shallow pullback from the $0.12 level suggests that the bulls are not hurrying to close their positions. That increases the possibility of an upside breakout. If the $0.12 resistance level is broken, the DOGE/USDT pair may jump to $0.14 and then to $0.16.
Alternatively, if the DOGE price turns sharply lower and breaks below the 20-day EMA ($0.10), it suggests that bears are aggressively defending the $0.12 level. That may retain the pair inside the $0.09 to $0.12 range for a while.
Hyperliquid price prediction
Hyperliquid (HYPE) charged higher on Tuesday, but the up move is facing resistance in the $43.76 to $45.77 zone.
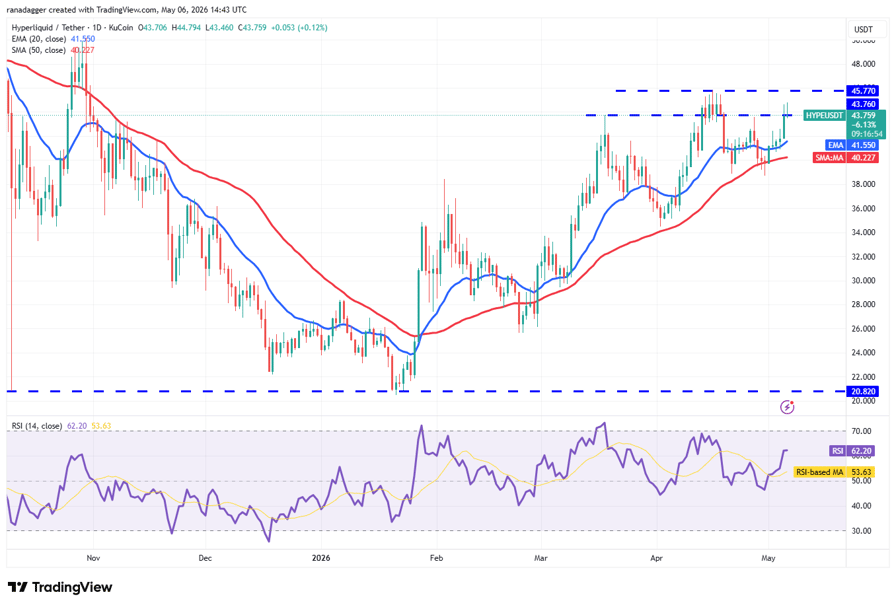
HYPE/USDT daily chart. Source: Cointelegraph/TradingView
The 20-day EMA ($41.55) has started to turn higher, and the RSI is in positive territory, indicating that the path of least resistance is higher. If buyers pierce the $45.77 level, the HYPE/USDT pair may soar to $50.
The 50-day SMA ($40.22) is the critical support to watch out for on the downside. A break and close below the 50-day SMA suggests that the bulls have given up. The HYPE price may then tumble to $34.45.
Related: Zcash price may hit $800 as $2.7B hedge fund reveals ‘significant position’ in ZEC
Cardano price prediction
Cardano (ADA) cleared the 50-day SMA ($0.25) hurdle on Tuesday, indicating that the bulls are attempting a comeback.
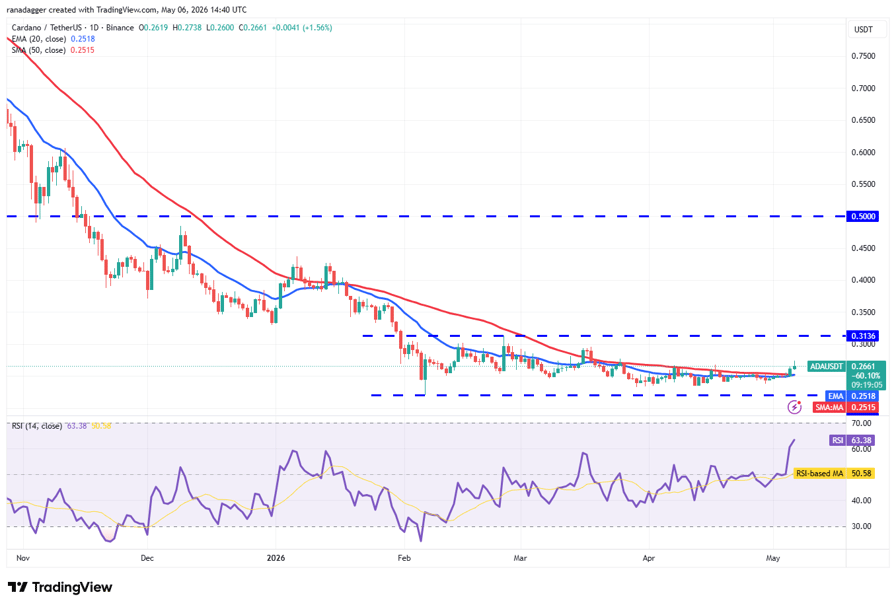
ADA/USDT daily chart. Source: Cointelegraph/TradingView
The recovery attempt is expected to face selling pressure at $0.28, then at $0.30. If both levels are breached, the next target is likely $0.31, a critical resistance to watch. A break above $0.31 signals the start of a potential new up move.
This positive view will be negated in the near term if the ADA price turns down and breaks below the moving averages. That suggests the bears continue to sell on rallies. The ADA/USDT pair may then slump to the solid support at $0.22.
Bitcoin Cash price prediction
Bitcoin Cash (BCH) turned up from the $443 support on Tuesday and broke above the moving averages.
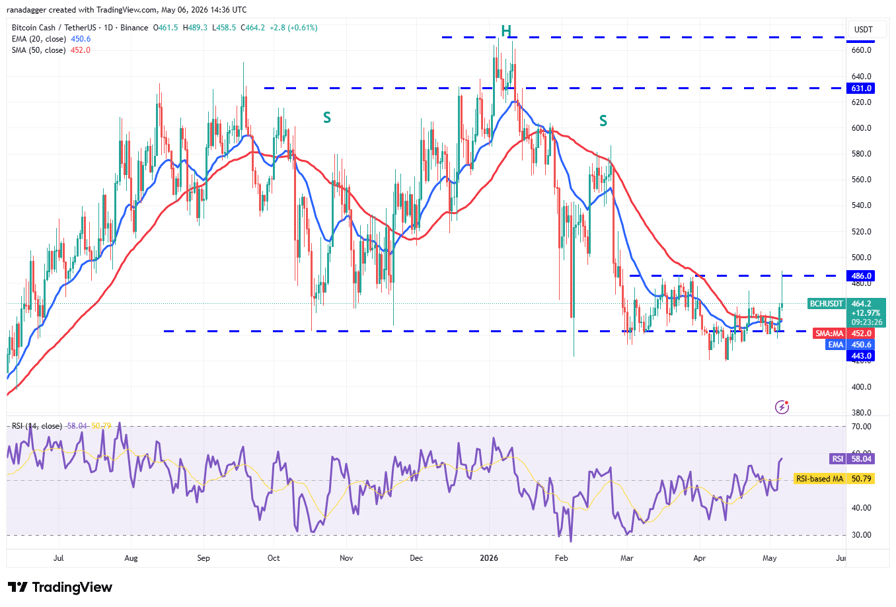
BCH/USDT daily chart. Source: Cointelegraph/TradingView
Buyers continued their buying and pushed the BCH price to $486 on Wednesday. However, the long wick on the candlestick shows that the bears are active at higher levels. That suggests the BCH/USDT pair may remain inside the large $486 to $419 range for a few more days.
Buyers will be back in the driver’s seat if they push the price above the $486 resistance and sustain it. That opens the gates for a rally to $520.
Zcash price prediction
Zcash (ZEC) turned up from the 20-day EMA ($389) on Thursday and rose above the $560 resistance on Wednesday.
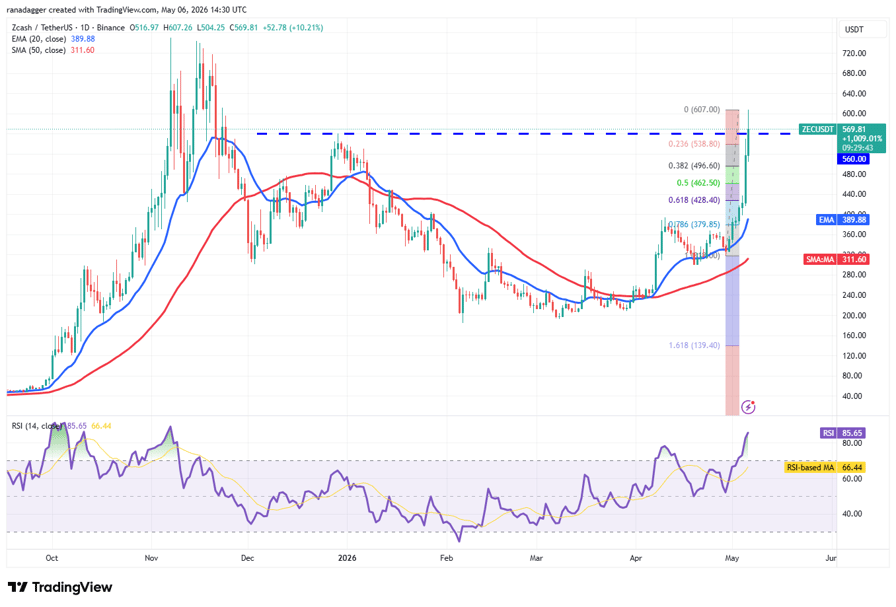
ZEC/USDT daily chart. Source: Cointelegraph/TradingView
The sharp rally over the past few days has pushed the RSI into overbought territory, signaling the possibility of a near-term consolidation or pullback. A shallow pullback from the current level suggests that the bulls are holding their positions as they anticipate the uptrend continuing. That increases the likelihood of a rally to the formidable resistance at $750.
A risk to the continuation of the up move is that sharp rallies are followed by equally sharp pullbacks. If the ZEC price maintains below $560, the ZEC/USDT pair may drop to the 38.2% Fibonacci retracement level of $496 and then to the 50% retracement level of $462.


BitMEX co-founder Arthur Hayes says his target for Zcash is 10% of Bitcoin’s price, arguing ZEC’s latest rally is early innings despite mounting pressure on privacy coins.
Summary
- BitMEX co-founder Arthur Hayes said his upside target for Zcash (ZEC) is 10% of Bitcoin’s price.
- Hayes argued on X that ZEC’s current rally “still has a lot of room for growth.”
- The call comes as privacy coins remain under regulatory pressure but periodically see sharp speculative moves.
BitMEX co-founder Arthur Hayes has set an aggressive upside target for privacy coin Zcash, telling followers on X that his “target price for ZEC is 10% of the BTC price.” In the same post, Hayes added that the current uptrend “still has a lot of room for growth,” signaling he believes the recent move in ZEC is just the early phase of a larger cycle.
While Hayes did not publish a full valuation model alongside the remark, the 10% anchor implies a substantial potential upside relative to current market levels. If Bitcoin were trading at $90,000, for example, a 10% ZEC/BTC ratio would suggest a ZEC price near $9,000; at $70,000 BTC, it would point to about $7,000 per ZEC. For context, Zcash’s all‑time high in late 2016 briefly spiked above $3,000 on thin order books before settling into a range that has mostly been under $1,000 for years.
Hayes has long been known for making bold macro and altcoin calls, frequently using his personal X account and essays to lay out high‑conviction, high‑volatility trades. His latest ZEC comment fits that pattern, leaning into a narrative that privacy‑focused assets could see renewed demand if regulatory surveillance ramps up or if Bitcoin’s transparent ledger becomes a liability for certain users.
The timing is notable. Privacy coins like Zcash and Monero have faced delistings on several major centralized exchanges in recent years amid anti‑money‑laundering scrutiny, even as on‑chain usage has persisted in more niche venues. That regulatory overhang makes sustained institutional inflows into ZEC less likely in the near term, but it has not stopped sharp, speculative spikes whenever market sentiment swings back toward high‑beta plays.
Hayes’s 10% of BTC target is not a consensus view among analysts, and he did not specify a timeframe for when he expects ZEC to reach that level. But for traders who track his calls, the message is clear: in his view, the current ZEC move is far from exhausted, and the coin’s upside, relative to Bitcoin, remains significant if the right mix of narrative, liquidity, and risk appetite comes together.

An exterior view of the U.S. Securities and Exchange Commission (SEC) headquarters in Washington.
Jonathan Ernst | Reuters
Prediction markets traders are confident the Securities and Exchange Commission will change its rules governing how often companies must report financial statements to shareholders, to semiannually from quarterly, following a formal proposal by regulators on Tuesday.
Opinion is more divided, however, as to when it will happen.
After the proposal was disclosed Tuesday, odds on the Kalshi prediction market that regulations will be eased by April 2027 surged to 73% from 46%.
Chances of faster approval, by next Jan. 1, initially jumped to 67%, fell to about 50-50 and recently stood at about 57% odds.
Approval by January 2027 would mark an unusually quick turnaround in the SEC’s rulemaking process.
Before final commission debate, the proposal is subject to a 60-day public comment period. After that, commissioners may alter the proposal’s structure based on public feedback, but the comment period only starts once the proposed rule is posted to the Federal Register.
A 2023 analysis by law firm Wilson Sonsini showed that the Register can take between a few days and up to a month to post the proposed rule, with longer timelines usually coming when a proposal is over 100 pages. The proposed SEC rule on semiannual reporting comes to 279 pages.
According to the SEC’s index of rulemaking activity, the recent timeline between proposed rules and their final adoption is typically at least a year, and in some cases, years.
On Polymarket, traders are giving a 51% chance that the SEC ends mandatory quarterly reporting in 2026.
In other words, traders are making a big bet that the commission will work faster than its history suggests in changing the requirements for financial reporting by companies.
Disclosure: CNBC and Kalshi have a commercial relationship that includes customer acquisition and a minority investment.
Markets shift and headlines fade, but the core principles of building long-term wealth remain constant. Join us for our third CNBC Pro LIVE, where investors of all backgrounds – from financial professionals to everyday individuals – come together to cut through the noise and gain actionable strategies for smarter, more disciplined investing. No matter where you’re starting from, you’ll leave with clearer thinking, stronger strategies. Enter your email here to get a discount code

Standard Chartered has been recognised with two major awards by The Banker, highlighting the growing importance of Islamic finance across global banking markets.
The international banking group was named “Islamic Bank of the Year” and also received the “Most Innovative Sukuk” award for its role in ADNOC’s debut international sukuk issuance.
The recognition reflects increasing momentum in the Islamic finance sector, which continues expanding across the Middle East, Asia, and Africa as demand grows for Shariah-compliant banking, investment, and capital market solutions.
According to industry projections referenced by the bank, global Islamic finance assets are expected to reach approximately $7.5 trillion by 2028, representing one of the fastest-growing segments in international finance.
Khurram Hilal, CEO of Islamic Banking at Standard Chartered, said the sector is evolving beyond domestic markets as affluent investors and institutions increasingly seek cross-border Islamic finance opportunities.
The bank stated that its Islamic finance platform supports a wide range of clients, including affluent individuals, corporations, and institutional investors, with services spanning wealth management, financing, liquidity solutions, and sukuk structuring.
Sukuk markets in particular have seen increasing institutional demand in recent years as governments, sovereign wealth funds, and major corporations across the Gulf region continue diversifying funding sources and attracting international investors.
The awards also underline the UAE’s broader ambition to strengthen its position as a leading global hub for Islamic finance and Shariah-compliant capital markets.
Narrow Legislative Window Raises Pressure
Ripple CEO Brad Garlinghouse said CLARITY Act urgency has increased as Congress faces a tight timeline. He pointed to a short window in the Senate that could decide the bill’s progress.
He stated that lawmakers must act within two weeks or risk delay. Election cycles often slow legislative work. As a result, CLARITY Act urgency now defines the current policy environment for digital assets.
Garlinghouse noted that the recent Senate movement offers some progress. However, he stressed that momentum may not hold. Political priorities could shift quickly and push the bill aside.
Regulatory Clarity Remains Central Issue
The proposed law aims to define how regulators oversee digital assets. Industry participants have long requested such clarity after years of mixed enforcement actions.
Garlinghouse highlighted that CLARITY Act urgency reflects broader industry concerns. Companies operating in the United States still face unclear regulatory boundaries. This uncertainty affects compliance planning and investment decisions.
Ripple and similar firms continue to allocate resources toward legal strategy. Without clear rules, firms must adjust to evolving interpretations from multiple agencies. CLARITY Act urgency underscores the need for consistent guidelines.
Market Attention and Potential Impact
Market participants have started to monitor the bill closely. Some analysts link future price movements of major tokens to regulatory developments tied to the legislation.
In that context, CLARITY Act urgency has entered broader market discussions. Investors view potential passage as a factor that could support institutional adoption. However, these expectations remain conditional.
Garlinghouse also warned that delays could extend uncertainty. If the bill stalls, companies may continue to face fragmented oversight. This situation could maintain volatility tied to regulatory headlines.
The current outlook remains uncertain. CLARITY Act urgency highlights both opportunity and risk. While progress exists, the timeline leaves limited room for delay.
Ripple ($XRP) CEO Brad Garlinghouse just issued a stark warning on the CLARITY Act: if the Senate Banking Committee markup slips in the next two weeks, the bill’s chances fall ‘precipitously.’ pic.twitter.com/0WA1tTBgsG
— Wizzy (@WizzyOnChain) May 6, 2026


BTC hit an intraday high of $82,800, even as Strategy’s chairman opened the door to selling Bitcoin to fund preferred dividends.
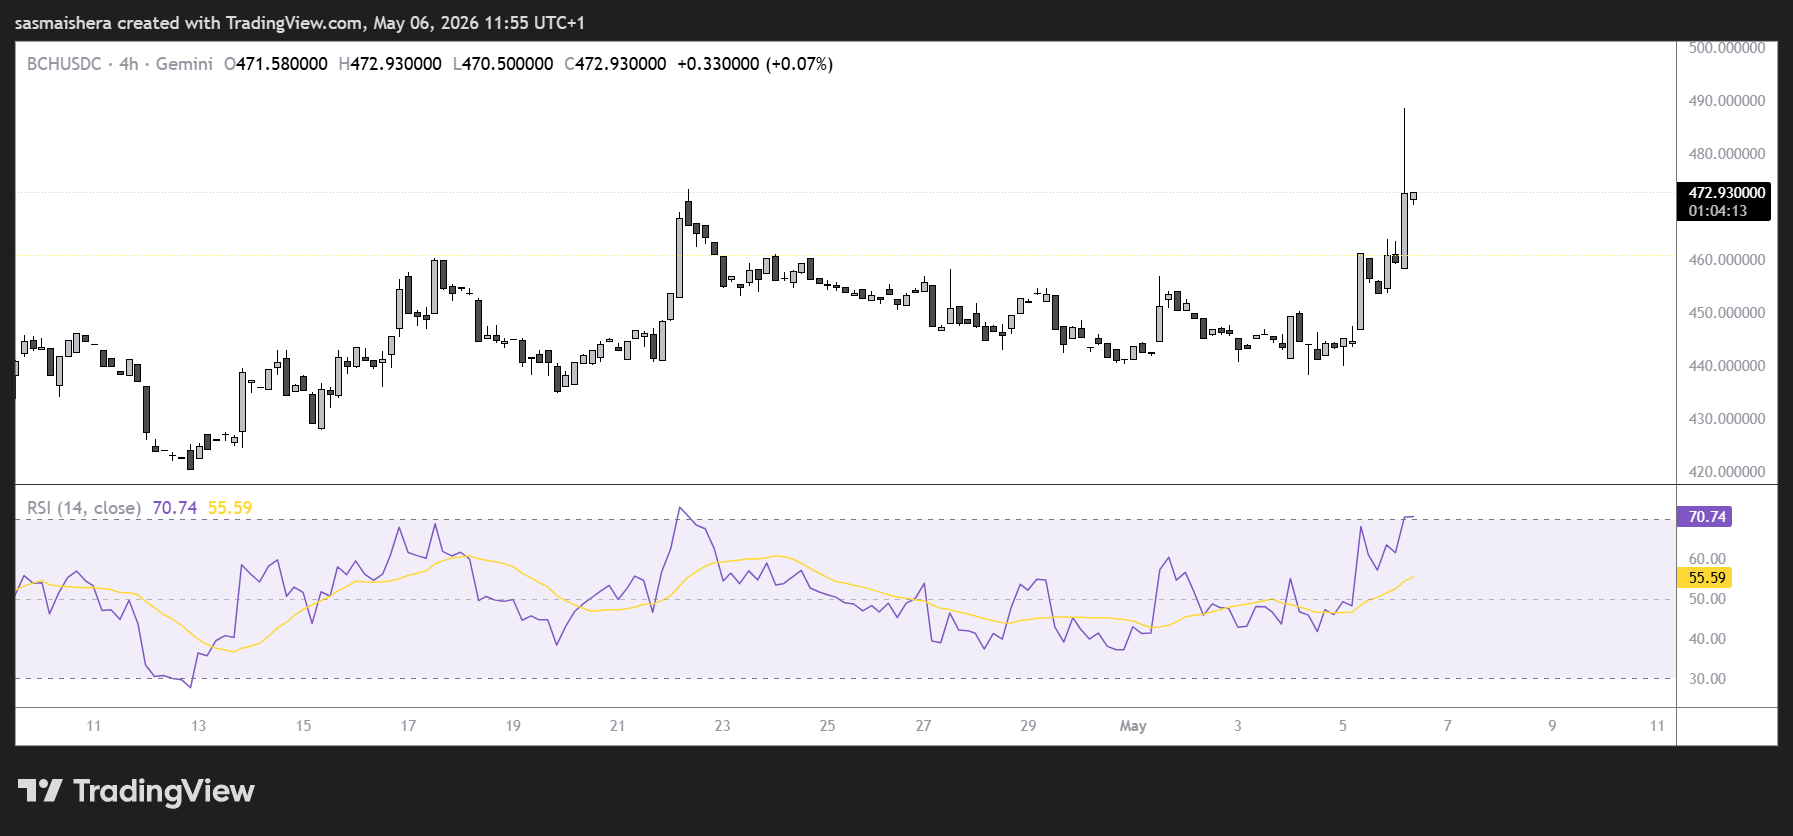
Bitcoin Cash (BCH) continued its strong recovery on Wednesday, climbing above $489 and extending weekly gains beyond 8% as bullish positioning across the derivatives market reinforced the ongoing rally.
The broader crypto market backdrop remains supportive, with Bitcoin (BTC) holding near the $82,000 level, while technical indicators suggest BCH could be preparing for a breakout above the psychological $500 barrier.
Bullish derivatives activity strengthens BCH outlook
According to CoinGlass data, Bitcoin Cash futures Open Interest (OI) jumped to $683.83 million on Wednesday from roughly $642 million recorded on Sunday.
The increase in Open Interest signals fresh capital entering the market, typically reflecting growing trader participation and stronger buying activity that could further support BCH’s upward momentum.
Additional derivatives data also point to strengthening bullish sentiment. CoinGlass shows BCH’s long-to-short ratio rising to 1.25 on Wednesday, marking its highest level in more than a month. A ratio above one indicates that a larger share of traders are positioning for additional upside.
Meanwhile, CryptoQuant data presents a largely constructive outlook for Bitcoin Cash despite some mixed signals. The platform’s summary metrics highlight increased whale activity across spot and futures markets alongside cooling market conditions, both of which historically support upside continuation.
However, persistent sell-side dominance in the spot market could limit the pace of the rally and create short-term volatility near key resistance levels.
Technical outlook: BCH bulls target rally above $500
Bitcoin Cash trades near $489.60 after breaking above several important technical levels. The token now holds comfortably above the 50-day Exponential Moving Average (EMA) at $457.91 and the 100-day EMA at $478.47, reinforcing the bullish structure following the breakout above a former descending trendline near $449.56.
Momentum indicators continue to favor buyers. The Relative Strength Index (RSI) on the 4-hour chart has climbed toward 70, approaching overbought territory but still signaling strong bullish momentum.
At the same time, the Moving Average Convergence Divergence (MACD) remains firmly in positive territory and continues to expand, suggesting buying pressure remains dominant.
On the upside, immediate resistance is located near the 200-day EMA at $497.05. A decisive daily close above that level could open the door for a push toward the 38.2% Fibonacci retracement level at $515.06.
Beyond that, bulls may target the 50% retracement near $544.56, followed by the 61.8% Fibonacci level around $574.07 if momentum accelerates.

On the downside, immediate support sits near the confluence zone between $478.47 and $478.55, where the 100-day EMA aligns with the 23.6% Fibonacci retracement level.
Additional support is found at the 50-day EMA near $457.91, while the former breakout trendline around $449.56 could attract renewed dip-buying interest during deeper pullbacks.
Ethereum accumulation addresses witnessed a surge in daily inflows on Wednesday, suggesting growing confidence in Ether’s (ETH) long-term price trajectory following its latest rise to $2,400.
Key takeaways:
- Accumulation addresses absorbed about $592 million in ETH on Wednesday, signalling aggressive long-term buying.
- Ether’s ascending triangle projects an ETH price rally to $3,315.
Ethereum accumulators add $592 million in ETH
Ether’s investor confidence has returned following its 39% recovery from a multi-year low below $1,750.
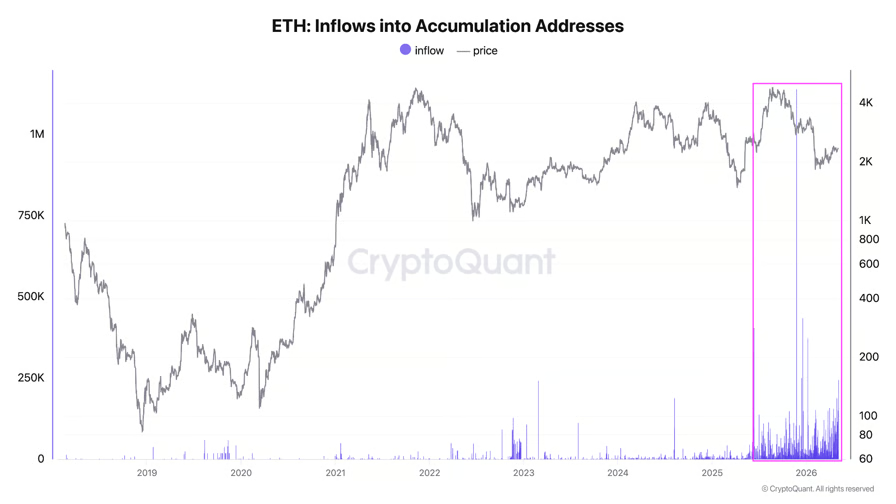
Data from CryptoQuant showed daily inflows into accumulation addresses have increased steadily since mid-2025, reaching an all-time high of 1.14 million ETH in November 2025. The inflows have continued to climb in 2026, averaging 200,000 ETH per day.
These addresses received 246,620 ETH on Tuesday, worth approximately $592 million at current rates.

ETH inflows into accumulation addresses. Source: CryptoQuant
Accumulation addresses are wallets that continuously receive ETH without making any outgoing transactions. They may belong to long-term holders, institutional investors, or entities strategically accumulating Ethereum rather than actively trading it.
As a result, the total ETH held by these long-term holders reached a record 25 million ETH, marking a 20.36% jump so far in 2026.
Large spikes in inflows to these addresses often signal strong confidence in Ether’s long-term potential, with past trends showing that such surges frequently precede price rallies.
For example, on June 22, 2025, Ethereum accumulation addresses recorded a daily inflow of over 380,000 ETH. Nearly 30 days later, ETH’s price rose by almost 85%. A similar price rally followed November 2025’s inflow spike into the accumulation addresses.
Whale wallets are also showing bullish signals. The chart below shows that whale wallets with a balance of 10,000-100,000 ETH have seen their holdings rise to an all-time high of over 19.5 million tokens, after rapid accumulation over the last 30 days.
Wallets with over 100,000 ETH have also increased their holdings to 4.7 million ETH, a 30% increase in 2026.
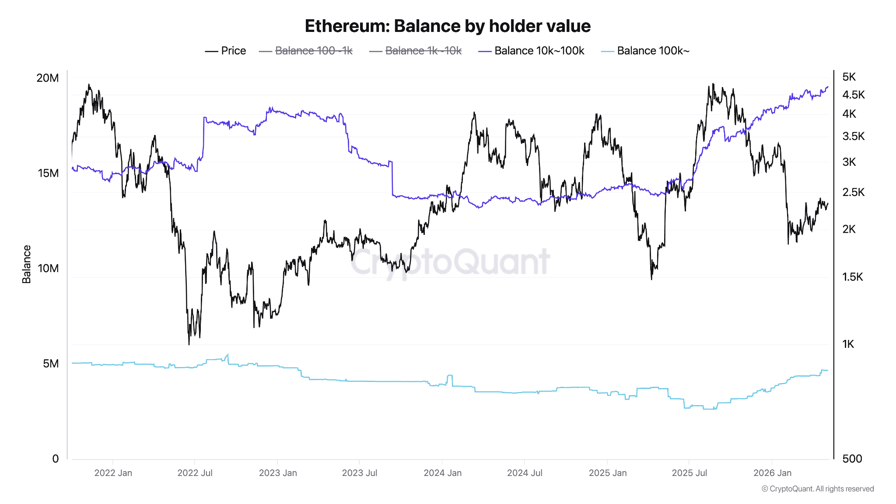
Ethereum: Balance by holder value
As Cointelegraph reported, Ether’s spot taker cumulative volume delta, which has been increasing since early April, also suggested growing confidence among buyers.
How high can the ETH price go?
Ether’s liquidation heatmap shows the price eating away liquidity around $2,400, with large bid orders still sitting at $3,000, and between $3,350 and 3,500.
“If $ETH breaks through $2,500, a steady rise to $3,000 will follow,” crypto analyst CW8900 said in a Wednesday post on X, adding:
“There is almost no resistance for short positions.”
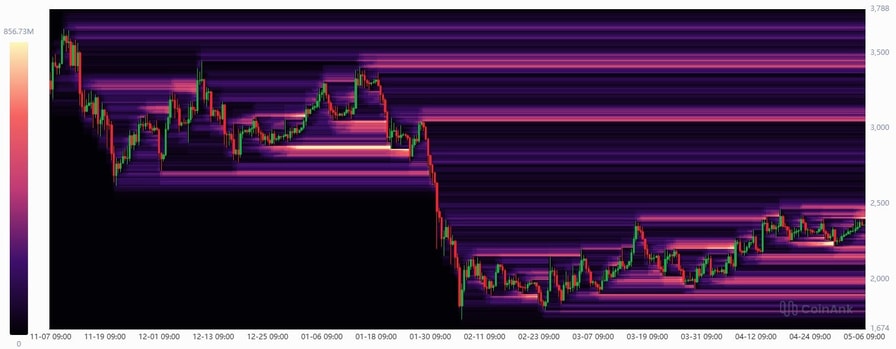
ETH liquidation heatmap. Source: CoinGlass
From a technical perspective, the ETH/USD pair is seeking to break above the horizontal trend line of an ascending triangle at $2,400.
A daily candlestick close above the 200-day exponential moving average at $2,700 will confirm the continuation of the uptrend toward the measured target of the triangle at $3,315. Such a move would bring the total gains to 40%.
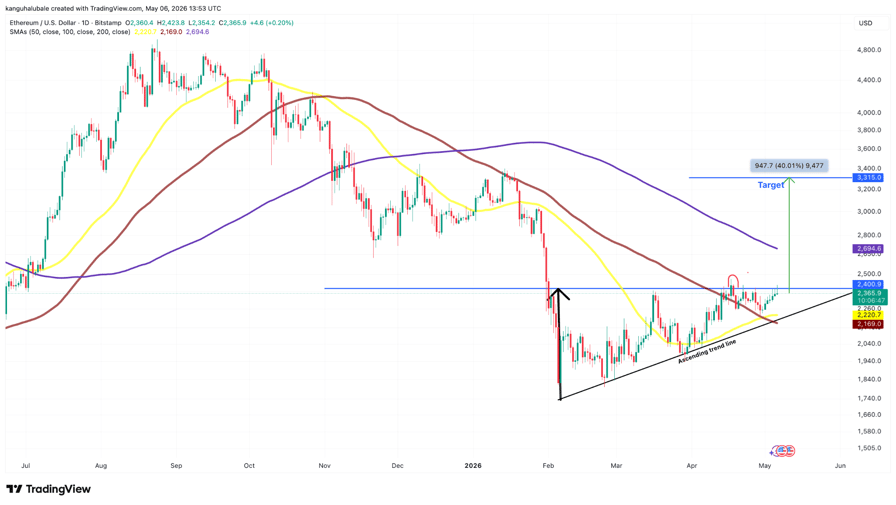
ETH/USD daily chart. Source: Cointelegraph/TradingView
Technical analyst XForceGlobal shared a chart suggesting that Ether’s macro bottom could be in, with an Elliott Wave analysis projecting a rally to $3,500 once resistance at $2,600-$2,700 is broken.
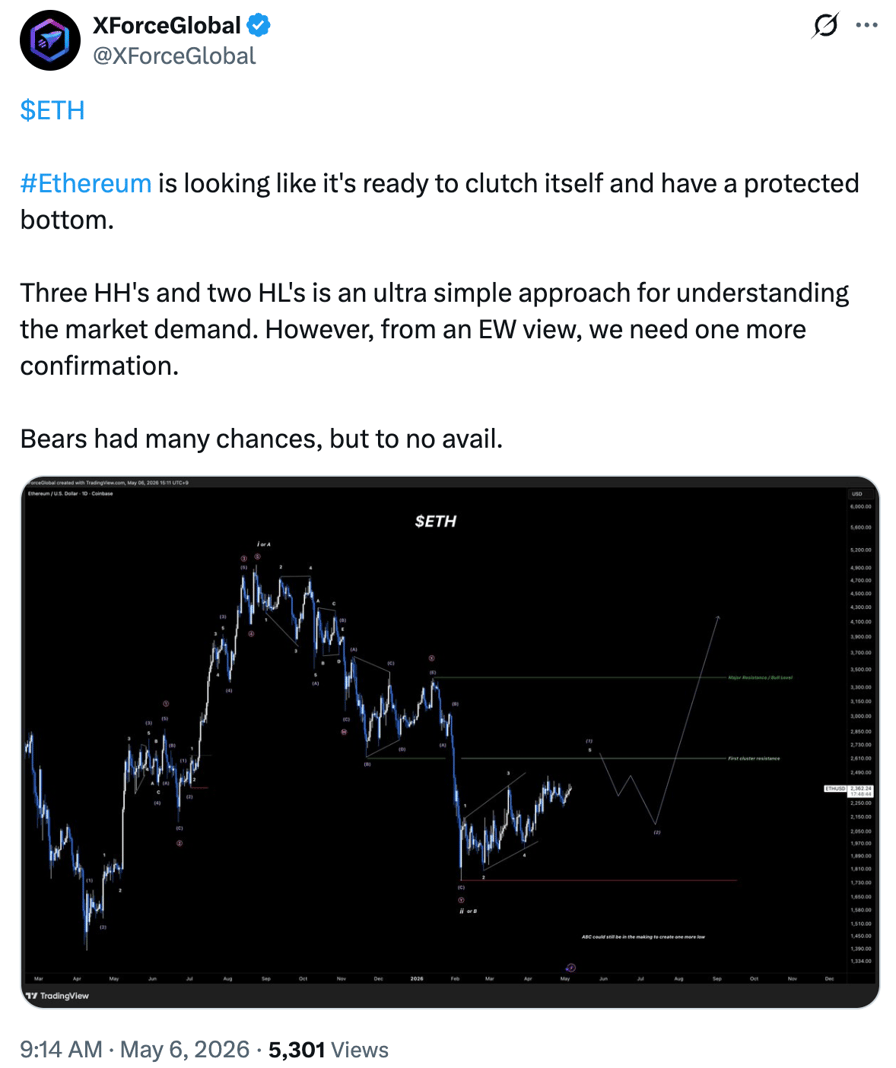
ETH/USD daily chart. Source: XForceGlobal
As Cointelegraph reported, a close above the $2,600-$2,700 region would confirm a trend change, paving the way for the ETH/USD pair to rally toward $3,000.
Crypto World
Bermuda pushes stablecoin payments with USDC airdrop as it courts crypto firms, regulators

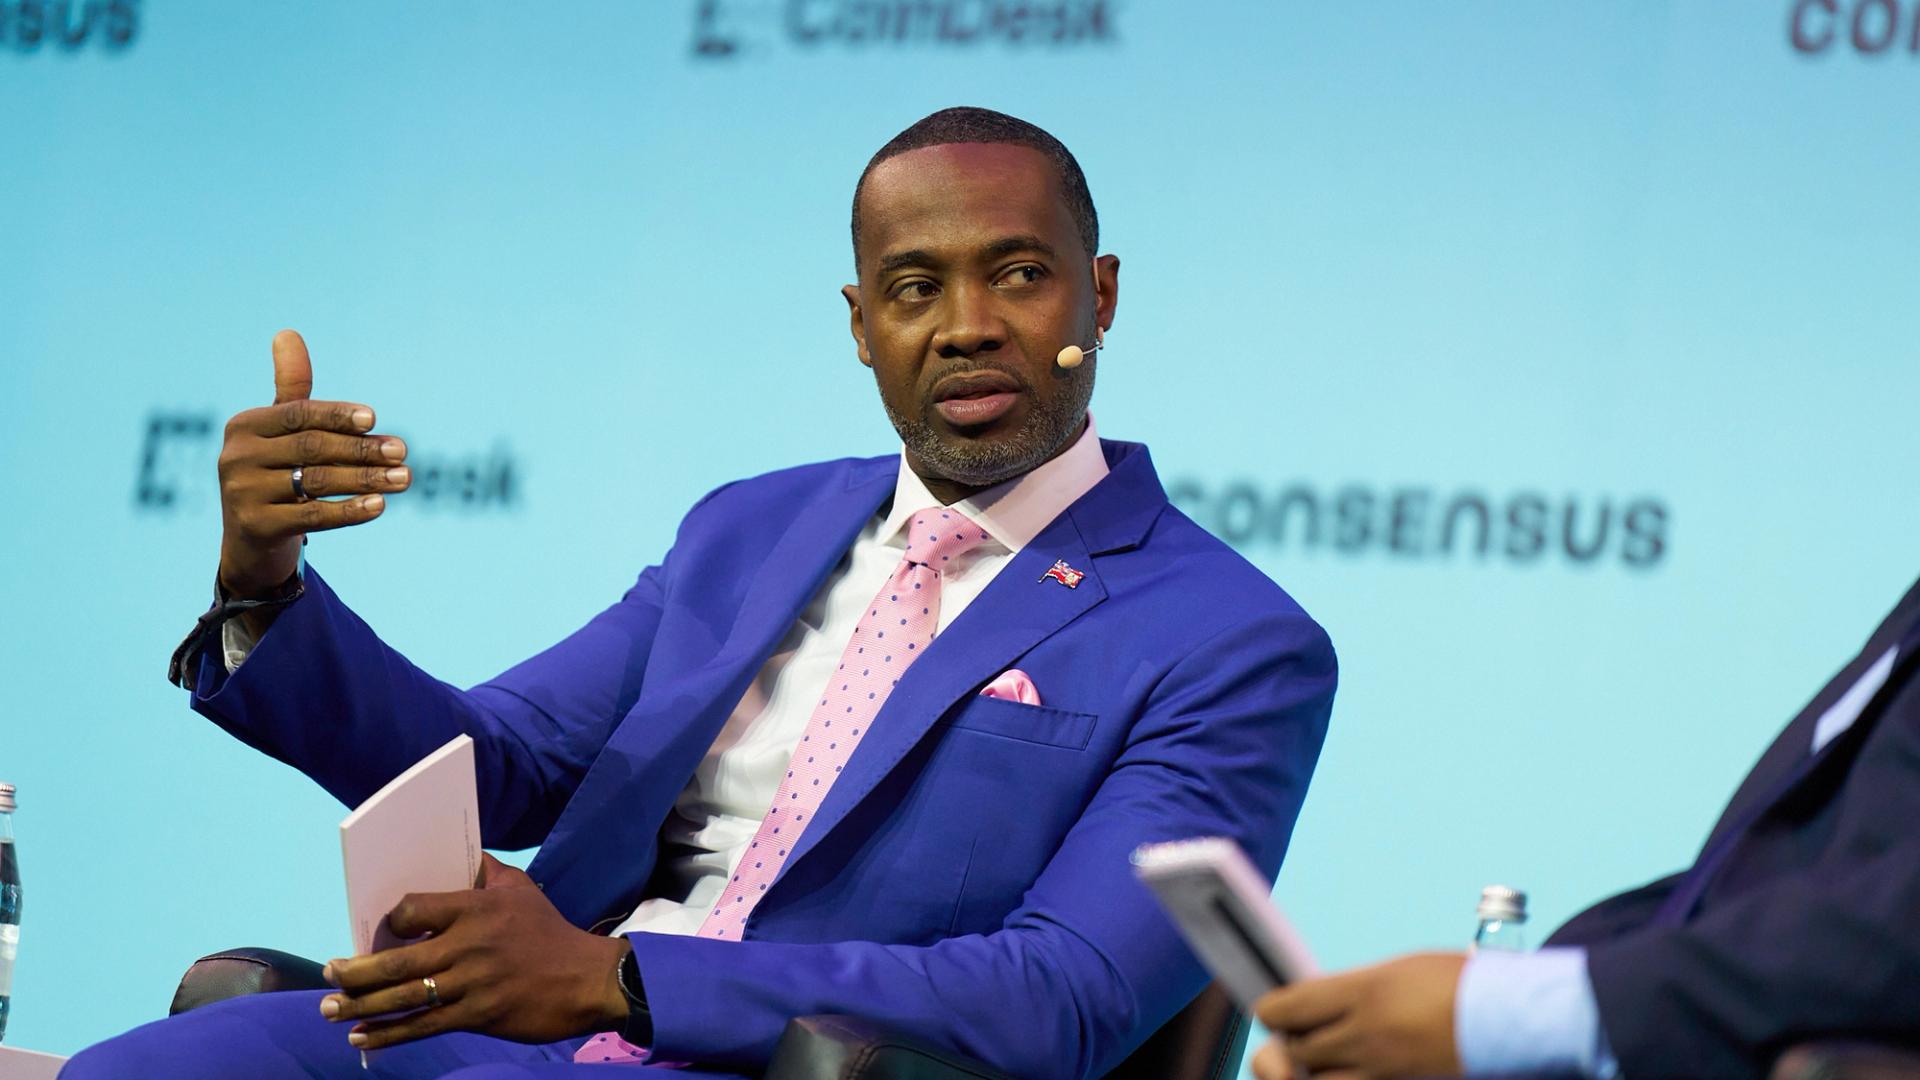
Bermuda is aiming to show an example how to move crypto into everyday commerce without breaking the financial system, Premier David Burt said onstage at Consensus Miami 2026 on Wednesday.
Burt said the tiny island on the Atlantic is expanding its “onchain economy” initiative, a push to get stablecoins into the hands of residents, merchants and local businesses. The project was first announced in January at the World Economic Forum, with stablecoin issuer Circle (CRCL) and exchange Coinbase (COIN).
The government plans another airdrop of USDC stablecoin this year, tied to next week’s Bermuda Digital Finance Forum 2026, while also onboarding merchants that can accept digital payments. Participants will receive stablecoins through wallets and can spend them with local vendors, Burt said.
“If you are a vendor and you’re accepting digital assets, but you do not have a way to use and spend those digital assets inside your economy, that presents a problem,” Burt said.
The broader goal for Bermuda is to build payment infrastructure outside traditional card networks and banking rails, he said, arguing that small businesses face high transaction fees and limited access to financial apps common in larger markets.
Coinbase Chief Legal Officer Paul Grewal, who joined Burt on stage, said Bermuda’s approach stands out because regulators and private firms are building in tandem instead of working separately.
“What’s most interesting about the Bermuda example is it is a parallel process,” Grewal said. “Government services can be accessed using payment stablecoins, while merchants and businesses are brought into the system at the same time.”
Bermuda, Burt said, has spent years building a digital asset framework through its Digital Asset Business Act. He described the island’s regulatory style as iterative and industry-facing, with the Bermuda Monetary Authority working directly with firms on issues such as staking, lending and DeFi supervision.
“You cannot regulate out failure,” Burt said. “But you can put in place the items which allow responsible innovation to happen.”
Grewal also contrasted Bermuda’s approach with the regulatory climate crypto firms faced in the U.S. over the past several years under former Securities and Exchange Commission (SEC) Chair Gary Gensler. That has changed for the better under the Trump administration, he argued.
“It is a new day here in the United States,” Grewal said, pointing to what he described as a more constructive tone from agencies under SEC Chair Paul Atkins and Commodity Futures Trading Commission (CFTC) Chair Michael Selig.
“We still have challenges, to be clear, but it’s a very different dynamic,” he said.
The US stock market pushed to a fresh record high on Wednesday as easing US-Iran tensions pulled oil prices lower and AMD’s blowout AI chip earnings reignited the semiconductor rally.
The S&P 500 climbed 1.14%, the Nasdaq Composite jumped 1.51%, and the Dow Jones Industrial Average added 1.10%. A solid ADP private payrolls print reinforced the soft-landing narrative, with broad participation supporting the gains.
1. Iran Deal Proximity Pulled Oil Lower
The White House is reportedly nearing a one-page memorandum of understanding with Iran that would halt fighting and open nuclear talks, with Iran expected to respond within 48 hours.

The proposed terms include Iran pausing uranium enrichment, accepting UN inspections, and curbing underground sites in exchange for the US easing sanctions and releasing frozen assets.
Both sides would loosen Strait of Hormuz restrictions, opening a 30-day negotiation window. Trump has paused escalation, including plans for naval escorts through the Strait.
The deal proximity compressed crude oil prices, with Brent easing as traders priced in supply normalization. The move lifted risk assets broadly while pressuring energy names.
Lower oil prices also reduce inflationary pressure on consumer spending, which supported the broader equity bid.
2. AMD AI Chip Earnings Triggered a Semiconductor Rally
Advanced Micro Devices (AMD) jumped 16.29% to a record high after beating Q1 estimates and raising guidance. The chipmaker reported adjusted EPS of $1.37 on $10.25 billion in revenue, with revenue growing 38% year over year on strong data-center AI demand.
Management raised its Q2 outlook, signaling confidence that the AI buildout has further to run.

The print validated the thesis that AI chip spending is broadening beyond Nvidia, lifting semiconductor peers across the board. Super Micro Computer (SMCI) jumped 15.25%, Nvidia (NVDA) rose 4.31%, Lam Research (LRCX) gained 7.17%, Micron Technology (MU) added 2.77%, and Intel (INTC) climbed 2.40%.
That cluster alone drove most of the S&P 500’s advance.
3. ADP Jobs Report Reinforces Soft-Landing Narrative
The April ADP private payrolls report showed 109,000 jobs added, beating the consensus expectation of 84,000. The print supports the soft-landing thesis at a time when Fed officials are weighing the inflation impact of recent oil price volatility.
A stronger-than-expected jobs number combined with cooling oil prices gives the Fed cover to maintain its measured policy stance, which markets read as constructive for growth and risk assets.
What Happened to Major US Indexes?
- S&P 500: +1.14% to 7,341.93 (fresh all-time high)
- Nasdaq Composite: +1.51% to 25,707.5
- Dow Jones Industrial Average: +1.10% to 49,839.3

Market breadth confirmed the move with advancers at 60.3% against decliners at 36.3%. New highs ran at 75.9% versus new lows at 24.1%, and the bull-bear ratio sat at 53% bull against 47% bear. The breadth profile is more constructive than recent sessions and signals broader participation in the AI-led rally.
On the S&P 500 daily chart, the index has rallied steadily since bottoming on March 31, with the move continuing through May 1 before a mild consolidation that resolved higher on the Iran deal hopes. The volume profile through the rally has remained steady, with healthy bar action suggesting proper buying pressure rather than a thin breakout.

The next resistance is 7,399 (0.236 Fibonacci). A daily close above opens the path to 7,540 (0.382 Fibonacci) and 7,654 (0.5 Fibonacci). The 0.618 Fibonacci at 7,767 represents roughly 5% upside potential.
On the downside, weakness emerges below 7,172, with 7,001 as the key psychological floor. A break below 7,001 would weaken the current breakout structure.
Which Sectors Are Holding Up?
Basic Materials led the tape at +3.68%, followed by Technology (+2.08%), Industrials (+1.93%), and Communication Services (+1.63%). Tech leadership reflected the AMD-driven AI chip rally, with semiconductor names absorbing the bulk of inflows.

Industrials gained on aerospace strength, with GE rising 6.04% as ceasefire-related volatility settled. Real Estate (+1.53%) and Consumer Cyclical (+1.41%) advanced as lower oil eased consumer cost pressure and improved discretionary spending visibility.
Which Sectors Are Falling?
Energy fell sharply at -3.74% as Brent crude eased on the Iran deal proximity.
Exxon Mobil (XOM) dropped 4.72% and Chevron (CVX) fell 4.58%, with the energy decline directly tied to the supply normalization narrative driving oil lower.

Utilities (-0.73%) underperformed as defensive positioning rotated out in favor of growth and AI-driven tech leadership.
What Are Investors Watching Next?
The 48-hour Iran response window is the immediate catalyst. A signed MOU would compress crude further and likely extend AI-led tech leadership. A stalled or rejected response would re-introduce premium into oil and pressure broader risk.
On the technical side, the S&P 500’s path through 7,399 will tell investors whether the AI-driven breakout has the volume to extend toward 7,654 and beyond.
The post Why Is The US Stock Market Up Today? appeared first on BeInCrypto.
Chimaev’s takedowns the biggest obstacle for Strickland at UFC 328

Anthropic Is Doubling Claude Code Rate Limits After Deal With SpaceX

Couple killed in hantavirus outbreak ‘contracted it during bird watching trip’ | News World
Manchester United reach agreement with Casemiro over contract clause amid transfer speculation

US brings back mandatory military draft registration

Steven Gerrard disagrees with Gary Neville over ‘shock’ Chelsea and Arsenal claim | Football

XRP Failed To Handle $500 Billion At $10! The Price MUST BE HIGH! Less Than 1% Will Understand This!

Women Face Financial Crisis As Men Refuse To Be Their Retirement Plans

Minister Padarath : Solar Farm Project A Financial Burden To T&TEC
-
 Business7 days ago
Tesla Officially Registers Elon Musk’s Stock: What Investors Need to Know
-

 NewsBeat3 days ago
Channel 5 – All Creatures Great and Small series 7 new post
-

 Entertainment7 days ago
Insider Claims Reason Behind Key & Peele Split
-
 Tech5 days ago
Trump’s 25% EU auto tariff breaches Turnberry Agreement that also covers semiconductors and digital trade
-
 Sports5 days ago
Paul Scholes issues Marcus Rashford reality check as agreement emerges over Man United star
-

 Entertainment5 days ago
Met Gala 2026 Rumored Guest List Is Turning Heads
-

 Entertainment7 days ago
Celebrities Who Are Attending the 2026 Met Gala Event
-

 Business5 days ago
Strait of Hormuz Blockade Persists Amid US-Iran Standoff, Sending Oil Prices Soaring
-
Entertainment5 days ago
New on Prime Video in May 2026 — Full List of Movies and Shows
-

 Sports5 days ago
Cavaliers vs. Raptors Game 6 live score, updates, highlights from 2026 NBA playoffs first-round series
-
 Sports5 days ago
David Benavidez responds to team Canelo saying the fight will never happen
-

 Crypto World7 days ago
Meta (META) starts stablecoin payout to creators in Circle’s USDC on Polygon, Solana via Stripe
-
Business7 days ago
Strait of Hormuz Remains Heavily Restricted on April 29 Amid Iran Conflict
-
 Sports5 days ago
IPL 2026: ‘Love you darling’- Hardik Pandya’s reaction to MS Dhoni steals the show |Watch | Cricket News
-

 Tech7 days ago
Texas Instruments made a new flagship graphing calculator: the TI-84 Evo
-

 Sports7 days ago
Saudi Arabia set to withdraw LIV Golf funding after 2026 season, per reports
-

 Entertainment5 days ago
Kylie Jenner Hit With Second Lawsuit From Ex-Housekeeper
-

 Entertainment5 days ago
Young and the Restless Next Week: Cane Arrested & Matt’s Deadly New Scheme!
-

 Tech7 days ago
Mark Zuckerberg Says Meta Is Working On AI Agents For Personal And Business Use
-

 Sports5 days ago
Plane crash in Wimberley, Texas kills 5 pickleball players at tournament
You must be logged in to post a comment Login