
Crypto World
Nine-day inflow streak for spot Bitcoin ETFs signals steady demand

US spot Bitcoin ETFs continued to attract fresh capital, extending a nine-day inflow run through April 24 as investors piled into core crypto exposure through regulated vehicles. SoSoValue’s tracking shows about $2.12 billion of net inflows over the April 14–24 window, with the strongest single-day performance on April 17, when inflows reached $663.91 million. Other notable sessions included April 14’s $411.50 million and April 22’s $335.82 million.
The momentum wasn’t universal across all funds. Friday’s activity was comparatively modest, with net inflows of $14.45 million. Among the individual managers, BlackRock’s IBIT led the session with $22.88 million in inflows, while Fidelity’s FBTC recorded outflows of $1.69 million. Bitwise’s BITB and ARK 21Shares’ ARKB also posted outflows of $8.85 million and $9.02 million, respectively, with other products largely flat. The overall streak marks the first nine-day run for spot BTC ETFs since a similar burst in October, when inflows surged on consecutive days, including $1.21 billion on Oct. 6 and $875.6 million on Oct. 7.
Bitcoin’s market backdrop has helped sustain the flow. BTC was trading around $77,516.55, up roughly 10.7% over the past month, according to CoinMarketCap. The confluence of rising prices and regulated access appears to be reinforcing investor conviction that these products offer a stable exposure channel for crypto exposure within traditional portfolios.
Key takeaways
- Spot BTC ETFs posted roughly $2.12 billion in net inflows over April 14–24, marking a nine-day streak driven by broad-based institutional demand.
- Single-day highs included $663.91 million on April 17, with other strong days on April 14 ($411.50 million) and April 22 ($335.82 million).
- Not all funds participated equally; some concentrates like BlackRock’s IBIT led the day, while Fidelity’s FBTC and others faced outflows or flat flows.
- Overall, 2026 cumulative net inflows through spot BTC ETFs reached about $58.23 billion, signaling persistent demand despite a price backdrop below recent peaks.
- Ether ETFs mirrored BTC momentum with a nine-day inflow streak, though the run paused on April 23 with a net outflow of $75.94 million.
Bitcoin ETF investors stay the course amid volatility
The sustained inflows into spot BTC ETFs—despite Bitcoin trading well below its October highs—underscore a shift toward longer-term positioning among institutional investors. In a social post, ETF analyst Nate Geraci characterized the pattern as evidence of “diamond hands” behavior, where buyers maintain exposure through drawdowns rather than reacting to near-term volatility. SoSoValue data corroborate a broader theme: ETF participants are treating these products as core allocations rather than tactical bets, reinforcing a structural layer of demand that can help stabilize flows during pullbacks.
The takeaway for traders and builders is that regulatory-compliant access channels continue to resonate with the market’s risk tolerance. The steady flow suggests participants view spot BTC ETFs as a credible, long-horizon mechanism to gain exposure to Bitcoin without directly holding the asset, which can matter for liquidity, price discovery, and risk budgeting in diversified portfolios.
Ethereum exposure climbs in step, then eases
US spot Ether ETFs mirrored the BTC momentum, recording nine consecutive days of net inflows from April 14 through April 22. The strongest session occurred on April 17, when Ether ETFs attracted $127.49 million. Other notable days included April 22 with $96.44 million and April 20 with $67.77 million. The streak ended on April 23, when funds logged net outflows of $75.94 million, marking a reversal after a robust run.
The broader ETH narrative continues to draw attention to Ethereum’s ecosystem exposure alongside BTC. While the BTC rally anchors the narrative, Ether-based products offer market participants a way to diversify crypto risk and participate in the broader smart-contract platform theme with regulated vehicles. The data indicate a protective appetite for ETH exposure during the streak, followed by a pullback that may reflect shifting demand or tactical rebalancing across funds.
Where this leaves investors and markets next
Overall, the period pushed cumulative 2026 inflows into the BTC ETF space to a sizable sum—roughly $58.23 billion, according to SoSoValue—highlighting a durable appetite for regulated crypto access. The juxtaposition of rising inflows against a still-substantial price gap from the all-time highs may indicate that investors view these products as stabilizing anchors for long-term crypto exposure, rather than merely chasing immediate price moves.
As for Ether, the nine-day inflow streak followed by a pause raises questions about the durability of ETH-related demand in the near term. Market participants will be watching for fresh data in early May to see whether inflows resume and how price dynamics for ETH influence further fund flows, particularly as Ethereum-related fundamentals and network activity continue to evolve.
Looking ahead, the key watchpoints will include how policymakers and regulators respond to evolving ETF structures, how primary-market flows interact with secondary-market liquidity, and whether next-month data reinforce the current pattern of steady, institutionally oriented capital entering spot crypto ETFs. For readers, the signal remains clear: regulated products are increasingly central to how major investors gain and manage crypto exposure, even as volatility persists.
Cointelegraph remains committed to transparent reporting and will continue tracking ETF inflows, price action, and regulatory developments to help readers gauge the evolving dynamics of crypto-market access.


TLDR:
- Dogecoin remains within Cycle 3 structure, reflecting past patterns of accumulation before major breakout phases
- Traders watch $0.10 resistance and $0.09 support levels as price nears a key directional decision zone
- Open interest near $1.3B and whale accumulation signal active positioning across derivatives markets
- Historical cycles suggest potential expansion phase could emerge between 2025 and 2026 timeframe
Dogecoin is drawing fresh market attention as traders assess its long-term cycle structure and current positioning. Recent technical commentary points to a potential turning point, with price behavior aligning with patterns observed in previous expansion phases.
Macro cycle structure signals a pivotal phase
A long-term analysis shared by Bitcoinsensus outlines the evolving structure of Dogecoin across three market cycles since 2014.
The chart maps repeating phases of accumulation, breakout, and consolidation, offering a structured view of price development over time.
In the tweet, Bitcoinsensus states that Dogecoin remains within a macro Cycle 3 structure that mirrors earlier setups.
The post notes that past cycles delivered strong expansions after similar bases, while also clarifying that historical comparison does not confirm future performance.
The chart shows Cycle 1 and Cycle 2 followed similar paths, each producing sharp rallies after long accumulation periods.
Cycle 2 recorded gains exceeding 5,500 percent before entering a cooling phase. Cycle 3, which followed the 2021 peak, reflects a larger expansion and a slower consolidation range.
Current price levels remain within a mid-range band, forming a structure with two possible paths. A bullish scenario suggests gradual upward movement toward prior highs.
A neutral path indicates extended sideways trading. As a result, Dogecoin continues to trade within a decisive range.
Short-term positioning adds to Dogecoin outlook
Another tweet from Cryptoman98 adds context to the near-term setup for Dogecoin. The post notes that open interest has reached about $1.3 billion, reflecting active participation across derivatives markets.
The same update states that large holders accumulated roughly 330 million coins, while top traders maintain a strong long bias. This positioning suggests preparation for upward movement, though price confirmation remains necessary.
Key technical levels are also in focus. The tweet points to repeated support around $0.09, supported by Ichimoku cloud structure.
A move above $0.10 could trigger upward pressure, while a drop below $0.09 may lead to further downside movement.
Meanwhile, the broader macro structure continues to frame expectations. The ongoing consolidation phase aligns with previous cycle behavior, where extended ranges preceded large price moves. Timing estimates from the chart suggest a potential shift between 2025 and 2026.
Across both analyses, Dogecoin remains in a phase where historical patterns and current positioning intersect. Market participants continue to monitor key levels as price approaches a potential breakout zone.

Crypto World
TRUMP Token Insiders Allegedly Dump $46M Worth of Tokens Amid Supply Concentration Concerns
TLDR:
- Over 15.54M TRUMP tokens worth roughly $46M were sent to OKX by team-linked wallets over three weeks.
- A splitter wallet broke large token chunks into smaller transfers within seconds to obscure the fund flow.
- One wallet handled 8.25M TRUMP tokens worth $23M, routing them directly to the OKX exchange hot wallet.
- A single wallet controls 76.75% of TRUMP’s total supply, leaving retail traders exposed to insider-driven price swings
On-chain data has revealed a systematic token offloading pattern tied to wallets linked to the TRUMP memecoin team.
Over three weeks, approximately 15,540,000 TRUMP tokens, valued at around $46 million, were sent to OKX. The activity traces back to a primary team wallet, moving through intermediary addresses before reaching the exchange.
One wallet alone controls 76.75% of the total supply, raising serious concerns about market stability and insider behavior.
Coordinated Wallet Activity Points to Structured Token Offloading
Blockchain analysts flagged a series of transactions originating from a known team wallet. The address 8bHec5JeptUGTwsbC3ycdXrK6uhR7w6hzuPnmzmxJMnv serves as the primary source of the funds.
From there, tokens move to a so-called “splitter” wallet at xcHFnzWgaw6YG3ZQsoDpEE7hVMChGQKv3paPfaxCPWG.
The splitter wallet breaks large token amounts into smaller chunks within seconds. This method distributes funds quickly across multiple addresses before they reach an exchange. The pattern appears structured rather than organic trading activity.
After splitting, tokens flow to a main dumping wallet at Hv1hqPhX3CG6jNu3MzRnfoEV6owPw1mhogtCyY16jPCZ. This address alone handled 8.25 million TRUMP tokens, worth roughly $23 million, sent directly to the OKX hot wallet.
Crypto analyst StarPlatinum flagged the activity on X, stating: “Wallets linked to the team have been systematically offloading tokens into exchanges sending a total of 15,540,000 TRUMP directly to OKX.” The analyst described the pattern as coordinated and deliberate.
Secondary Wallets and Supply Concentration Add to Market Risk
Two additional wallets were identified as part of the same offloading pattern. Addresses 9aiqyEUmwb63yUjwPHwY4jR68Pj5QsCQBGhYWRJEwXZA and C68a6RCGLiPskbPYtAcsCjhG8tfTWYcoB4JjCrXFdqyo consistently sent large TRUMP amounts to OKX. One of these wallets moved over one billion TRUMP tokens within just a few days.
All token flows eventually converge at 64CuV85HHCydAwxQMoXwZ9HXoyw5qE65NkiJxCtuFErF, identified as the OKX hot wallet.
Its outgoing distribution to thousands of smaller addresses confirms its exchange role. Once tokens arrive there, they become liquid and available for open-market sale.
Beyond the selling activity, supply concentration remains a core concern. A single wallet, HkykUVWTctptXZmRTWearMsH4SaQNmE4Ku3tMJe5v2mH, holds 76.75% of the entire TRUMP token supply. That level of concentration gives insiders near-total control over market conditions.
StarPlatinum concluded: “The market is entirely dependent on insider behavior. Don’t trust this chart token.” Retail participants remain exposed to price movements driven entirely by a small group of wallet holders.
Crypto World
Why investors are flocking to BlackRock’s bitcoin options to hedge against a wild global economy
Something notable happened on Friday, indicating the accelerating institutionalization of the bitcoin market, which has been pioneered by everyday people for years.
This is because options, or hedging instruments, linked to BlackRock’s bitcoin exchange-traded fund (ETF), IBIT, have grown slightly larger on Nasdaq than total bitcoin options trading on the offshore giant Deribit. It is particularly striking that IBIT options have, in just two years, closed the gap with Deribit’s bitcoin options market, which has been operating since 2016.
On Friday, the dollar value of open or active IBIT options contracts on Nasdaq, the so-called open interest (OI), was $27.61 billion, slightly higher than the $26.90 billion in Deribit’s bitcoin options, according to data tracked by decentralized crypto volatility protocol Volmex.
This milestone indicates that the regulated, institutional-grade bitcoin investment and derivatives infrastructure in the U.S. is no longer second fiddle to the offshore market. Moreover, a booming, regulated market in the U.S. could embolden more Wall Street institutions to explore digital assets, ultimately leading to more mature price discovery.
Deribit’s Global Head of Retail Sales and Business, Sidrah Fariq, described IBIT’s rise as a net positive for the broader crypto derivatives ecosystem.
“US retail can’t onboard platforms like Deribit, so iShares Bitcoin Trust (IBIT) options give them direct access to regulated leverage and options exposure. This is further supported by the current macro environment with supply chain uncertainty, energy shocks, and broader geopolitical risks, which naturally drives demand for hedging and options strategies,” Fariq told CoinDesk.
What are options?
Options are derivative contracts that give the purchaser the right to buy or sell the underlying asset at a predetermined price at a later date. Think of it as paying a token price to reserve the right to buy or sell the property at a pre-agreed specific price in the future. A call option gives the right to buy and represents a bullish bet, while a put option gives the right to sell.
Analysts use open interest as the measure of market size and participation – the higher the open interest, the deeper and more liquid the market.
Traders use options to hedge existing positions in the spot and futures markets, speculate on price direction, and generate additional income on coin/ETF holdings.
One of the most preferred income-generating strategies involving IBIT ETF and IBIT options is the covered call strategy. It allows investors to profit from BTC’s implied volatility by simultaneously holding the ETF and shorting IBIT calls at levels well above the ETF’s current market price.
Traders holding actual BTC have been doing this via Deribit for years.
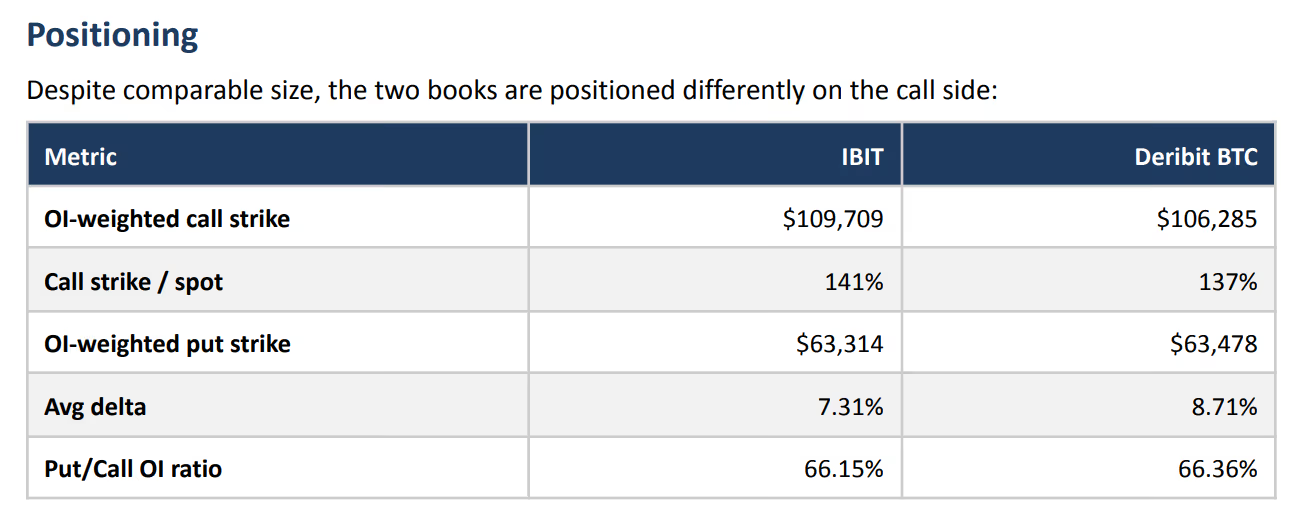
Same in size but different in shape
The two markets, though, now match each other in scale but are positioned differently, revealing a lot about trader sentiment in each.

According to Volmex, the bulk of open interest in IBIT call options points to expectations of an ETF rallying to levels equivalent to BTC trading at $109,709 in the near-term. That’s roughly 41% higher than the current market price of $77,400.
Positioning in Deribit options is bullish but slightly measured, suggesting expectations of a rally to $106,000.
“Onshore call OI is concentrated roughly 4 percentage points further out-of-the-money than offshore, and the onshore average delta is slightly lower. This is consistent with onshore flow being dominated by retail upside speculation and systematic call overwriting programs, both of which concentrate OI in further-OTM strikes,” Volmex said in a report shared with CoinDesk.
ETF holders are more patient
Options have expiry dates – the point at which contracts are settled, depending on where IBIT or spot BTC is trading at that time.
Analysis of activity across both markets suggests that, on average, October 2026 expiries are preferred in IBIT, while August expiries dominate on Deribit.
“IBIT options are approximately two months longer-dated on an OI-weighted basis. The gap is roughly symmetric across puts and calls, suggesting it reflects the underlying holder base, longer-horizon ETF investors onshore versus more tactical positioning offshore, rather than asymmetric demand for protection or upside,” Volmex noted.
Lastly, IBIT’s implied volatility – a metric that measures expected swings in the BTC-linked ETF over the next four weeks – is higher than the implied volatility derived from Deribit’s BTC options.
Volmex attributes this premium to a structural quirk: Because ETF holders cannot easily short (express a bearish view) bitcoin directly, they buy put options as their only available hedge. This demand for put options is keeping IBIT’s implied volatility slightly elevated.
All things considered, IBIT’s rapid rise in the options market is striking and, in many ways, now appears to rival Deribit in scale. However, the two are not direct substitutes, as IBIT options primarily cater to regulated, onshore investors accessing bitcoin exposure through traditional brokerage channels, while Deribit remains the go-to place for global investors.
“I don’t see this as competition. If anything, it expands the market. As more participants get comfortable trading options via IBIT, it ultimately feeds into the broader ecosystem, and venues like Deribit benefit from increased sophistication and flow,” Fariq said.
Metaplanet just doubled down again, believing in its Bitcoin price prediction. The Japanese Bitcoin treasury firm announced its 20th bond issuance on Friday, raising ¥8 billion ($50 million) in zero-interest debt to fund further Bitcoin purchases, even as BTC trades near $77,800.
According to a Friday filing, EVO Fund, the Cayman Islands-based investor that has anchored every prior offering, fully subscribed to the latest issuance. The bonds carry zero interest, zero collateral, and zero guarantee, an unusual structure that functions as a rolling credit line, with each bond auto-redeemed as EVO exercises stock warrants in subsequent financing rounds.
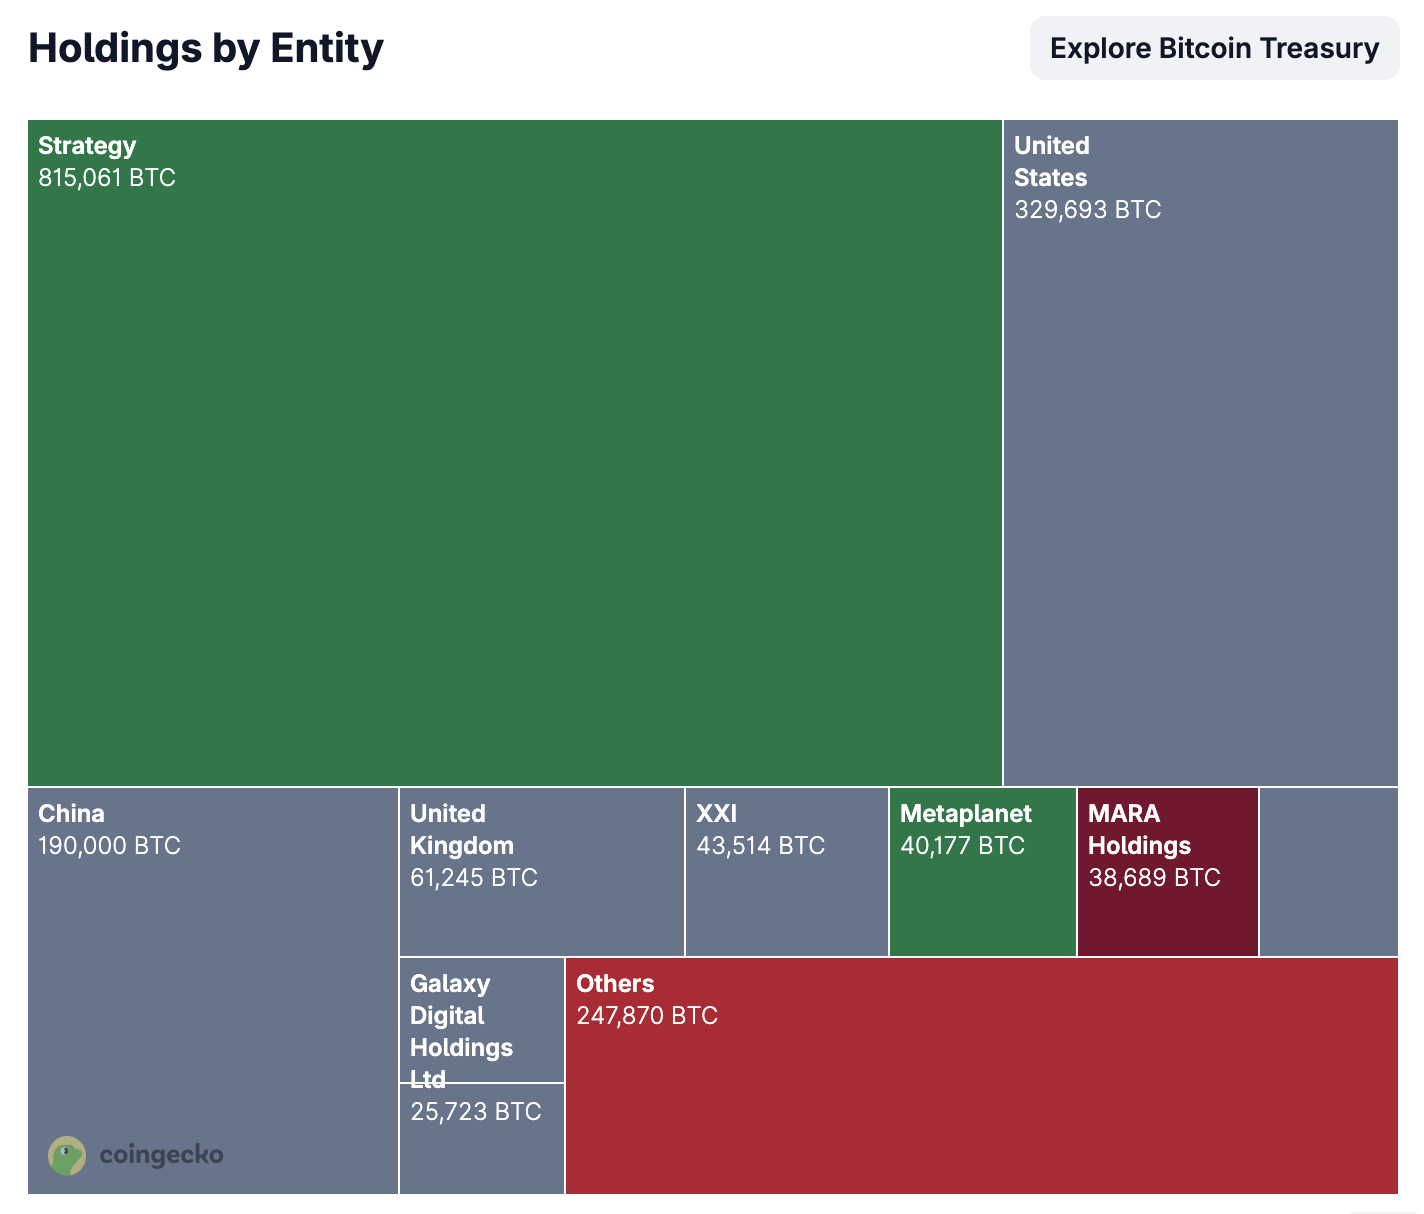
Metaplanet now holds 40,177 BTC, valued at $3.11 billion at the current price, making it the third-largest listed Bitcoin treasury globally. That stack came with a cost as the firm reported a $619 million net loss for fiscal 2025, driven almost entirely by unrealized Bitcoin markdowns.

Metaplanet’s aggressive accumulation, 5,075 BTC added in Q1 alone, lands against a backdrop of recovering macro sentiment and renewed institutional interest.
Discover: The best crypto to diversify your portfolio with
Bitcoin Price Prediction: Reclaim $80,000 Next Week as Corporate Buying Pressure Builds?
Bitcoin’s 10% monthly gain to current levels $77,800 marks a meaningful recovery from the pressure tied to geopolitical tensions earlier this quarter, with analysts tracking a critical support band around $68,000 as the floor that needs to hold for any sustained rally thesis.
The technical setup is cautiously constructive. Price is recovering from a multi-month drawdown, and corporate accumulation events like Metaplanet’s bond issuance have historically reinforced institutional demand narratives, much as the BlackRock and Strategy accumulation cycles that preceded previous rallies.
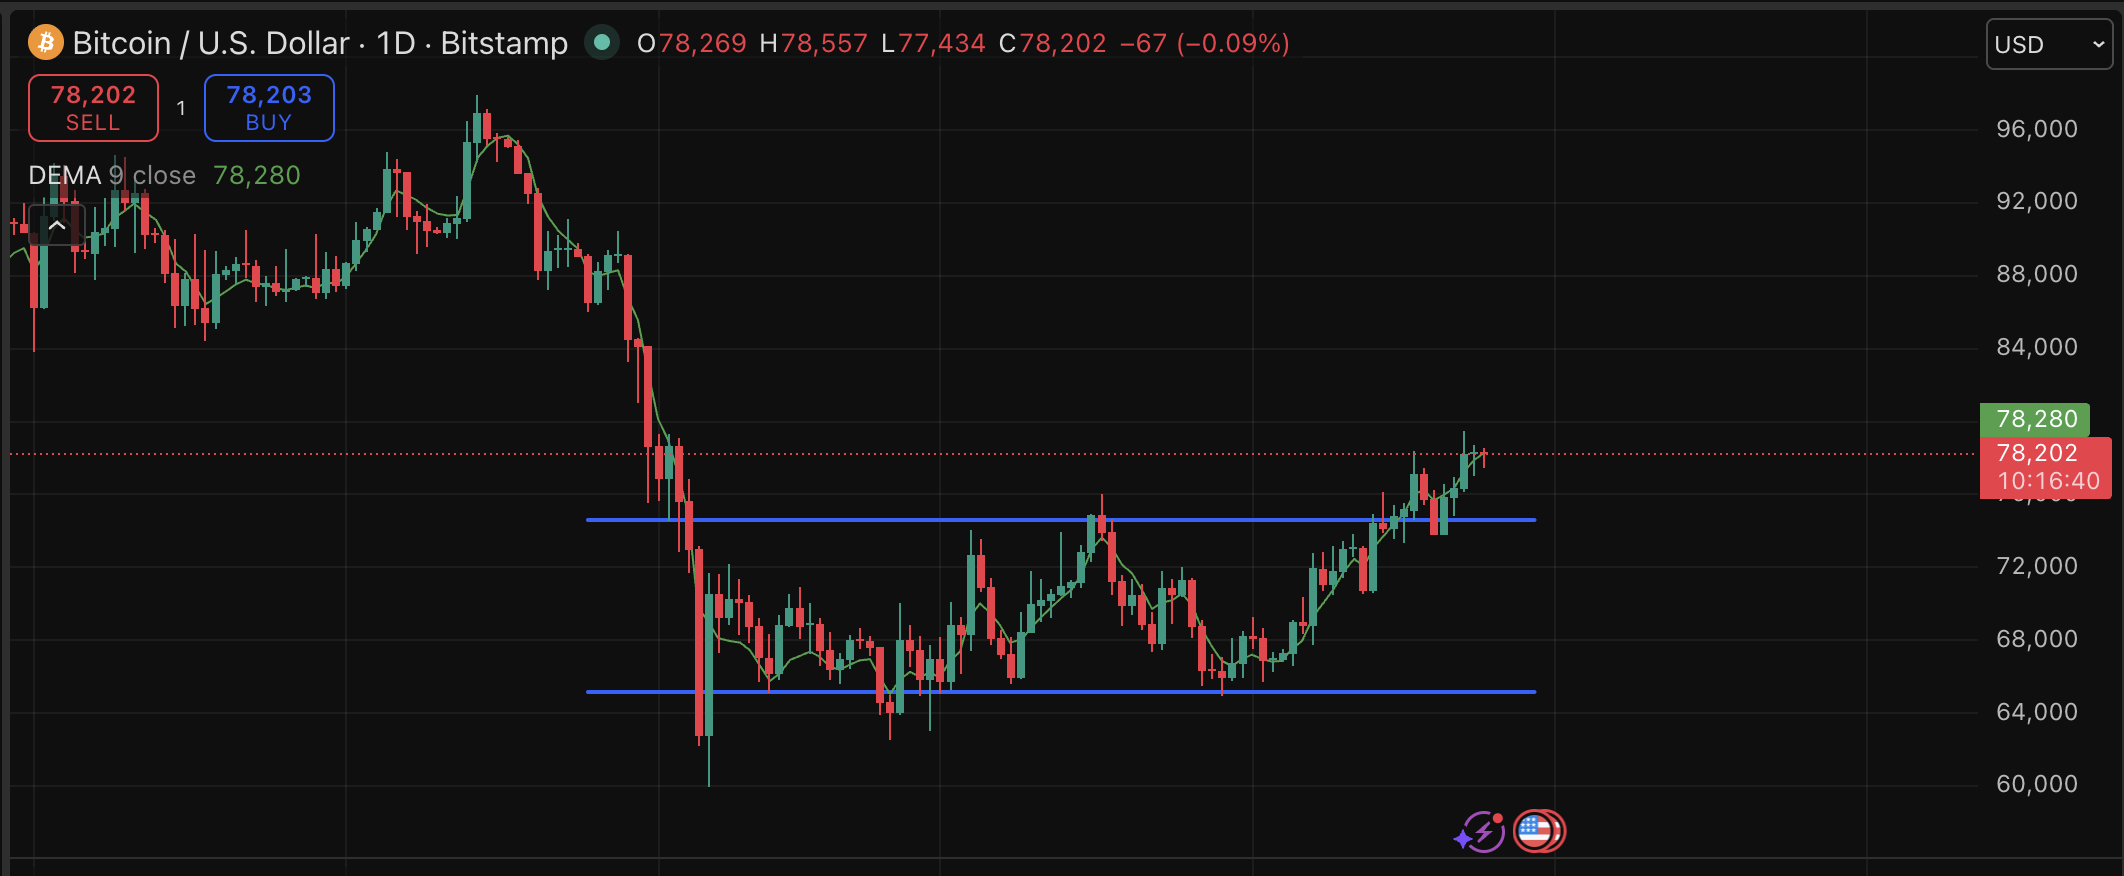
For next week, BTC needs to hold the $75,000 support, with accelerated institutional flows, for its price to retest $80,000 next week.
Macro catalysts, including policy signals from Washington, remain a wildcard that could accelerate any of these scenarios without warning. Metaplanet itself is targeting 100,000 BTC by 2026, which implies sustained buying pressure regardless of short-term price action.
Discover: The best pre-launch token sales
Bitcoin Hyper Targets Early Mover Upside as Bitcoin Tests Key Levels
Bitcoin here is a recovery story, but at a market cap measured in the trillions, the explosive percentage gains belong to an earlier chapter. Traders looking for asymmetric exposure to Bitcoin’s momentum are increasingly looking one layer down: at the infrastructure being built on top of it.
Bitcoin Hyper ($HYPER) positions itself at exactly that intersection. The project claims the title of the first-ever Bitcoin Layer 2 with Solana Virtual Machine (SVM) integration, a combination designed to bring sub-second finality and low-cost smart contract execution to the Bitcoin ecosystem without sacrificing Bitcoin’s underlying security.
Hyper is a project that grafts Solana’s speed onto Bitcoin’s trust layer, a combination that solves three of Bitcoin’s most persistent limitations: slow transactions, high fees, and limited programmability.
The presale has raised $32 million at a current price of $0.0136, with staking available at a high 30% APY for early participants. Feature highlights include a Decentralized Canonical Bridge for BTC transfers and high-speed SVM-powered smart contracts.
For traders who want to go beyond BTC spot exposure, research Bitcoin Hyper here.
The post Bitcoin Price Prediction: Metaplanet Raises $50 Million to Buy More BTC appeared first on Cryptonews.

Key Takeaways
- Advanced Micro Devices stock surged almost 14% Friday following Intel’s impressive Q1 earnings
- D.A. Davidson elevated AMD to Buy rating with a new $375 price target, up from $220
- Intel’s quarterly performance indicated strengthening CPU demand fueled by agentic AI adoption
- Jefferies analysts suggest AMD is capturing server market share from Intel
- AMD’s Q1 earnings report is scheduled for May 5
Shares of Advanced Micro Devices (AMD) delivered impressive gains Friday, surging nearly 14% to approximately $350 following Intel’s exceptional first-quarter earnings performance that energized the semiconductor sector.
Advanced Micro Devices, Inc., AMD
Intel’s quarterly results proved beneficial beyond its own stock price. The report signaled to investors that central processing unit demand is accelerating rapidly, positioning AMD as a prime beneficiary of this trend.
Gil Luria, analyst at D.A. Davidson, elevated his rating on AMD from Neutral to Buy while substantially increasing his price target from $220 to $375—a notable adjustment in a single research note.
Luria cited Intel’s earnings as the catalyst for his revised outlook. Intel delivered first-quarter revenue and profit figures that substantially exceeded Wall Street forecasts, with data center chip revenue showing particular strength.
The underlying catalyst? Agentic AI workloads. As artificial intelligence applications transition from training large language models to executing inference tasks—where models perform practical, real-world functions—CPUs have emerged as critical infrastructure components.
“We view Intel’s results as a precursor for a huge step-up for AMD’s CPU franchise,” Luria stated. He noted that the fundamental shift toward agentic AI is generating server CPU demand at unprecedented levels.
With demand projected to exceed supply availability, Luria also suggested AMD has opportunities to increase pricing throughout its CPU portfolio, potentially expanding profit margins and strengthening earnings capability.
AMD’s Competitive Position Against Intel
While Intel captured attention Friday with a 24% stock surge on its results, multiple analysts believe AMD may offer superior long-term investment potential.
Jefferies, which raised its Intel price target Thursday evening, indicated its strongest enthusiasm remains with AMD. The firm maintains a Buy rating and $300 price target on AMD, while keeping Intel at a Hold rating.
“INTC noted double-digit server unit growth with momentum extending into 2027, but AMD likely sees even better growth,” the Jefferies research team noted. They also highlighted AMD’s forthcoming Venice chips, anticipated in late 2026 or early 2027, as an important catalyst.
Morgan Stanley analyst Joseph Moore provided a more balanced perspective. Maintaining Equal Weight ratings on both companies, Moore suggested Intel’s earnings outperformance stemmed from supply limitations—not from Intel capturing market share from AMD.
Moore indicated the CPU “music is likely to keep playing for a while, as there is no indication that supply catches up to demand.”
Semiconductor Sector Momentum
AMD wasn’t the only chip stock posting substantial gains. Arm Holdings (ARM) also climbed nearly 15% Friday. Arm recently revealed intentions to manufacture its own CPU, intensifying competition with both Intel and AMD.
The PHLX Semiconductor Index advanced 4.5% during the session, marking its 18th consecutive positive trading day. The benchmark has climbed 43% in 2026 and more than 140% over the trailing 12 months.
AMD shares reached an intraday peak of $352.99 Friday, marking the stock’s highest level in over a year. The 52-week trading range extends from $91.87 to $352.99.
Advanced Micro Devices is scheduled to announce its first-quarter financial results on May 5, with an investor conference call commencing at 5:00 p.m. ET the same day.
TLDR:
- Solana Foundation is lending USDT to Aave for the first time to support the protocol’s ongoing recovery effort.
- Foundation Chair Lily Liu confirmed that the AAVE token will be integrated into the Solana network this weekend.
- The Solana Foundation has a history of deploying treasury funds to support DeFi protocols during critical recovery periods.
- Liu framed the cross-ecosystem move as a shared push toward open finance, using the phrase “DeFi United” on X.
Solana Foundation Chair Lily Liu has announced a new move to support DeFi ecosystem stability. The foundation is lending USDT to Aave for the first time as part of a broader recovery effort.
Liu also confirmed plans to bring the AAVE token to the Solana network this weekend. This marks a notable cross-chain gesture from one of crypto’s most active Layer 1 foundations.
Solana Foundation Steps Outside Its Own Ecosystem
The Solana Foundation has long used its treasury to support projects within the Solana network. However, this latest move signals a shift toward broader DeFi support. The foundation is now lending USDT directly into Aave, a leading Ethereum-based lending protocol.
Liu took to X to explain the rationale behind the decision. She wrote that economies do not exist in isolation and that Solana’s health depends on the health of all DeFi. That framing positioned the loan not as charity but as strategic ecosystem thinking.
The foundation has previously deployed treasury funds into Solana DeFi for several years. It also supported Tether’s recovery plan for Drift, a Solana-based trading platform. This Aave loan follows the same pattern of showing up during critical recovery periods.
AAVE Token Set to Launch on Solana This Weekend
Beyond the USDT loan, Liu confirmed that AAVE will be coming to the Solana network this weekend. This addition would make the governance token of one of DeFi’s largest protocols accessible on Solana. It also ties both announcements together under one broader strategy.
Bringing AAVE to Solana opens new opportunities for cross-chain liquidity and participation. Solana users would gain access to AAVE without leaving the network. That could drive additional trading volume and DeFi engagement on Solana.
Liu closed her post with the phrase “DeFi United,” framing the effort as a collaborative push across ecosystems. The Solana Foundation’s willingness to support a competitor’s recovery reflects a maturing approach to DeFi infrastructure. It treats the broader open finance movement as a shared goal rather than a zero-sum competition.

Key Takeaways
- AMD achieved record-breaking 2025 revenue totaling $34.6 billion featuring impressive data center expansion, whereas Intel reported $52.9 billion with no year-over-year movement
- The Data Center division at AMD generated $16.6 billion throughout 2025, propelled by EPYC server chip sales and AI-focused technologies
- Intel’s fiscal Q1 2026 revenue climbed 7% reaching $13.6 billion, though GAAP loss per share remained in negative territory at $(0.73)
- Analyst consensus positions AMD as a Moderate Buy with $296.44 average target price, whereas Intel carries a Hold rating at $72.98
- AMD represents the more reliable execution narrative; Intel remains positioned as a restructuring opportunity carrying greater risk
The semiconductor rivalry between Intel and AMD continues, yet 2025 market sentiment reveals starkly contrasting investor outlooks. One company demonstrates clear expansion momentum. The other represents a work-in-progress revival effort.
Let’s examine what the financial data reveals.
AMD’s Data Center Dominance
AMD delivered an exceptional 2025 performance. The semiconductor manufacturer announced all-time high annual revenue totaling $34.6 billion, achieving a 50% gross margin alongside $4.3 billion in net income. When measured on a non-GAAP basis, operating income reached $7.8 billion.
Advanced Micro Devices, Inc., AMD
The data center division emerged as the primary revenue catalyst. AMD’s Data Center operations generated $16.6 billion throughout 2025. This performance stemmed from accelerating demand for EPYC-branded server processors combined with the company’s artificial intelligence product portfolio.
AMD maintains diversified revenue streams beyond data centers. The Client and Gaming divisions contributed $14.6 billion combined, while Embedded products added another $3.5 billion. This multi-segment approach provides AMD with greater revenue stability compared to competitors dependent on narrower product categories.
Wall Street analysts have responded favorably. Among 40 analysts monitored by MarketBeat, 31 assign AMD a Buy recommendation and 1 rates it Strong Buy. The consensus 12-month price target stands at $296.44.
Intel’s Restructuring Journey
Intel maintains larger absolute revenue figures. The company’s full-year 2025 revenue totaled $52.9 billion, though this represented zero growth versus the prior year. Fourth-quarter revenue declined 4% to $13.7 billion.
The opening quarter of fiscal 2026 displayed modest progress. Revenue increased 7% year-over-year to $13.6 billion. However, Intel’s GAAP earnings per share remained in loss territory at $(0.73) for the period.
This persistent negative earnings position explains why Intel continues to be categorized as a “turnaround” opportunity rather than a “growth” investment by most market participants.
Intel retains significant advantages including operational scale, an established customer ecosystem, and strategic ambitions in contract chip manufacturing via its foundry operations. Yet investors are demanding these strategic initiatives deliver sustainable profitability before reassessing their outlook.
Analyst sentiment mirrors this cautious stance. Among 40 analysts tracking Intel, 25 assign a Hold rating, 11 recommend Buy, and 4 rate it Sell. The average price target stands at $72.98.
Intel’s latest quarterly results confirmed Q1 2026 performance: $13.6 billion revenue accompanied by a GAAP loss of $(0.73) per share.
Final Thoughts
These semiconductor competitors operate in overlapping markets while occupying dramatically different business trajectories. AMD currently demonstrates execution momentum. Intel leverages operational scale. Portfolio inclusion depends on whether investors prioritize demonstrated growth or restructuring upside potential.
Crypto World
CRISPR Therapeutics (CRSP) Stock Plunges 11% Amid Earnings Disappointment and Competitive Threat

Key Takeaways
- CRSP shares declined by as much as 11.59% during Friday’s session, touching an intraday low of $51.21
- First quarter results disappointed significantly: loss per share of -$1.37 versus analyst expectations of -$1.15; revenues of $0.86M compared to forecasts of $4.72M — representing a 97.8% year-over-year decline
- Competitive headwinds emerged as Regeneron announced its newly authorized gene therapy, Otarmeni, would be provided at no cost to qualifying patients in the United States, creating questions about Casgevy’s pricing sustainability
- Chief Executive Samarth Kulkarni divested 10,349 shares on March 16; company insiders collectively sold 51,828 shares during the previous three-month period
- Wall Street analysts continue to rate the stock as a consensus “Moderate Buy” with a mean price objective of $64.53
CRISPR Therapeutics ($CRSP) experienced a challenging trading session on Friday. Shares plummeted by as much as 11.59%, reaching an intraday bottom of $51.21, before closing near $51.04 — a significant decline from the previous day’s close of $55.18. Trading volume registered approximately 1.36 million shares, running about 27% lighter than typical daily activity.
The sharp downturn stemmed from a confluence of negative catalysts: disappointing quarterly financial results and emerging competitive dynamics from Regeneron.
Regarding financial performance, CRISPR disclosed a loss per share of -$1.37 for the most recent quarter, falling short of Wall Street’s consensus projection of -$1.15. Revenues registered a mere $0.86 million — substantially below analyst forecasts of $4.72 million. This represented a staggering 97.8% contraction compared to the same period last year, surprising market participants.
The biotechnology firm’s return on equity remains negative at -26.31%, while its net margin continues to reflect deep losses. Wall Street analysts are currently projecting a full-year loss per share of -$4.93.
Regeneron’s Complimentary Gene Therapy Creates Competitive Headwinds
The secondary catalyst weighing on shares involves Regeneron’s latest development. The pharmaceutical company secured regulatory authorization for Otarmeni, a gene therapy it intends to distribute without charge to qualified U.S. patients. This represents a significant challenge to the broader gene-editing industry.
CRISPR’s primary commercial product, Casgevy — co-developed alongside Vertex Pharmaceuticals — commands a list price of $2.2 million. Investors are concerned that Regeneron’s zero-cost distribution strategy could reshape pricing dynamics throughout the sector, making it increasingly difficult for high-priced single-administration treatments to defend their valuations.
Casgevy achieved recognition as the inaugural CRISPR-based treatment to receive FDA authorization, representing a historic achievement. However, commercial adoption has progressed slower than anticipated, and Regeneron’s competitive move introduces additional questions regarding the revenue trajectory.
Executive Stock Sales Contribute to Investor Anxiety
Recent insider transactions haven’t bolstered investor confidence. Chief Executive Samarth Kulkarni disposed of 10,349 shares on March 16 at an average transaction price of $48.26, trimming his holdings by approximately 4%. General Counsel James Kasinger simultaneously sold 3,450 shares on the identical date.
During the preceding three-month window, company insiders have collectively divested 51,828 shares, generating approximately $2.58 million in proceeds. Internal stakeholders currently control 4.30% of outstanding shares.
While such divestment activity isn’t uncommon among biotech executives managing equity-based compensation packages, it contributes to the cautious atmosphere surrounding the shares.
From an analyst perspective, the outlook remains somewhat divided but generally supportive. Bank of America maintains a Buy recommendation with an $89 price objective. Needham carries a Buy rating alongside an $82 target. TD Cowen holds a neutral Hold stance with a $45 projection. Citizens JMP assigns a Market Outperform rating with an $80 target. The aggregate consensus lands at Moderate Buy, featuring an average price target of $64.53 — considerably above present trading levels.
The equity’s 50-day moving average registers at $52.68 while the 200-day average stands at $55.70. The company’s market capitalization approximates $4.90 billion with a beta coefficient of 1.80.
Current price action shows CRSP trading around $51, remaining beneath both critical moving average benchmarks.

Key Highlights
- Nvidia’s shares reached an unprecedented closing price of $208.27 on Friday, marking a 4.3% gain
- The company’s valuation surpassed $5 trillion, reclaiming its status as the globe’s largest publicly traded corporation
- Intel’s exceptional quarterly results — posting its strongest single-day gain since 1987 with a 24% surge — ignited momentum across semiconductor stocks
- AMD shares soared 14% while Qualcomm advanced 11% during the same trading session
- Wall Street consensus among 42 analysts shows a Strong Buy rating, with a mean price target of $273.57
On Friday, April 24, Nvidia achieved a historic milestone by closing at its highest price ever recorded. The stock advanced 4.3% to finish at $208.27, elevating its total market capitalization beyond the $5 trillion threshold.
This achievement positions Nvidia as the planet’s most valuable publicly listed enterprise — once more.
The rally was catalyzed by Intel’s quarterly earnings announcement, which came after Thursday’s market close. Intel exceeded analyst projections, propelling its shares upward by 24% on Friday — marking the company’s most impressive daily gain in nearly four decades.
This positive sentiment rippled through the semiconductor industry. AMD jumped 14% and Qualcomm climbed 11%.
Nvidia initially breached the $5 trillion market cap threshold on October 29, 2025. The company had earlier reached $4 trillion on July 9, 2025 — less than twelve months prior.
Merely three years have passed since Nvidia’s valuation first exceeded $1 trillion. The trajectory of expansion has been extraordinary.
Nasdaq Poised for Strongest Monthly Gain Since April 2020
The Nasdaq composite index has surged 15% throughout April, positioning it for its most robust monthly showing in six years. Large-capitalization technology stocks have regained investor attention following a correction fueled by escalating oil prices connected to the Iran conflict and associated supply chain disruptions.
NVDA has multiplied more than fourteen times since December 2022 ended. In the past month alone, shares have appreciated nearly 20%.
Capital has been flowing back into growth-oriented equities, as artificial intelligence infrastructure requirements continue accelerating. Nvidia’s graphics processing units remain the preferred hardware solution for Google, Microsoft, Meta, Amazon, OpenAI, and Anthropic.
Competitive Pressures Intensifying
Alphabet, among Nvidia’s most significant clients, revealed new proprietary chips designed to rival Nvidia’s offerings when they launch for cloud platform customers in the coming months.
Nevertheless, Wall Street sentiment stays overwhelmingly positive. Among 42 equity analysts tracking the stock, 40 recommend Buy, one suggests Hold, and one advises Sell.
The consensus price target stands at $273.57 — suggesting approximately 31% potential appreciation from Friday’s closing price.
Bitcoin (BTC) is heading into the final week of April 2026 with a +13.71% gain so far. That leaves holders just half a percentage point short of the strongest April performance for the asset in five years.
Only a few days remain before the monthly close. BTC must add roughly 0.5% to surpass April 2025’s +14.08% return. That would secure Bitcoin’s best April since 2020.
April Joins a Familiar Pattern for Bitcoin
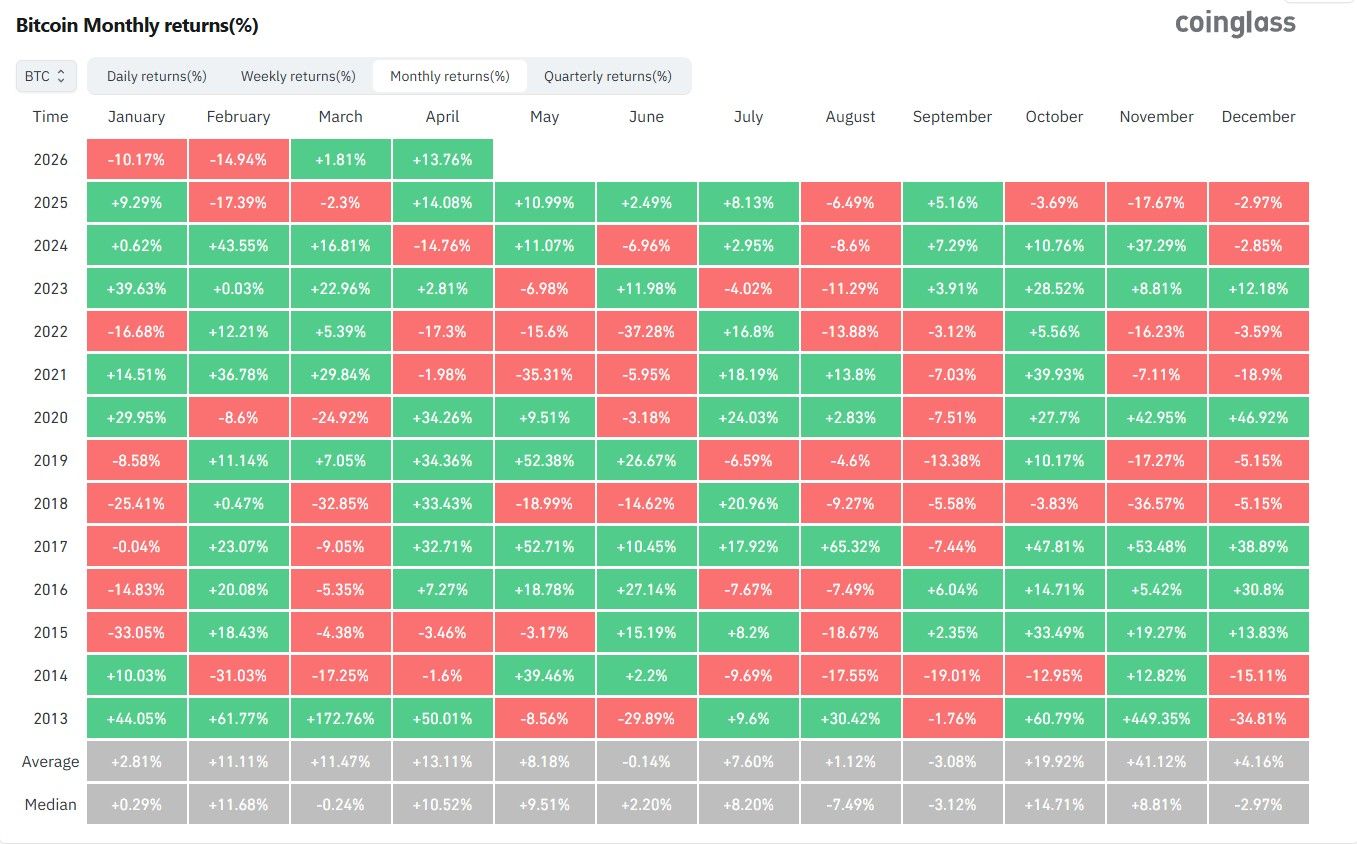
April has historically been Bitcoin’s strongest month. The average April gain stands at +13.11%, with a median return of +10.49%, according to Coinglass. The 2026 figure already sits above both benchmarks heading into the final week of trading.
The previous five Aprils tell a mixed story. Bitcoin gained +14.08% in 2025 and +34.26% in 2020, but it lost ground in 2024 (-14.76%), 2022 (-17.30%), and 2021 (-1.98%). The 2023 print of +2.81% rounded out a stretch where positive Aprils were the exception rather than the rule.
The current recovery also stands out against early-year weakness. Bitcoin lost 10.17% in January and another 14.94% in February before adding a small +1.81% in March.
April’s rebound has now reversed about half of those year-to-date losses. Improving ETF flows and a softer dollar print have helped.

Sentiment Still Lags the Price Recovery
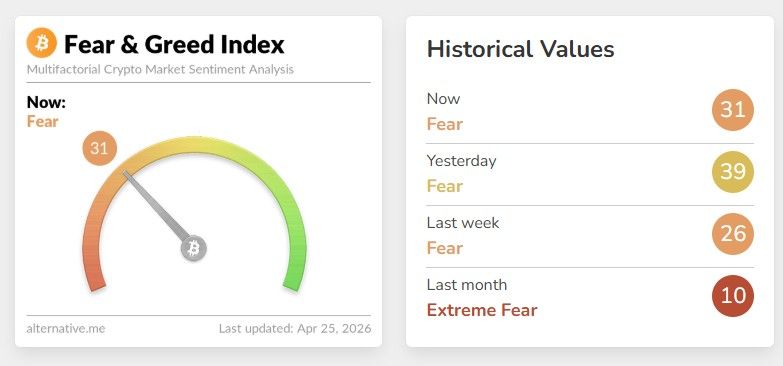
Despite the monthly gain, sentiment data shows that traders remain cautious. The Fear and Greed Index printed 31 on April 25, holding in Fear territory. The same gauge had touched Extreme Fear at 10 just one month earlier.
The reading of 26 last week was actually lower than today, indicating a slow recovery in conviction. Bitcoin is currently trading near $77,500, still about 38% below the ATH of $126,198 reached in October 2025. The gap explains the disconnect between the strong monthly print and the cautious sentiment showing in retail and derivatives positioning.
Persistent geopolitical risk has weighed on broader markets through April. US-Iran tensions and the wider Middle East conflict have kept BTC perpetual funding rates near zero or negative for stretches of the month. The pattern signals that traders have avoided chasing the rally with leverage.
One Week Left to Set the April Record
The final six trading sessions will decide where April 2026 lands in Bitcoin’s record books. A strong close would make it the second-best April since 2020, while a weaker finish would slot it behind 2025. With sentiment cautious and macro headlines unresolved, the path forward is far from certain.
A close roughly 0.5% higher by April 30 would be enough to clear 2025’s +14.08% mark. Whether Bitcoin can hold that level through the weekend remains an open question.
Thin liquidity and continuing geopolitical headlines could test the rally before the monthly close.
The post Bitcoin Has 1 Week to Secure Its Best April Since 2020 appeared first on BeInCrypto.

(VIDEO) Elon Musk Posts Stunning Grok Imagine Video as Users Flood X With AI Creations
Dogecoin Eyes Breakout as Macro Cycle Pattern Aligns With Key Market Levels
11 Light Jackets to Reach for on Not Too Hot, Not Too Cold Days
Manchester United reach agreement with Casemiro over contract clause amid transfer speculation

US brings back mandatory military draft registration

Steven Gerrard disagrees with Gary Neville over ‘shock’ Chelsea and Arsenal claim | Football


-

 Business6 days ago
Powerball Result April 18, 2026: No Jackpot Winner in Powerball Draw: $75 Million Rolls Over
-

 Politics6 days ago
Zack Polanski demands ‘council homes not luxury flats for foreign investors’
-

 Fashion1 day ago
Weekend Open Thread – Corporette.com
-
Entertainment6 days ago
NBA Analyst Charles Barkley Chimes in on Ice Spice McDonald’s Fiasco
-

 Tech7 days ago
Auto Enthusiast Scores Running Tesla Model 3 for Two Grand and Turns It Into Bare-Bones Go-Kart
-

 Politics5 days ago
Gary Stevenson delivers timely reminder to register to vote as deadline TODAY
-
Crypto World5 days ago
Bank of Hawai’i (BOH) Q1 2026: Net Income Drops to $57.4M as Net Interest Margin Expands
-

 Politics3 days ago
Making troops accountable for war crimes threatens US alliance, ex-SAS colonel warns
-

 Business3 days ago
Rolls-Royce Voted UK’s Most Iconic Trade Mark as IPO Register Hits 150
-

 Politics3 days ago
Disabled people challenge government SEND proposals over segregation concerns
-

 Politics3 days ago
Zack Polanski responds to home secretary’s taser threat
-

 Politics3 days ago
Starmer handler McSweeney to be dragged from shadows by Foreign Affairs Committee
-
Politics3 days ago
Wings Over Scotland | How To Get Away With Crimes
-
Crypto World7 days ago
Kelp DAO rsETH Bridge Hack Drains $292M as DeFi Losses Top $600M in Two Weeks
-

 Politics3 days ago
‘Iran is still a nuclear threat’
-

 Crypto World4 days ago
New York sues Coinbase, Gemini over prediction market offerings
-
 Crypto World4 days ago
Five Value Stocks with Recovery Potential in 2026: PayPal (PYPL), Nike (NKE), and More
-

 Business3 days ago
The Job Benefits Most Men Don’t Know to Negotiate
-

 Crypto World1 day ago
Michael Saylor says BTC winter is over. Market analyst disagrees, says bitcoin was in a pullback
-

 Politics6 days ago
Reform investigating candidate who ‘hates’ the NHS
You must be logged in to post a comment Login