
Crypto World
NVIDIA Mirrors Bitcoin Setup as Trump’s Tariff Refunds Hit
NVIDIA Corporation (NVDA) stock price tests $201.75 resistance after a near 23% rally from its March 30 low at $164.04. NVDA trades at $199.24, down 1.21%, inside a bull flag handle that mirrors Bitcoin’s structure.
A US Supreme Court ruling on tariffs unlocks cost relief for NVIDIA’s import chain. And the next 1.5% of price action decides whether the 23% pole projection activates.
NVIDIA Stock Runs Bitcoin’s Playbook at Matched Volatility
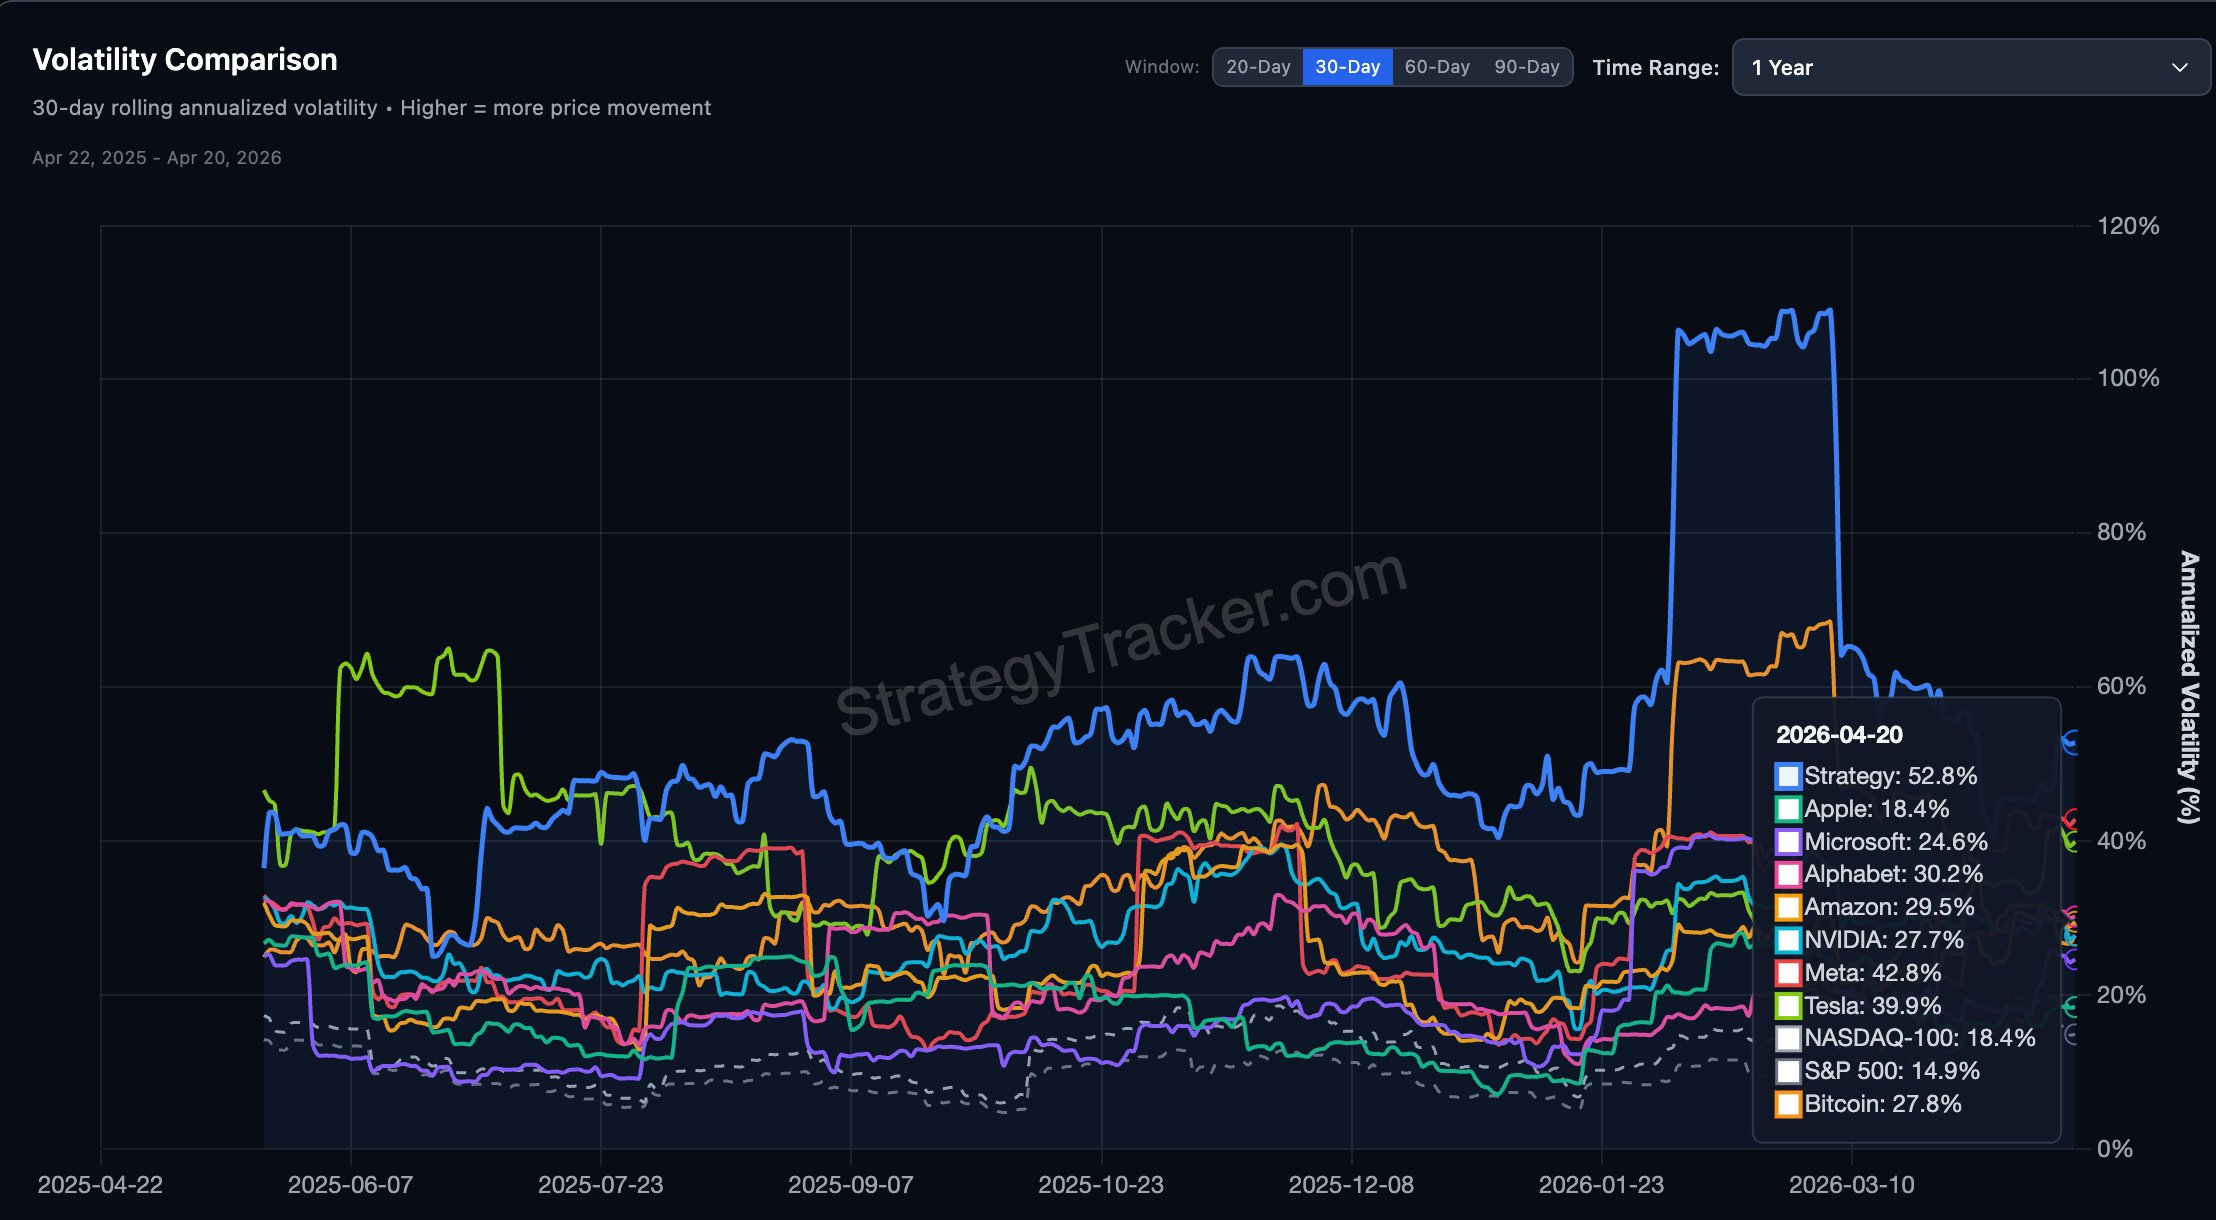
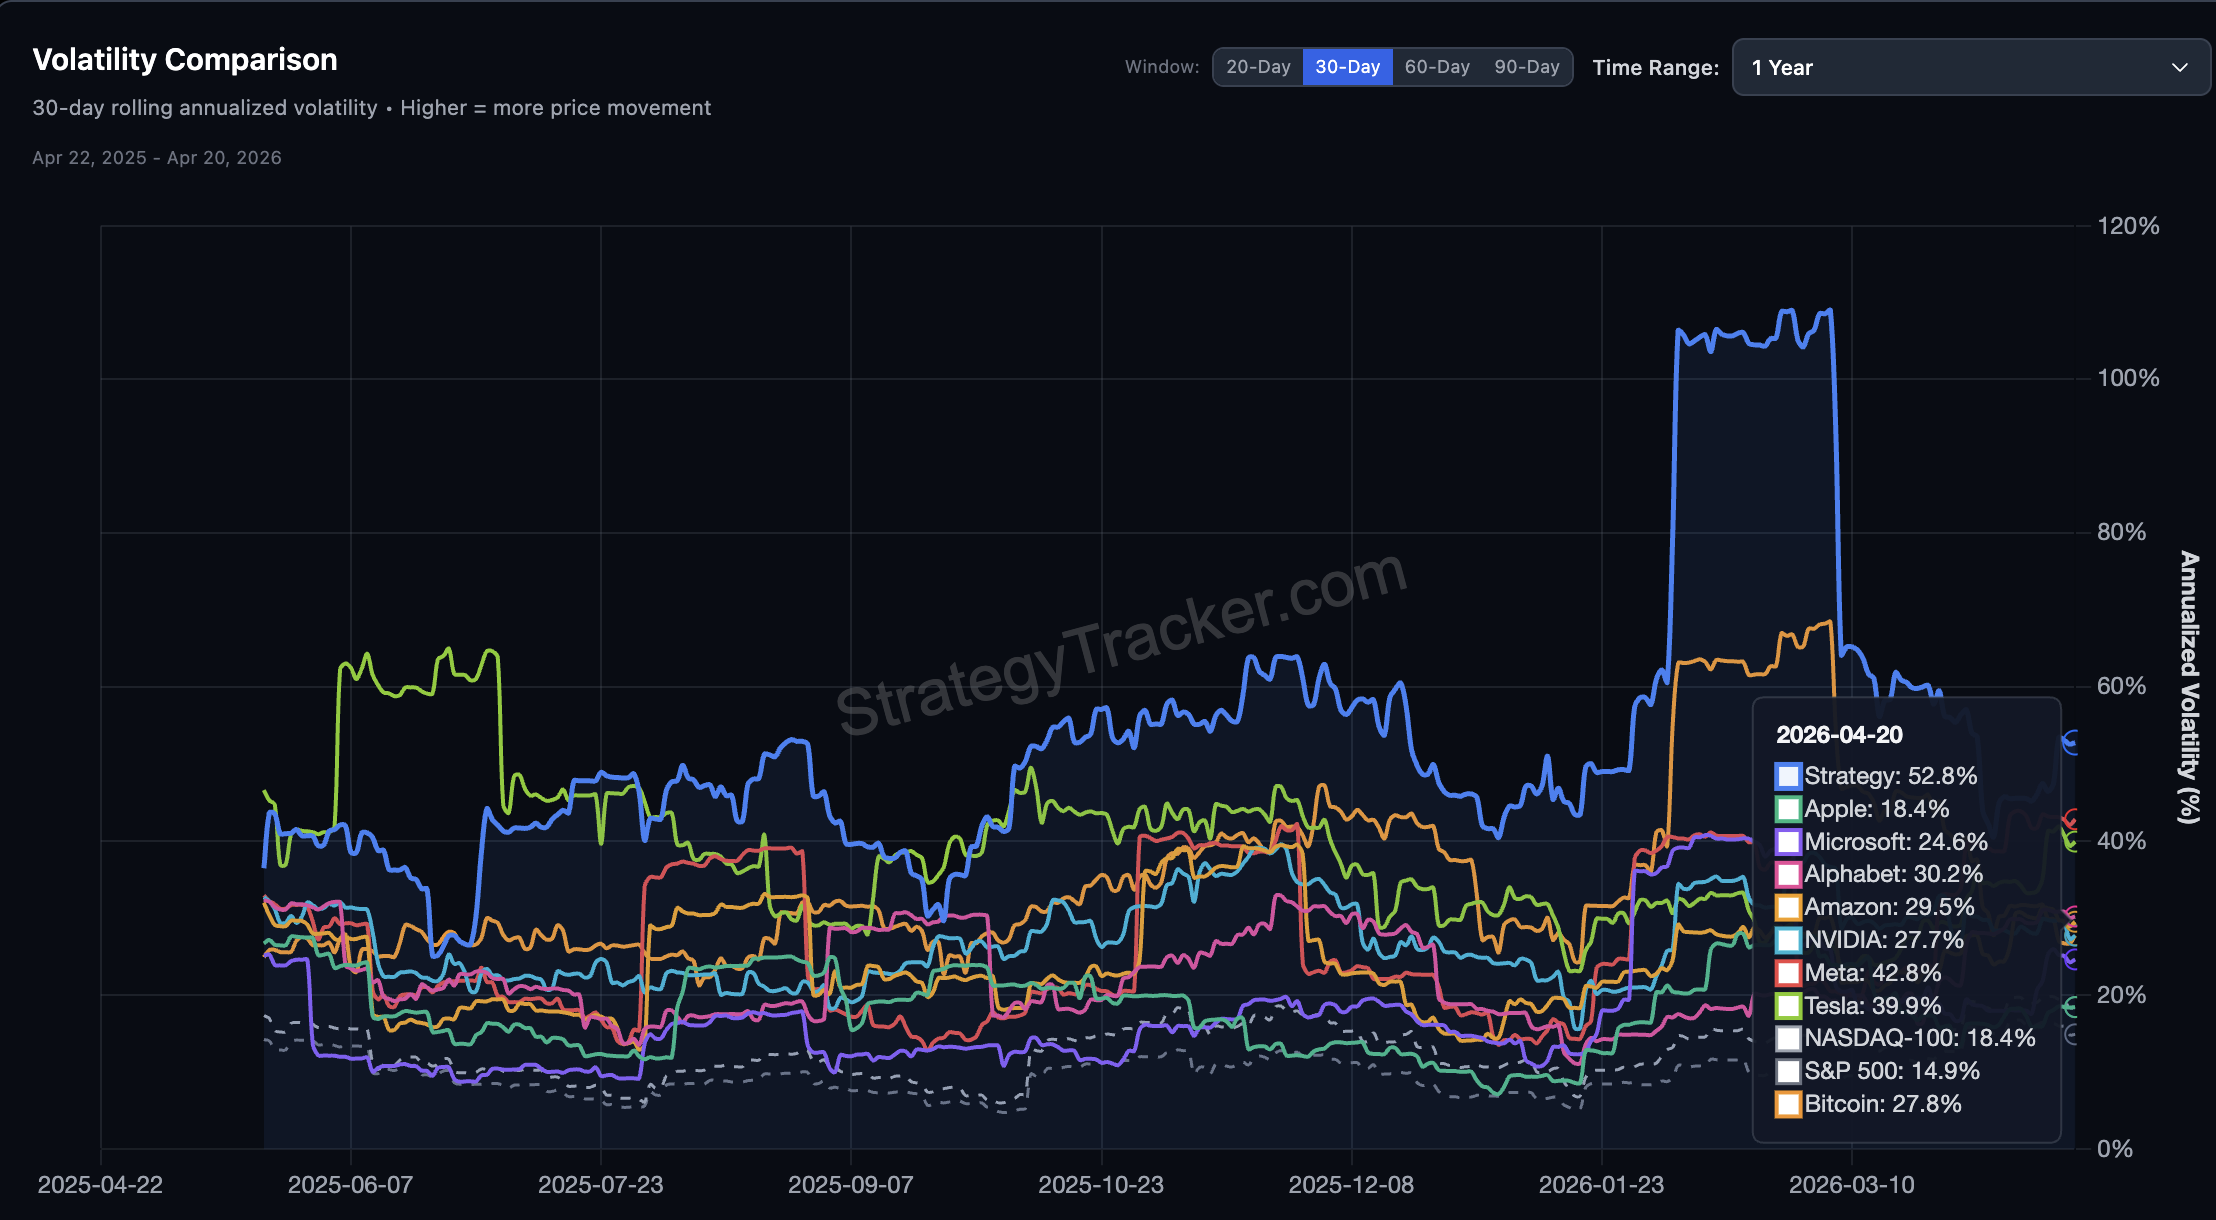
NVIDIA volatility, measured as the 30-day rolling annualized reading, sits at 27.7%. Bitcoin (BTC) prints 27.8% on the same screen. The gap is 10 basis points.
The S&P 500 reads 14.9%, NASDAQ-100 18.4%, Apple 18.4%, and Microsoft 24.6%. NVDA trades roughly 1.5 times its parent index and closely matches a crypto asset. Only MicroStrategy (52.8%), Meta (42.8%), and Tesla (39.9%) print hotter volatility.
The identity does not stop at volatility. Bitcoin bottomed on March 29 at $64,869, per today’s BTC analysis. NVDA bottomed on March 30 at $164.04, one session apart.
Want more insights like this? Sign up for Editor Harsh Notariya’s Daily Newsletter here.
Bitcoin rallied 20.72% to an April 17 peak of $78,380. NVDA rallied 22.95% to $201.75 in the same window. Both assets now trade inside near-identical bull flag pattern handles below resistance.
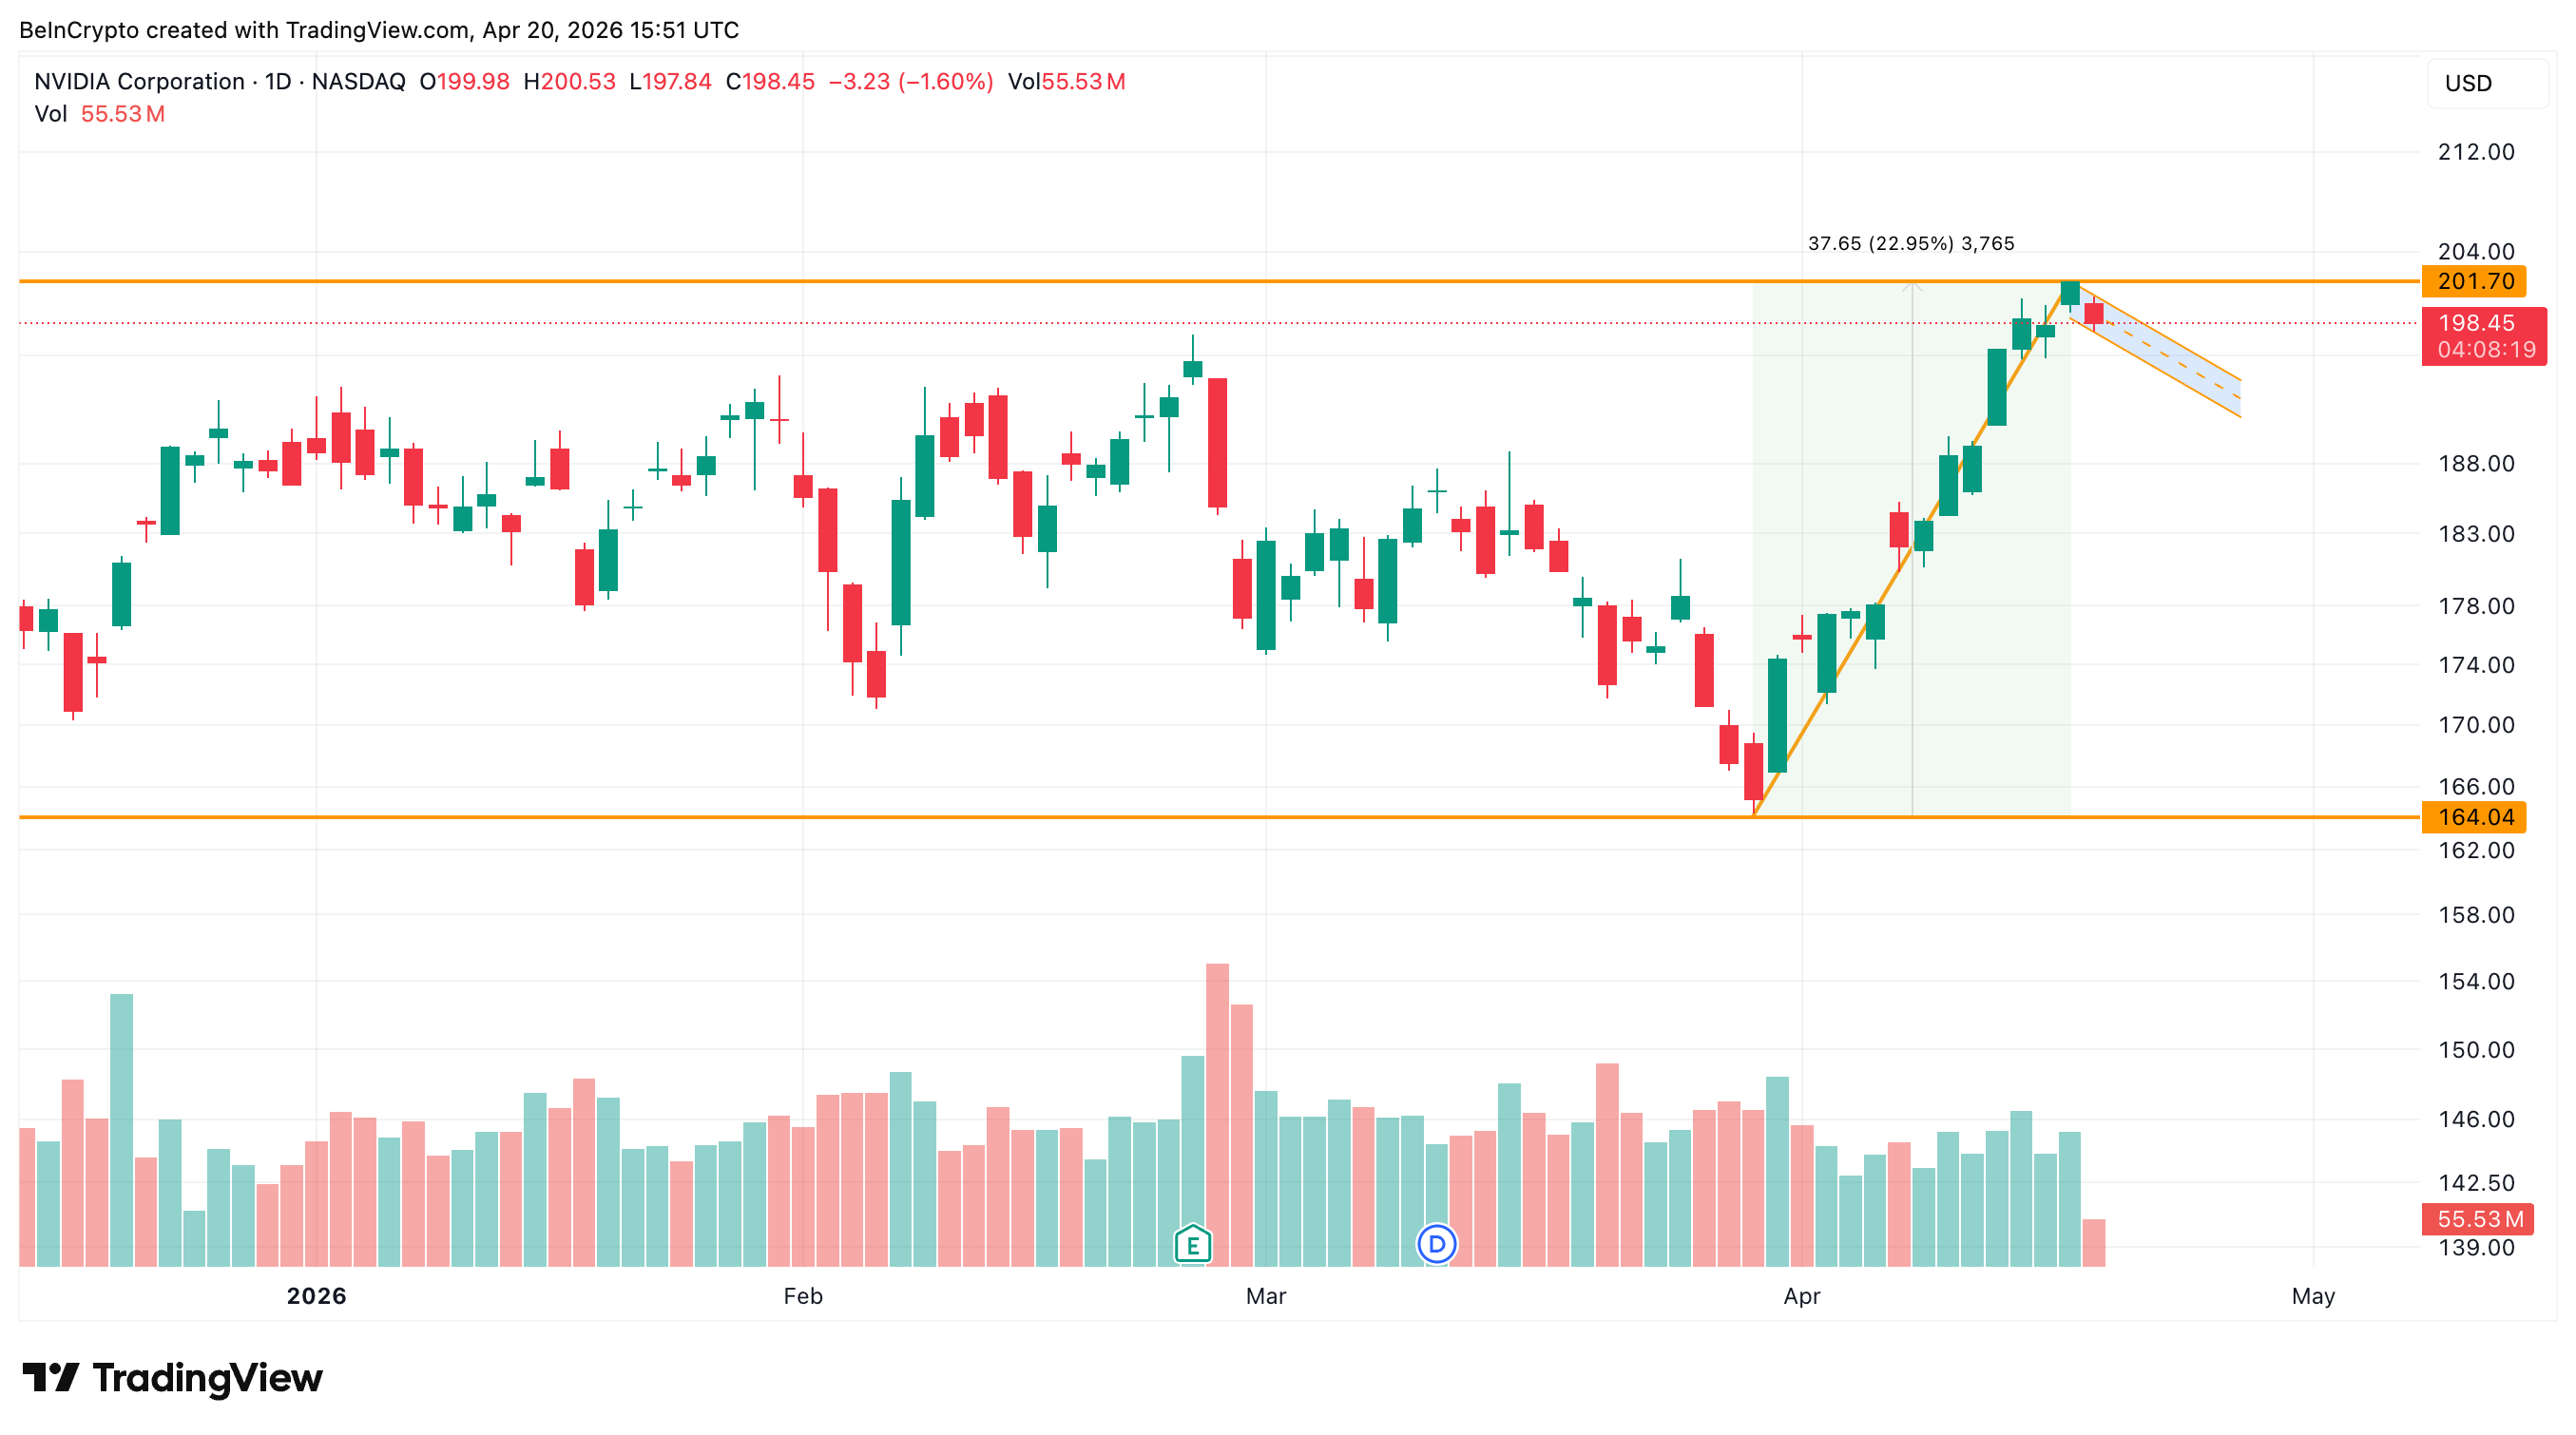
Bitcoin’s measured move projects $90,841, a 21% extension. NVDA’s measured move projects $248, a 23% extension. The geometry is near-symmetric.
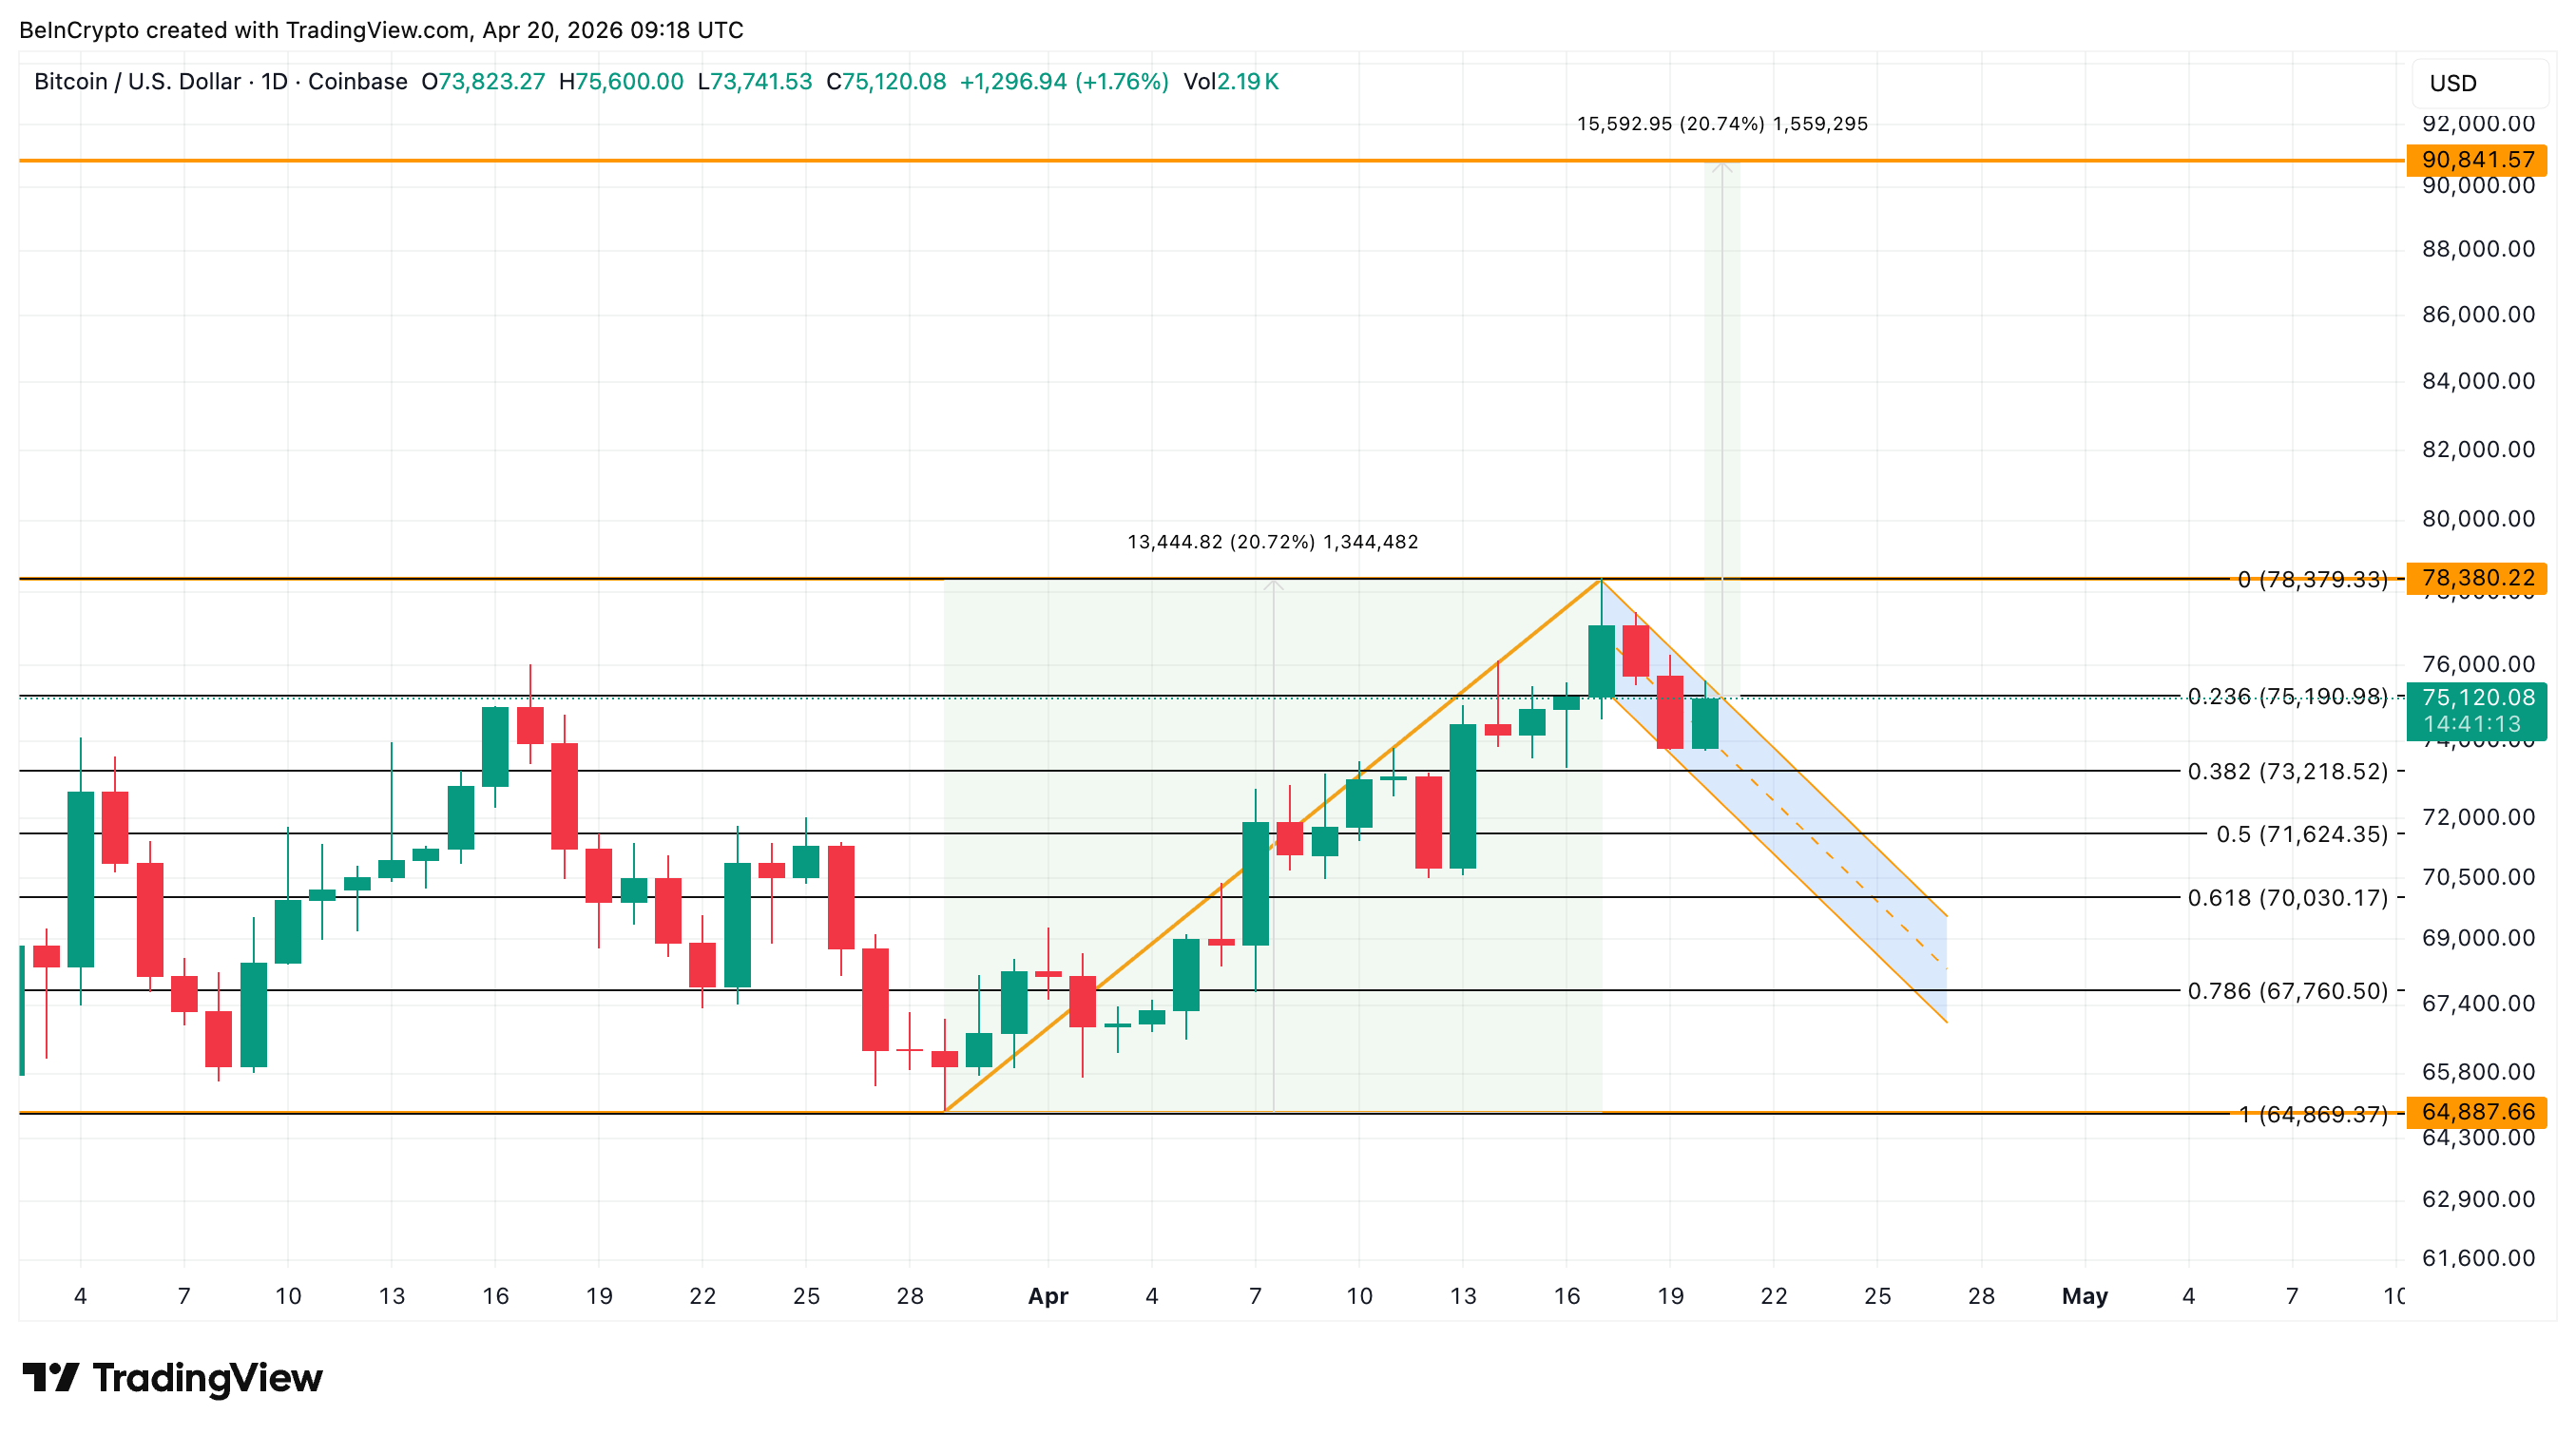
One difference sharpens the read. Bitcoin’s handle shows two rejections at the upper trendline and a long upper wick on April 20. NVDA’s handle shows the opposite footprint, with pullback volume visibly thinner than the seven green candles that built the pole.
Two assets at matched volatility, bottomed together, peaked together, facing the same measured-move math, printing the same pattern. This is not a correlation. The same money is possibly buying both.
The volatility alignment explains the rally size. The next question is whether institutions are actually paying to stay long inside the handle.
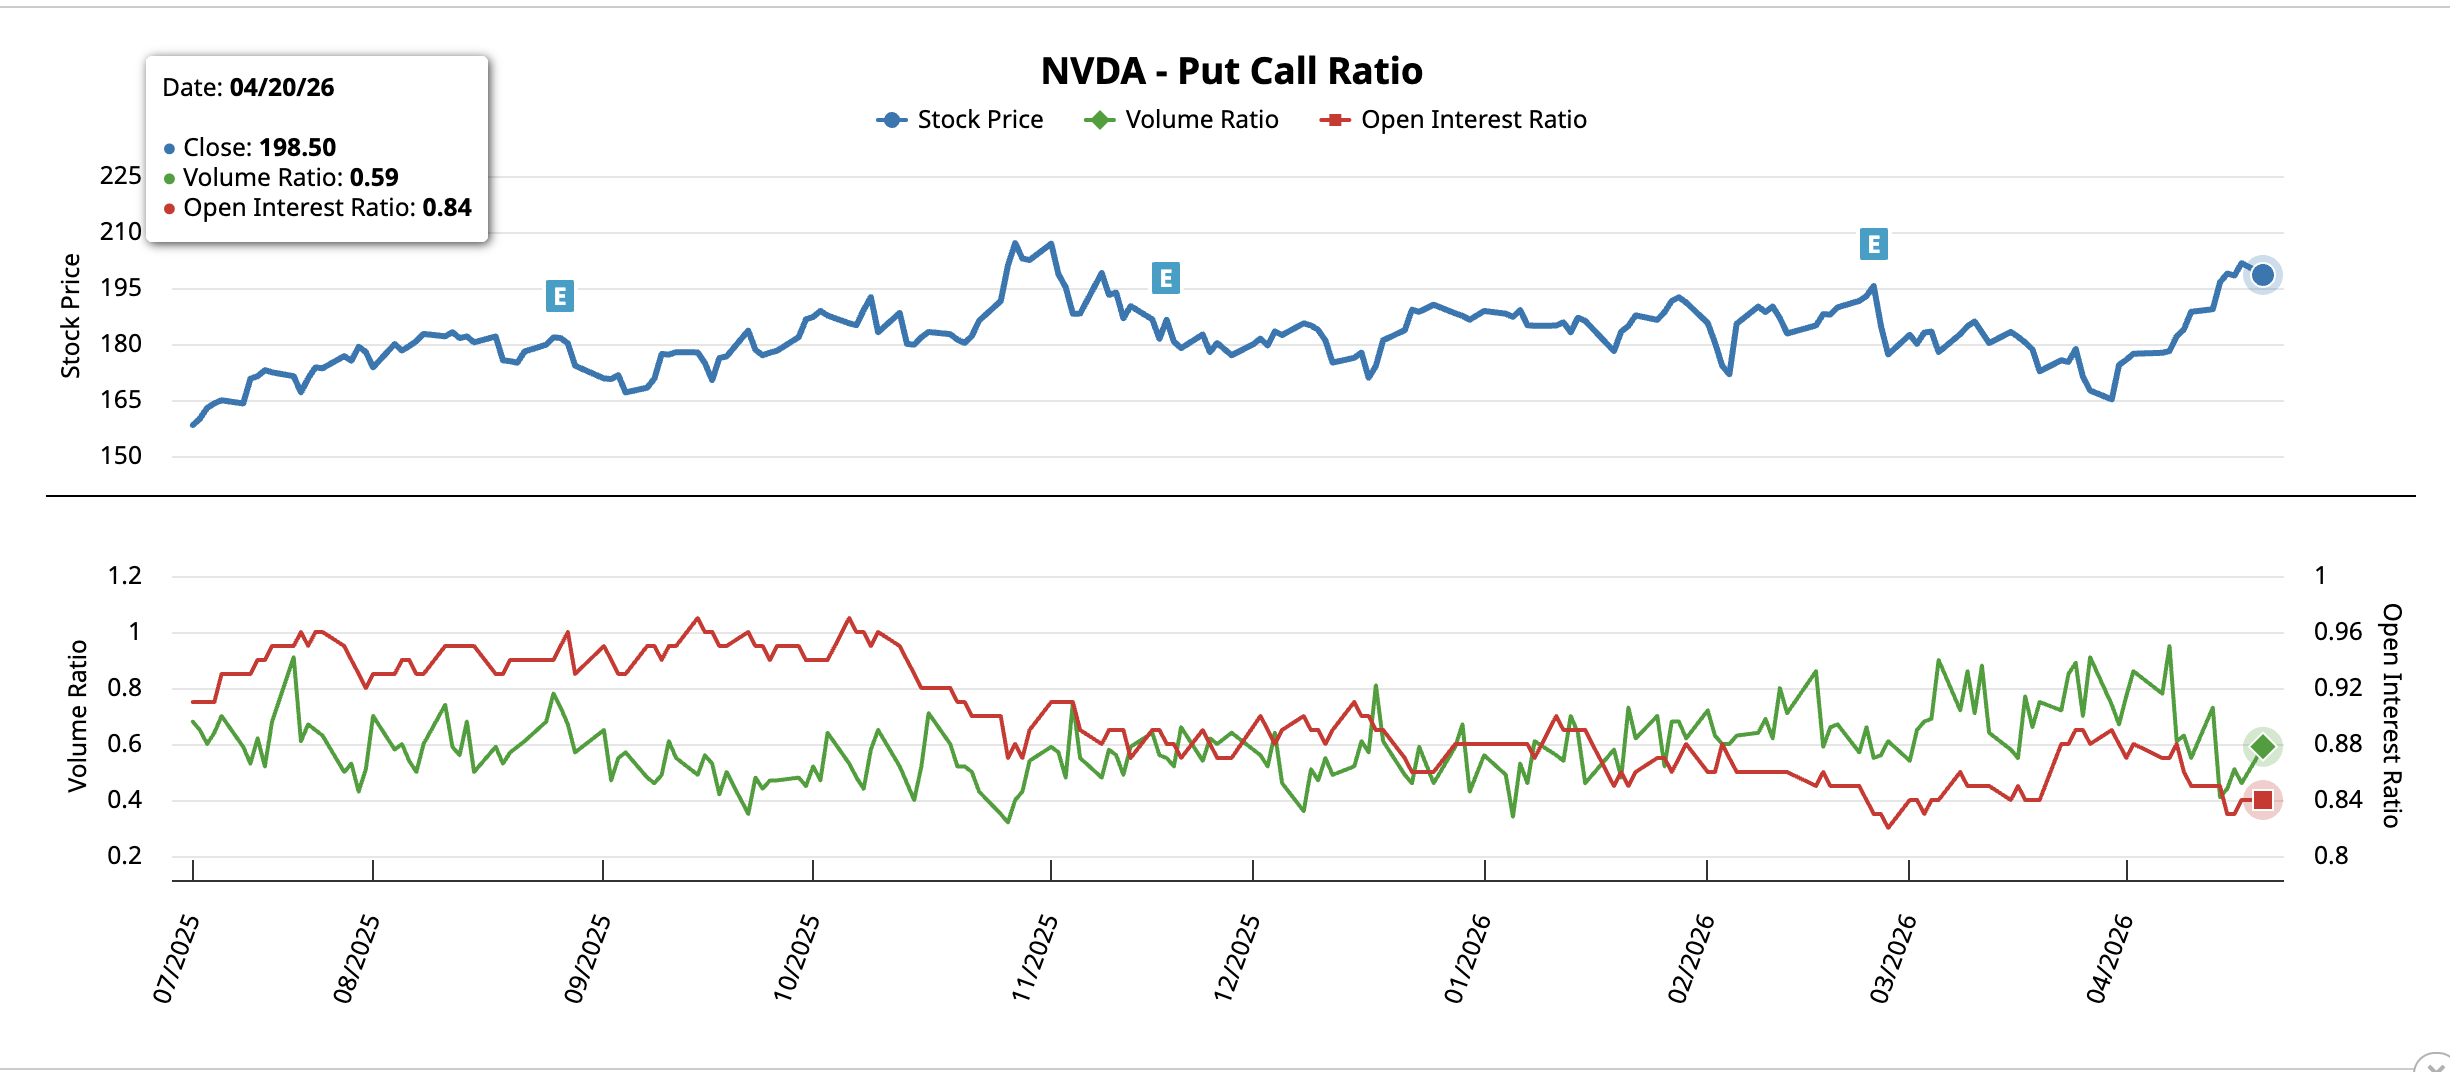
Put-Call Ratio Drops as Tariff Refund Clears Tail Risk
The bull flag needs a demand catalyst inside the handle, and the options tape is already supplying one. NVIDIA’s put-call ratio compares bearish put activity to bullish call activity. The reading has moved lower on both measurement methods since the March 30 pole base.
On March 30, when NVDA bottomed at $164.04, the volume-based ratio read 0.74. The open-interest-based ratio read 0.89. Both sat near the upper end of the post-October 2025 range, reflecting thick downside hedging at the low.
NVDA now trades at $199.24. The volume ratio has fallen to 0.59, and the open interest ratio sits at 0.84. That is a 20% compression in volume and a 6% compression in open interest. Both point in the same direction. Puts (bearish bets) are being closed faster than calls (bullish bets). That is the counterintuitive signal. Hedging usually rises as prices approach resistance. Here it is falling.
Options desks are not buying insurance against the $201.75 rejection.
The catalyst explaining the unwind landed today. The Supreme Court ruled Trump’s reciprocal tariff policy unlawful. The US government has begun refunding up to $166 billion to 330,000 importers across 53 million shipments. Refunds plus interest are scheduled within 60 to 90 days.
NVIDIA’s hardware stack depends on imported components across the global semiconductor supply chain. The tariff rollback reduces forward cost pressure on the AI infrastructure build-out. More importantly, the ruling retires a specific tail risk that had sat on the options curve through 2025. That is the exact risk the puts were pricing, now being dismantled.
Downside protection is cleared with a real catalyst under the tape. The NVIDIA price chart becomes the final decider of how far the bull flag can travel.
NVIDIA Stock Needs $201.75 Close to Activate $250 Target
The NVDA price action has the final call. The pole stalled at $201.75, which is not arbitrary resistance. That zone marks the 0.618 Fibonacci level while plotting the previous swing.
Capital flow confirms the pole was real. Chaikin Money Flow (CMF), a proxy for institutional buying and selling pressure, currently reads 0.21.
CMF traveled from roughly -0.25 at the March low to above zero in mid-April. The indicator then pushed into positive territory as the rally extended. That sequence confirms that real money was rotated in while the pole was being built.
This is why the Bitcoin volatility match is not a statistical coincidence. The same institutional pools are bidding on NVIDIA stock the way they rotate into Bitcoin. Synchronized March bottoms, parallel 21-23% poles, matched 27.7% and 27.8% volatility, and CMF inflows together describe one liquidity regime.
A daily close above $201.75 activates the 23% pole projection, which adds roughly $46 to the breakout trigger. The extension at $253.82 aligns with horizontal resistance at $248.25, suggesting $250 as the average target.
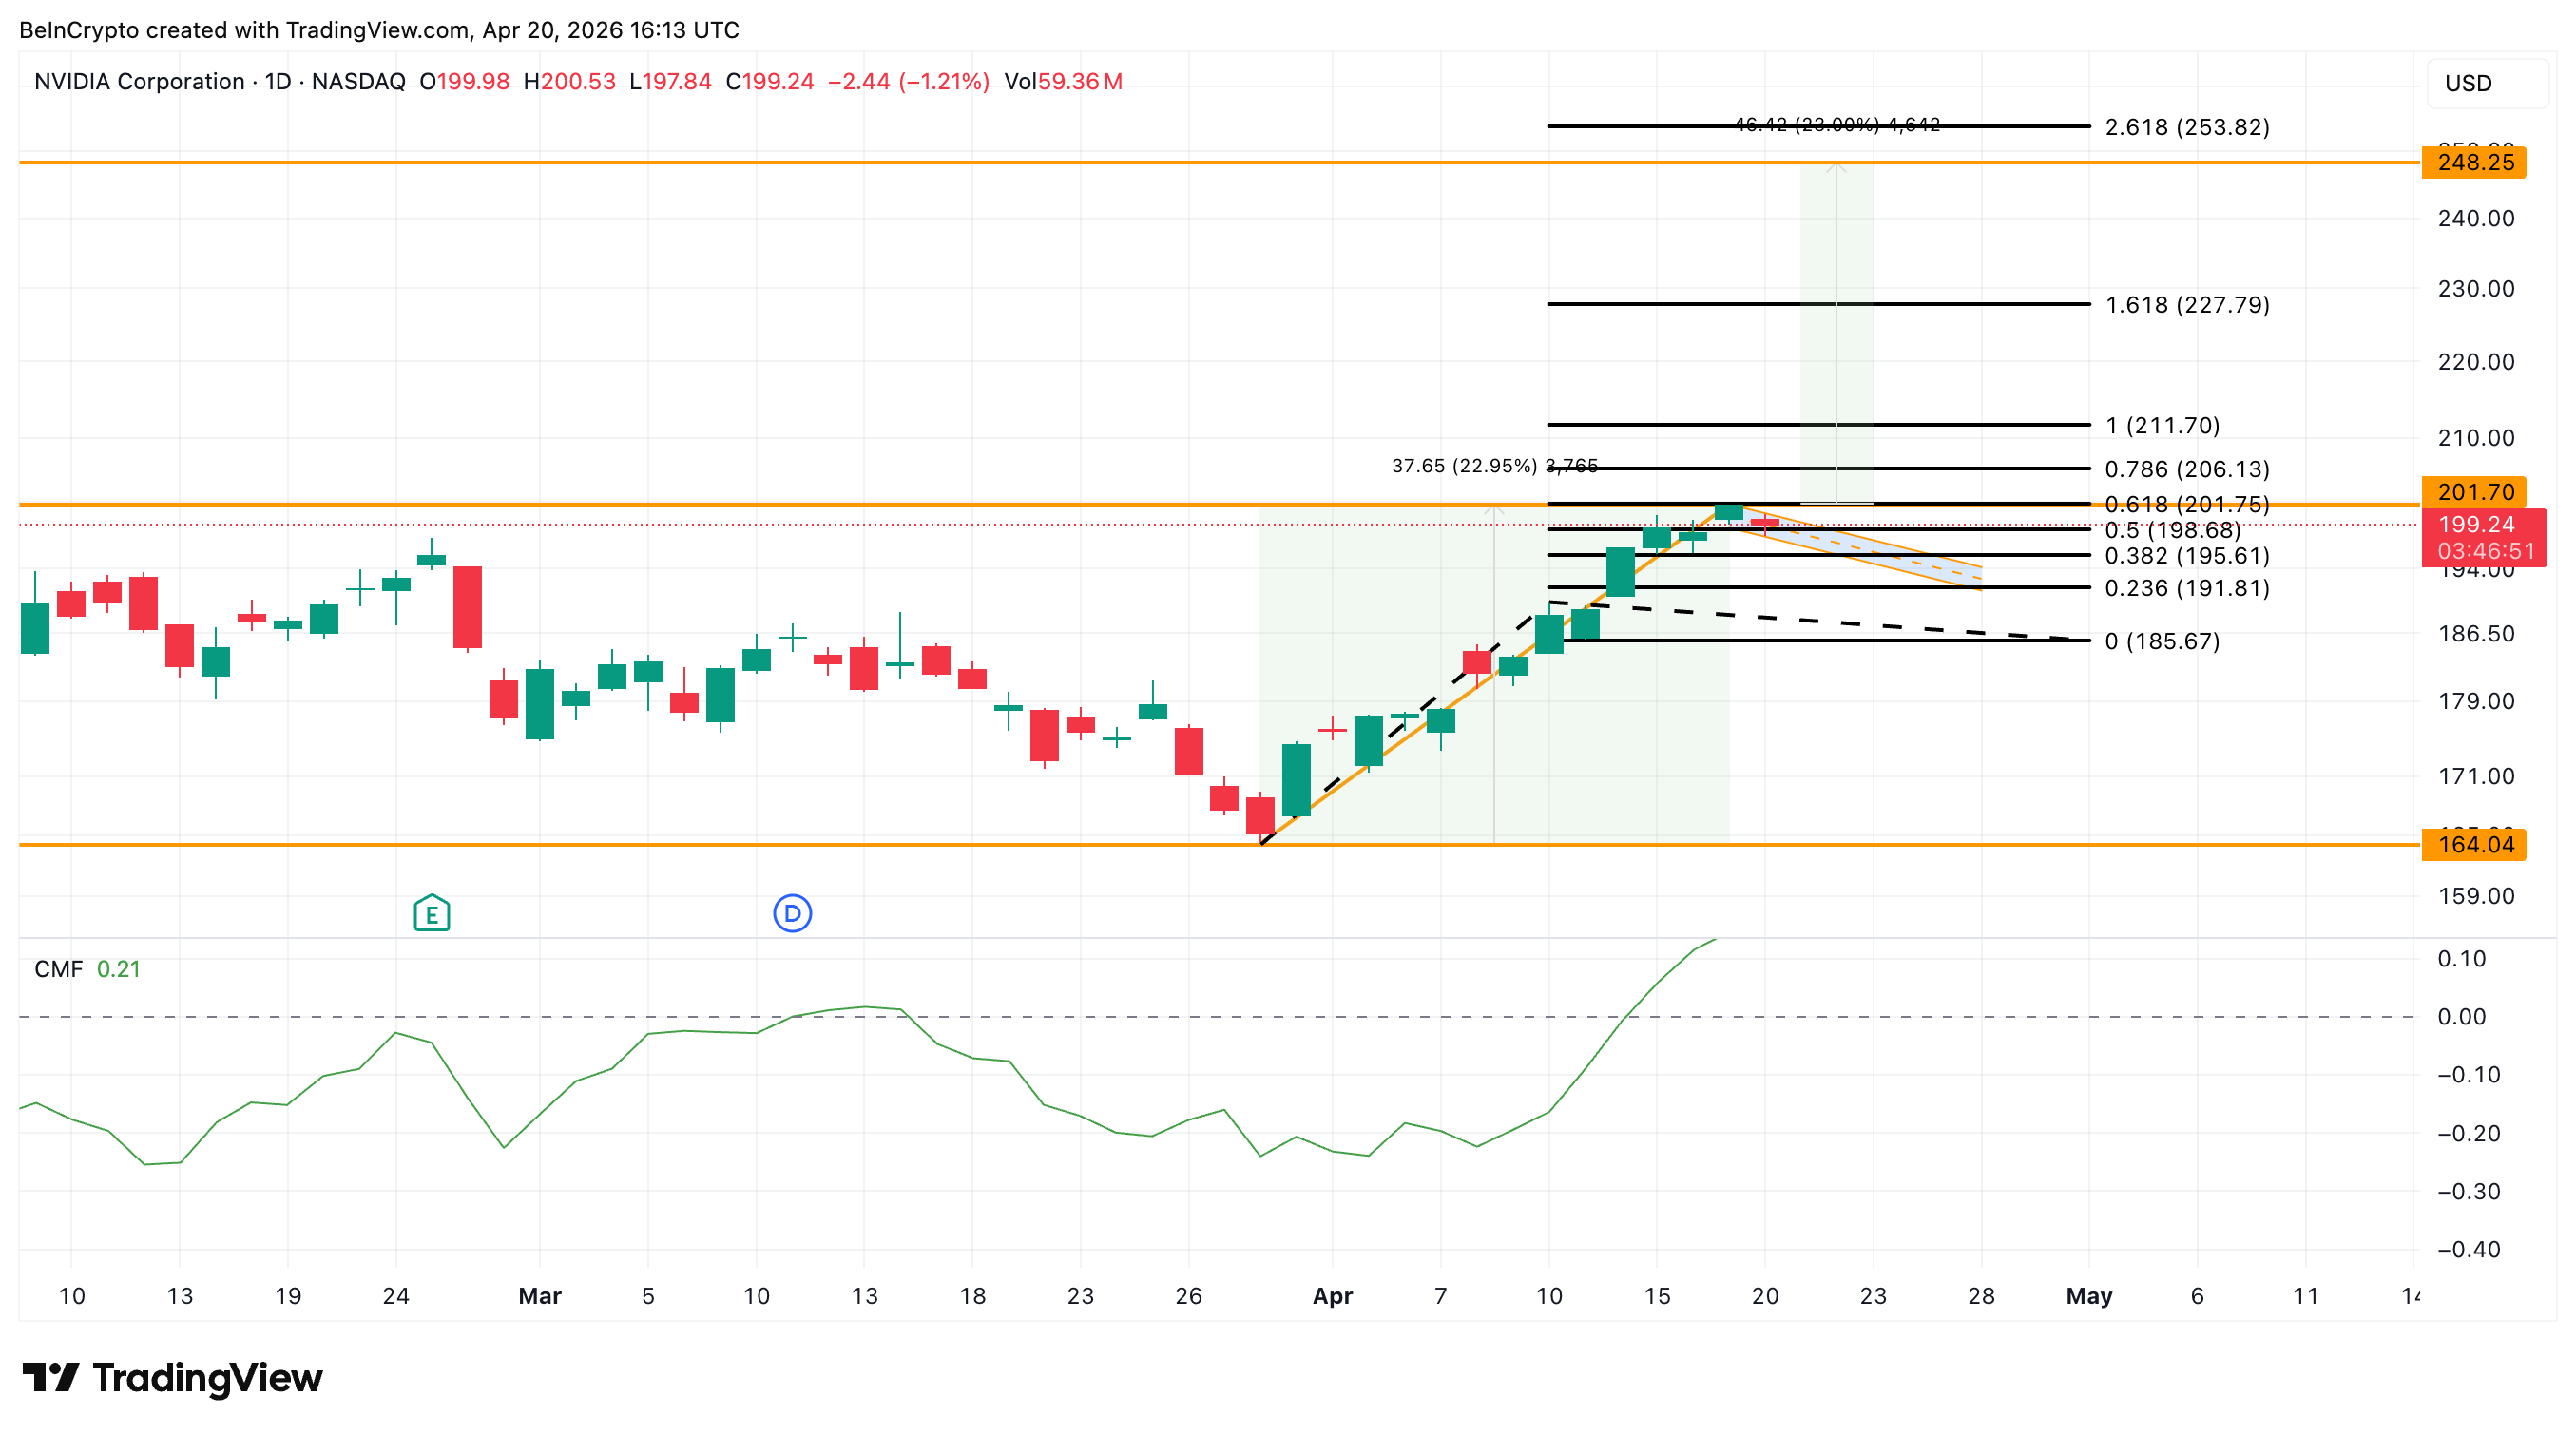
Intermediate checkpoints sit at $211.70 and $227.79. Bull flags in high-volatility regimes can meaningfully widen their handles before resolving. A dip into the $191 zone does not automatically invalidate the pattern. Only a daily close below $185.67 would significantly weaken the structure.
This NVDA price prediction now depends on one level. $201.75 separates the $250 path for NVIDIA stock from a $185.67 retest that would weaken the bull flag.
The post NVIDIA Mirrors Bitcoin Setup as Trump’s Tariff Refunds Hit appeared first on BeInCrypto.


Oil price news Monday showed Brent crude jumped 4.3% to $94.18 and WTI rose 5.6% to $88.54, reversing Friday’s 9% collapse as Iran reimposed Strait of Hormuz restrictions over the weekend, the US Navy seized the Iranian cargo vessel Touska, and Kpler maritime data recorded zero tanker crossings of the strait on Sunday.
Summary
- Iran’s IRGC fired on two vessels attempting to transit Saturday before declaring the strait closed until the US lifts its naval blockade.
- The USS Spruance fired several rounds at the Touska after it ignored six hours of warnings, then US Marines boarded and took custody of the ship.
- Iran’s Foreign Ministry said Monday it has “no plans” for the Pakistan talks, leaving the ceasefire that expires Wednesday without a diplomatic path forward.
Oil price news opened the week with a sharp reversal of Friday’s optimism. Iran’s foreign minister had announced Friday that the Strait of Hormuz was completely open, sending Brent crude crashing 9%. By Saturday, Iran had reimposed restrictions, its gunboats were firing on tankers, and by Sunday the US had seized an Iranian-flagged cargo ship in the Gulf of Oman. The physical market confirmed the reversal: Kpler data recorded no oil tankers crossing the strait on Sunday.
The strait normally carries roughly 20% of the world’s oil and liquefied natural gas. ADNOC CEO Sultan Al Jaber put the cumulative supply loss at nearly 600 million barrels over approximately 50 days of the crisis, a figure that does not normalize quickly even under a genuine ceasefire.
“Markets are trading in a world where there is plenty of spin, statements, and speculation, but very little information of substance,” UBS Global Wealth Management chief economist Paul Donovan wrote in a Monday morning note. “Events over the weekend have reversed some of that optimism.”
Iran announced Saturday it was reimposing restrictions on the strait, accusing the US of failing to lift its naval blockade despite the April 8 ceasefire terms. IRGC gunboats fired on two India-flagged vessels attempting to transit. The UK Maritime Trade Operations Centre reported a tanker approached and fired upon with no prior radio warning.
The US Navy destroyer USS Spruance fired several rounds from its 5-inch gun at the Iranian-flagged cargo vessel Touska on Sunday after the ship ignored six hours of warnings to comply with the blockade. US Marines then rappelled from helicopters and took custody of the vessel. Trump announced the seizure on Truth Social, calling it a situation that “did not go well for them.”
Iran’s military called the seizure “maritime piracy” and warned retaliation would follow once the safety of the crew and their family members aboard was confirmed.
The Market’s Read and What Comes Next
The ceasefire expires Wednesday. Iran has declared it has no plans to attend a second round of Pakistan talks. The US delegation led by Vice President JD Vance is heading to Islamabad regardless. That asymmetry, Washington traveling for talks while Tehran publicly refuses to show up, defines the next 48 hours as the highest-risk window since the original ceasefire was struck.
Wholesale gasoline prices rose over 3% Monday and heating oil futures, a proxy for jet fuel, spiked 4%. S&P 500 futures fell 0.5% while Nasdaq futures dropped 0.6%, signaling that energy-driven inflation fears are once again bleeding into broader equity risk pricing.
For oil bitcoin dynamics, Monday’s Brent print at $94 returns crude to the level where oil inflation expectations begin to suppress Federal Reserve rate cut prospects and compress risk appetite simultaneously. Tracking prior week sessions shows that each Hormuz escalation has produced a progressively smaller BTC drawdown, suggesting institutional demand is absorbing the selling pressure even as the macro headwind persists.
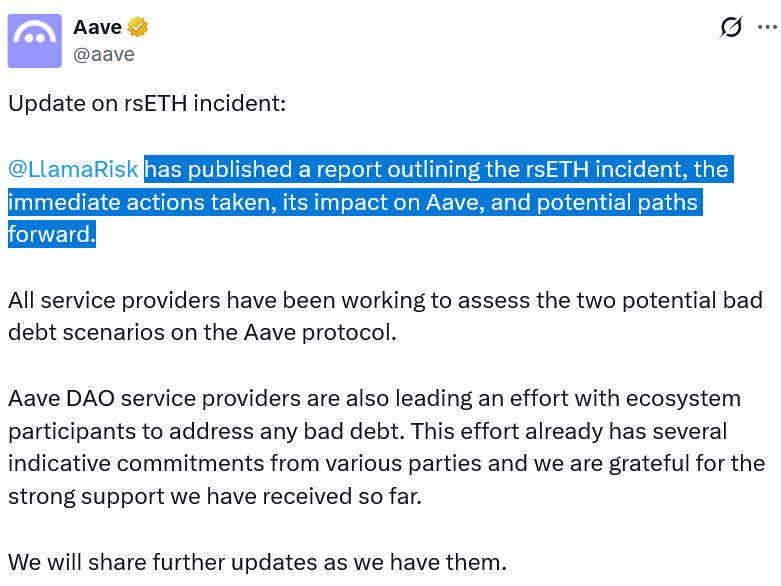
Decentralized lending platform Aave’s risk management provider has outlined two scenarios on how bad debt from the Kelp DAO exploit over the weekend could impact the ecosystem, depending on how the losses are allocated.
The incident began on Saturday when hackers stole 116,500 Kelp DAO Restaked ETH (rsETH) tokens worth $293 million from Kelp DAO’s LayerZero-powered bridge and used them as collateral on Aave V3 to borrow wrapped Ether (wETH).
On Monday, LlamaRisk modeled two possible scenarios for how this “bad debt” could materialize on Aave, noting that the final decision rests with Kelp DAO.
The incident highlights the contagion risk in DeFi, where a single bridge exploit can trigger liquidity crunches and mass withdrawals across interconnected protocols like Aave, which has seen nearly $10 billion in value leave the protocol since the Kelp DAO exploit took place.

Two scenarios and potential paths forward
The first scenario would see losses spread across all rsETH token holders on Ethereum mainnet and Ethereum layer 2s, resulting in roughly $123.7 million of bad debt on Aave while risking a 15% depeg in rsETH relative to Ether (ETH).
LlamaRisk said this first scenario would spread losses more thinly across all chains, while noting that wrapped Ether (wETH) would be “absorbing the bulk in absolute terms but barely noticing it relative to its reserve depth.”
Aave could also use its Umbrella security model to cover losses in wETH under the first scenario, noting that 18,922 Aave Wrapped ETH (aWETH) tokens worth nearly $43.7 million have entered the unstaking cooldown phase.
The second scenario would shift the entire shortfall to Ethereum layer 2 networks, such as Arbitrum and Mantle. However, the bad debt would be significantly higher at $230.1 million.
LlamaRisk also noted that Aave has around $181 million in its treasury that could be used to address a potential bad debt shortfall.

Related: Aave DAO backs V4 mainnet plan in near-unanimous vote
On Monday, Kelp DAO said it is still assessing the financial impact of the exploit and how to safely unpause the protocol, adding that it is working with Aave, LayerZero and other stakeholders on a path forward.
Kelp DAO sheds more light on the exploit
Kelp DAO also shared more details about the incident, saying that two nodes tied to the LayerZero bridge were compromised, while a third was hit with a distributed denial-of-service attack.
The attacker forged a seemingly valid transfer message that the system approved, allowing 116,500 rsETH to be minted on one of LayerZero’s bridges.
Kelp said it paused all relevant contracts on Ethereum and Ethereum layer 2s and blacklisted all wallets tied to the exploiter shortly after, preventing them from stealing another 40,000 rsETH worth $95 million.
Magazine: Are DeFi devs liable for the illegal activity of others on their platforms?


Iran news today centers on Tehran’s formal refusal to send negotiators to Islamabad, Al Jazeera reported Monday, with Foreign Ministry spokesman Esmaeil Baghaei stating that “no clear prospect for productive negotiations is foreseen under current conditions,” even as a US delegation led by Vice President JD Vance prepared to depart for Pakistan with no Iranian counterpart confirmed to meet them.
Summary
- Baghaei cited the US naval blockade and the Sunday seizure of the Touska as ceasefire violations that make talks impossible, calling US statements about negotiations “a media game” and a “blame game.”
- Iran’s state news agency IRNA said Tehran’s absence from the second round stems from Washington’s “excessive demands, unrealistic expectations, constant shifts in stance, and repeated contradictions.”
- Pakistan’s Foreign Ministry confirmed that Iranian and Pakistani foreign ministers spoke by phone Sunday about the need for continued dialogue, leaving a narrow opening for Iran to reverse its public position before Wednesday’s ceasefire expiry.
Iran news today delivered the most negative diplomatic signal yet in the ceasefire’s final days. Iran’s Foreign Ministry formally declared it had no plans to attend a second round of Pakistan-mediated negotiations, arriving on the same morning that President Trump announced a US delegation was already heading to Islamabad and Pakistan had deployed thousands of security personnel around the capital’s Red Zone in preparation.
The contradiction between Washington’s public confidence and Tehran’s formal rejection has become the central dynamic of the ceasefire’s expiration window.
Iranian spokesman Baghaei posted on X that Washington had “violated the ceasefire from the beginning,” citing both the ongoing US naval blockade of Iranian ports since April 13 and the Sunday seizure of the Touska as grounds for refusing to negotiate under current conditions. Iran’s state agency IRNA described the US approach as designed to blame Tehran for any breakdown.
The first round of Islamabad talks, held April 11 and 12, lasted 21 hours and ended with Vance saying Iran refused to agree it would not develop nuclear weapons. Iran’s state broadcaster called the failure a result of US excessive demands. The two central sticking points, the Strait of Hormuz and Iran’s enriched uranium stockpile, remain unresolved.
Iran’s parliament speaker and chief negotiator Mohammad Bagher Ghalibaf said in state television remarks that Iran remains ready militarily even while pursuing diplomacy. “It is impossible for others to pass through the Strait of Hormuz while we cannot,” he said, tying the strait’s opening directly to the US lifting its blockade.
Pakistan has framed the negotiations as an ongoing process rather than a single round, referring to an “Islamabad process” and continuing to mediate between the parties. Prime Minister Shehbaz Sharif spoke with Iranian President Masoud Pezeshkian on Sunday, and their readout noted the need for “continued dialogue and engagement.”
Why Iran’s Suspicion Is Running High
Tehran has told intermediaries it suspects the US announcement of talks is cover for a planned military strike timed to coincide with the ceasefire’s expiry. That fear is not irrational: Trump has framed the ceasefire repeatedly as Iran’s “last chance” and has renewed his threats to bomb Iranian power plants and bridges if no deal is reached by Wednesday. The Sunday seizure of the Touska, coming hours after Trump announced the Pakistan talks, deepened Iranian suspicion that military action and diplomacy are being coordinated as pressure rather than as alternatives.
An Iranian parliamentary official told Al Jazeera on Monday that Iran would “likely” send a team “today or tomorrow,” suggesting that the Foreign Ministry’s public rejection and the internal deliberations may not be the same position. Pakistan’s continued preparations suggest Islamabad has reason to believe Iran may still participate despite the public statement.
For crypto markets, every Iran hopes signal has previously driven a fast BTC rally as shorts covered. The pattern from prior talks collapse episodes shows the reverse is equally true: a confirmed breakdown of negotiations with no second round produces an immediate risk-off move that tests Bitcoin’s support levels around $73,000 to $74,000.


Bitcoin price today opened at $74,335, down 1.6% over 24 hours, Yahoo Finance reported, as the asset absorbed the weekend’s Iran escalation significantly better than oil, which surged over 5%, and European equities, which fell over 1%.
Summary
- Brent crude surged over 5% and S&P 500 futures fell 0.5%, while Bitcoin dropped only 1.6%, the smallest BTC drawdown relative to oil of the entire Hormuz crisis.
- Ethereum traded near $2,310, holding well above its post-Islamabad lows near $70,600, supported by nearly $1 billion in ETF inflows recorded last week.
- The Crypto Fear and Greed Index rose to 29, its highest reading since late January, even as Iran’s IRGC threatened retaliation for the Touska seizure.
Bitcoin (BTC) price today is being closely watched for what it reveals about the structural change in how crypto absorbs Iran war headlines. CoinDesk noted Monday that BTC has “proved more resilient than oil and equities to the latest Iran-related flare-up.” Brent surged over 5%. S&P 500 futures dropped 0.5%. Dow Jones futures fell roughly 450 points. Bitcoin slipped 1.6% to $74,335.
Ethereum traded near $2,310, down less than 1% over 24 hours, holding the level it reclaimed after the April 8 ceasefire announcement. When Iran first closed the Strait of Hormuz at the end of February, Bitcoin dropped into the low $60,000s alongside every other risk asset. The same event replaying now, nearly 50 days into the conflict, produces a fraction of that drawdown.
Last week, Bitcoin spot ETFs attracted nearly $597 million in inflows over two days on ceasefire hopes, according to SoSoValue data. That demand did not evaporate when the ceasefire began unraveling Saturday. Strategy added 34,164 bitcoin for $2.54 billion, its third-largest single purchase on record. The combination of sustained ETF buying and corporate accumulation means Iran headline selling is absorbed before it reaches significant depth in spot markets.
The pattern is visible across the conflict timeline. The February Hormuz closure sent BTC down roughly $15,000. Comparable escalations now produce moves of $3,000 to $4,000. Each successive Iran shock produces a smaller drawdown, reflecting the institutional demand floor that has built continuously through ETF inflows since January 2024.
What the ETF Floor Means for Ethereum
Ethereum at $2,310 is holding above the $2,200 level it reclaimed on the April 8 ceasefire announcement, though it sits below the $2,440 peak briefly reached Friday when Hormuz was declared open. The $130 gap between Friday’s high and Monday’s price represents the ceasefire premium that has since unwound.
The ceasefire breach pattern across six weeks shows that crypto markets price each escalation fast but rarely surrender all prior gains, because traders are simultaneously pricing eventual resolution. Bitcoin’s key support sits between $73,000 and $74,000, where ETF inflows accelerated last week and where institutional buyers are expected to defend spot prices if selling resumes.
The Wednesday Expiry as the Hard Deadline
The April 22 ceasefire expiry is now two days away with no Iranian delegation confirmed for the Pakistan talks. A ceasefire extension or last-minute deal would likely replicate the April 8 template: oil falling 13% and BTC surging to $72,700 within hours of the original announcement.
A full collapse of negotiations with resumed strikes would test whether the institutional demand floor holds below $70,000, the level analysts identified as pre-conflict structural support. Bitcoin’s behavior at that level, whether it holds or breaks, will tell markets whether the floor is genuine or a product of ceasefire-specific sentiment that does not survive a return to open hostilities.

Iran war news escalated Monday as President Trump renewed his threat to bomb Iranian bridges and power plants if no deal is reached before Wednesday’s ceasefire expiry, NBC News reported, even as Iran’s central military command warned its response to any civilian infrastructure strike would be “much more devastating and widespread.”
Summary
- Trump told reporters Iran is “getting obliterated” and said he alone controls any ceasefire decision, adding he has given Tehran opportunities to end the war that they have not taken.
- When asked if bombing civilian infrastructure would be a war crime, Trump said: “No. I hope I don’t have to do it.”
- Iran’s Khatam al-Anbiya military command warned that any repeat attack on civilian targets will trigger a “much more devastating and widespread” response.
Iran war news reached its most dangerous threshold this week as Trump used the Wednesday ceasefire expiry as a hard deadline for Iran to accept his terms or face strikes on power plants, bridges, and other civilian infrastructure. The threat is not new: Trump warned “a whole civilization will die tonight” on April 7, before agreeing to the current two-week ceasefire hours later. He has now renewed the threat with the ceasefire’s final days running out and no deal in sight.
“No. I hope I don’t have to do it,” Trump told reporters Monday when asked directly if bombing civilian infrastructure would constitute a war crime. He pointed to Iranian attacks on civilians throughout the conflict, saying: “They’re animals, and we have to stop them.”
Iran’s Khatam al-Anbiya Central Headquarters issued a formal statement Monday: “If attacks on civilian targets are repeated, the next stages of our offensive and retaliatory operations will be much more devastating and widespread.”
Trump simultaneously described Iran as negotiating “in good faith” and told Axios on Sunday that “the concept of the deal is done,” while maintaining his infrastructure strike threat on a parallel track. That framing positions the threat as pressure rather than intent, but the US military in the Central Command region has maintained full strike readiness throughout the ceasefire period.
Iran has said any attack on its power plants would trigger retaliatory strikes on power stations and desalination plants across Gulf Arab states. Iranian authorities urged civilians to form human chains around power plants as a deterrent. Iran’s internet infrastructure has already suffered outages attributed to earlier strikes, and the Bushehr nuclear facility was previously hit.
Asked about a Pakistani proposal for a 45-day extended ceasefire, Trump described it as “not good enough, but a very significant step,” the closest he came Monday to acknowledging that a bridging framework exists.
The Legal and Diplomatic Context
Legal experts have consistently described Trump’s specific threats against power plants and water infrastructure as potential war crimes under international humanitarian law and the Fourth Geneva Convention. Attacking civilian infrastructure that does not serve a direct military function constitutes collective punishment of a civilian population, which is prohibited under the Geneva rules.
Trump rejected the framing when pressed directly. Secretary of State Marco Rubio did not respond to reporters’ questions about whether civilian infrastructure strikes would constitute war crimes. The administration has not publicly offered a legal argument that the targeted infrastructure qualifies as dual-use military assets.
Pakistan, Egypt, and Turkey have all been working on bridging proposals. Iran has told intermediaries it is open to a 45-day ceasefire guaranteeing a path to a permanent settlement, a position Trump acknowledged without accepting.
What a Strike Would Mean for Oil and Crypto
For oil bitcoin correlation dynamics, a confirmed strike on Iranian civilian infrastructure without a deal removes any near-term prospect of diplomatic resolution and pushes Brent crude through the $100 level toward the war-peak range of $114 to $166. The market has been trading diplomatic signals, not military reality. An executed infrastructure strike resets that calculus entirely.
A nuclear deal scenario, the opposite outcome, remains on the table but requires Iran to accept some form of nuclear concession it has publicly rejected. Analysts have outlined a path from Bitcoin at $74,000 to $100,000 under a genuine ceasefire and Hormuz reopening, a scenario that requires the opposite of what civilian infrastructure strikes would produce.

Bitcoin’s weekend correction found a line of buyers at lower levels, suggesting that dip-buying sentiment remains intact for now. SoSoValue data indicates that U.S. spot BTC exchange-traded funds logged $996 million in inflows last week, the strongest weekly showing since early January. The news comes as Macro headlines loom, with a high-stakes political backdrop threatening to tilt risk assets if a ceasefire agreement with Iran does not hold, or if the truce is not extended beyond its two-week window.
In another notable development, Michael Saylor’s Strategy treasury continued its aggressive accumulation, adding 34,164 BTC between April 13 and April 19 for roughly $2.54 billion. The new purchases lift Strategy’s total holdings to 815,061 BTC, acquired for about $61.56 billion. The move underscores a persistent emphasis on Bitcoin as a long-duration treasury asset even amid short-term volatility.
Key takeaways
- BTC remains buoyed by dip-buying momentum, with ETF inflows lending sustained support and a potential path toward higher levels if demand persists.
- As BTC eyes an upside test, several major altcoins have retraced to key support zones, suggesting bears may still pressure rallies in the near term.
- Strategic accumulation by the largest BTC treasury holder highlights continued institutional demand, reinforcing Bitcoin’s role as a balance-sheet asset even in uncertain macro conditions.
- The macro picture—strong U.S. equity strength and a softer dollar—continues to interact with crypto, though looming geopolitical and policy headlines inject additional risk into near-term moves.
Bitcoin price action and technical setup
Technically, BTC has bounced from the 20-day moving average near $72,832, a sign that buyers view any dips as opportunities rather than exits. The next critical zone to watch sits around the $76,000 to $78,333 neighborhood, which forms a formidable overhead resistance for the immediate rally.
If BTC can clear that resistance and close above the zone, the path could open toward an aggressive upside toward $84,000, with a deeper arc toward the psychological and chart-resistance target near $92,000. Conversely, a rejection at the overhead zone and a break below nearby moving averages would signal a renewed risk-off tone, potentially derailing the relief rally that has been shaping sentiment over the past weeks.
Macro backdrop shaping crypto sentiment
The broader market backdrop remains mixed. The S&P 500 carved a fresh record high near 7,147, a move that cooled concerns about recession-era risks but pushed the index into overbought territory per RSI readings. While such strength supports risk-on assets, it also raises the risk of a short-term consolidation should momentum ease.
Meanwhile, the U.S. Dollar Index has softened from its 20-day moving average, with the index dipping to a support area around 97.74. A relief rally could face selling pressure at the 20-day EMA, and a sustained break below that level could open a path toward the 96.21 support area. Market participants appear intent on a broader range between 95.55 and 100.54 until a decisive breakout above 100.54 or below 95.55 occurs.
On balance, the macro environment keeps crypto markets tethered to structural risk sentiment. Each new development—whether geopolitical, policy-related, or macroeconomic—could tilt the balance between risk-on appetite and caution that weighs on significant Bitcoin rallies.
Altcoin circuit: round-up of near-term setups
Ethereum (ETH)
ETH buyers tried to push past the $2,415 barrier over the weekend, but bears held the line, triggering a pullback to the 20-day EMA around $2,252. To reassert the relief rally, buyers will need to defend that EMA and secure a close above $2,415. A decisive push could open the door toward the $2,800 level, while failure to hold could keep ETH in a broader $1,916–$2,415 range for now.
BNB
BNB has been oscillating between roughly $570 and $687, with the moving averages flattening and the RSI hovering near the midpoint. A breakout above $650 would potentially clear the way toward a test of $687, while a break below the $570 floor could extend a move toward the lower end of the range. The next sustained move will likely hinge on a close above $687 or below $570.
XRP
XRP has traded within a tight band between $1.27 support and $1.61 resistance as traders await a potential breakout. A close above the downtrend line would signal a possible shift higher toward $2, while a break below $1.27 would reopen downside risks, with support near $1.11 and a risk of sliding toward the descending-channel line if selling accelerates.
Solana (SOL)
SOL has dipped below nearby moving averages, hinting at ongoing selling pressure at higher levels. The range-bound setup suggests limited upside unless buyers push above the $90 barrier to target the $98 resistance. A sustained break above $98 could mark the start of a more durable recovery toward $117, while a drop below the 20-day EMA could push SOL toward the lower boundary of the range around $76.
Dogecoin (DOGE)
DOGE has retreated from the $0.10 level, with price action hovering around key moving averages. The near-term setup remains balanced, but a break below the $0.09 support could open a path toward $0.08 and potentially $0.06. Conversely, a sustained move above $0.10 would invite a test of the $0.12 resistance as bulls attempt to reassert control.
Hyperliquid (HYPE)
Hyperliquid has slipped back below the breakout level of $43.76 after a period above it. The 20-day EMA near $41.03 is providing a temporary anchor, but a break below that level could send HYPE toward the 50-day SMA around $38.09 and down toward $34.45. A rebound from the 20-day EMA would suggest renewed demand in the lower range, potentially pushing toward the $50–$51.43 zone if buying pressure returns with strength.
Cardano (ADA)
ADA has managed to clear the 50-day moving average near $0.26 but could not sustain the gain, slipping back below $0.25. A test of the $0.23 area has been on the cards, with a break lower potentially extending toward $0.22 and the lower boundary of the prevailing descending-channel structure. Bulls will need to push above the downtrend line to target a more constructive tilt, potentially aiming for $0.32 and then $0.37 if momentum improves.
Closing perspective
The coming weeks will test whether institutional demand and dip-buying discipline can withstand ongoing macro and geopolitical headwinds. Traders should watch for a decisive breakout in Bitcoin through the $76,000–$78,333 zone and any sustained moves beyond macro-implied thresholds, such as a refreshed dollar breakout or a renewed risk-on impulse from equities. While the current trend hints at continued volatility with selective upside potential, the next catalysts—whether policy shifts, ceasefire developments, or ETF inflows—will shape the trajectory for BTC and the broader crypto complex.


Trump’s threat of “lots of bombs” if the Iran ceasefire lapses feeds straight into Bitcoin’s war‑driven volatility and the debate over its safe‑haven role.
Summary
- Trump warns “lots of bombs start going off” if the U.S.–Iran ceasefire lapses this week
- Markets eye Strait of Hormuz and oil at $90 as key drivers for Bitcoin and macro risk assets
- Iran’s move to charge tankers $1 per barrel in Bitcoin makes any escalation a direct crypto story
U.S. President Donald Trump has warned that “lots of bombs start going off” if a fragile ceasefire with Iran expires this week, a threat that immediately drags oil, Bitcoin and broader crypto markets back into geopolitical crossfire.
Speaking in a phone interview with PBS News reporter Liz Landers, Trump said that if the truce ends on Tuesday, “then lots of bombs start going off,” even as a U.S. delegation prepares for another round of talks that may take place in Islamabad.
Asked whether Iran would attend, he replied, “I don’t know. I mean, they should show up. It’s arranged. We’ll see if they come. If they don’t come, that’s okay,” before reiterating that his bottom line for any deal is that “Iran absolutely cannot have nuclear weapons.”
The comments land after months in which the Iran conflict has repeatedly rattled risk assets, with Bitcoin swinging between drawdowns and sharp rebounds on each round of strikes and ceasefire headlines.
Reporting from outlets such as Time and The Hill has documented how Trump has threatened to “decimate” every bridge and power plant in Iran and to “start dropping bombs again” if Tehran does not accept his terms, putting direct military pressure on infrastructure around the Strait of Hormuz.
Any renewed bombing campaign in or around the Strait would likely push crude back toward or above $100 per barrel, a level Barclays and other banks have previously highlighted as plausible if shipping lanes remain blocked, with knock‑on effects for inflation expectations and Federal Reserve policy.
For Bitcoin, that feedback loop has already been visible.
Earlier phases of the conflict saw BTC (BTC) drop below $66,000 on ETF outflows and “risk‑off” sentiment before recovering toward the $70,000–$75,000 band as the “digital gold” narrative reasserted itself, according to market commentary tracked by MEXC and regional crypto media.
More recently, on‑chain data and exchange flows show Bitcoin selling off by roughly 8% after U.S.–Iran negotiations collapsed, triggering about $890 million in liquidations in six hours, before stabilizing as traders reassessed path‑of‑war scenarios.
Those price swings now intersect with a much more direct link between Iran and crypto markets.
As first reported by Yahoo Finance, Tehran has begun charging oil tankers a fee of $1 per barrel in Bitcoin to cross the Strait of Hormuz, making it the first state to demand BTC for a major trade route and effectively hard‑wiring the Bitcoin price into the cost of global energy logistics.
Iran’s choice of Bitcoin came after stablecoin issuer Tether blocked more than $3.3 billion in wallets, including those tied to the Islamic Revolutionary Guard Corps, illustrating why a censorship‑resistant asset is attractive in a sanctions‑heavy environment.
In a previous crypto.news story on tokenized real‑world assets and the rise of dollar‑linked stablecoins as settlement rails, analysts argued that geopolitics, energy prices and crypto liquidity are increasingly fused, a point now underscored by a U.S. president warning that bombs — and by extension oil and Bitcoin volatility — are back on the table if diplomacy fails.


A whale who made $44.61m on leveraged ETH in two months has topped up a long to 30,000 ETH around $2,288, turning profits into even more high‑gear risk.
Summary
- Leveraged Ethereum whale that booked $44.61m in profit over two months has boosted its long to 30,000 ETH
- Address added 12,000 ETH at $2,286.9, pushing its average entry to $2,288.3 as price bounced from a sharp pullback
- Position has just flipped back to unrealized profit, highlighting rising conviction — and risk — in ETH leverage markets
A leveraged Ethereum (ETH) whale that has earned $44.61 million in profit over the past two months is increasing its bet on the asset, adding 12,000 ETH to a long position after a brief price drop and lifting its exposure to 30,000 ETH.
On‑chain analyst ai_9684xtpa reported on X that the address stepped in at an average price of $2,286.9 per ETH, bringing its blended entry to $2,288.3 and nudging the trade back into “a floating profit state” as the market stabilized.
The trader’s recent performance has drawn attention across derivatives desks, with prior tracking from Weex and PANews showing the same whale using 15x leverage on Hyperliquid and similar venues to ride Ethereum’s rallies and reversals since February.
According to a Weex report, one of the whale’s earlier legs involved opening a 4,000 ETH long worth about $9.06 million at an entry of $2,264.1 using 15x leverage, part of a sequence of trades that turned an unrealized loss into tens of millions in realized profit in roughly eight weeks.
Binance‑hosted summaries of ai_9684xtpa’s data note that when the trader previously closed a 113,000 ETH long, it locked in approximately $44.6 million in profit while still leaving tens of thousands of ETH on the table for future upside.
The current 30,000 ETH position translates to roughly $68.6 million in notional exposure at the latest entry, and significantly more when leverage is factored in, putting the whale among the larger single‑account risk concentrations in Ethereum perpetuals.
Similar activity has been seen in other large accounts.
KuCoin recently highlighted a BIT‑linked whale running a 15x ETH long with an entry around $2,148.7 as part of a $216 million cross‑asset leverage book, while a Matrixport‑linked entity tracked by crypto.news was previously found holding about $300 million in combined ETH and Bitcoin longs with an estimated $26 million in unrealized profit.
Those positions underline how aggressively some institutional and semi‑institutional traders are using double‑digit leverage around Ethereum’s current range, amplifying both potential upside and liquidation risk as funding rates and open interest rise.
For spot and options traders, the latest move by ai_9684xtpa’s whale serves as a live sentiment gauge.
After Ethereum’s recent pullback pushed many whales’ unrealized profit rates negative, on‑chain analytics firms such as CryptoQuant flagged growing pressure on large holders, with some warning that a cluster of forced unwinds could accelerate any further downside.
Instead, at least some of the biggest players appear to be leaning into the volatility, using fresh margin to defend and extend long exposure near the $2,300 mark — a line in the sand that may now serve as a de facto risk pivot for the broader ETH market.
In a previous crypto.news story on Matrixport‑linked whale leverage, Ethereum’s behavior under concentrated long risk was framed as a test of how resilient the asset’s new derivatives‑driven market structure really is when a few large addresses choose to press their advantage rather than de‑risk.


Nasdaq drops 1% and the S&P 500 0.6%, but Bitcoin near $75k and Ethereum around $2.3k show crypto holding up better than U.S. tech — at least intraday.
Summary
- Nasdaq falls 1%, S&P 500 drops 0.6% and Dow slips 0.27% as U.S. stocks extend a choppy April
- At 9 a.m. EST, Bitcoin trades near $75,325 and Ethereum around $2,318, both up from early‑morning lows despite equity weakness
- Coinbase stock remains volatile after a steep year‑to‑date slide, underscoring how listed crypto proxies still trade like high‑beta tech
U.S. equities opened the week on the back foot, with Gate’s TradFi desk reporting that the Nasdaq fell roughly 1%, the S&P 500 dropped nearly 0.6% and the Dow Jones Industrial Average slid about 0.27%, adding another red session to a bruising April for risk assets.
The move comes on top of a first‑quarter backdrop in which the Nasdaq was already down 7.1% year‑to‑date, the S&P 500 off 4.6% and the Dow lower by 3.6%, according to a recent Gate recap that blamed “geopolitical and energy‑driven headwinds” for the worst quarter in a year.
Yet by 9 a.m. EST on April 20, the two largest cryptocurrencies were showing more resilience than U.S. tech benchmarks, with Bitcoin changing hands at about $75,324.58 and Ethereum at $2,317.80, both modestly higher than their early‑morning prints despite the equity wobble.
Data compiled by Yahoo Finance shows Bitcoin opened Monday at $73,820.11, down 2.5% from Sunday’s $75,723.69, before rebounding above $75,240 by 7:35 a.m. EST, a swing that left BTC up roughly 1.9% off the lows even as futures pointed to a weaker Nasdaq open.
Ethereum followed a similar pattern, starting the day at $2,263.49 — 3.7% below its Sunday level — and then climbing back to about $2,307.37 by mid‑morning, putting spot ETH slightly above the $2,300 “line in the sand” highlighted in recent derivatives and liquidation analysis.
Fortune’s daily crypto dashboard puts the 9 a.m. Ethereum price at $2,317.80, roughly $730 higher than a year ago, underlining how the asset’s 40.3% year‑on‑year gain sits awkwardly next to a Nasdaq that is negative on the year.
That divergence has revived the debate over whether Bitcoin and Ethereum are finally decoupling from growth equities or simply lagging broader risk‑off moves.
In a prior crypto.news story on Ethereum liquidation risk, on‑chain and derivatives data suggested that a break below $2,040 could trigger up to $1.4 billion in long liquidations, a reminder that even if spot ETH looks steady against the S&P on some days, leverage still binds crypto tightly to macro shocks.
Listed crypto proxies, meanwhile, remain firmly in the equity bucket.
Coinbase stock closed at $206.33 on April 17, up 3.26% on the day but still nursing a 28.5% year‑to‑date drawdown to around $263.26 earlier this month as Barclays downgraded the shares on softer trading revenue, according to MEXC’s summary of the exchange’s latest earnings.
For traders watching both screens, Monday’s tape offered a neat snapshot.
The Nasdaq’s 1% slip and S&P 500’s 0.6% drop kept pressure on high‑beta tech, but Bitcoin above $75,000 and Ethereum near $2,300 showed that crypto can, at least intraday, shrug off modest equity weakness — even as history and recent crypto.news coverage of correlated sell‑offs suggest that a deeper stock‑market break would quickly test that independence.


Four of Japan’s largest financial institutions have begun a major blockchain trial to digitally manage government bond collateral. The experiment aims to make trading Japanese government bonds possible around the clock, both at home and abroad.
The move could reshape how one of the world’s largest sovereign debt markets handles collateral across borders and time zones.
A Four-Way Partnership
Mizuho Financial Group, Nomura Holdings, Japan Securities Clearing Corporation, and Digital Asset announced the joint experiment on Monday. They will use the Canton Network, a blockchain platform built specifically for institutional finance and capital markets. The clearing house is a wholly-owned unit of Japan Exchange Group, the country’s main stock market operator.
The project will check whether blockchain can handle bond ownership transfers across multiple account managers. It will also test real-time collateral exchanges between clearing houses, institutional investors, and their clients. Japanese government bonds will keep their legal status as registered securities throughout the testing period.
Japan’s Financial Services Agency formally approved the trial under its Payment Innovation Project back in February. Regulators will also review whether Japanese laws need to be changed to allow full blockchain-based bond trading. The four partners plan to finish their work by the end of September, according to Nikkei.
The Canton Network already hosts similar projects from global financial giants like JPMorgan and Goldman Sachs. The US clearinghouse, DTCC, is also using the same network to tokenize American Treasury bonds. Japan’s move brings one of Asia’s most important safe-haven assets into the same global financial ecosystem.
Why It Matters
Collateral management usually requires complex coordination across institutions, different computing systems, and multiple legal jurisdictions worldwide. Moving the process on-chain could cut paperwork, reduce settlement delays, and free up capital for major banks. Japanese officials hope the experiment will strengthen Tokyo’s competitive position in the fast-growing global digital asset race.
The post Japan’s Big Banks Take Government Bonds On-Chain appeared first on BeInCrypto.

Ruben Amorim will still argue he was right about huge Manchester United mistake

Finance 027 – 25k salary to 25 lakh saving

Almscliffe-Dhesi group open Peterlee Passfield retail centre
Manchester United reach agreement with Casemiro over contract clause amid transfer speculation

Steven Gerrard disagrees with Gary Neville over ‘shock’ Chelsea and Arsenal claim | Football

US brings back mandatory military draft registration
Finance 027 – 25k salary to 25 lakh saving

Ripple XRP WE ARE OUT OF THE STORM CONFIRMED BY RIDDLERS $1000 PRICE TARGET PERSEVERE LETS GO!!!

Financial Management | Introduction | Financial Decision | Function |BBA | B.Com | MBA | Class 12
-

 NewsBeat7 days ago
Trump and Pope Leo: Behind their disagreement over Iran war
-

 Fashion3 days ago
Weekend Open Thread: Theodora Dress
-

 News Videos6 days ago
Secure crypto trading starts with an FIU-registered
-

 Sports4 days ago
NWFL Suspends Two Players Over Post-Match Clash in Ado-Ekiti
-

 Crypto World7 days ago
SEC Proposes Certain Crypto Interfaces Don’t Need to Register as Brokers
-

 Business2 days ago
Powerball Result April 18, 2026: No Jackpot Winner in Powerball Draw: $75 Million Rolls Over
-

 Crypto World3 days ago
Russia Pushes Bill to Criminalize Unregistered Crypto Services
-

 Politics7 hours ago
Gary Stevenson delivers timely reminder to register to vote as deadline TODAY
-

 Politics3 days ago
Palestine barred from entering Canada for FIFA Congress
-
 Business4 days ago
Creo Medical agree sale of its manufacturing operation
-

 Politics2 days ago
Zack Polanski demands ‘council homes not luxury flats for foreign investors’
-

 Crypto World3 days ago
Russia Introduces Bill To Criminalize Unregistered Crypto Services
-

 Tech5 days ago
‘Avatar: Aang, The Last Airbender’ Leaked Online. Some Fans Say Paramount Deserves the Fallout
-

 Tech2 days ago
Auto Enthusiast Scores Running Tesla Model 3 for Two Grand and Turns It Into Bare-Bones Go-Kart
-

 Tech6 days ago
Microsoft adds Windows protections for malicious Remote Desktop files
-

 Crypto World6 days ago
X Launches New Cashtag Feature for Stocks and Crypto: X
-

 Sports7 days ago
Younger Than Sachin Tendulkar: Vaibhav Sooryavanshi Set To Make Historic India Debut
-

 Entertainment6 days ago
Prince Carter Brings Fans Front Row and Backstage at Boys 4 Life Tour
-
 Entertainment6 days ago
Dave Portnoy Slams Dianna Russini: ‘Makes Zero Sense’
-
 Crypto World6 days ago
Bitcoin surpasses halfway mark in current halving cycle
You must be logged in to post a comment Login