
Crypto World
Prediction Markets Now Behave Like Stock Trading Platforms
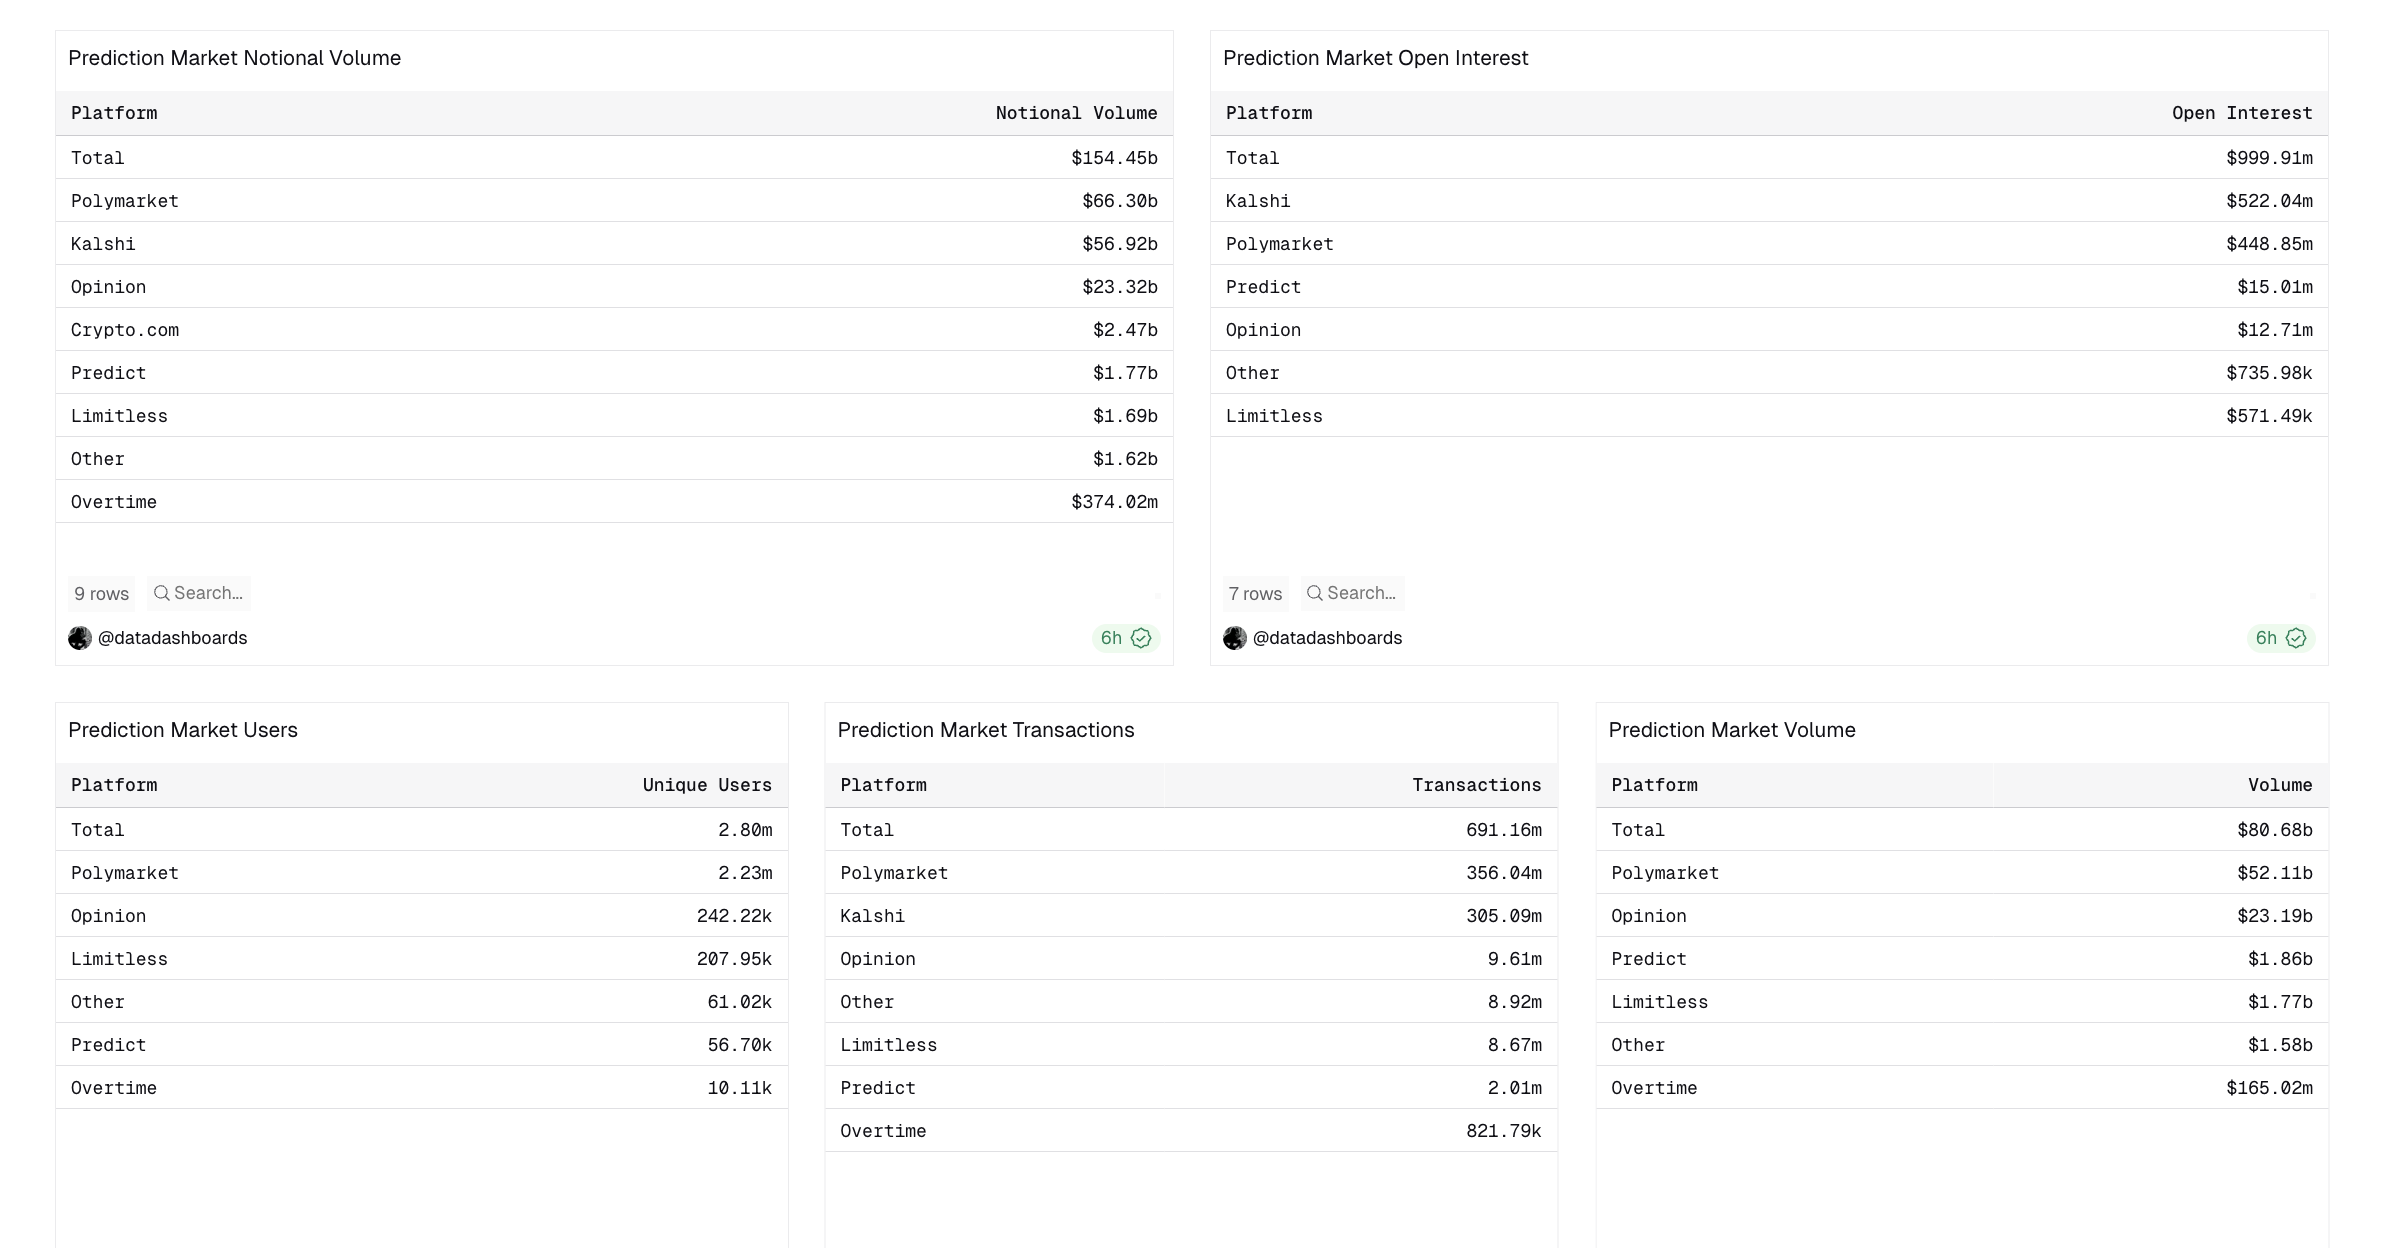
Prediction markets have processed more than $154 billion in total volume, with daily trading on Polymarket alone often exceeding $300 million.
That scale forces a more important question. These platforms no longer look like niche betting venues. They increasingly resemble something closer to retail trading.
This analysis uses on-chain data, primarily from Polymarket—the largest platform by users and transactions in a market dominated by a Polymarket–Kalshi duopoly—to test that shift directly.
$10 Trades Are Defining the Market
Across four dimensions, who participates, how they behave, how capital moves, and at what scale, the volume growth pattern tells a consistent story.
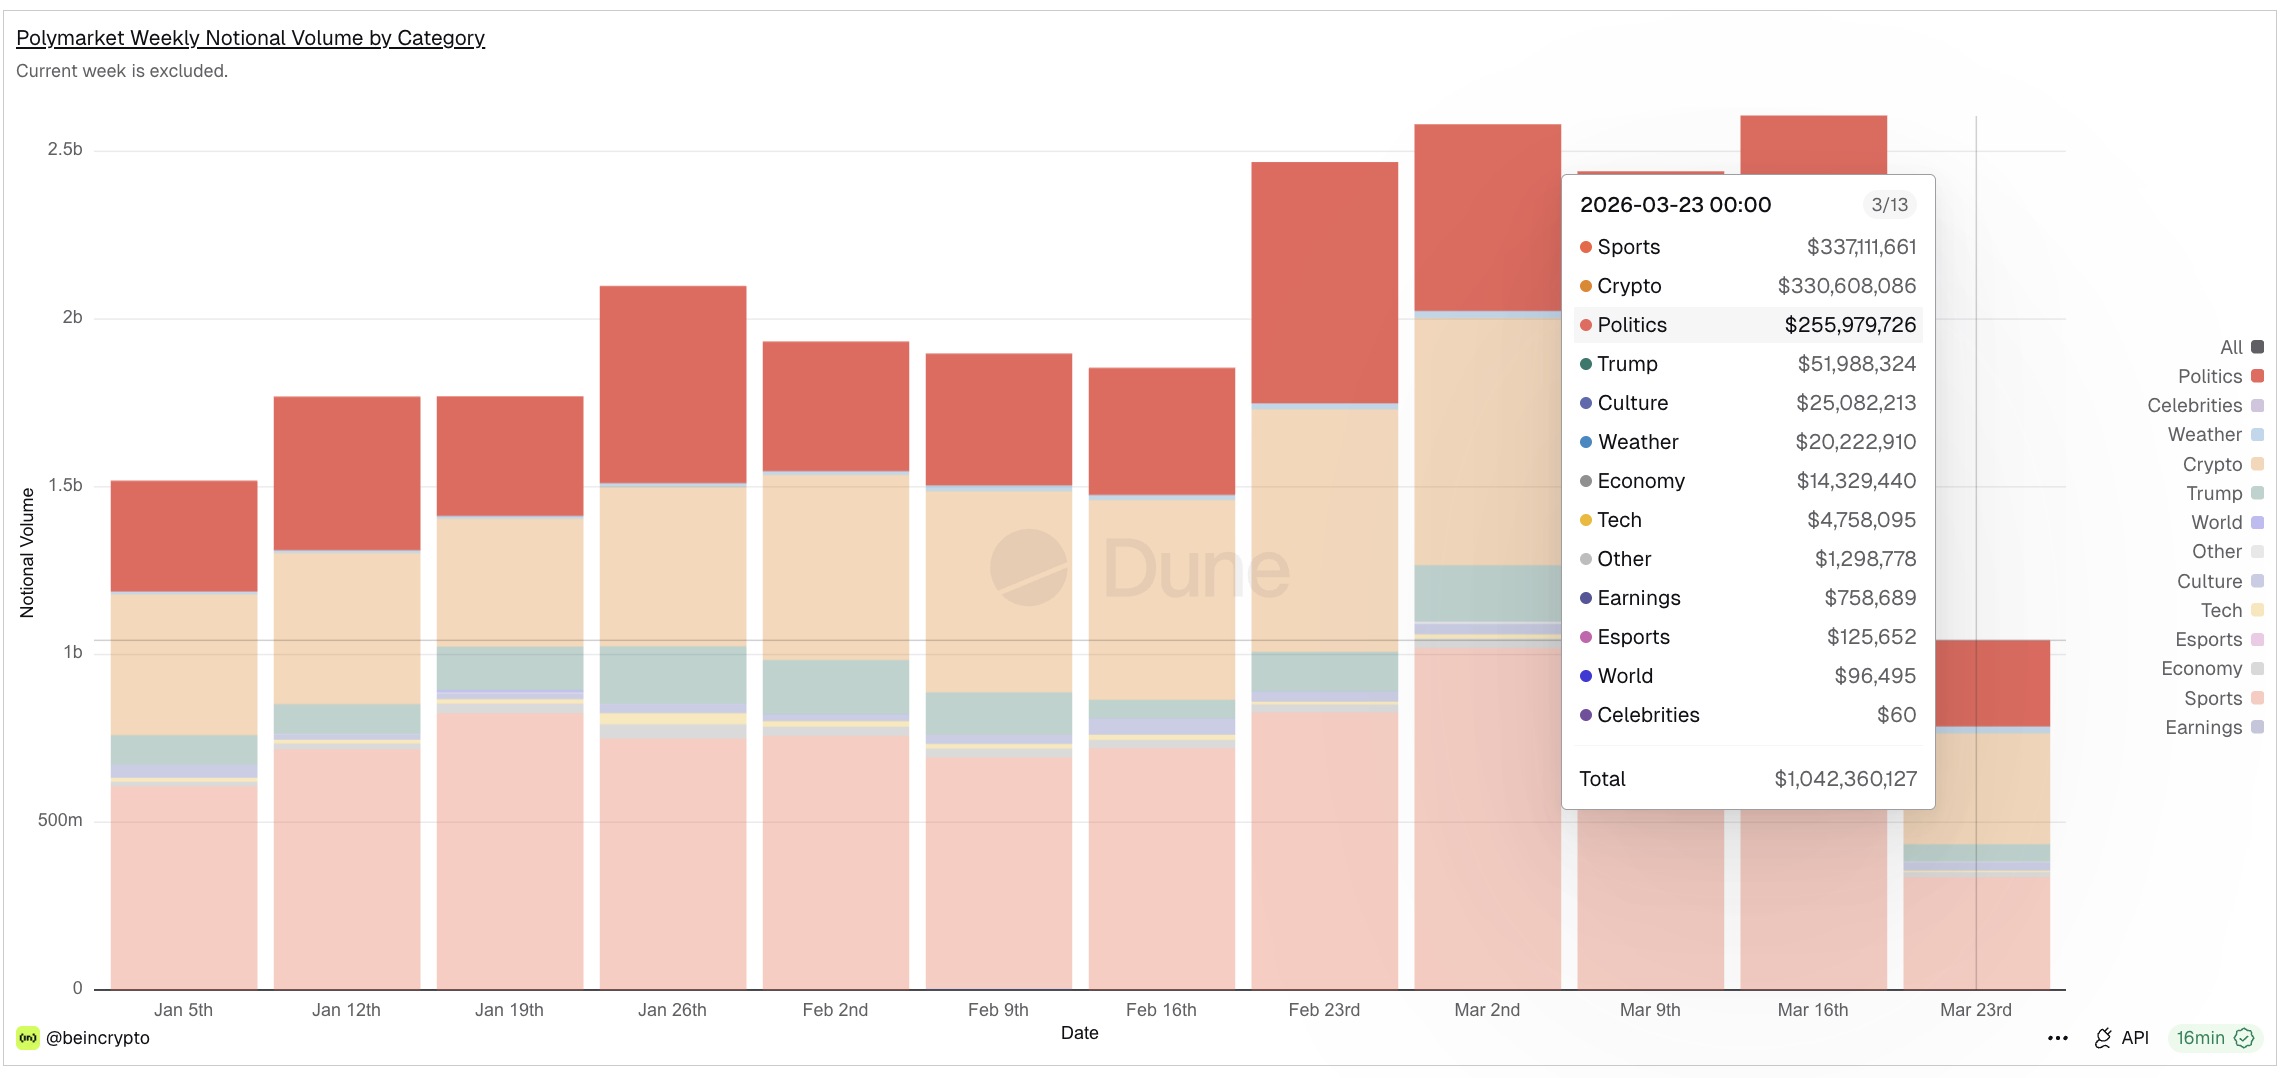
And the category mix reinforces the framing: crypto and politics (excluding sports) now lead weekly volume on Polymarket, with the economy and earnings categories growing alongside them. These are not traditional gambling categories. They are finance-adjacent verticals.
Notably, sports event contracts are already being offered as CFTC-regulated financial products by Kalshi and distributed through Robinhood’s Predictions Hub, placing them alongside stocks, options, and crypto within the same brokerage interface.
The most revealing signal is not how much money flows through prediction markets. It is who is placing the trades.
On Polymarket, the median bet size is $10, according to BeInCrypto’s exclusive dashboard. The average sits at $89, but that figure is pulled upward by a thin tail of large participants.
The underlying distribution paints a clearer picture: roughly 20% of all wallets trade in the $0 to $10 range, another 27% fall between $10 and $50, and about 11% sit in the $50 to $100 bracket.
In total, over 57% of users trade for less than $100, and more than 80% trade for less than $500.
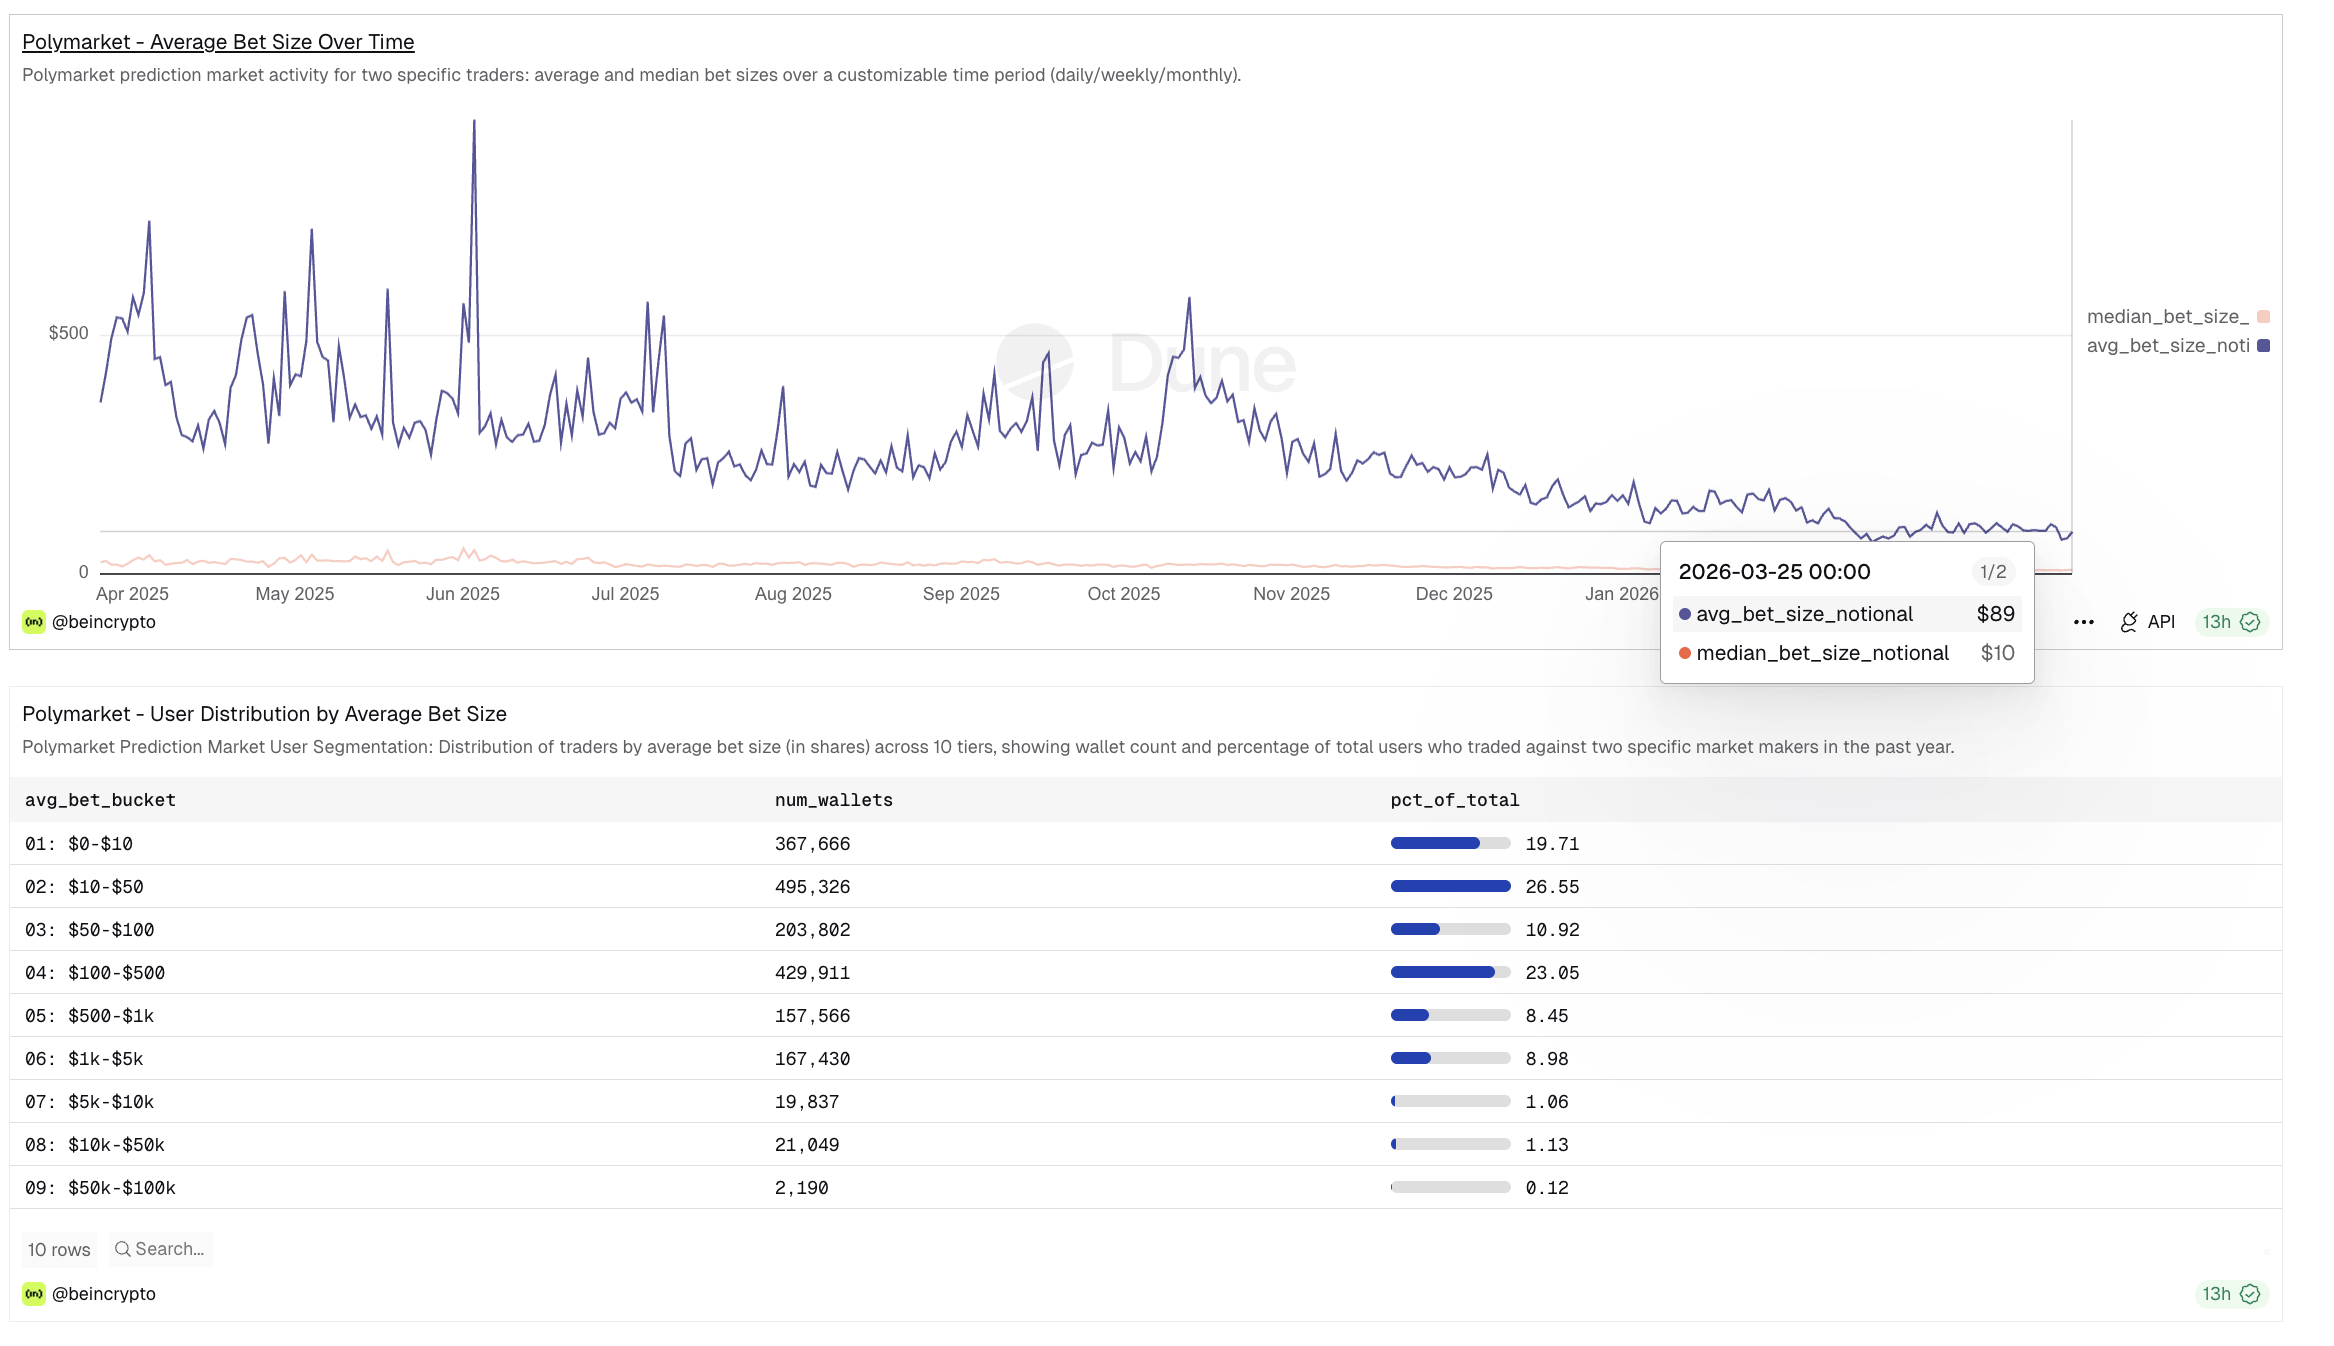
This is not a market shaped by whales. It is a market built on small, individual participants deploying modest amounts. The pattern mirrors what defined the rise of retail stock trading.
Robinhood, for comparison, reported a median account size of $240, with the average around $5,000, according to CEO Vlad Tenev in 2021. The structural similarity is hard to miss: prediction markets are attracting the same class of small participants that reshaped equities over the past five years.
Users are Acting Like Traders, Not Bettors
Participation alone does not distinguish a financial platform from a betting one. Frequency of interaction does.
A bettor places a wager and waits. A trader enters positions, adjusts exposure, exits, and re-enters. The transactions-per-active-user ratio captures this distinction directly.
On Polymarket, this ratio currently stands at approximately 25 transactions per daily active user, meaning the average active participant executes 25 trades per day. Earlier this year, the figure peaked near 37.
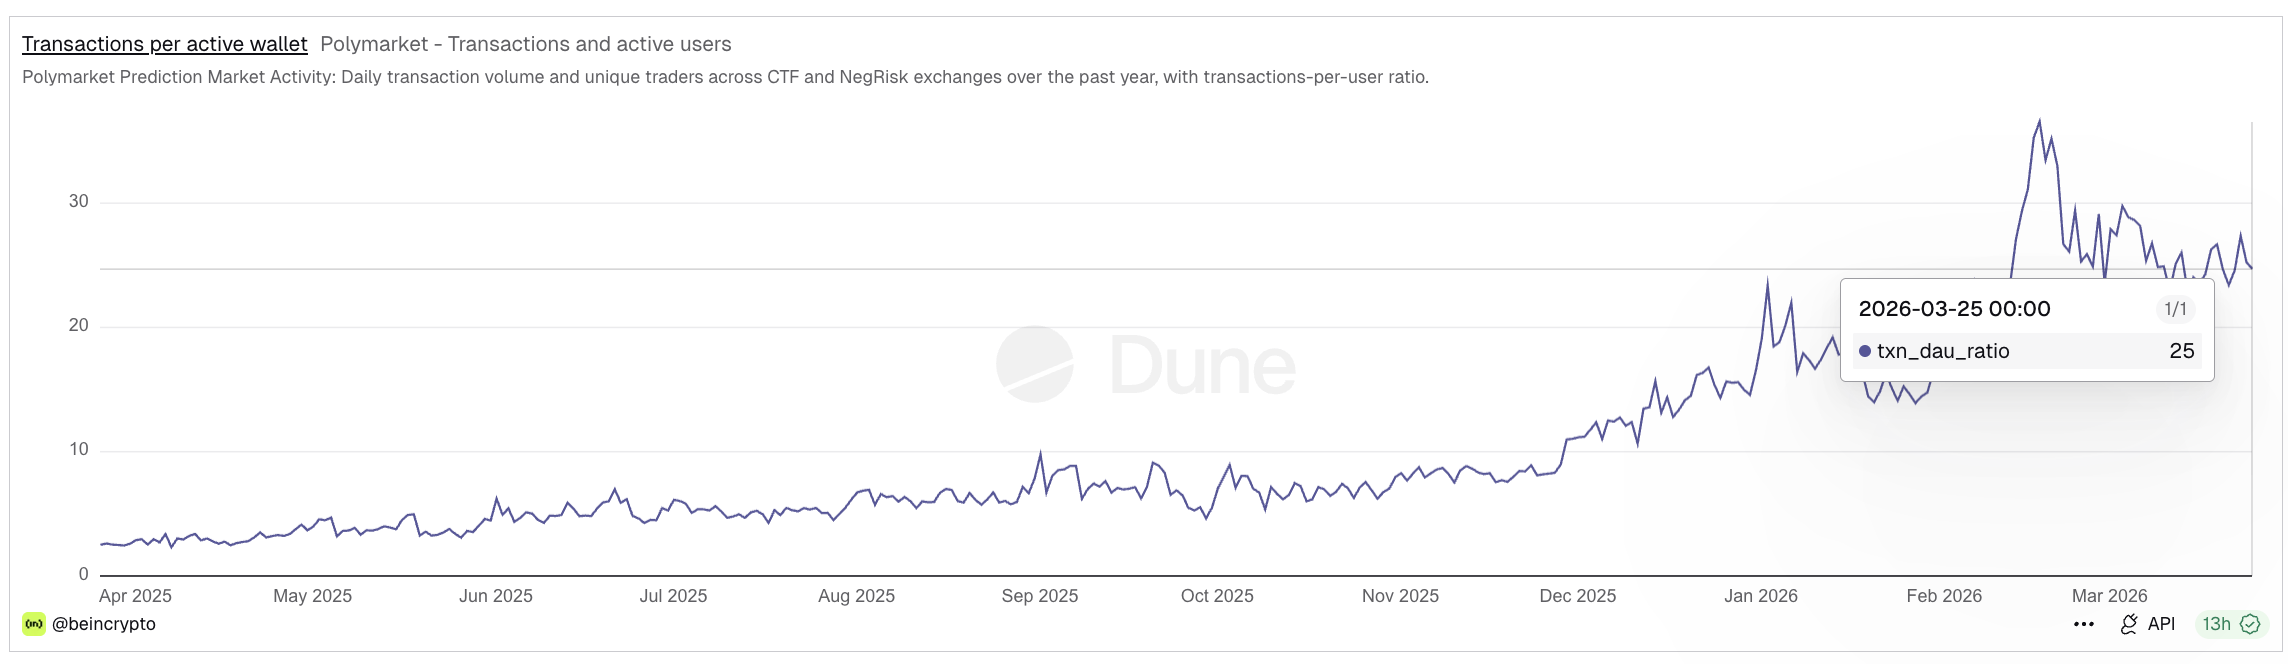
For context, through most of mid-2025, the ratio hovered between 3 and 5. The structural jump beginning in late 2025 represents a clear behavioral shift: users are no longer placing single predictions and walking away. They are actively managing positions across multiple markets.
This pattern has a direct parallel in crypto markets. A Kaiko research report on Binance found that the exchange processed 61.9 million trades against $20 billion in spot volume on a single snapshot day in December 2025, implying small average trade sizes and frequent execution across its 300 million registered accounts.
High-frequency, small-size trading is the behavioral signature of retail finance, whether the underlying asset is a stock, a token, or a prediction contract.
Capital Is Constantly in Motion
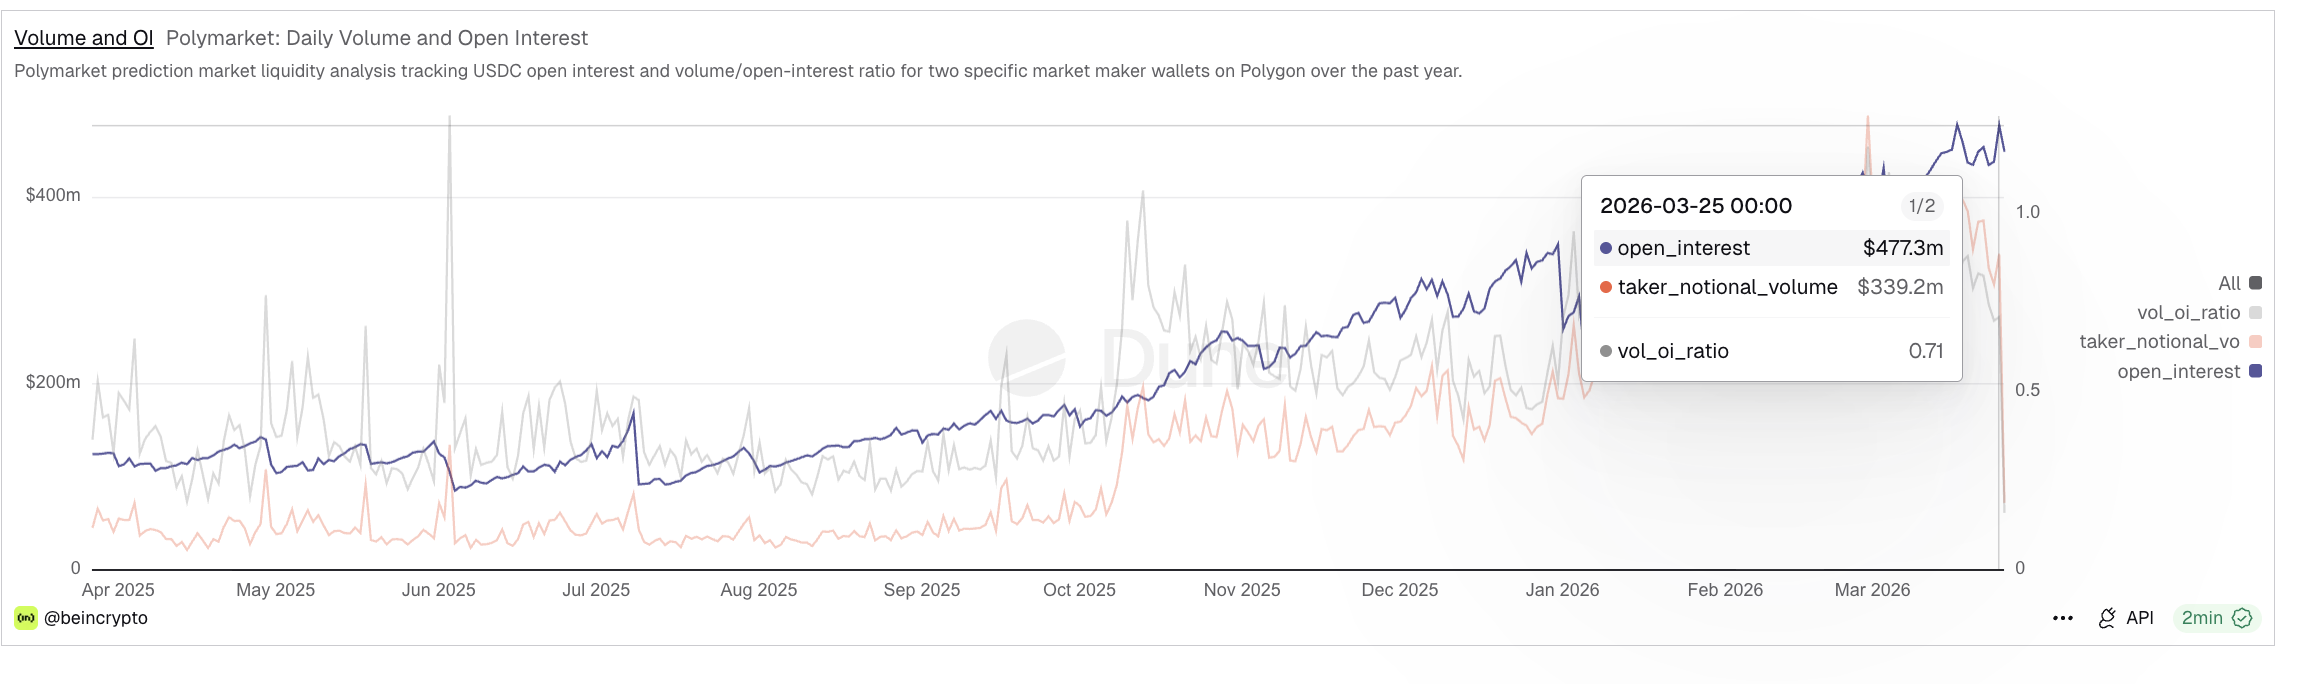
If users behave like traders, the capital dynamics should confirm it. They do. Polymarket currently holds approximately $445 million in total value locked, while open interest stands at roughly $477 million.
The near-parity between these two figures carries a specific implication: virtually all deposited capital is actively deployed in live positions rather than sitting idle. This is not passive liquidity. It is working capital.
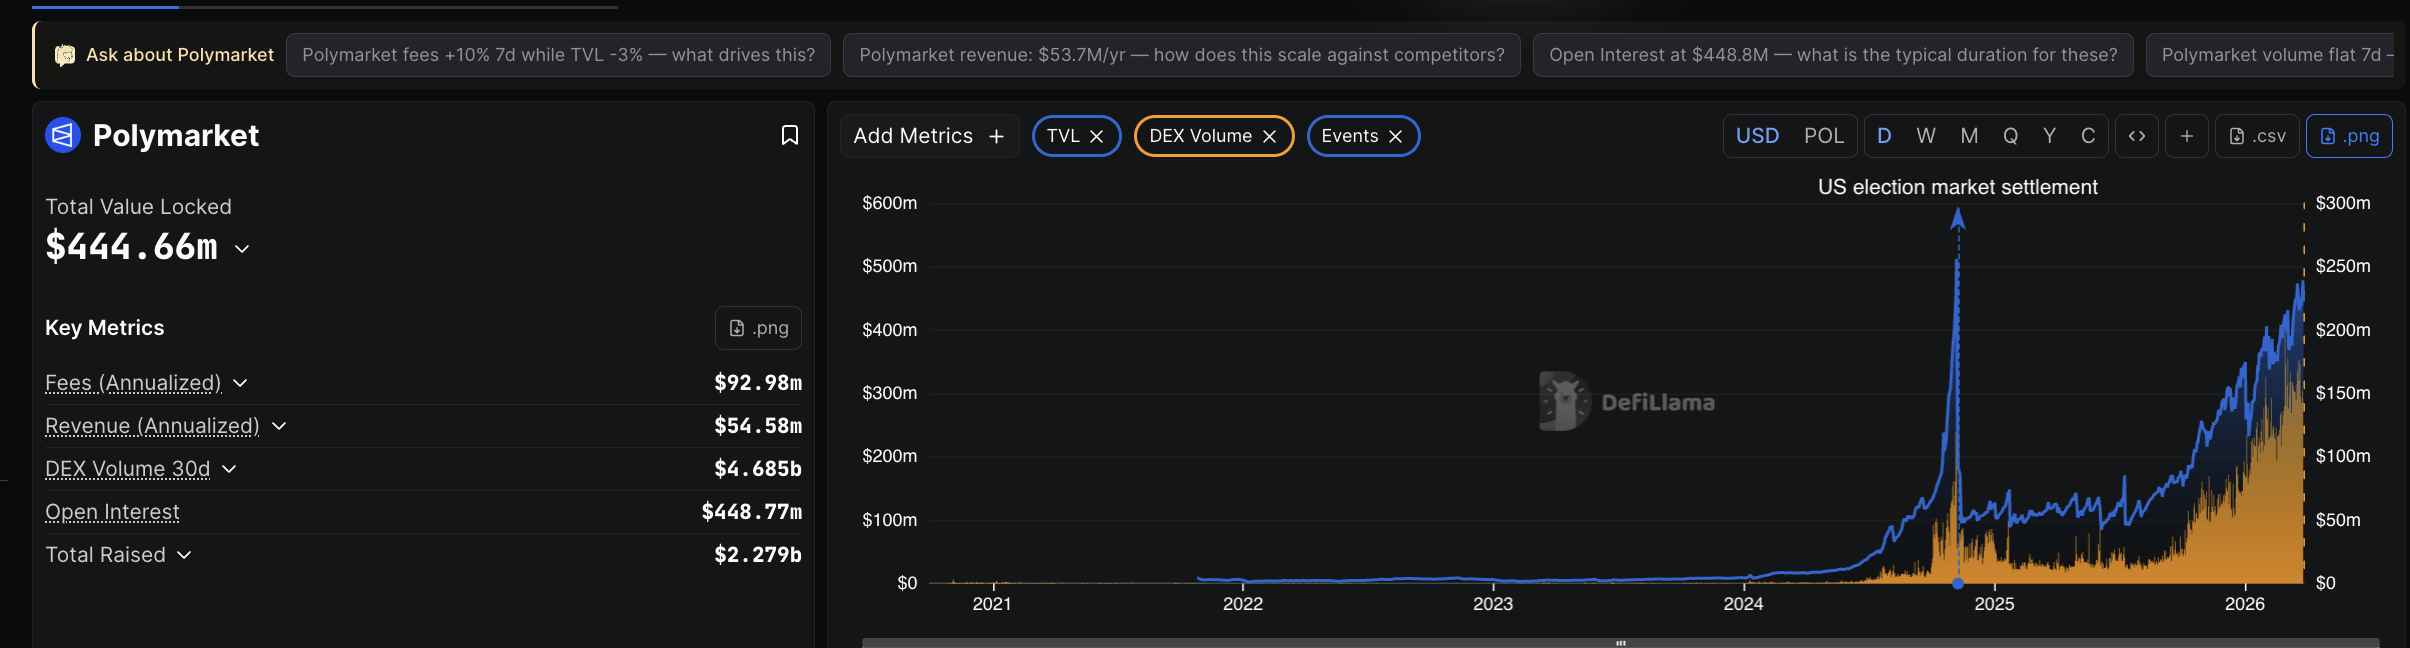
The volume-to-open-interest ratio reinforces the point. With daily taker volume around $339 million and open interest at $477 million, the ratio is 0.71. Capital is not just deployed. It is rotating.
Positions are being opened, closed, and re-entered at a pace that suggests continuous portfolio management rather than static, event-dependent exposure. A low vol-OI ratio would have suggested more betting-like activity.
In a traditional betting market, capital tends to lock in and wait for resolution. Here, it circulates. That distinction is material: it signals a system in which participants treat capital as a tool for ongoing risk adjustment, not a one-time stake in a single outcome.
This Is No Longer Event-Driven Growth
The behavioral and capital patterns described above would be noteworthy even at modest volumes. But they are not operating at modest volumes.
Polymarket’s weekly notional volume has consistently exceeded $1 billion through Q1 2026, with recent weeks surpassing $2.5 billion. The 7-week rolling average has crossed $2 billion.
Monthly volumes have climbed from around $1 billion in mid-2025 to over $8 billion by March 2026. The growth trajectory is not driven by any single event cycle.
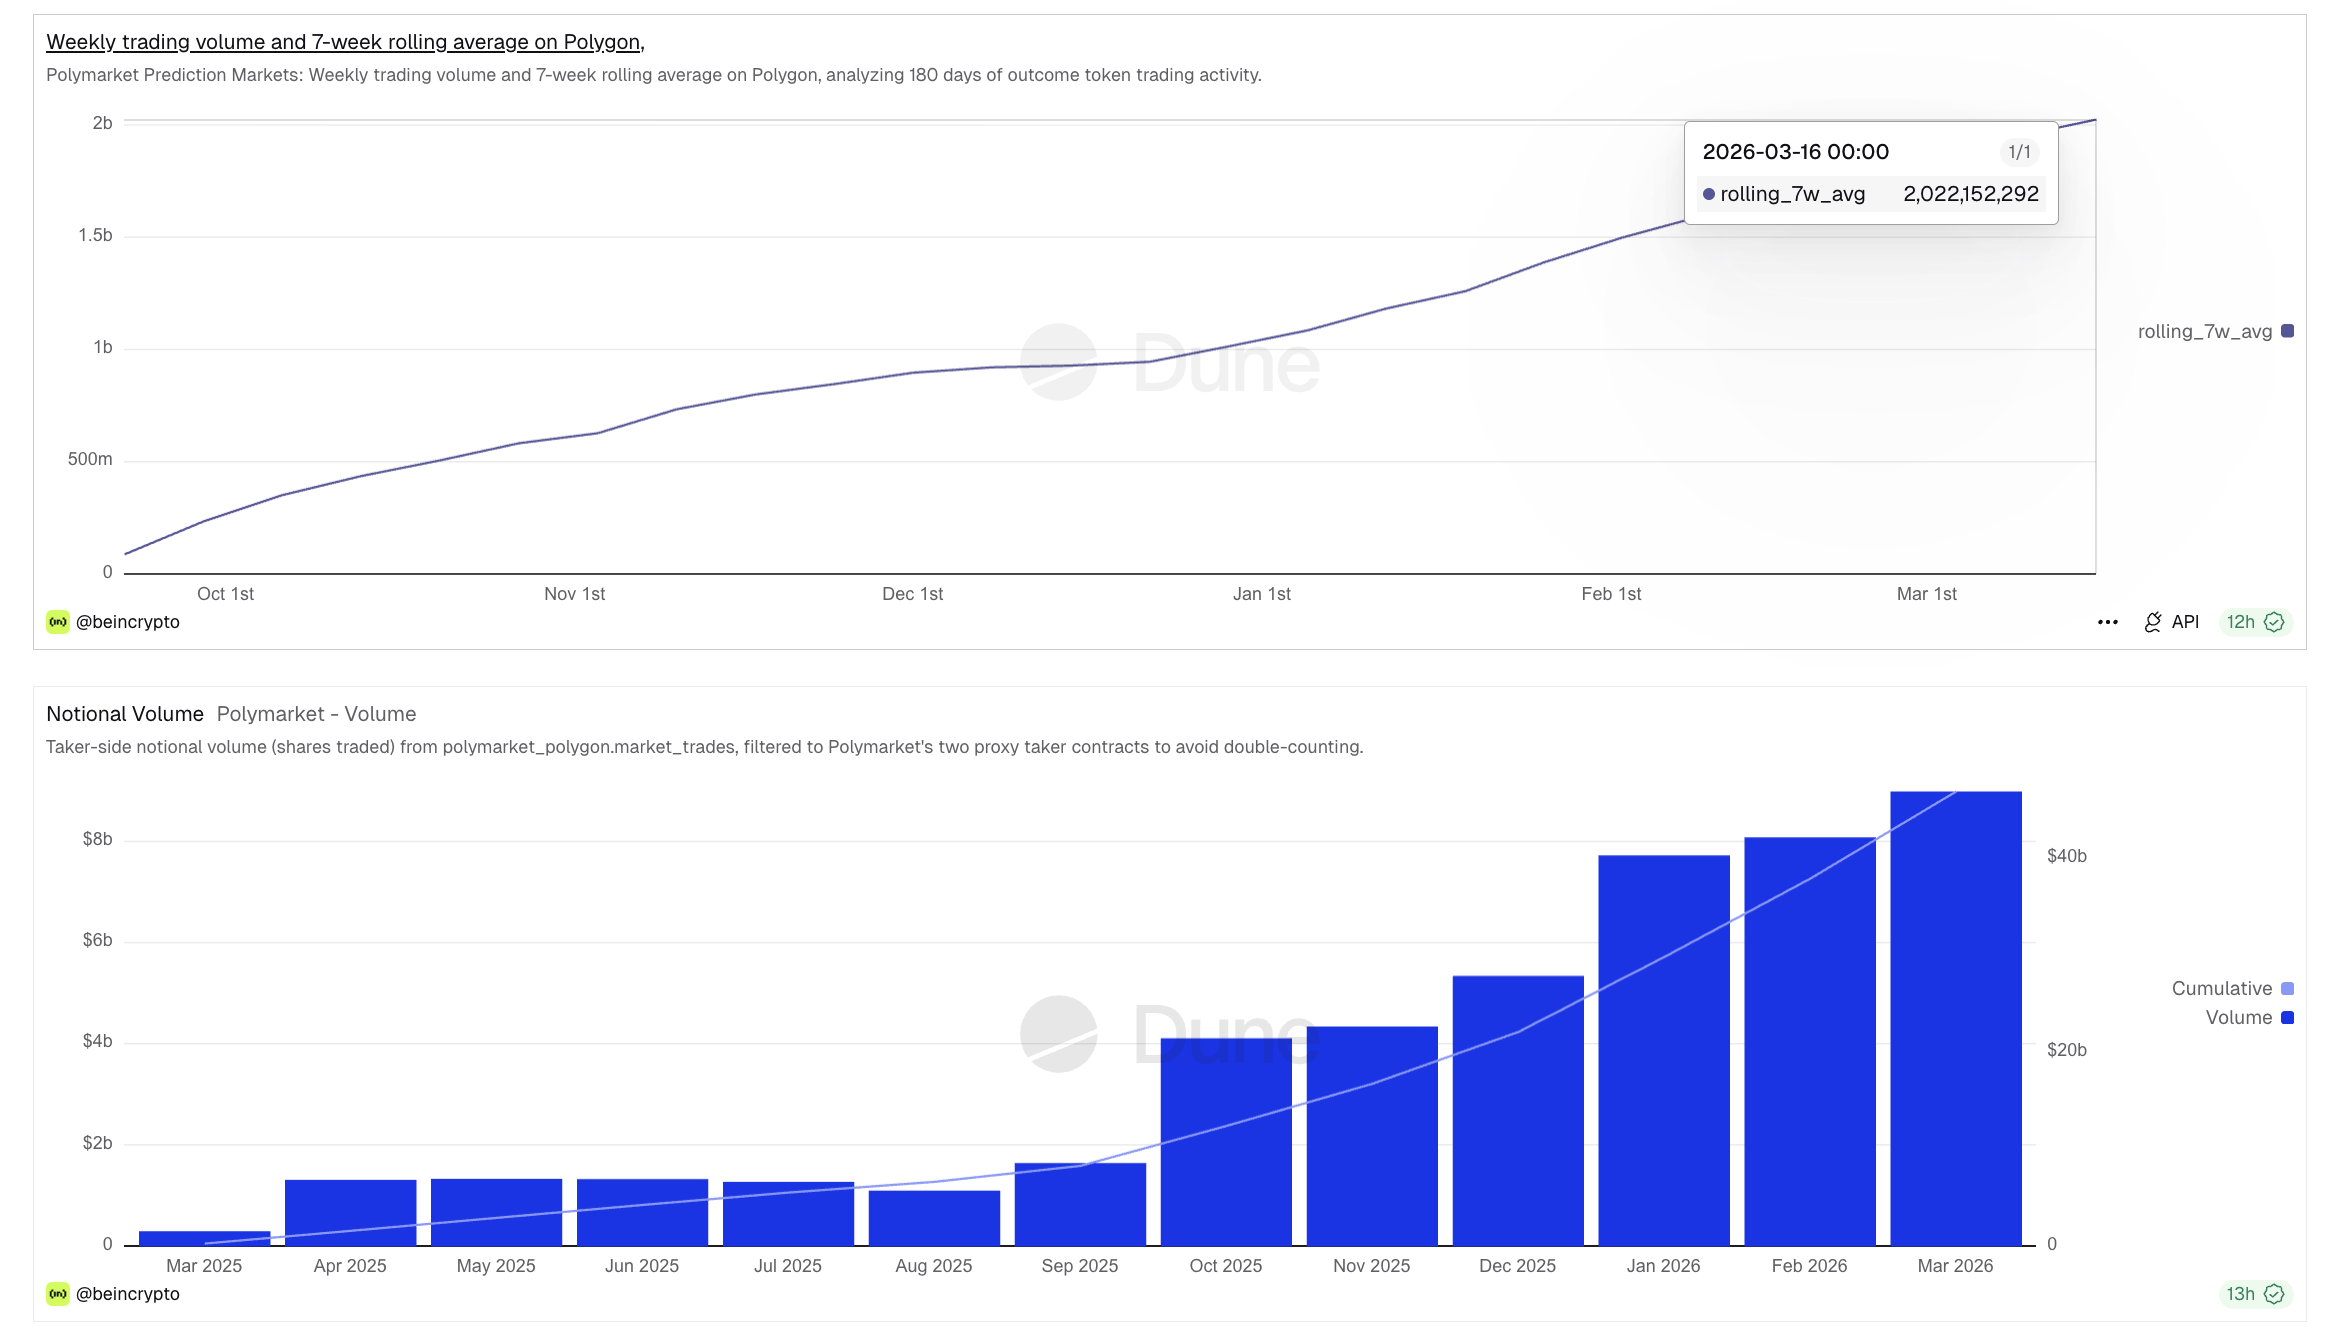
Volume is diversifying across categories: sports, crypto, and politics. Each contributed substantially in the most recent weekly data, with economy, weather, and culture adding further breadth.
This diversification is what separates structural growth from event-driven spikes. A presidential election creates a temporary surge.
Sustained, multi-category volume growth across sports, crypto, macro, and culture points to a user base that engages with prediction markets regularly, not just occasionally, as a typical retail habit.
What the Prediction Markets’ Data Says
Each dimension reinforces the next in a single causal chain. The majority of participants are small, retail-sized users. Those users trade frequently, not once, but dozens of times per session.
The capital they deploy is almost entirely active, rotating through positions rather than sitting idle. And this behavior is occurring at billions of dollars in monthly volume, across a broadening set of categories.
When small users dominate participation, execute frequent trades, and keep capital constantly in play at scale, the system begins to resemble a retail financial market rather than a betting platform.
Prediction markets are no longer just mechanisms for forecasting outcomes. They are changing into retail trading systems for real-world events, platforms where participants express views, manage risk, and deploy capital with a frequency and discipline that mirrors stock markets.
The post Prediction Markets Now Behave Like Stock Trading Platforms appeared first on BeInCrypto.

Key points:
-
Bitcoin’s fall below the $66,000 support heightens the risk of a drop to the $62,500 level.
-
Select major altcoins have broken below their immediate support levels, opening the gates for further downside.
Bitcoin (BTC) is under pressure from the bears, who are attempting to sustain the price below the $66,000 level. The uncertainty regarding the US and Israel-Iran war is capping the upside and putting downside pressure. US spot Bitcoin exchange-traded funds recorded $171 million in outflows on Thursday, the biggest since the $348 million in redemptions on March 3, according to Farside Investors data.
Although BTC is facing selling on rallies, the bulls have successfully defended the $60,000 level since Feb. 6. Glassnode said in its latest Week On-chain newsletter that the sharp contraction in BTC’s entity-adjusted realized profit from $3 billion per day in July 2025 to $0.1 billion currently suggests that the bear market is transitioning into its later stages.

A positive sign in favor of the bulls is that BTC whales and sharks have continued to accumulate. Santiment said in a post on X that large BTC holders owning between 10 and $10,000 BTC have boosted their holdings by 0.45% in the past month. Historically, an upside breakout happens when large wallets are accumulating, and retail is selling.
Could BTC and select major altcoins hold on to their crucial support levels? Let’s analyze the charts of the top 10 cryptocurrencies to find out.
Bitcoin price prediction
Buyers could not maintain BTC above the $72,000 level on Wednesday. That may have attracted sellers who pulled the price below the support line of the ascending triangle pattern on Friday.

If the BTC price closes below the support line, the bullish pattern will be invalidated. That may intensify selling, pulling the BTC/USDT pair to the $62,500 to $60,000 support zone.
Instead, if the price turns up sharply from the current level and breaks above the $72,000 level, it suggests that the bulls are attempting to get back into the driver’s seat. The pair may then challenge the crucial $74,508 resistance. If buyers overcome the barrier, the pair may surge to $84,000.
Ether price prediction
Ether (ETH) turned down and fell below the breakout level of $2,111 on Thursday, indicating that the bears are trying to make a comeback.

Sellers kept up the pressure and pulled the ETH/USDT pair below the 50-day SMA ($2,044) on Friday. The ETH price may decline to the $1,900 level, which is likely to attract buyers. However, if the bears prevail, the pair may collapse to the vital $1,750 support.
This negative view will be invalidated in the near term if the price turns up sharply and breaks above the $2,200 level. That enhances the prospects of a rally above the $2,400 level.
BNB price prediction
BNB (BNB) has been oscillating between $570 and $687 for the past few weeks, signaling buying near the support and selling close to the resistance.

There is minor support at $607, but if the level gives way, the BNB/USDT pair may slump to the $570 level. A strong bounce off the $570 support suggests that the pair may remain inside the range for a while longer.
The next trending move is expected to begin on a close below $570 or above $687. If buyers clear the overhead hurdle, the BNB price may jump to $790. Alternatively, a close below $570 might sink the pair to the psychological level at $500.
XRP price prediction
XRP (XRP) turned down from the moving averages on Thursday, indicating that the bears remain in control.

The XRP price may slide to $1.32 and then to $1.27. Buyers will attempt to aggressively defend the $1.27 level, but if the bears prevail, the XRP/USDT pair may decline to the support line.
The first sign of strength will be a close above the moving averages. The pair may then rise to the breakdown level of $1.61, which is expected to pose a substantial challenge for the bulls. If buyers pierce the $1.61 level, the next stop is likely to be the downtrend line.
Solana price prediction
Buyers attempted to push Solana (SOL) above the $95 resistance on Wednesday, but the bears held their ground.

The SOL price has dipped below the 50-day SMA ($86), indicating that the bulls have given up. That suggests the SOL/USDT pair may extend its stay inside the $76 to $95 range for some more time.
The next trending move is expected to begin on a break above or below the range. If the bulls propel the price above $95, the pair may reach the $117 level. On the downside, a close below $76 might sink the pair to $67.
Dogecoin price prediction
Dogecoin (DOGE) rose above the moving averages on Wednesday, but the bulls could not sustain the higher levels.

The DOGE price turned down on Thursday, and the bears have pulled the DOGE/USDT pair below the critical $0.09 support. If the sellers sustain the price below $0.09, the pair may collapse to $0.06.
Buyers are unlikely to give up easily. They will attempt to defend the $0.09 level and swiftly push the price above the moving averages. If they succeed, the pair may ascend to $0.10 and later to $0.12.
Hyperliquid price prediction
Hyperliquid (HYPE) turned down from $41.59 on Wednesday but is likely to find support in the zone between the 20-day EMA ($37.64) and the breakout level of $36.77.

If the HYPE price bounces off the $36.77 level, it suggests that the bulls are trying to flip the level into support. Buyers will endeavor to strengthen their position by pushing the HYPE/USDT pair above the $43.77 level. If they can pull it off, the pair may start its northward march toward $50.
Contrary to this assumption, if the price continues lower and breaks below $36.77, it suggests that the bulls are losing their grip. The pair may tumble to the 50-day SMA ($33.34), which is likely to attract buyers.
Related: Ether traders see ‘further decline’ as ETH price slips below $2K
Cardano price prediction
Buyers pushed Cardano (ADA) above the 50-day SMA ($0.27) on Wednesday but could not sustain the higher levels.

The ADA/USDT pair turned down sharply on Thursday, signaling that the bears had renewed their selling. There is strong support at $0.25, but if the level breaks down, the ADA price may slump to $0.22.
This negative view will be invalidated in the near term if the price turns up sharply from the $0.25 level and closes above the moving averages. That clears the path for a rally to the downtrend line.
Bitcoin Cash price prediction
Bitcoin Cash (BCH) fell below the 20-day EMA ($468) on Thursday, indicating that the bears are attempting to retain control.

The BCH/USDT pair may descend to the $443 support, which is a crucial level to watch out for. If the bears sink the BCH price below the $443 level, the pair will complete a bearish head-and-shoulders pattern. That may start a drop to $375.
On the contrary, if the price turns up from the $443 level, it signals solid buying at lower levels. The pair may form a range between $443 and the 50-day SMA ($491) for some time. Buyers will have to push and maintain the price above the 50-day SMA to signal the start of a sustained recovery toward $520.
Chainlink price prediction
Chainlink’s (LINK) rebound fizzled out at $9.50 on Wednesday, indicating that the bears are selling on rallies.

The price turned down sharply on Thursday, and the bears have pulled the LINK/USDT pair below the support line of the ascending channel pattern. If the LINK price closes below the channel, the pair may drop to $8.05 and then to $7.15.
Buyers are likely to have other plans. They will attempt to retain the price inside the channel and push the pair above the $9.50 level. If they do that, the pair may rally to the resistance line.
This article does not contain investment advice or recommendations. Every investment and trading move involves risk, and readers should conduct their own research when making a decision. While we strive to provide accurate and timely information, Cointelegraph does not guarantee the accuracy, completeness, or reliability of any information in this article. This article may contain forward-looking statements that are subject to risks and uncertainties. Cointelegraph will not be liable for any loss or damage arising from your reliance on this information.
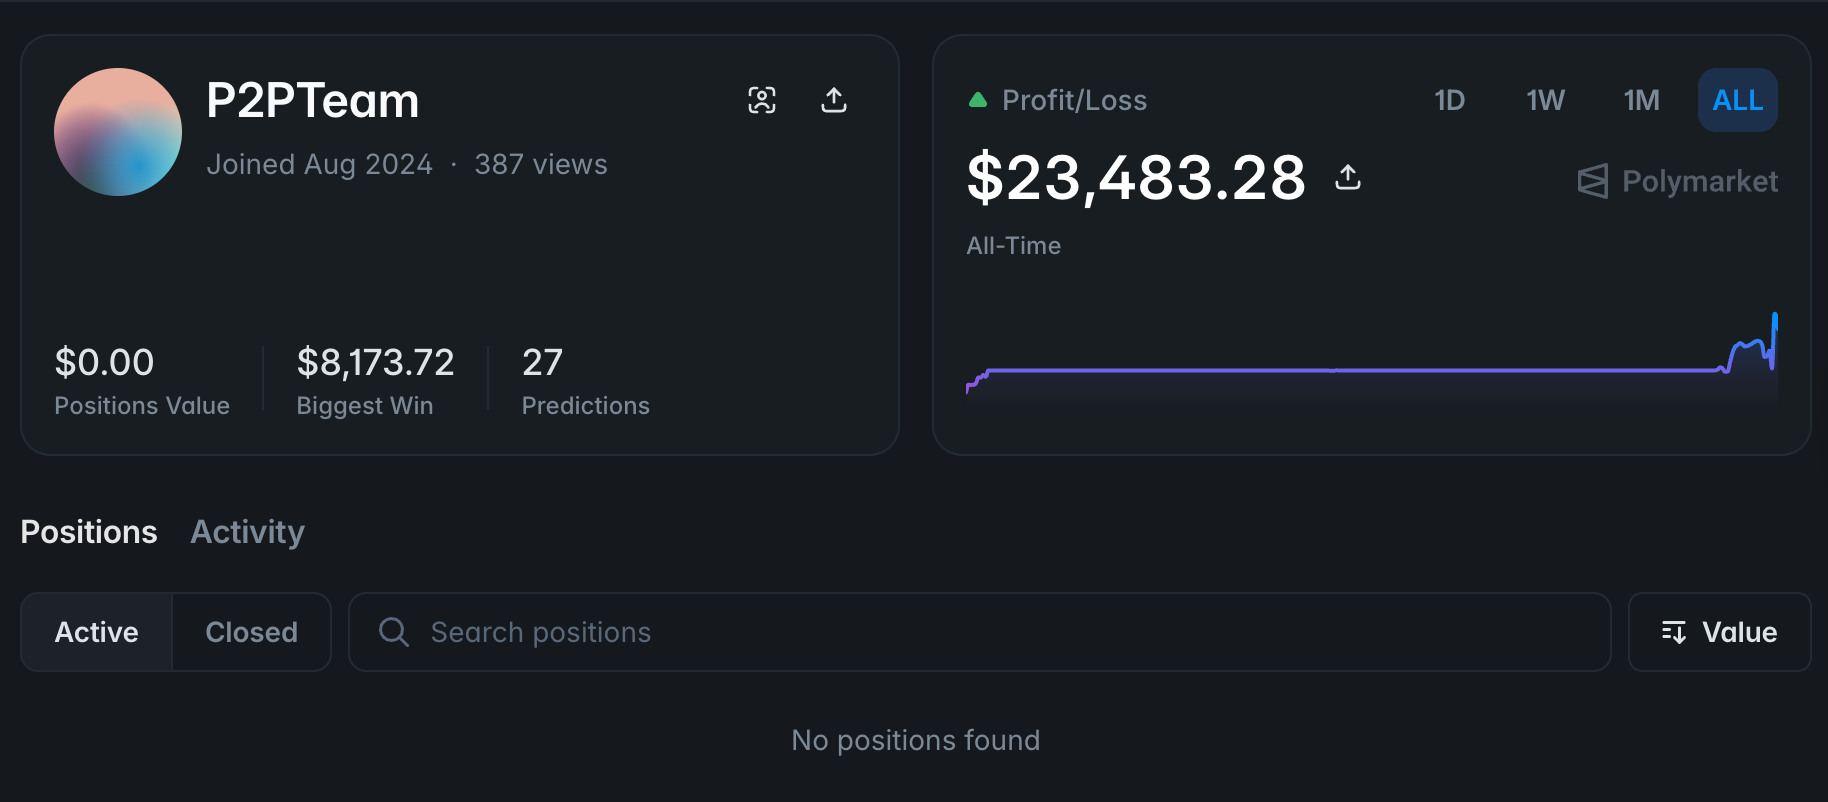
The team behind the P2P.me decentralized trading platform disclosed that it opened positions on the Polymarket prediction market related to its recent capital raise.
The team opened the positions 10 days before the raise went live, wagering whether the project would hit its $6 million fundraising target, according to a disclosure published on the X social media platform.
At the time the positions were opened, P2P.me had only one “oral commitment” from venture firm Multicoin Capital for $3 million in funding, “no signed term sheets” and “no guaranteed allocations,” the team said.

However, the project only managed to raise $5.2 million in the funding round, which resulted in the market resolving to a “no.” Following the outcome, the team said:
“Trading on an outcome you can influence erodes trust. We don’t believe we were trading on a done deal, but we recognize reasonable people can see it differently. We named the account “P2P Team” deliberately to give a marketing signal of our presence. But intent isn’t the same as action. Not disclosing at the time was a mistake we own.”
Any profits made from the prediction market positions will be funneled back into the project’s MetaDAO treasury, the reserve for the decentralized autonomous organization (DAO) governing the platform, the P2P.me team said.
The team also said it is liquidating all open positions on Polymarket and adopting a “formal company policy” on prediction market trading activity.

Cointelegraph reached out to P2P.me about the disclosure, but did not receive a response by the time of publication.
Prediction markets have come under increased scrutiny from US lawmakers for insider trading activity, and in response, popular prediction market platforms like Polymarket and Kalshi have announced countermeasures to curb insider trading.
Related: Federal regulation looms as 11 states go after prediction markets
US lawmakers take steps to curb insider trading activity on prediction markets
US lawmakers are seeking to restrict insider trading activity on prediction markets, particularly those linked to elections, legislation and geopolitical issues with national security implications.
Congress members Adrian Smith and Nikki Budzinski introduced the “Preventing Real-time Exploitation and Deceptive Insider Congressional Trading Act,” also known as the PREDICT Act, on Wednesday to ban the US president and lawmakers from prediction markets.
A competing bill was also introduced on Thursday, aiming to curb political insider trading activity on prediction market platforms.
Magazine: IronClaw rivals OpenClaw, Olas launches bots for Polymarket — AI Eye
Hyperliquid (HYPE) price is trading at $38.27, down 2.31% on the day, as a completed double top pattern and a dense liquidation cluster at $35.03 raise the odds of an accelerated leg lower.
The token has failed to hold gains above $42.67, and the price is now consolidating. Two independent signals now define the near-term trend line.
HYPE Long Traders Should Be Worried
The HYPE liquidation heatmap shows a dense band of leveraged long positions clustered around $35.03. Cumulative long liquidation leverage at that level totals $27.36 million.
A move below $35.03 would trigger the forced closure of those positions in rapid succession. This would create mechanical selling pressure that could accelerate any decline well beyond the initial breakdown.
Want more token insights like this? Sign up for Editor Harsh Notariya’s Daily Crypto Newsletter here.
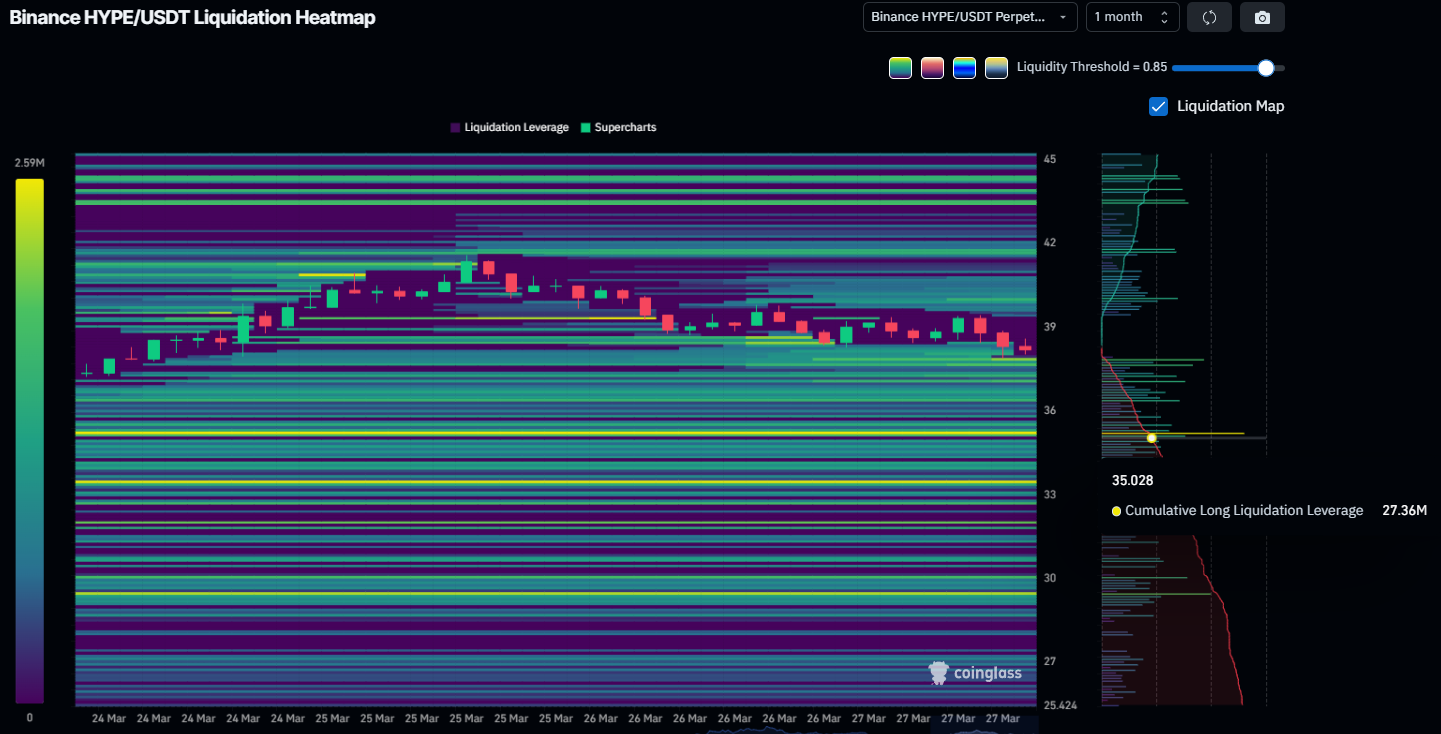
The heatmap shows relatively thin liquidation stacking between $38 and $35, suggesting the price could slice through that range with limited friction. The absence of significant long-side leverage above $39 further limits the likelihood of a demand-driven reversal before the $35.03 test arrives.
Selling Pressure Set Dominates HYPE
The Klinger Oscillator (KVO) is currently reading 8.09K on the daily chart, sitting just above the zero line with a clear downward trajectory. The signal line (green) has already turned lower, and the KVO (blue) is converging toward a bearish crossover.
The Klinger Oscillator measures the difference between two volume-weighted EMAs of price to gauge whether money is flowing into or out of an asset. When it rises above zero, buying pressure dominates; when it falls below zero, selling pressure takes control.
The indicator peaked near 25K in early March, coinciding with HYPE’s rally to $43.76. Since then, momentum has declined in three successive lower highs, a pattern of deteriorating buying pressure that mirrors the price action.
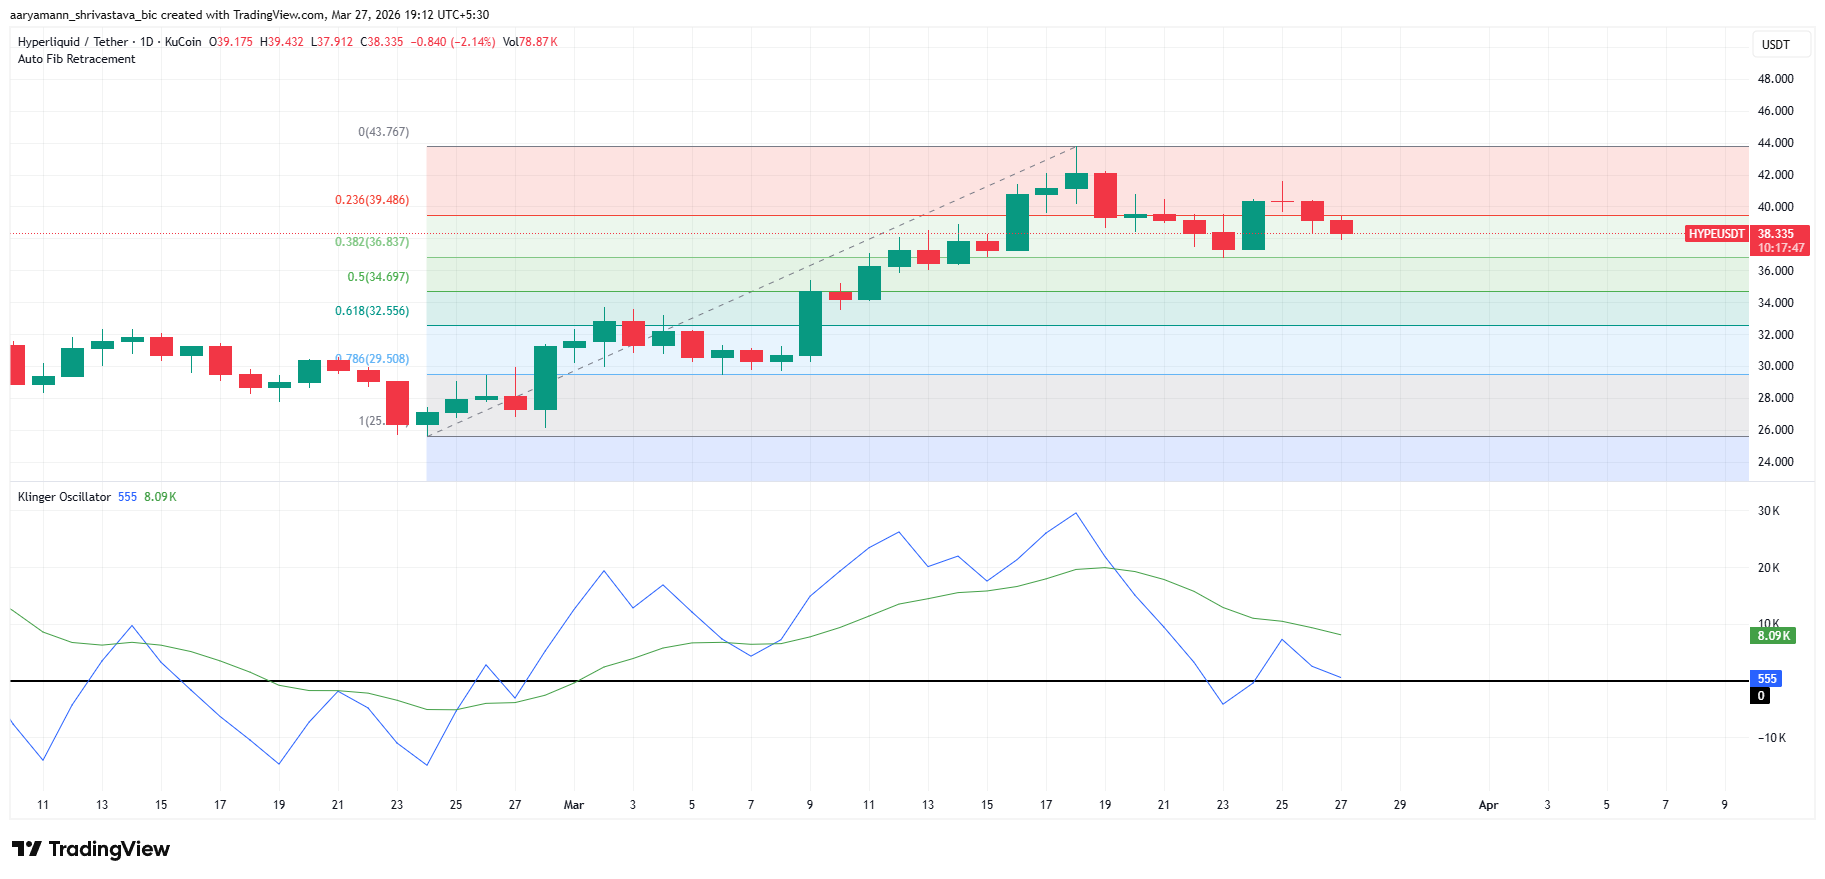
A confirmed cross below zero on the KVO would shift volume-weighted momentum from bullish to bearish. Historically, on the HYPE daily chart, both prior KVO zero-line breaks preceded drawdowns.
The 0.382 Fibonacci retracement level sits at $36.83, offering the first meaningful demand zone before price reaches the $35.03 liquidation cluster. Should the KVO break below zero while the price is below $36.83, the path to $32.33 — the 0.618 Fibonacci level — becomes the primary scenario.
HYPE Price Levels To Watch
The daily chart shows HYPE has completed a double top breakdown, now underway. Price is currently sitting at $38.27, hovering around the support at the same level.
The pattern’s full downside projection is calculated from the breakdown point at the $35.03 neckline. This points HYPE to $21.64 on a confirmed breakdown, matching the 37.49% decline annotated on the chart.
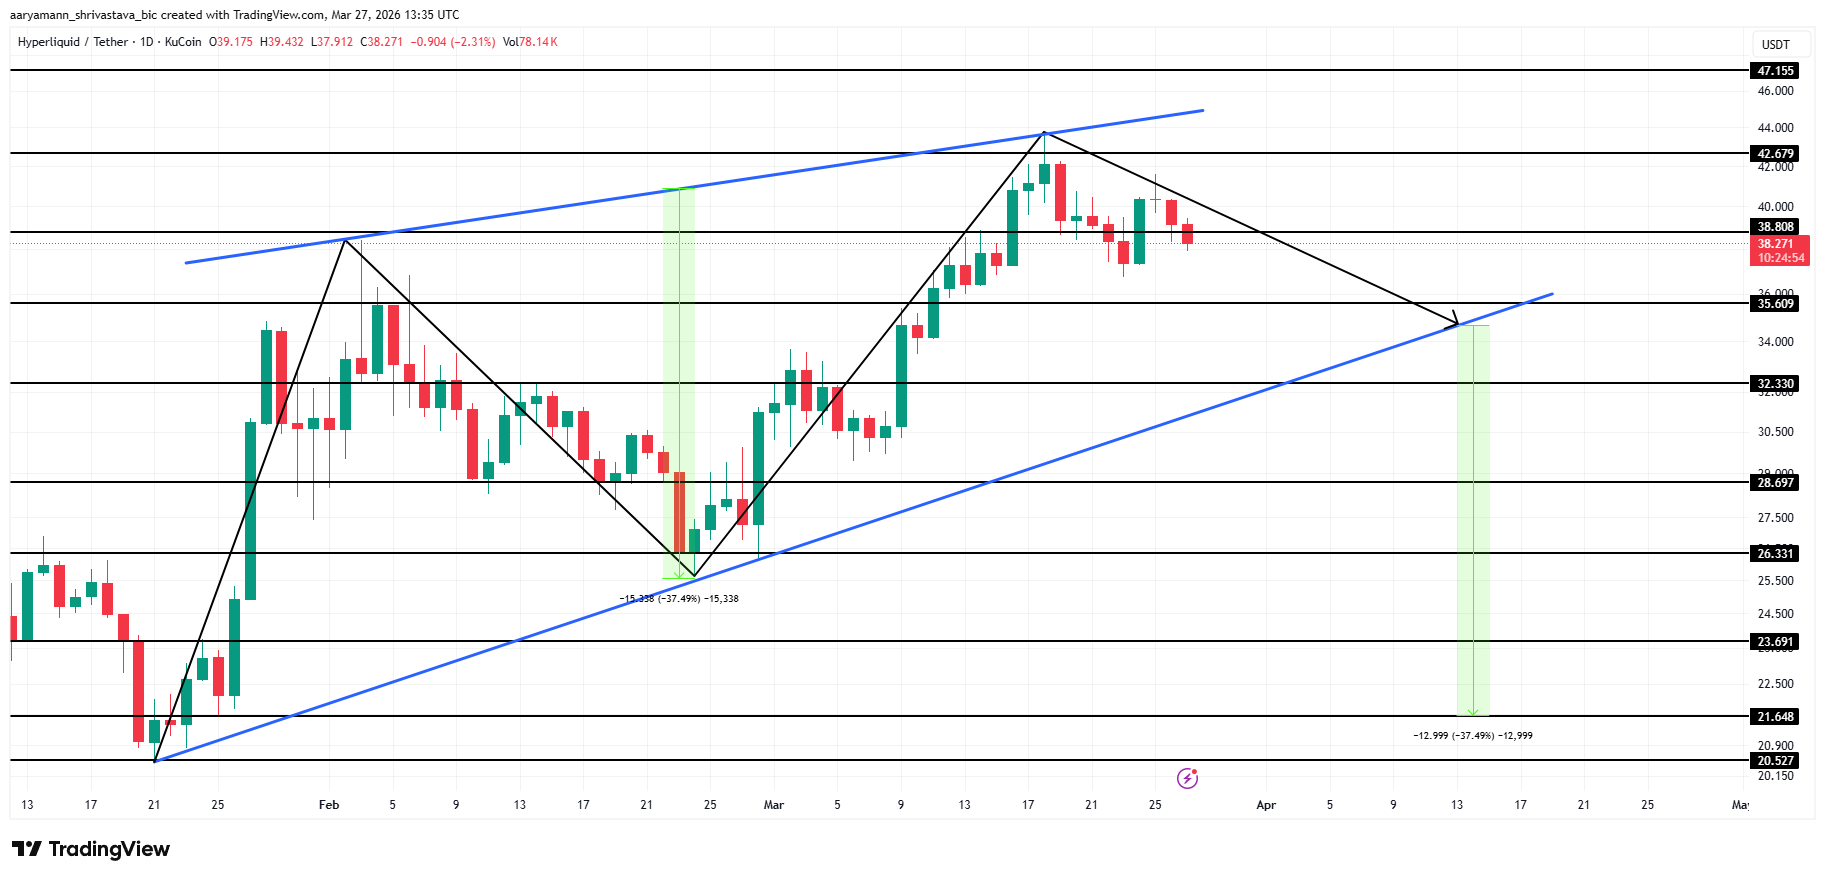
Holding $35.03 is therefore non-negotiable for bulls. Only a daily close below it would confirm the double top and open the door to $32.33 first, then $28.69.
For the bearish thesis to be invalidated, HYPE would need to reclaim $38.80 and then push through $42.67 with conviction. A break above $42.67 would negate the double top structure entirely, shifting the bias back toward the $47.15 resistance.
The post 2 Reasons Why $35 Is a Critical Juncture for Hyperliquid (HYPE) Price appeared first on BeInCrypto.


Bitget CEO Gracy Chen says a $1t single‑day US stock wipeout is accelerating a global macro risk reset, while lower leverage helps Bitcoin act more like a neutral portfolio allocation than a pure risk punt.
Summary
- Over $1 trillion was wiped from US stocks in a single day as risk assets sold off.
- Bitget CEO Gracy Chen says the slide has accelerated a global “reassessment of macro risks.”
- Bitcoin’s smaller drawdown and lower leverage hint at growing status as a neutral allocation.
In the wake of a sharp US equity selloff that erased more than $1 trillion in market value in a single session, Bitget CEO Gracy Chen says the rout is forcing investors to reprice macro risk at a much faster clip while Bitcoin (BTC) is starting to behave more like a neutral, portfolio-level allocation than a pure risk-on punt. According to ChainCatcher, the CEO’s remarks are the latest on top of a broader drawdown that has already knocked trillions off US benchmarks since President Donald Trump’s second-term tariff agenda reignited inflation fears and hit tech-heavy names. As of Friday morning, Bitcoin was trading around $66,500, down roughly 4% on the day but still outpacing major stock indices on a relative basis.
Gracy Chen: $1t US stock selloff shows Bitcoin becoming neutral allocation
Chen argued that the current move is less about idiosyncratic crypto stress and more about global portfolios digesting a new regime of higher energy prices, stickier inflation, and geopolitical conflict spilling over into capital allocation decisions. “This round of adjustment reflects that global markets are reassessing macro risks at a faster pace,” she said, adding that as oil spikes again, “the impact of geopolitical changes is no longer limited to the energy market but is beginning to more directly affect global capital allocation.” The comment comes as strategists at Bloomberg and elsewhere flag how renewed tariff salvos and conflict risk have turned the post-2024 equity boom into what one Bloomberg analysis called a “$1 trillion wreckage,” even as Bitcoin’s institutional scaffolding has largely held.
Despite warning that Bitcoin will “still maintain high volatility in the short term,” Chen highlighted that the asset’s behavior this week has been “relatively robust” compared with previous episodes when risk appetite collapsed. She pointed to a sharp reduction in derivatives leverage as a key reason: “The overall leverage in the crypto market has significantly decreased, thereby limiting the scale of forced liquidations that typically amplify downward pressure during market stress.” That fits with recent flows data showing Bitcoin spot ETFs have seen bouts of outflows but not the kind of capitulation that marked prior crashes, while Bitget’s own protection and risk systems have been tightened as volatility climbed.
For Chen, the resilience is sending a signal about how Bitcoin is being used. “In an increasingly fragmented macro environment, Bitcoin is starting to be viewed by some portfolios as a more neutral allocation choice,” she said. That echoes her earlier comments that recent drawdowns are “tightly linked to the macro cycle,” with investors rotating between crypto, equities, and gold as they navigate Trump’s tariff-led policy shock and rising odds of a US recession. According to a recent crypto.news story, US markets have wiped out $9.6 trillion in value since Trump’s second inauguration, even as Bitcoin has repeatedly bounced after single-day drops of 1%–5%, underlining its evolving role in a world where macro risk is now the dominant driver of asset prices.
In earlier coverage, crypto.news detailed how a previous wave of selling erased $1.1 trillion from digital assets in just 41 days as leverage cascades intensified the downside, a backdrop that makes today’s more orderly drawdown stand out. Another recent story examined how the same tariff and inflation shock that hit tech stocks has rippled through crypto, while a separate report tracked how Bitcoin’s price has stayed comparatively resilient even as US equity indices flirt with bear-market territory. For live market data on Bitcoin, readers can follow its price page on crypto.news, alongside dedicated pages for other major assets involved in these rotations, including Ethereum, XRP, Solana, and Dogecoin.

California Governor Gavin Newsom signed an executive order on Friday, expanding rules to curb public servants and those close to them from benefiting from insider trading on prediction markets tied to political or economic events they can influence or are privy to.
The order prohibits “gubernatorial appointees,” public officials appointed to office by the governor of the state, from using “confidential or non-public information” gleaned from performing their duties to profit from related prediction markets.
Newsom’s executive order also extends the prohibition to include spouses, family members or former business partners of the appointed officials from using non-public information to profit. “Public service should not be a get-rich-quick scheme,” Newsom said. He added:
“At a time when Trump’s Washington is riddled with ethical failures and insider profiteering, California is drawing a bright line: If you serve the public as a political appointee, you serve the public — period. We’re not going to tolerate this kind of corruption in California.”

An announcement from Newsom’s office listed several instances of political insiders using non-public information to profit from prediction markets, including six suspected political insiders who profited from US strikes on Iran.
Newsom’s office also cited another case of suspected insider trading, which occurred in January, after one Polymarket trader netted $410,000 betting that the US would arrest former Venezuelan leader Nicolás Maduro hours before his capture.
Prediction markets have come under scrutiny from US lawmakers, who argue that political insiders are using the platforms to unfairly benefit from their positions and are potentially threatening national security by wagering on sensitive events like war and elections.
Related: Detroit set to enter Michigan‘s battle against Coinbase prediction markets
US lawmakers accelerate prediction market crackdown after insider allegations surface
Texas Congressman Greg Casar and Connecticut Senator Chris Murphy introduced the “Banning Event Trading on Sensitive Operations and Federal Functions (BETS OFF) Act” in March 2026 in response to the prediction market insider trading allegations.
The bill seeks to prohibit government insiders from using prediction platforms to profit from markets tied to war or death.

US Representative Adrian Smith and Representative Nikki Budzinski also introduced similar legislation in March, titled the “Preventing Real-time Exploitation and Deceptive Insider Congressional Trading (PREDICT) Act.”
The legislative proposal prohibits the US President, lawmakers and other high-ranking government officials from betting on prediction markets.
Magazine: Train AI agents to make better predictions… for token rewards
Bittensor’s TAO is consolidating near $328 after a triple‑digit AI‑sector rally, with rich valuations, hot RSIs and a new golden‑cross fractal all flagging room for a 40% corrective dump toward $200 if profit‑taking accelerates.
Summary
- Bittensor’s TAO is trading near $327.81 after a 4.47% daily rebound, but remains down over 17% on the week following a sharp correction from recent highs.
- TAO’s volumes and RSIs show the token coming off an overheated, triple‑digit monthly rally, with 24‑hour turnover equal to nearly one‑fifth of its circulating supply and multi‑timeframe momentum still elevated.
- Rising whale participation and a broader AI‑token surge have driven Bittensor’s upside, but fresh fractal and golden‑cross analysis now flag the risk of a 40% drawdown if profit‑taking accelerates.
Bittensor’s (TAO) native token TAO, a leading AI and big‑data asset, is changing hands around $327.81 today, up 4.47% over the last 24 hours but still lower by 17.67% on the week as the market digests a violent, sector‑wide swing in artificial intelligence narratives. With a market capitalization of about $3.53 billion and 24‑hour trading volume of $622.80 million, TAO currently ranks among the largest AI‑linked crypto assets, reflecting both strong speculative interest and deep two‑sided liquidity.
TAO slips 17% after parabolic AI rally, fractals flag 40% downside risk
The token underpins Bittensor, a decentralized AI network that rewards machine‑learning models for contributing useful inference, effectively positioning TAO as both a governance and incentive asset at the center of an on‑chain AI compute marketplace.
Over the past month, TAO’s price has climbed more than 100%, with 7‑day, 14‑day and 30‑day gains of 21.68%, 58.38% and 105.14% respectively, before this week’s pullback. On the flow side, roughly 1.79 million TAO — equal to 18.68% of circulating supply — has traded in the last 24 hours, underscoring unusually intense activity relative to its size. Momentum remains elevated rather than exhausted: intraday RSI sits near 62, while the 7‑day RSI is around 58, signaling continued bullish bias without a full reset into oversold territory. This follows earlier spikes in whale participation and open interest that helped propel TAO’s breakout above $200 in early March, when large holders aggressively accumulated during the initial phase of the rally.
Bittensor’s TAO pauses near $328 as golden‑cross fractal warns of deeper pullback
However, the same parabolic structure that lifted Bittensor is now flashing caution. CoinMarketCap’s latest AI‑token update notes that TAO surged roughly 160% into a golden cross on March 26, and historical fractal analysis of prior crosses indicates average corrections of about 40% within five to six weeks, implying potential downside toward the $200 region if the pattern repeats. That warning comes against the backdrop of a broader AI‑crypto basket that recently advanced more than 10% in a single day, as the sector’s combined capitalization expanded sharply on March 25. In other words, while Bittensor remains a bellwether for on‑chain AI and continues to trade with strong liquidity and active whale interest, its current technical setup suggests the market is transitioning from euphoria to a more fragile phase where profit‑taking, not fresh capital, may dominate the next move.
Crypto World
BlockDAG News 2026: Stripe Acquires Bridge for $1B While Pepeto Targets Life Changing Returns as BTC and LINK Slide

The average American car payment is $740 a month stretching six years on vehicles losing value every day. Stripe just acquired stablecoin startup Bridge for over $1 billion, proving owning crypto infrastructure is where the money flows.
The blockdag news shows slow price targets, but a $5,000 Pepeto entry is targeting the kind of returns that pay off the car, the loan, and the interest from one position. More than $8 million raised with an exchange already serving traders, and analysts project 100x as the Binance listing approaches.
Stripe acquired stablecoin startup Bridge for over $1 billion, then purchased wallet provider Privy and billing platform Metronome to assemble a full stack payment ecosystem according to FinTech Weekly.
As one analyst noted, owning the rails means you stop paying rent on someone else’s blockchain.
According to CoinDesk, the stablecoin infrastructure race is accelerating as the CLARITY Act framework takes shape, and the BDAG outlook falls far short of the capital pouring into verified exchange entries right now.
The Best Entries and Where the BlockDAG News Conversation Falls Short
Pepeto: The Verified Exchange Where $5K Today Targets the Returns That Clear Car Payments Permanently
Every new token that launches creates a new risk for investors, and as the market expands the volume of dangerous contracts keeps increasing. Pepeto is the verified exchange where a $5,000 entry today targets the returns that clear $740 monthly car payments permanently, and the BDAG forecast shows a project still struggling with supply unlocks while this exchange is already running and attracting whale capital.
The exchange’s contract scanner becomes more valuable as the ecosystem grows, checking every project automatically before the reader’s money goes near it and explaining what it found in plain language.
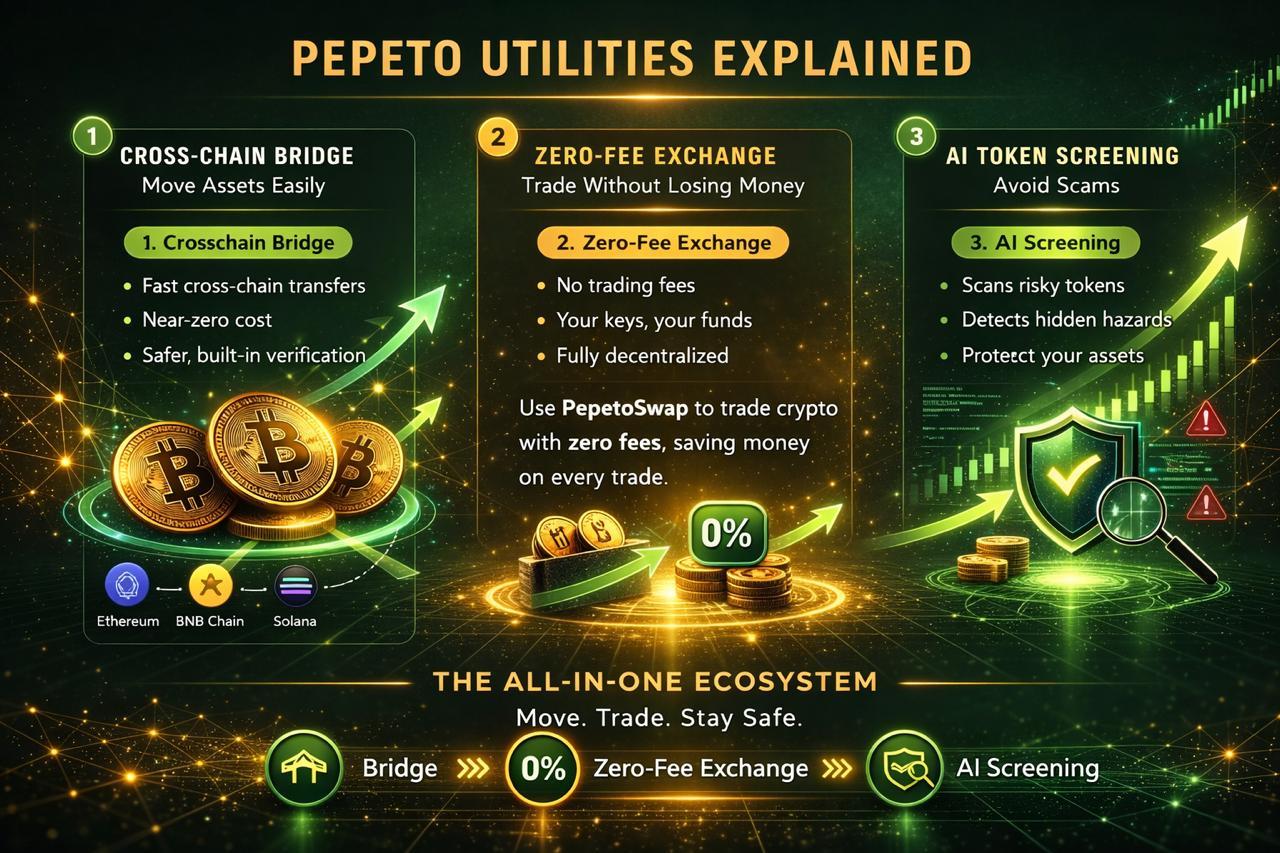
PepetoSwap handles every trade without taking any commission so portfolios stay intact, the blockchain connector moves tokens across networks at zero transfer cost, and a SolidProof audit confirmed every contract. The mind behind the original Pepe coin, which climbed to $11 billion on meme power with zero products backing it, engineered this exchange alongside a Binance infrastructure veteran.
In the months ahead, the BDAG headlines will fade and the crypto news will eventually cover the success stories made by Pepeto, the exchange seeing demand, and the returns earned, but by then the entry is gone. Analysts project 100x from the current entry at $0.000000186, and 192% APY staking expands every wallet’s position as the Binance listing nears. Rounds close faster every week, the presale is still accepting entries, and a 2026 portfolio with Pepeto is most likely the strongest decision any investor carrying $740 monthly car payments can make right now.
Bitcoin (BTC)
BTC trades at $65,794 per CoinMarketCap, down 5.6% on the week after the $14 billion options expiry triggered mass selling.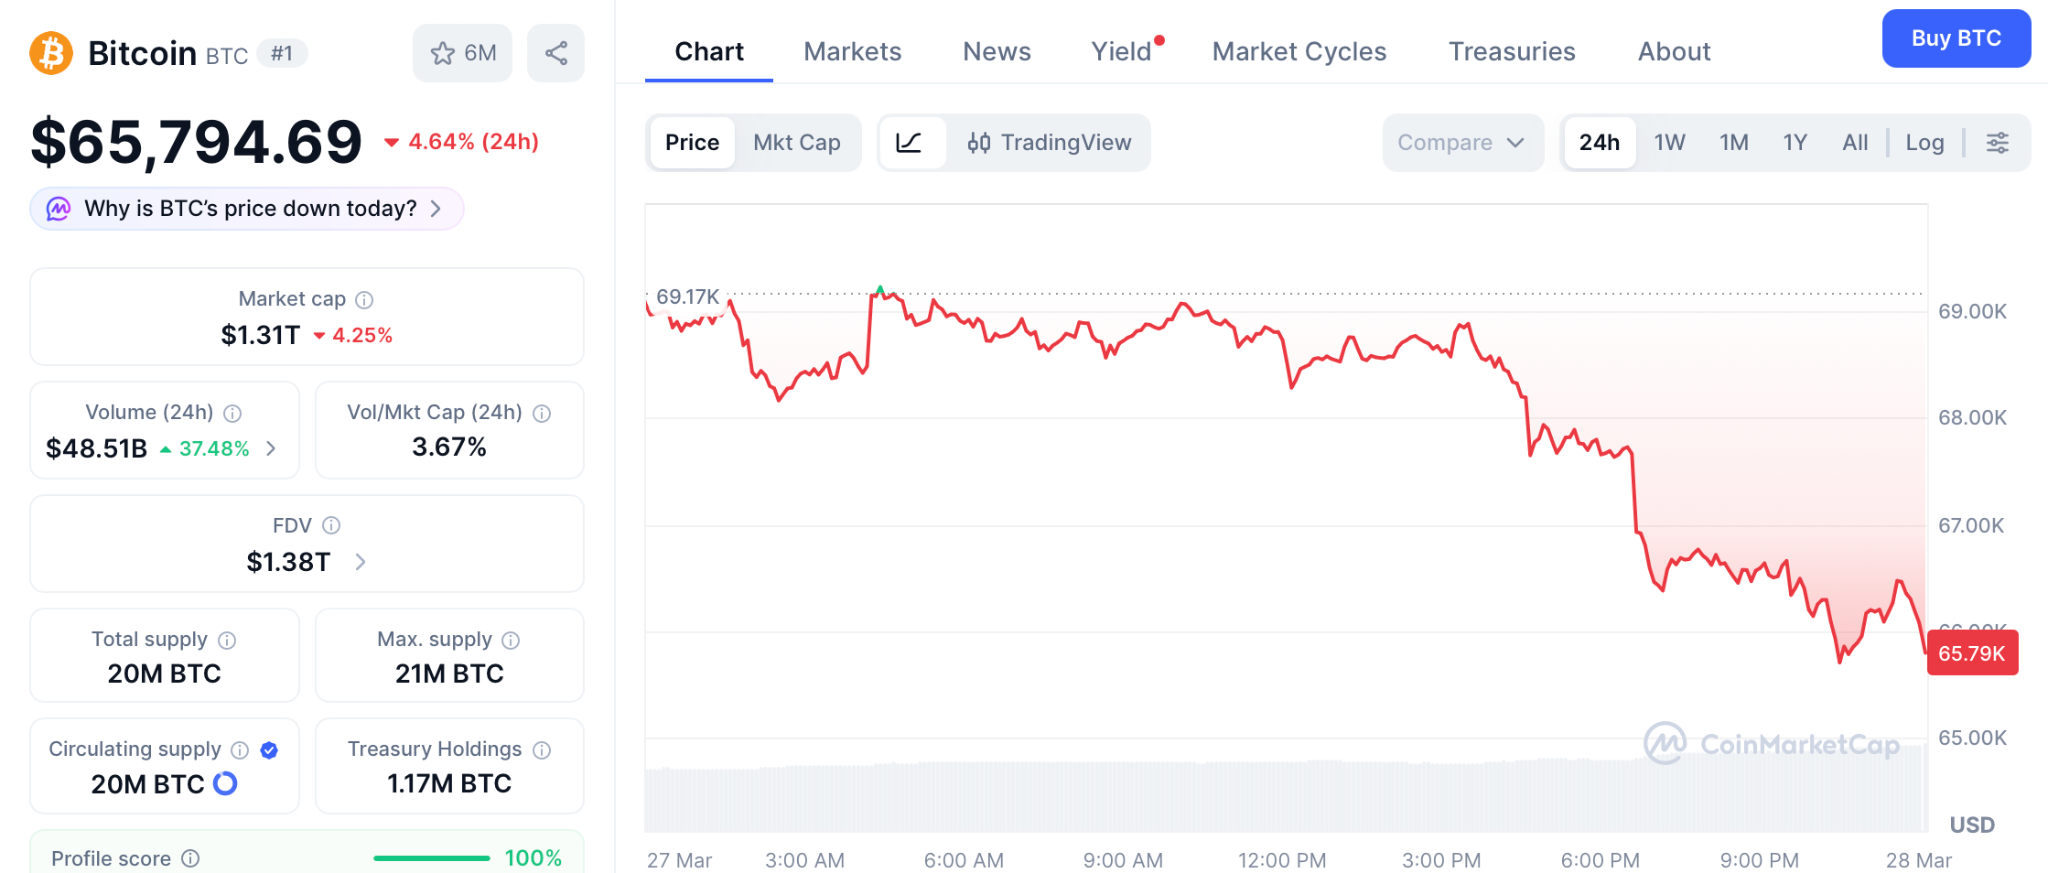 MARA sold 15,133 BTC just to manage debt, and a recovery to $75,000 delivers 11% over months, a slow rebuilding play, while the presale entry targets 100x from one listing event the miners selling BTC are watching others position for.
Chainlink (LINK)
LINK sits at $8.66 per CoinMarketCap, grinding 83% below its $52.70 all time high after six consecutive red monthly candles.
A break above $9.74 targets $11 for a 27% move, and while the BDAG conversation keeps the project visible, presale entries are where the life changing returns live and Pepeto offers exactly that math.
The BlockDAG News Will Fade but the Wallets Inside Pepeto Are Building the Returns the Market Will Cover
Stripe just spent over $1 billion to own stablecoin rails, and American families spend $740 a month on car payments stretching six years.
The BDAG news cycle keeps attention on a project with slow price targets, but in the months ahead the crypto news will cover the success stories made by Pepeto, the exchange seeing demand, and the returns that changed portfolios, and by then the entry is gone.
The Pepeto official website is still accepting entries, and a 2026 portfolio with Pepeto before the Binance listing is the decision that separates the families still making car payments from the ones who cleared every balance from one position.
Click To Visit Pepeto Website To Enter The Presale

FAQs
What does the blockdag news mean for investors searching for better entries?
The blockdag news shows slow price targets while Pepeto’s verified exchange targets 100x from one Binance listing event, and the presale entry clears car payments from one position.
What is the latest blockdag news investors should watch?
The blockdag news cycle keeps the project visible, but the Pepeto official website is where the 100x entry with a verified exchange and Binance listing is still open.
Does the blockdag news matter for 2026 portfolios?
The blockdag news provides context for existing holders, but Pepeto’s presale with the Pepe builder and Binance listing targets the returns that change the reader’s financial life.
Disclaimer: This is a Press Release provided by a third party who is responsible for the content. Please conduct your own research before taking any action based on the content.


Coinbase and Better Home & Finance have operationalized the first conforming crypto-backed mortgage in U.S. history, allowing borrowers to pledge Bitcoin or USDC as collateral for a Fannie Mae-backed home loan without liquidating their positions.
The product plugs directly into the $12 trillion U.S. residential mortgage market, not as a niche private offering, but as a GSE-conforming instrument backed by the same federal infrastructure that underwrites more than half of American home purchases.
The surface headline is historic. The mechanism underneath it is where the real trade-off lives. BTC is discounted to 40% of market value for collateral purposes; USDC is discounted to 80%. A borrower pledging $100,000 in Bitcoin receives $40,000 in usable down payment credit, a haircut that makes the math work for the GSEs but demands significant overcollateralization from the borrower.
The question this article answers: what does it actually take to use crypto to buy a house under this framework, and what does the product’s existence signal about where institutional mortgage infrastructure is heading?
- Policy Trigger: FHFA Director Bill Pulte directed Fannie Mae and Freddie Mac on June 25, 2025, to develop crypto-as-asset underwriting guidelines, providing the regulatory foundation for this product.
- Haircut Mechanism: BTC is valued at 40% of market price; USDC at 80%. A $100,000 BTC position yields $40,000 in qualifying collateral.
- First Mover: Coinbase and Better Home & Finance are executing the first conforming loan under this structure; lender Newrez has since launched its own parallel crypto-backed program.
- Scope Limitation: Only assets held on U.S.-regulated exchanges with AML compliance and a 60-day holding history qualify — cold wallets, DeFi positions, and staked assets are excluded.
Discover: The best crypto presales gaining institutional momentum right now
How the Loan Structure Actually Works
The product is structured as two instruments layered together: a primary conforming Fannie Mae-backed mortgage and a second mortgage covering the down payment, secured by pledged crypto collateral. Coinbase holds the pledged assets in custody; borrowers do not transfer ownership, but the collateral is encumbered for the loan’s duration.
Get your house and keep your crypto. — Coinbase
Crypto-backed mortgages are here – increasing access to homeownership for millions of Americans.
Buy a home without converting your portfolio by using BTC or USDC as collateral for your down payment.
Offered by Better, powered by Coinbase. pic.twitter.com/9hfL3fVty5
 (@coinbase) March 26, 2026
The haircut is the defining constraint. To generate $80,000 in qualifying down payment credit using Bitcoin at the 40% valuation rate, a borrower must pledge $200,000 in BTC.
USDC’s 80% rate is more capital-efficient; $100,000 in USDC yields $80,000 in usable collateral, but still demands a meaningful overcollateralization buffer.
Fannie Mae’s volatility haircut framework is designed precisely to absorb the asset class’s price swings without triggering forced liquidations on the borrower side.
There are no margin calls. Collateral is not at risk from short-term price drops. The crypto position becomes actionable for the lender only after 60 or more days of delinquency, aligning with standard foreclosure timelines and deliberately decoupling the mortgage’s credit risk from crypto’s daily volatility.
Eligible assets must be held on a U.S.-regulated exchange with full AML compliance and a minimum 60-day documented holding history. Cold wallets are excluded. DeFi positions do not qualify. Staked assets are out. The framework is narrow by design; it trades flexibility for GSE compatibility, which is the only pathway to conforming status.
The policy architecture behind this traces directly to FHFA Director Pulte’s June 25, 2025, directive ordering Fannie Mae and Freddie Mac to develop formal underwriting guidelines for digital assets. Phase 1 framework proposals covering volatility treatment and documentation standards are currently under FHFA review, with a 6-to-12-month timeline before the rollout of Phase 2 criteria.
Discover: The best crypto presales gaining institutional momentum right now
The post Coinbase Powers First Crypto-Backed Conforming Mortgages appeared first on Cryptonews.
Avalanche’s AVAX is grinding sideways around $9, testing key support as a bullish “digital commodity” ruling, Animoca partnership and cheaper subnets collide with thin liquidity and stubborn overhead supply.
Summary
- Avalanche’s AVAX is trading close to $9.07 today, roughly flat on the day but struggling to hold above the $9.00–$9.50 support zone after a multi‑month drawdown.
- The token, a layer‑1 smart contract platform, carries a market cap in the low‑single‑digit billions and remains under pressure despite recent regulatory clarity and high‑profile partnerships aimed at driving institutional and real‑world asset adoption.
- Technical indicators show mixed momentum, with AVAX hovering near oversold territory on higher time frames while intraday moves remain range‑bound, framing the current price action as a possible basing attempt rather than a confirmed reversal.
Avalanche’s (AVAX) native token AVAX, the core asset of the Avalanche layer‑1 smart contract network, is trading around $9.07 today, marking a sideways session that leaves the token pinned just above critical support in the $9.00–$9.50 band.
After starting 2026 near $12.31 and sliding to an average closing level near $10.14, AVAX has posted a double‑digit percentage decline year‑to‑date, underperforming several rival smart contract platforms as broader altcoin liquidity thins out. The asset underlies a high‑throughput, subnet‑based ecosystem designed to host DeFi, gaming and real‑world asset (RWA) applications, positioning AVAX squarely in the L1 and RWA‑adjacent category in the current market structure.
AVAX tests $9–$9.50 floor as institutional RWA story outruns spot demand
In terms of immediate trading dynamics, recent analysis pegs AVAX consolidating between roughly $8.66 and $10.20, with short‑term forecasts calling for only a modest 2.95% upside toward $9.53 over the coming days if support holds. Technical dashboards show RSI cycling in the neutral‑to‑slightly‑oversold range depending on timeframe, and prior attempts to sustain a breakout above the $10 psychological level have faded quickly, underscoring the presence of persistent overhead supply. That pattern is consistent with a market where retail participation has retreated sharply following a 94% decline from all‑time highs, leaving price heavily dependent on selective institutional flows rather than broad speculative enthusiasm.
Fundamentally, Avalanche has logged several milestones that should, in theory, support AVAX over the medium term. On March 17, 2026, U.S. regulators formally classified AVAX as a “digital commodity,” aligning it with Bitcoin and Ethereum from a legal standpoint and potentially smoothing the way for regulated products and deeper institutional involvement. Days later, Web3 heavyweight Animoca Brands disclosed an investment and strategic partnership with Ava Labs aimed at growing Avalanche’s footprint in Asia and the Middle East, including targeted deployments in RWA, digital identity and entertainment. On the technology side, the November 2025 Granite mainnet upgrade and prior Octane hard fork dramatically cut fees, improved cross‑chain messaging and introduced biometric‑friendly cryptography, making it cheaper and simpler to launch subnets and onboard mainstream users.
Yet price remains stuck in a tight range because this fundamental progress has not fully translated into sustained spot demand for AVAX. Analysts note that real‑world asset TVL on Avalanche has pushed above $1.3 billion, with institutional pilots from major financial firms, but these flows are gradual rather than explosive, and many treasuries hedge or amortize their AVAX exposure. As a result, the current tape looks like a classic disconnect: structurally bullish long‑term narrative, but near‑term price dictated by whether $9.00 can hold in the face of lingering risk‑off sentiment across non‑Bitcoin, non‑Ethereum large‑caps.

LayerZero has become the first interoperability protocol live on the Canton Crypto Network, the institutional blockchain backed by Goldman Sachs, Microsoft, and DTCC, enabling regulated financial institutions to route tokenized assets across more than 165 public blockchains while preserving compliance standards.
This is kind of Wall Street’s tokenization infrastructure opening a direct channel to the entirety of onchain liquidity.
- Integration Scope: LayerZero is now live on Canton Network, connecting its $100 billion ecosystem to Canton’s institutional rails and enabling cross-chain access to 165+ public blockchains.
- Institutional Signal: Canton already processes more than $350 billion in daily U.S. Treasury repo volume; testing participants include Goldman Sachs, BNP Paribas, Tradeweb, and Citadel Securities.
- Market Implication: Nearly 400 ecosystem participants on Canton now have a credible path to cross-chain tokenized asset deployment — a structural liquidity unlock for institutional RWA markets.
Discover: The best crypto presales gaining institutional momentum right now
Routing $350 Billion in Daily Repo Volume Across 165 Chains
Canton crypto core infrastructure, built by Digital Asset on the DAML smart contract language, already handles serious institutional volume. Broadridge’s distributed ledger repo platform processes between $300 billion and $400 billion in daily U.S. Treasury repo transactions through Canton — establishing it as operating infrastructure, not a proof-of-concept.
— Fundraising Digest (@CryptoRank_VCs) March 26, 2026
 Goldman Sachs‑backed Canton Chain taps LayerZero
"@CantonNetwork has already built the rails for traditional finance, processing more than $350 billion in daily U.S. Treasury repo volume"
– Bryan Pellegrino, CEO @LayerZero_Core
This move is a step toward… pic.twitter.com/6IJqAaukMs
The LayerZero integration now sits on top of those rails. LayerZero Labs CEO Bryan Pellegrino framed the division of labor precisely: “Canton has already built the rails for traditional finance, processing more than $350 billion in daily U.S. Treasury repo volume. LayerZero’s job is to make sure those assets are available in every global market, across blockchains.”
The distinction matters technically. LayerZero does not operate as a traditional bridge, it is designed to make any token or application natively compatible with any blockchain, avoiding the custodial risk that has plagued earlier cross-chain solutions. For Canton’s compliance-focused participants, that architecture matters as much as the connectivity itself.
Testing has already involved Goldman Sachs, BNP Paribas, DRW, QCP, Liberty City Ventures, and Tradeweb, the same institutions that underwrote Digital Asset’s $135 million funding round in June 2025, led by DRW Venture Capital and Tradeweb Markets with participation from Circle Ventures and Citadel Securities.
Discover: The best presale crypto projects launching on cross-chain infrastructure right now
The post Goldman Sachs-Backed Canton Crypto Chain Adds LayerZero Interoperability appeared first on Cryptonews.

Tiger Woods arrested for DUI after car crash: 15-time major winner rolled vehicle
IPL Cricket 2026 Livestream: How to Watch the Indian Premier League From Anywhere

Critics Blame Review Bombing For Starfleet Academy Failure, While Manipulating Scores Themselves

Smart energy pays enters the US market, targeting scalable financial infrastructure

Why Israel is blocking foreign journalists from entering

Bitcoin: We’re Entering The Most Dangerous Phase

Mine Bitcoin 5X Cheaper Without Rigs? How to Stake HNO Coin #bitcoinmining #Crypto #Altcoin #shorts

Business Studies Class 12: Financial Markets One Shot NCERT Revision | CBSE 2026

COCKROACHES in the Financial System! (Private Credit)
-
 NewsBeat3 days ago
Manchester United reach agreement with Casemiro over contract clause amid transfer speculation
-

 Crypto World6 days ago
Best Crypto to Buy Now: Strategy Just Spent $1.57 Billion on Bitcoin During Fear While Early Investors Quietly Enter Pepeto for 150x Potential
-

 Crypto World6 days ago
Bitcoin Price News: Bhutan Sells $72 Million in BTC Under Fiscal Pressure, but the Smart Money Entering Pepeto Sees What the Market Does Not
-

 News Videos2 days ago
Parliament publishes latest register of MPs’ financial interests
-

 Sports5 days ago
Remo Stars and Kano Pillars Strengthen Survival Hopes in NPFL
-

 Sports4 days ago
Gary Kirsten Accuses Pakistan Cricket Board Of ‘Interference’, Mohsin Naqvi Responds
-

 Business5 days ago
No Winner in March 21 Drawing as Prize Rolls to $133 Million for Next
-

 Tech5 days ago
Give Your Phone a Huge (and Free) Upgrade by Switching to Another Keyboard
-

 Tech5 days ago
AI enters the chat: New Seattle dating app relies on tech to facilitate meaningful human connections
-

 News Videos4 days ago
Ch 9 Financial Management Part 1 | Detailed One Shot | Class 12 Business Studies Boards 2026
-

 Tech6 days ago
Today’s NYT Connections Hints, Answers for March 22 #1015
-

 Business1 day ago
Instagram, YouTube Found Responsible for Teen’s Mental Health Struggle in Historic Ruling
-

 Business6 days ago
Will Duke Basketball Win It All? Duke Basketball Enters Second Round as Third Favorite to Claim NCAA Title
-

 Sports5 days ago
2026 Kentucky Derby horses, odds, futures, preview, date: Expert who hit 12 Derby-Oaks Doubles enters picks
-
 NewsBeat5 days ago
Update on Wisbech river crash as search for teenage boy enters fifth day
-
 Entertainment4 days ago
Cynthia Bailey Dishes on ‘RHOA’ Season 17, Discusses Kandi
-

 Tech4 days ago
Samsung will soon let you control smart home devices from your car’s dashboard
-
 NewsBeat2 days ago
Tesco is selling new Cadbury Dairy Milk bar and people can’t wait to try it
-

 NewsBeat7 days ago
The 3 airlines that have entered insolvency in 2026 so far
-

 Tech6 days ago
SteamOS update adds support for Steam Machine and other non-Valve hardware
You must be logged in to post a comment Login