

Crypto World
Quasimodo Pattern in Trading | Market Pulse

The Quasimodo pattern is a reversal structure that closely resembles the Head and Shoulders. Many traders overlook it or mistake it for its more popular counterpart in price action trading. The QM pattern has distinct entry, stop-loss, and take-profit rules that set it apart. This article covers its structure, the methods used to confirm signals, and the execution rules.
Quasimodo Pattern Structure Explained
The Quasimodo pattern is a reversal chart structure that forms at the end of a trend. The QM pattern relies on a failed continuation. Price prints a higher high (or lower low) in line with the trend. Then it reverses and breaks the prior swing in the opposite direction. This break invalidates the previous structure and signals exhaustion. QM pattern trading suits any timeframe. A Quasimodo trading strategy may be used across forex, stock, and commodity charts.
The pattern has two variants:
- Bearish Quasimodo: appears after an uptrend and signals a potential downtrend.
- Bullish Quasimodo (inverse): appears after a downtrend and signals a potential uptrend.
Bearish and Bullish QM Structure
A bearish QM occurs at the end of an uptrend and signals the formation of a new downtrend. It consists of three peaks (a head in the middle and two shoulders at the sides) and two troughs. The second peak (head) is the highest, and the second trough is the lowest.
A bearish QM reversal pattern forms in six moves:
- Price prints a left shoulder high, then pulls back to the first trough.
- It pushes to a higher high (the head), then pulls back below that trough.
- Price rallies to a right shoulder lower than the head.
- The lower low between head and right shoulder breaks bullish structure.
- Price moves downward from the right shoulder.
- Failure to retake the head confirms sellers have taken over.
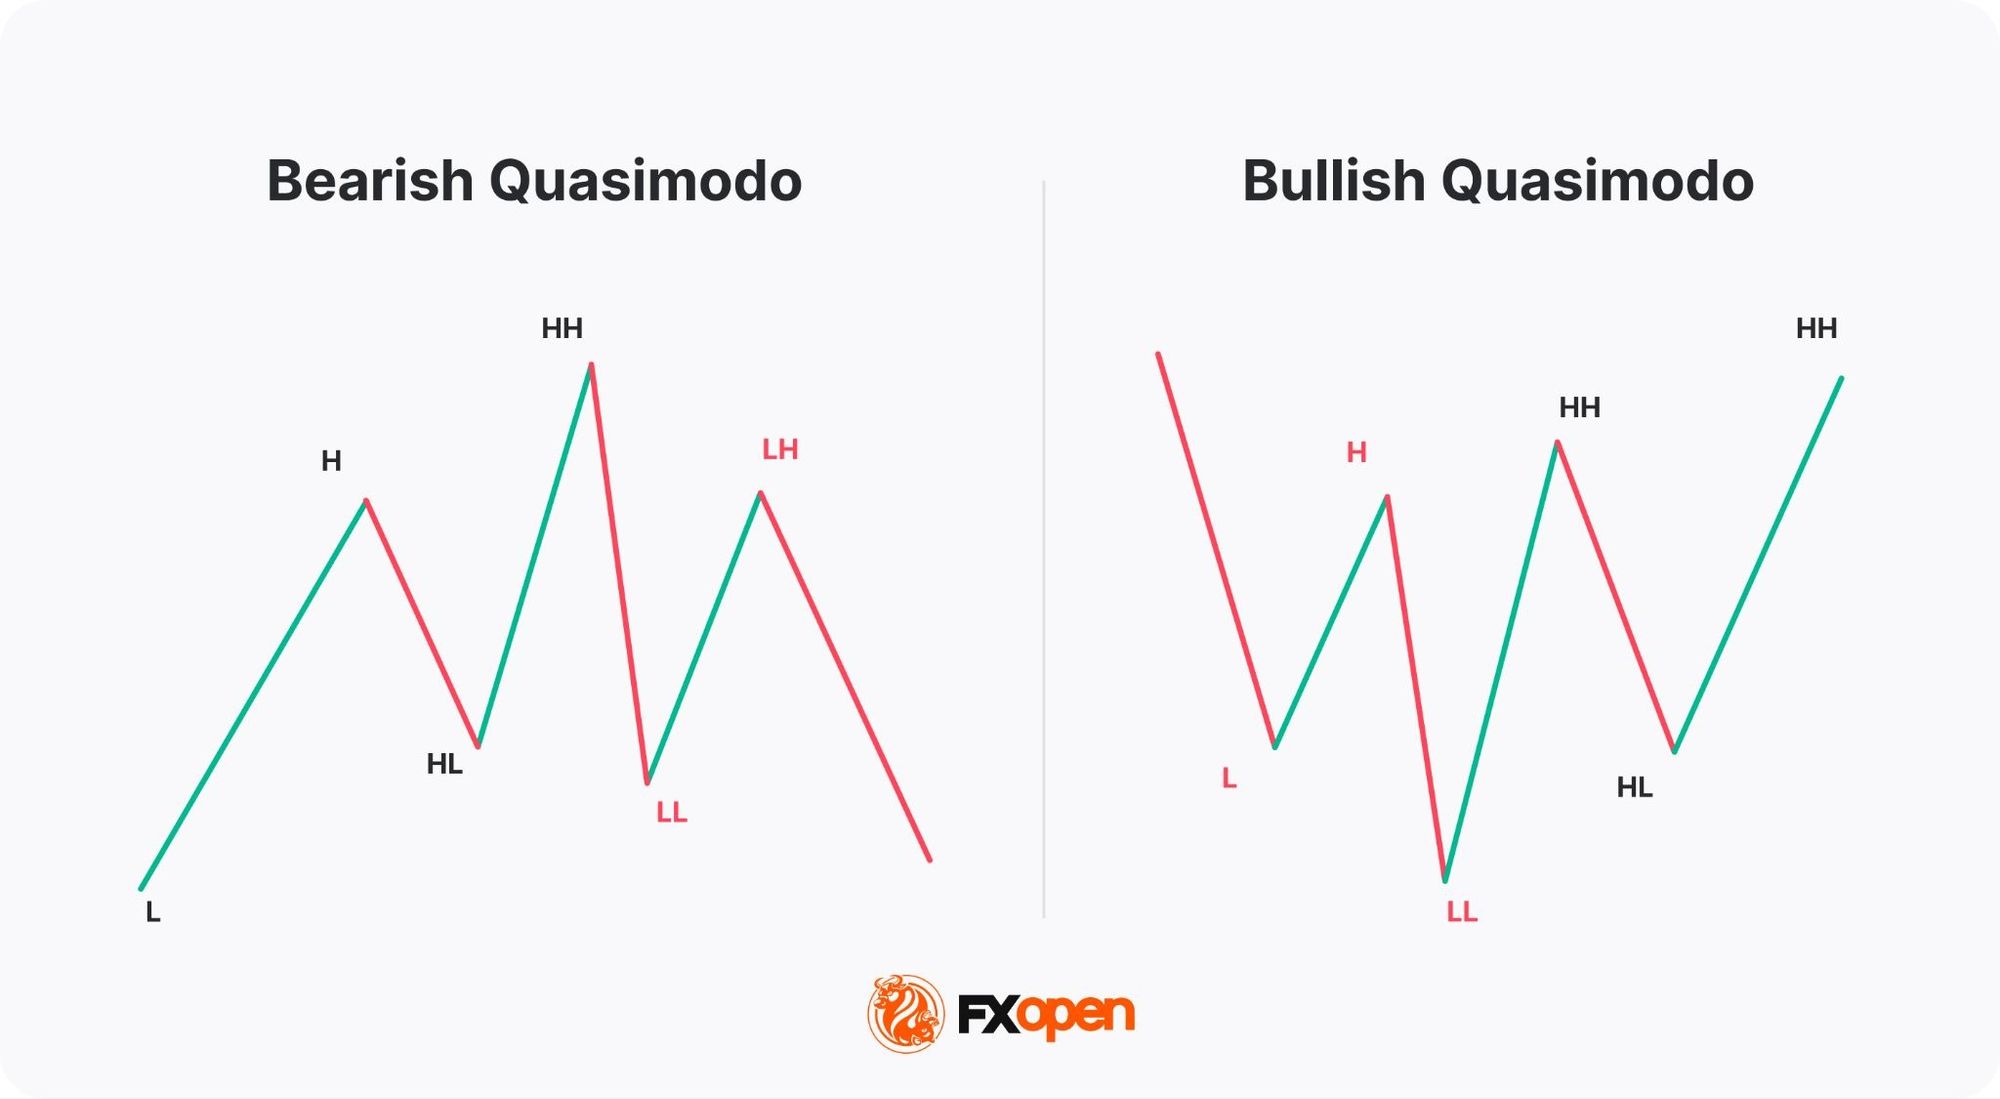
A bullish (inverse) Quasimodo occurs at the end of a downtrend and signals a potential uptrend. It consists of three lows (a head in the middle and two shoulders at the sides) and two tops, where the second trough (head) is the lowest and the second top is the highest.
A bullish QM forms in six moves:
- Price prints a left shoulder low, then rallies to the first peak.
- It pushes to a lower low (the head), then rallies above that peak.
- Price pulls back to a higher low (right shoulder).
- The higher high between head and right shoulder breaks bearish structure.
- Price reverses upward with the right shoulder.
- Failure to retake the head’s low confirms buyers have taken over.
Market Structure Behind the QM Pattern
The QM pattern reflects a specific shift in market structure. Price extends the prevailing trend by sweeping the prior swing high or low. This sweep often triggers stops and absorbs liquidity sitting above old highs or below old lows.
Buyers (or sellers) fail to push price further. The market then reverses and breaks the opposite swing, invalidating the trend’s structure. This failed continuation is what gives the QM its reversal signal.
In terms of reliability, the Quasimodo pattern is considered useful for identifying trend reversals, particularly when supported by other technical indicators like the RSI or MACD. Unlike more common patterns, the QM pattern provides distinct entry and exit points.
Its reliability might increase in strongly trending markets, where the previous trend is well-defined, and the pattern clearly indicates a reversal. CME Group’s reference on reversal chart patterns notes that confirmation through volume or follow-through movement strengthens any reversal signal.
QM Pattern Trading Strategy Rules
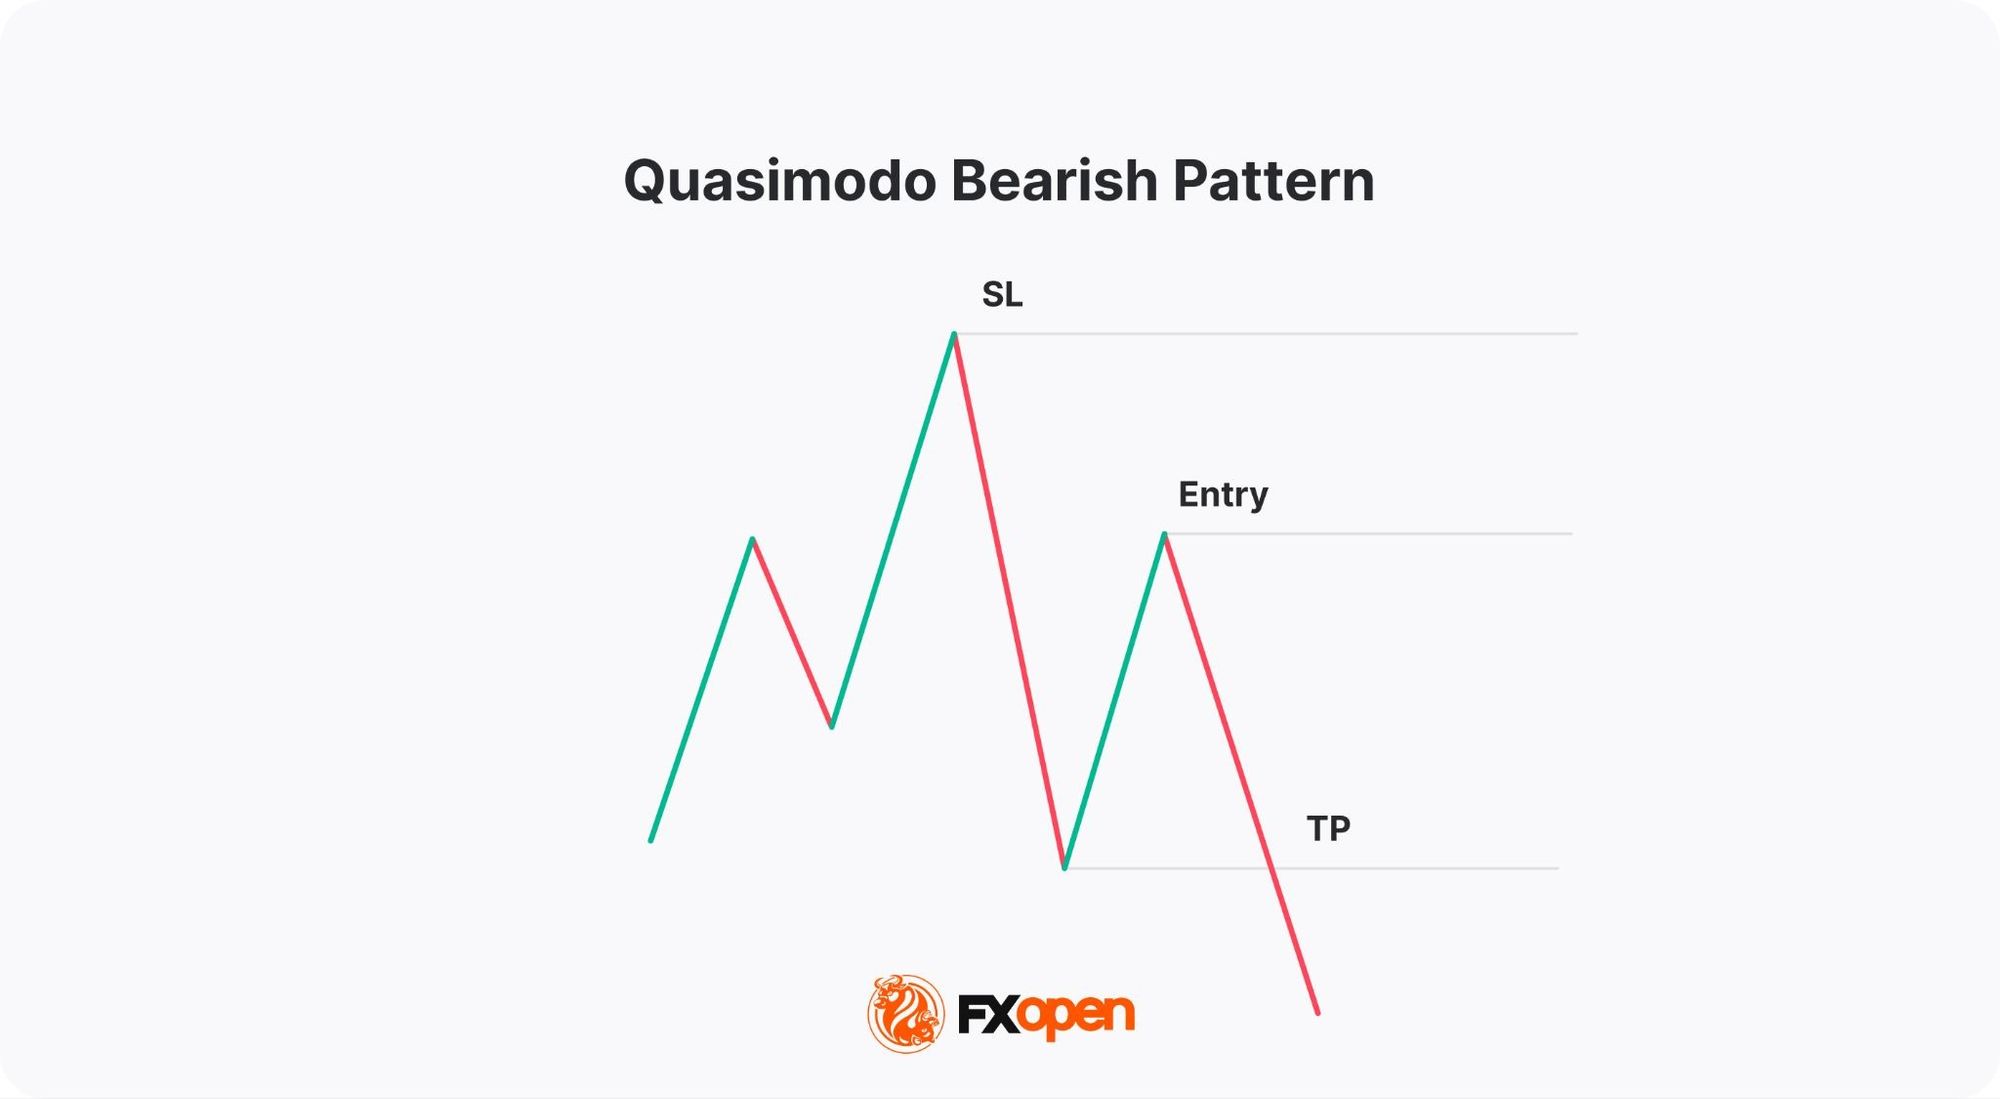
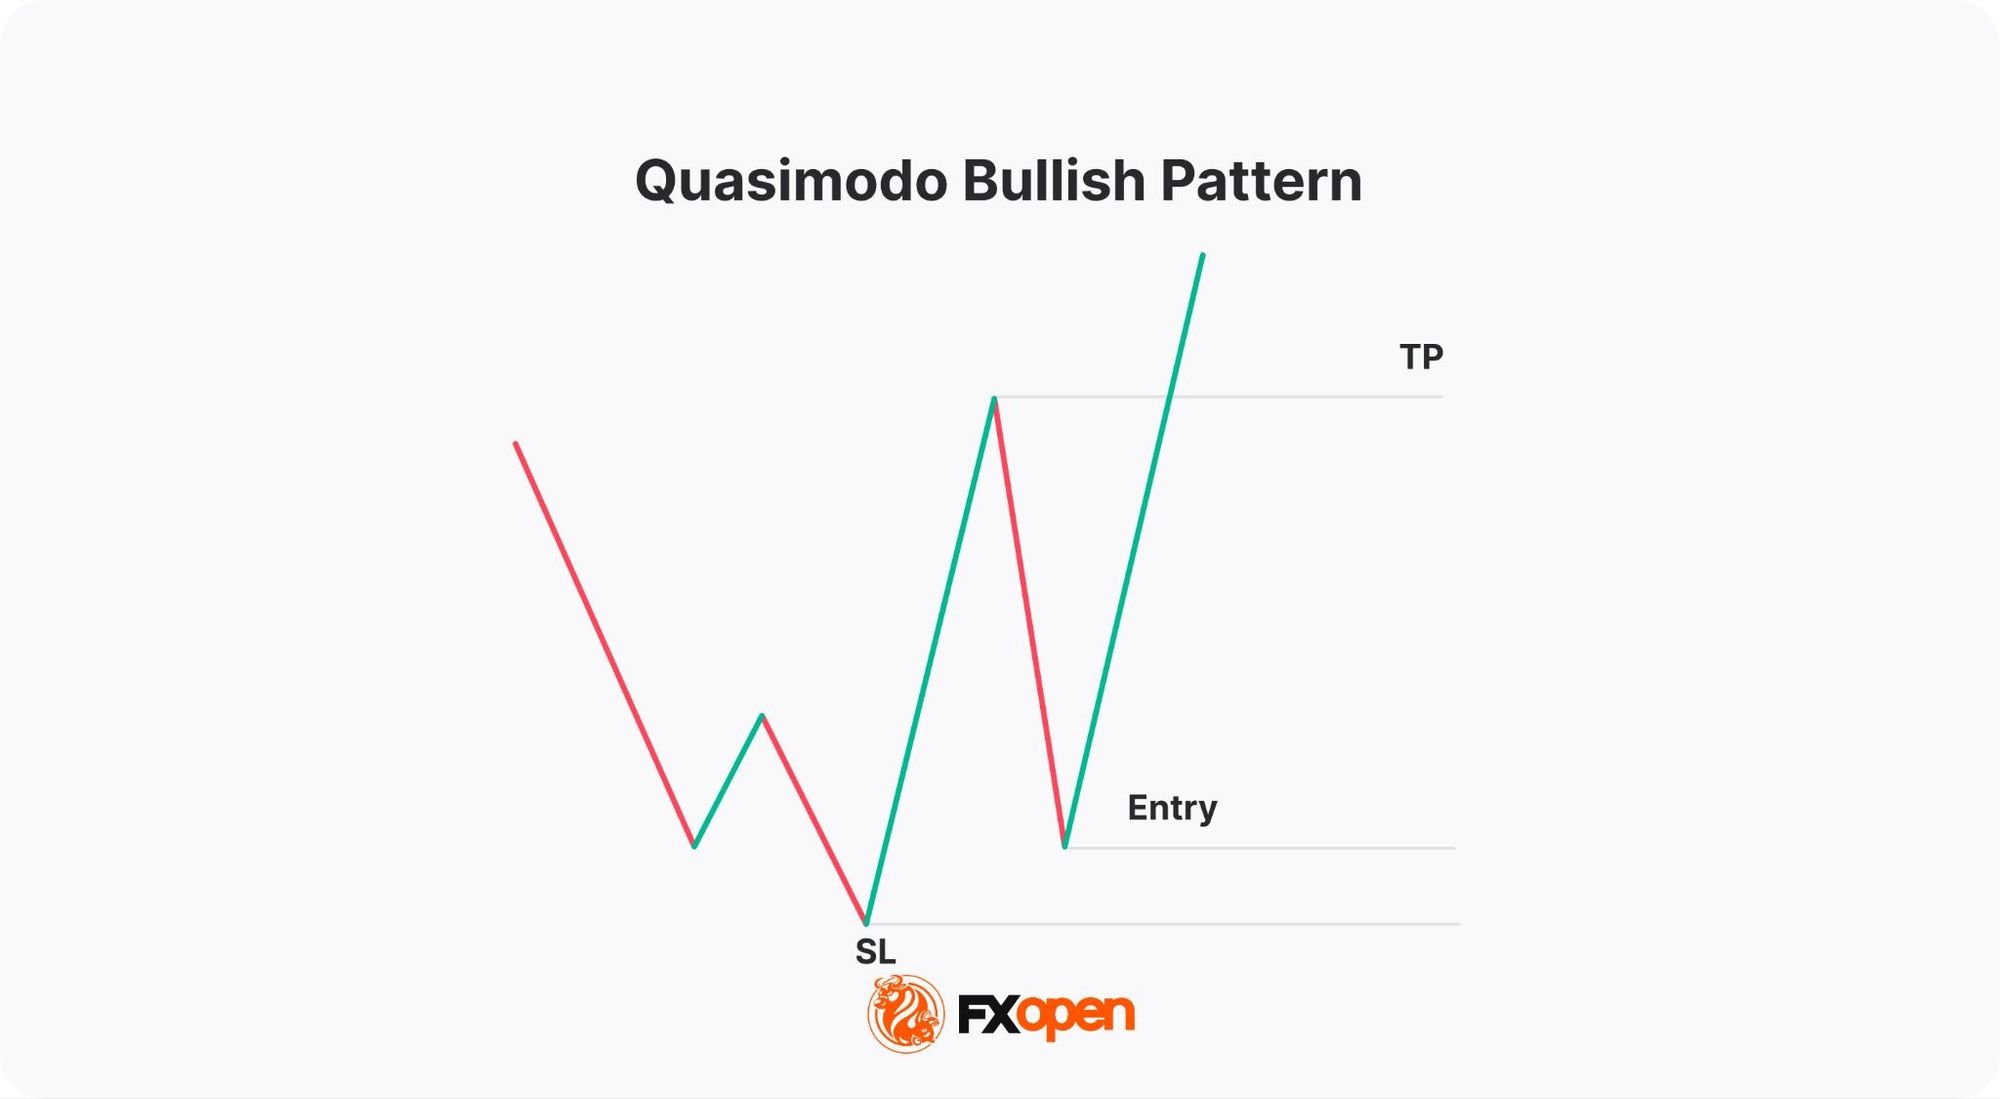
The Quasimodo trading strategy defines four execution components tied to pattern structure:
- Entry: a position is typically opened as the right shoulder forms, after price reverses from the head’s extreme.
- Stop-loss: placed just beyond the head, since a move through that level invalidates the structure.
- Take-profit: set at the second trough (bearish) or second peak (bullish), which marks the prior swing the pattern broke.
- Invalidation: price closing beyond the head, or failing to reverse from the right shoulder area, cancels the setup.
Risk-to-reward depends on shoulder placement. A right shoulder formed close to the second trough (or peak) shortens the take-profit distance and may produce a 1:1 ratio or worse. A shoulder formed further away can deliver 1:2 or 1:3. In a QM entry strategy, traders often filter setups by the structural geometry rather than entering every formation.
Entry and Risk Parameters
The table below summarises the QM pattern entry and stop loss logic for both directions:
Variations and Execution Adjustments
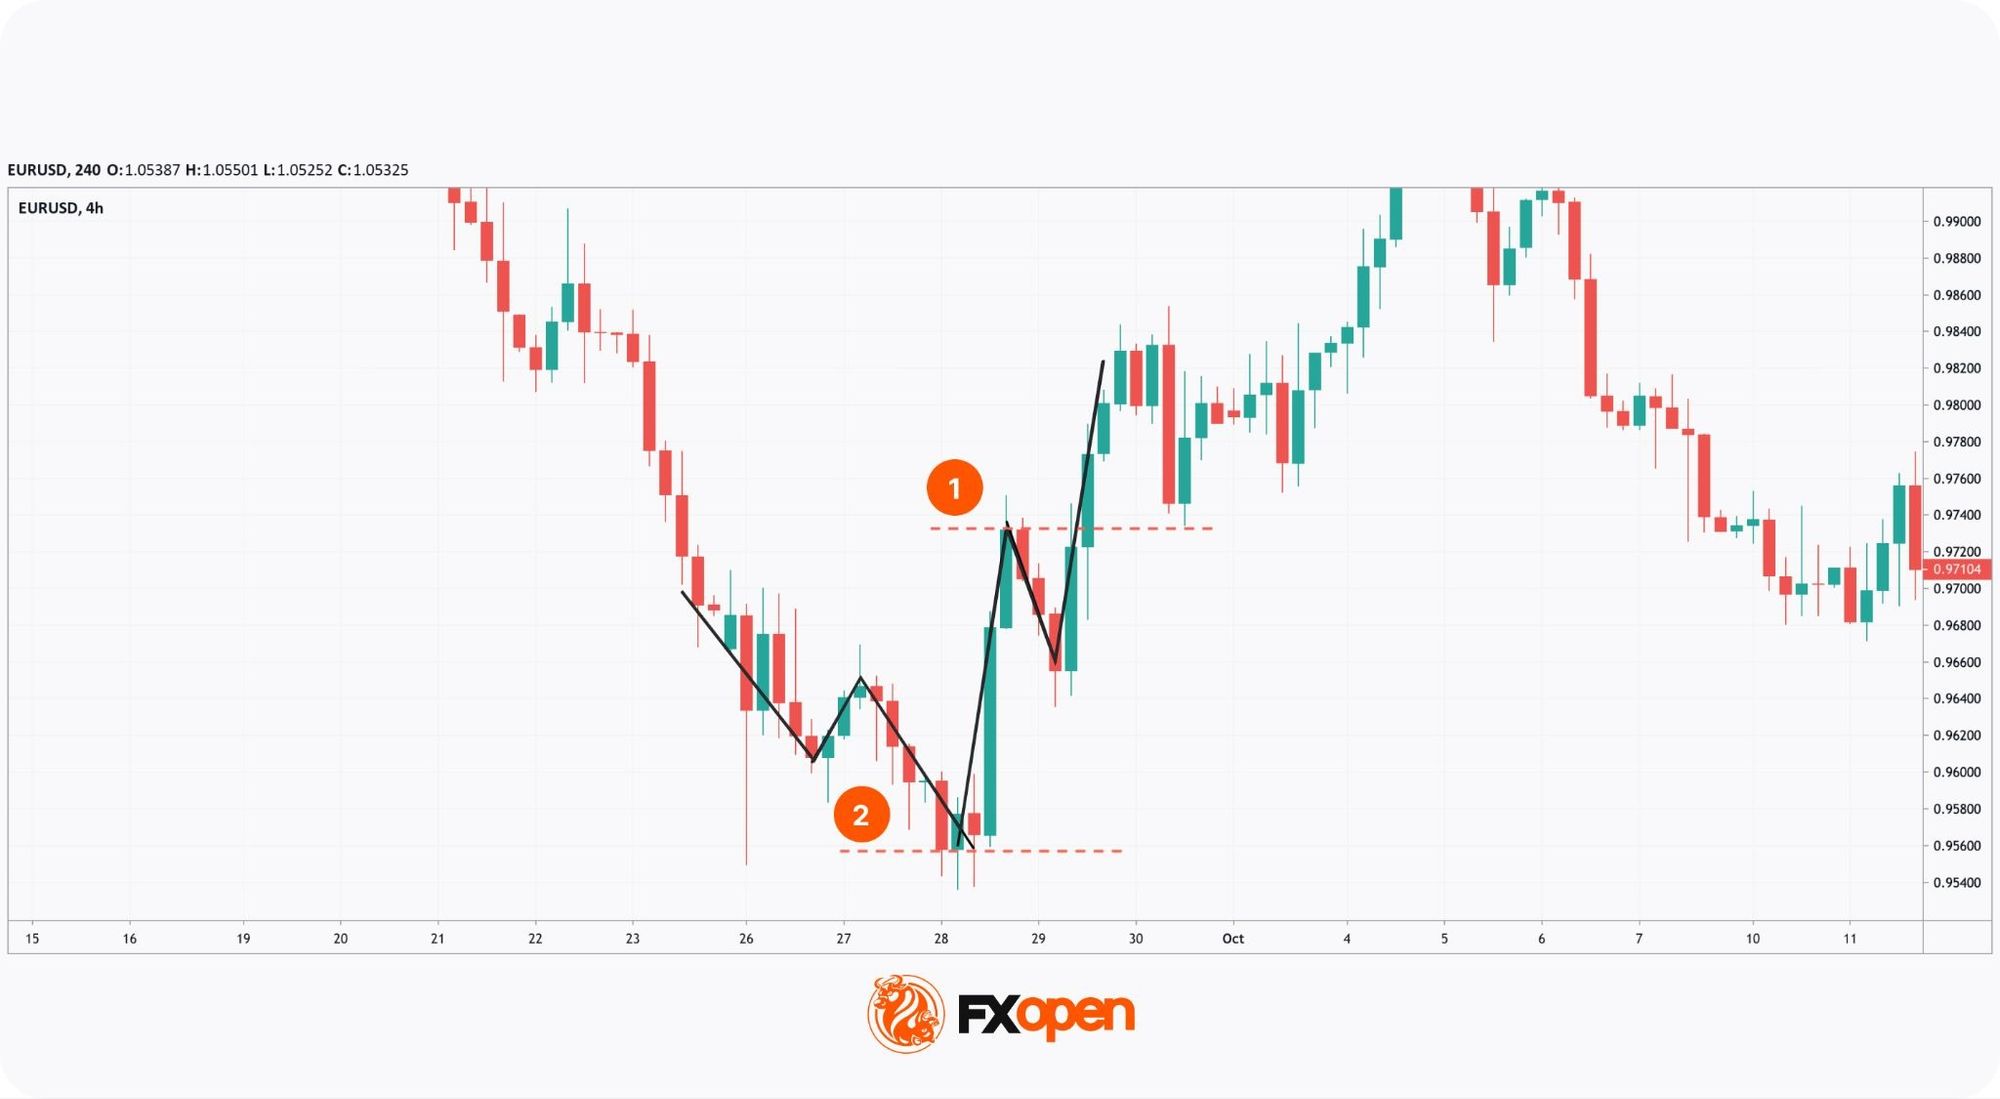
Any theory is always based on perfect conditions, but the actual market often differs. For example, on the chart below, the take-profit target (1) is three times smaller than the stop-loss level (2). In such cases, standard rules don’t work.
In this particular case, we would avoid trading as the risk/reward ratio is negative and potential loss is twice potential profit.
Distorted Quasimodo forex structures often appear in three forms:
- Asymmetric shoulders, where the right shoulder sits far closer to the head than the left, leaving little room for a meaningful take-profit.
- A shallow head break, where price only marginally clears the prior swing before reversing, which weakens the liquidity sweep logic.
- A sloped or skewed neckline, where the troughs (or peaks) sit at very different levels, blurring the pattern boundary.
A setup is often avoided when:
- The risk-to-reward ratio falls below 1:1 after measuring entry to head and entry to the second swing.
- The prior trend is weak or choppy, since the pattern relies on a defined trend to reverse.
- Higher-timeframe structure conflicts with the QM pattern trading direction, such as a bearish QM forming inside a strong daily uptrend.
- Confirmation tools fail to align with the reversal signal.
Quasimodo vs Head and Shoulders
The QM and the Head and Shoulders are reversal patterns. They look similar but still differ and provide different entry/exit points. Take a look at the image below.
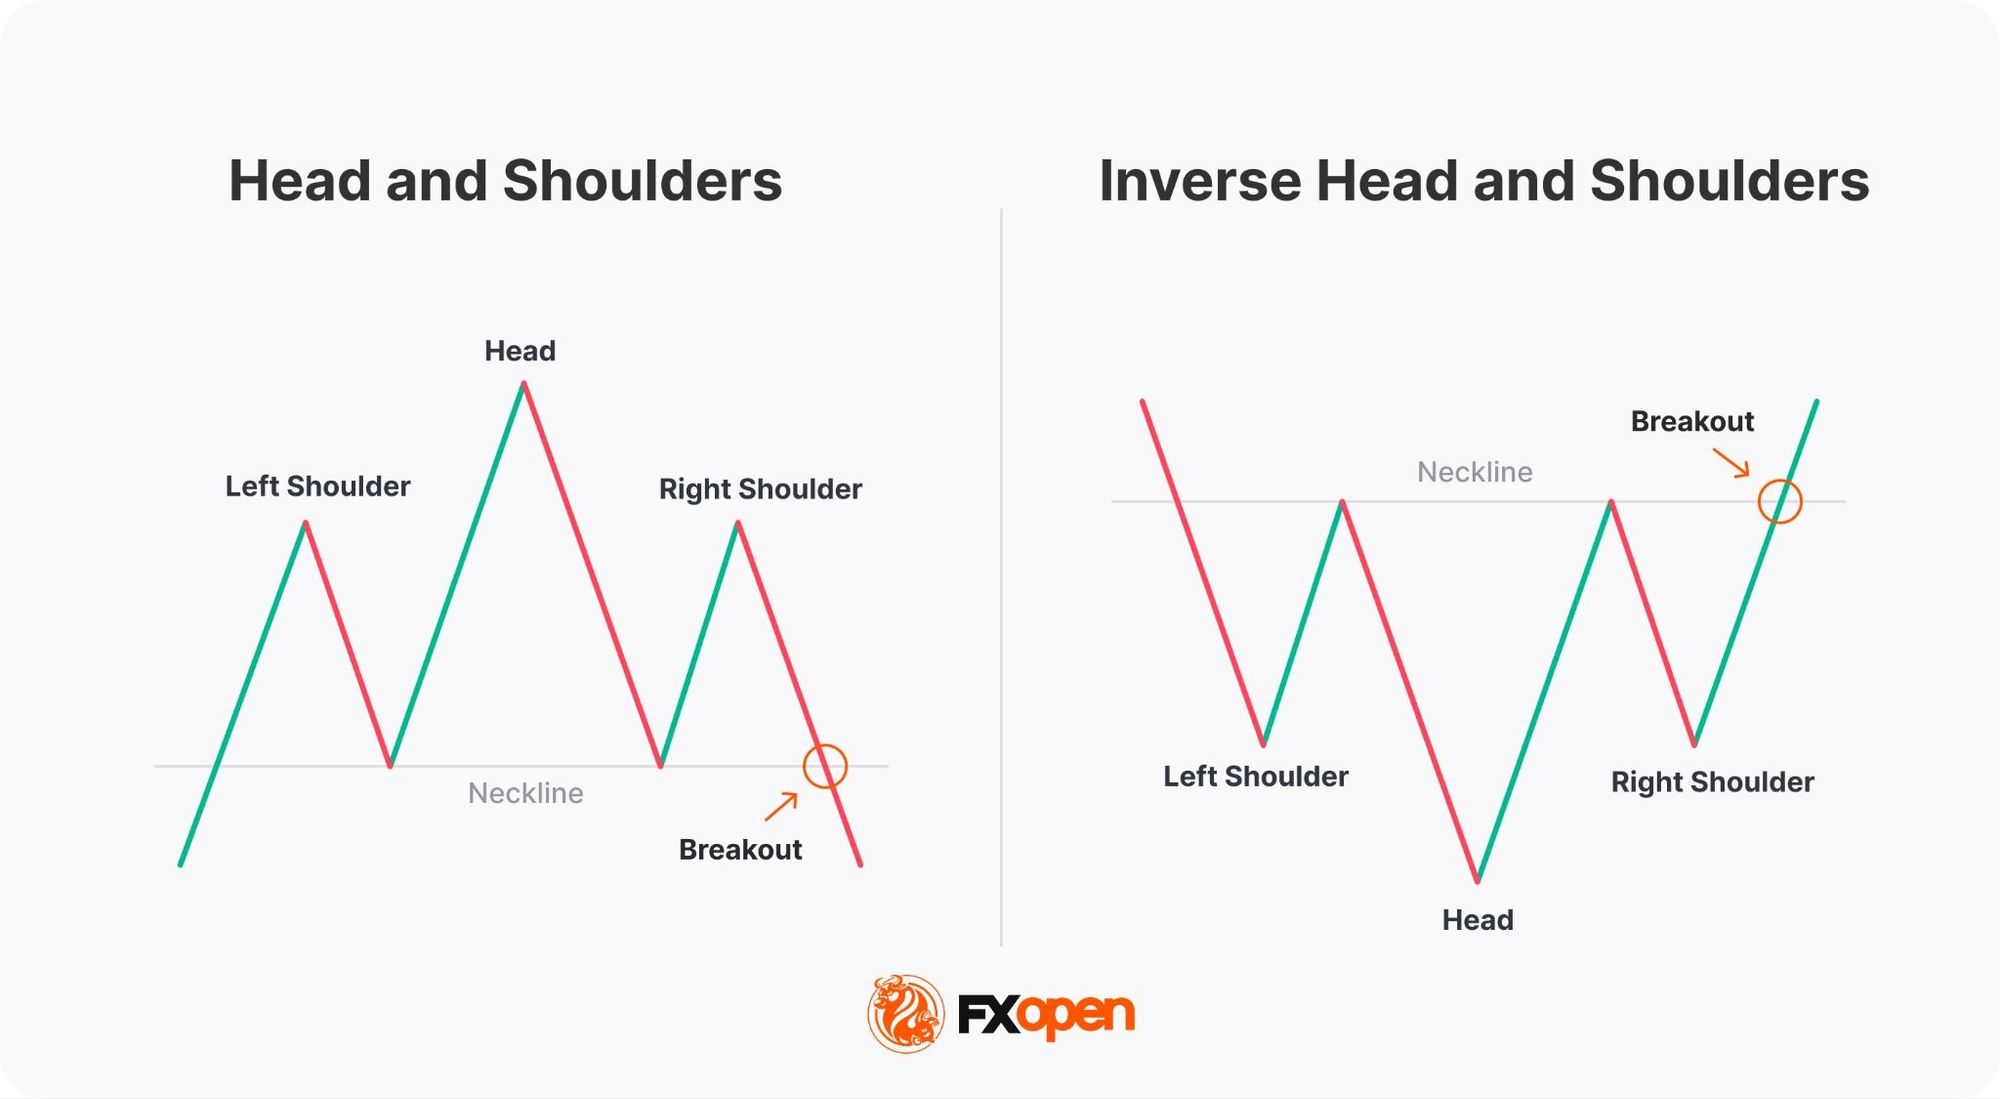
The bearish Head and Shoulders also has three maximums and two minimums, where the second peak (head) is the highest. However, the second trough is at the same level as the first one. This is the difference between the QM and the Head and Shoulders patterns.
The inverse Head and Shoulders consists of three lows and two peaks, where the second trough (head) is the lowest, and the second top is at the same level as the first.
To make it easier, draw a line, a so-called ‘neckline’, through the two troughs in a bearish formation and the two maximums in a bullish one. If the neckline is horizontal, it’s the Head and Shoulders. If it’s angled, it’s the Quasimodo.
The table below highlights the structural and execution differences:
The practical effect of these structural differences:
- When trading the bearish QM pattern, you are supposed to go short on the right shoulder. In the Head and Shoulders, you would wait for the price to break below the neckline after the right shoulder.
- In the inverse QM, you enter the trade at the third trough (right shoulder). But when trading on the inverse head-and-shoulders formation, the common rule is to enter the market not on the second shoulder but after the price breaks above the neckline.
QM Pattern Confirmation Method
Although patterns are reliable technical analysis tools, they must be validated.
Confirmation works in a priority order. Price structure comes first: the head must clearly break the prior swing, and the right shoulder must form below (or above) it. Divergence on RSI or MACD comes second, strengthening the signal where momentum disagrees with price. A moving average crossover near the right shoulder comes third, acting as a trend-bias filter.
Timing matters as much as the signal itself. Confirmation that prints before or at the right shoulder is treated as proactive. A signal that appears only after the right shoulder reverses adds weight but reduces the entry window.
Divergence
RSI and MACD signal a trend reversal in several ways, but the divergence method is the most dependable.
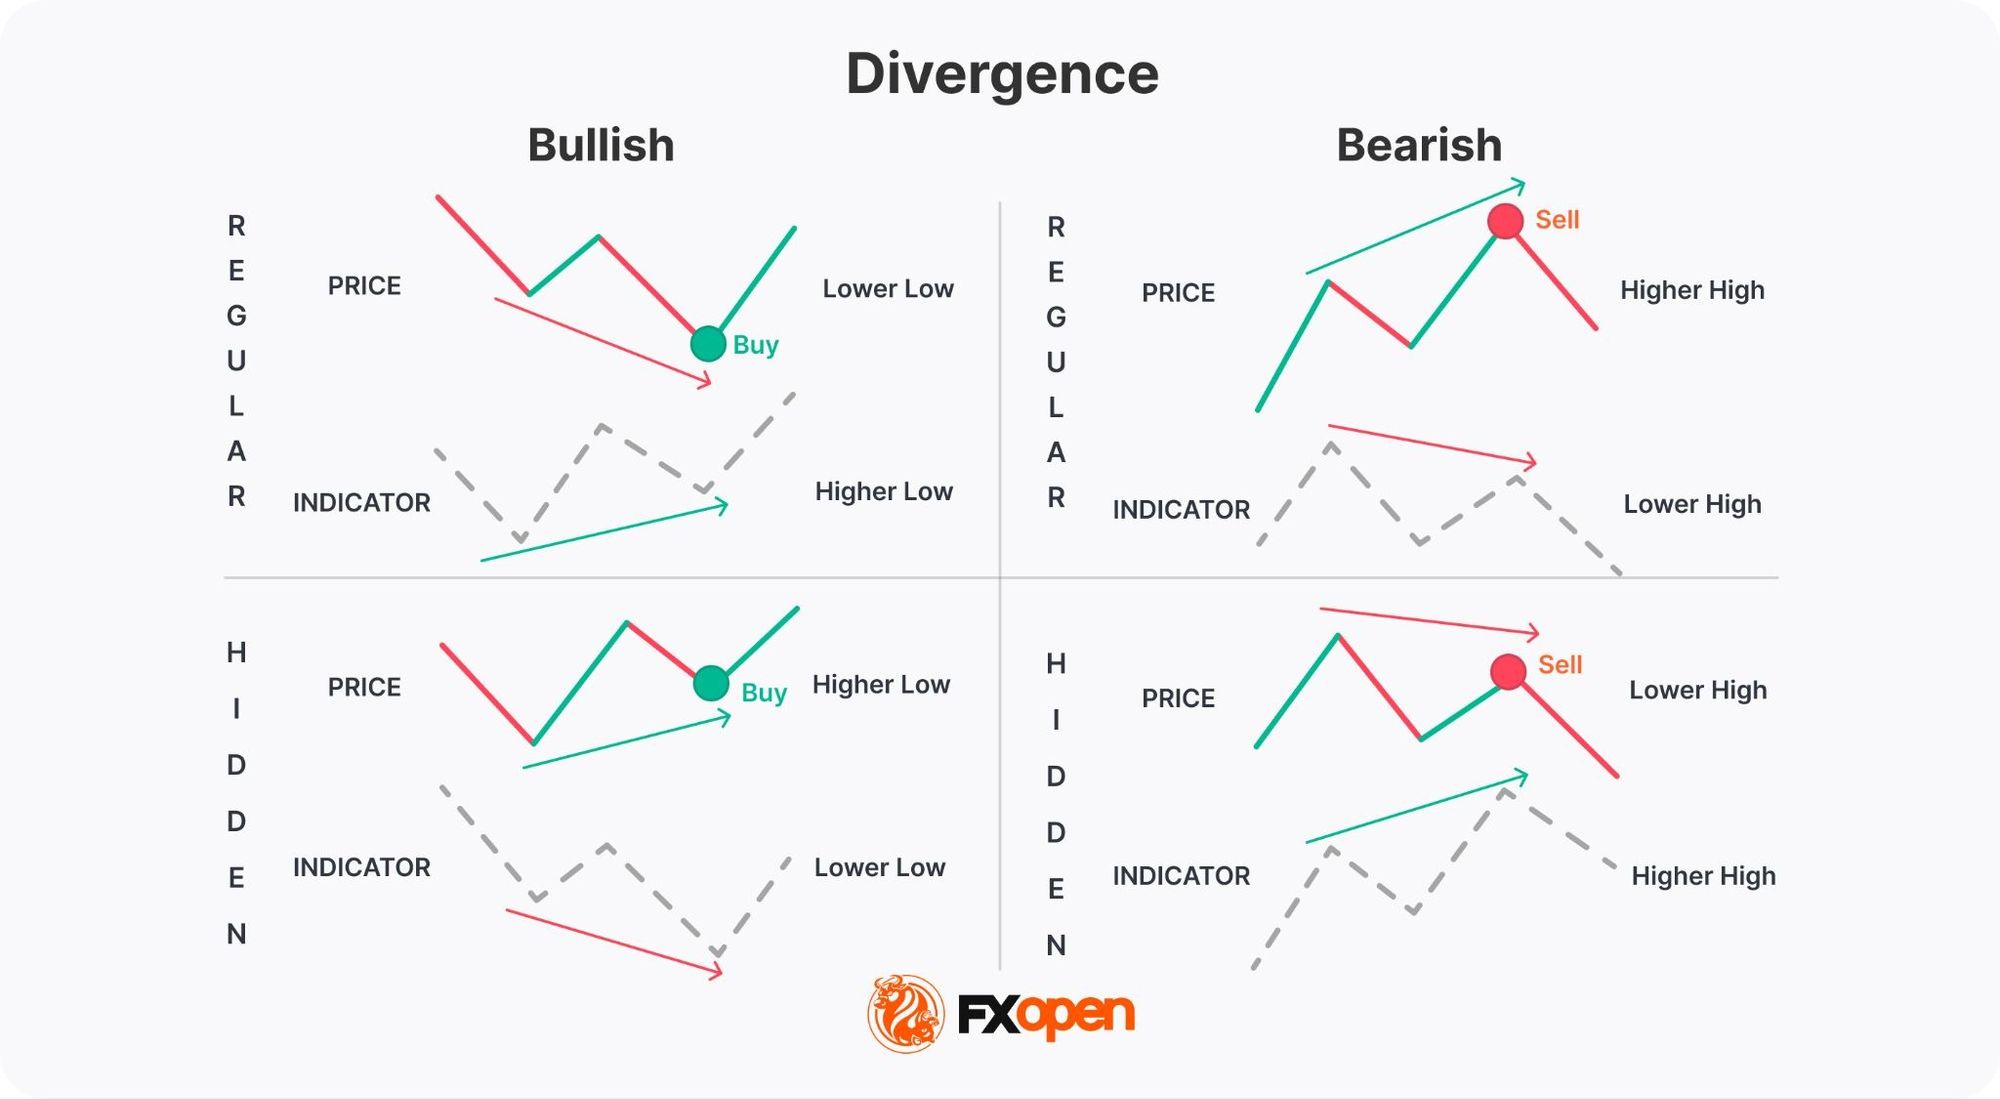
- Regular Bullish Divergence: When the price creates lower lows, but the indicator forms higher lows, it suggests the market might be poised for an upward turn.
- Regular Bearish Divergence: When the price reaches higher highs, but the indicator forms lower highs, it indicates a potential market decline.
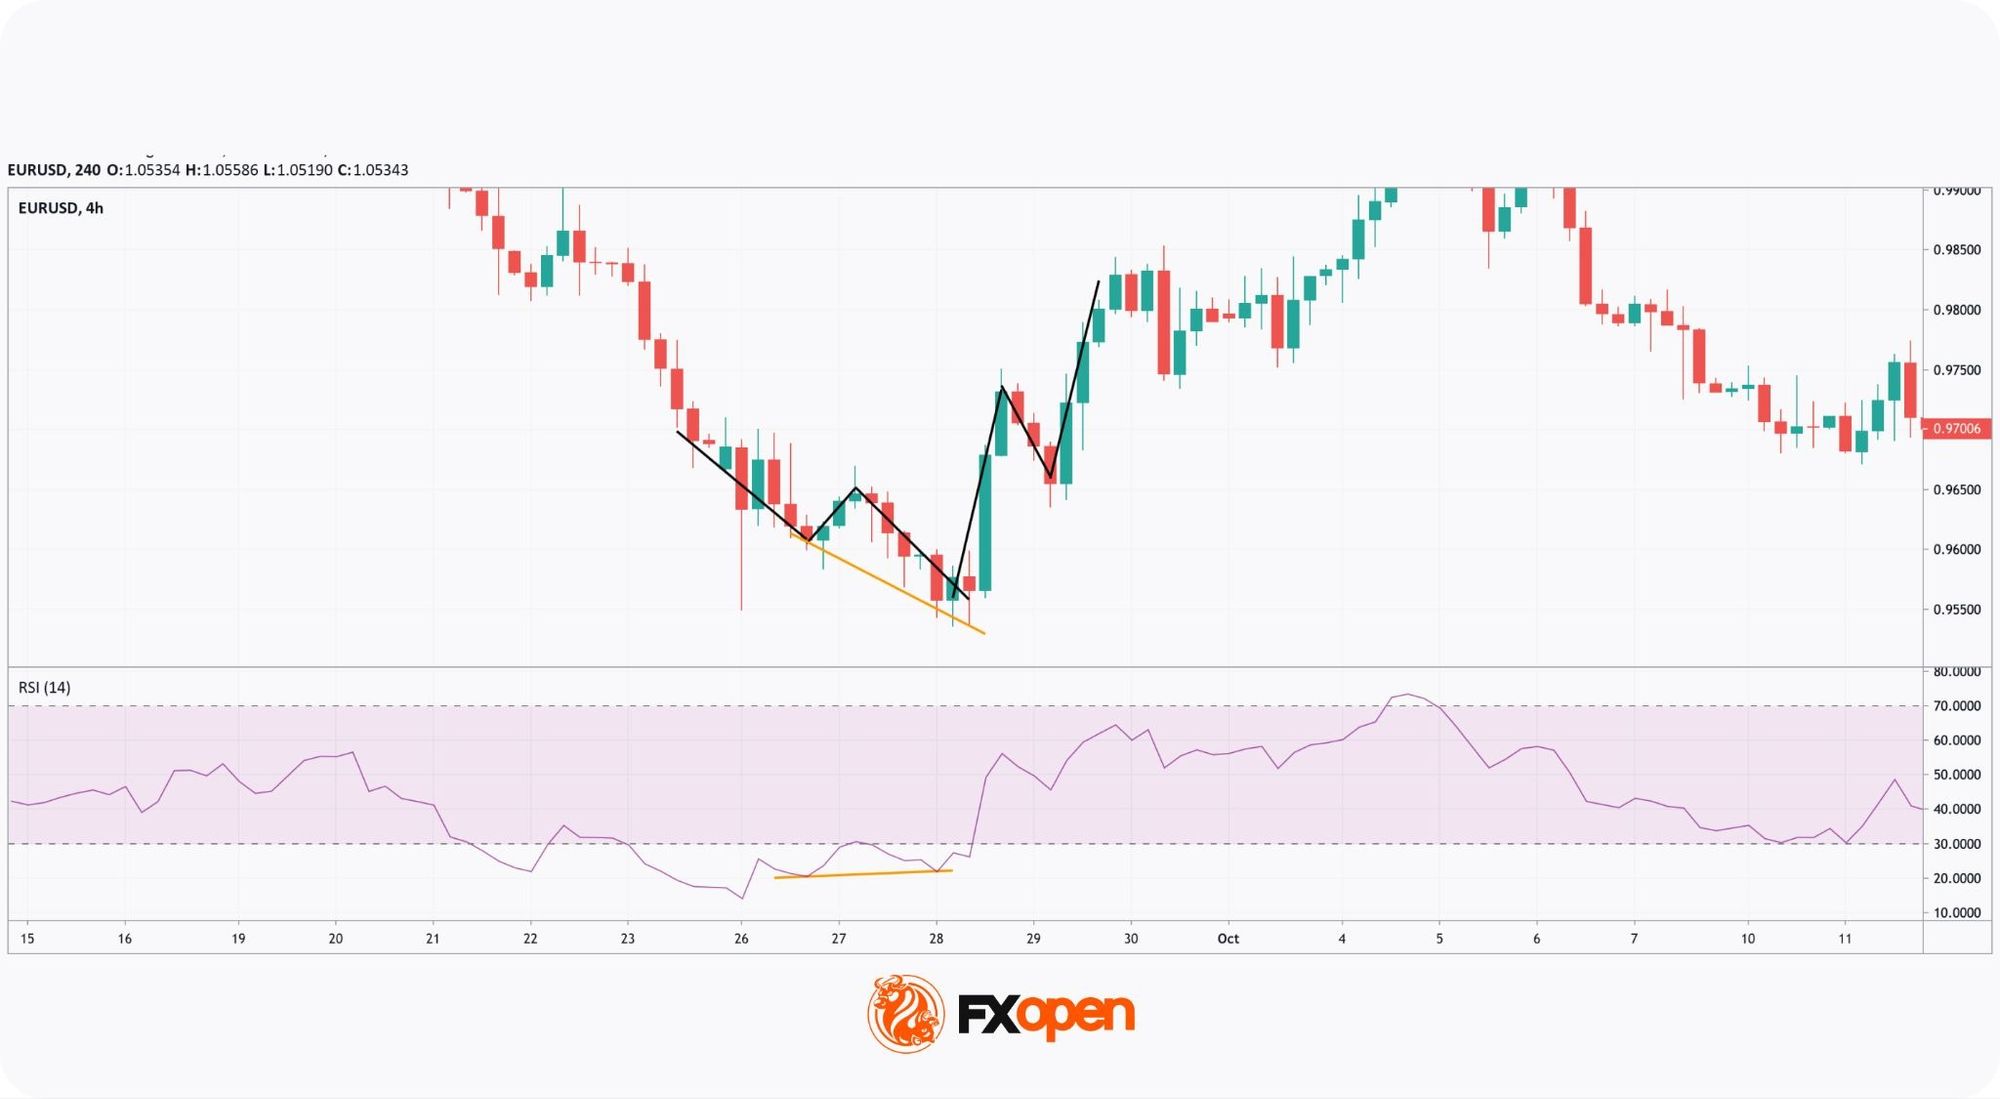
The chart above shows a regular bullish divergence between the price chart and the RSI indicator. As the RSI formed a higher low and left the oversold area, you can anticipate a price reversal. Once the second shoulder of the Quasimodo appears, the market creates conditions for a buy trade.
Divergence strengthens a QM signal when it prints between the head and the right shoulder, on the same timeframe as the pattern. It weakens when:
- The divergence appears on a lower timeframe but is absent on the pattern’s own timeframe.
- The indicator extreme is shallow (e.g., RSI barely leaves overbought or oversold).
- Momentum aligns with the prior trend instead of disagreeing with it.
Moving Averages
A simple moving average is widely used to confirm a trend reversal. You will need two MAs with different periods, depending on the timeframe you trade on. 50-, 100-, and 200-period MAs are typically used on high timeframes, while 9-, 12-, and 21-period MAs are more popular on shorter-term periods.
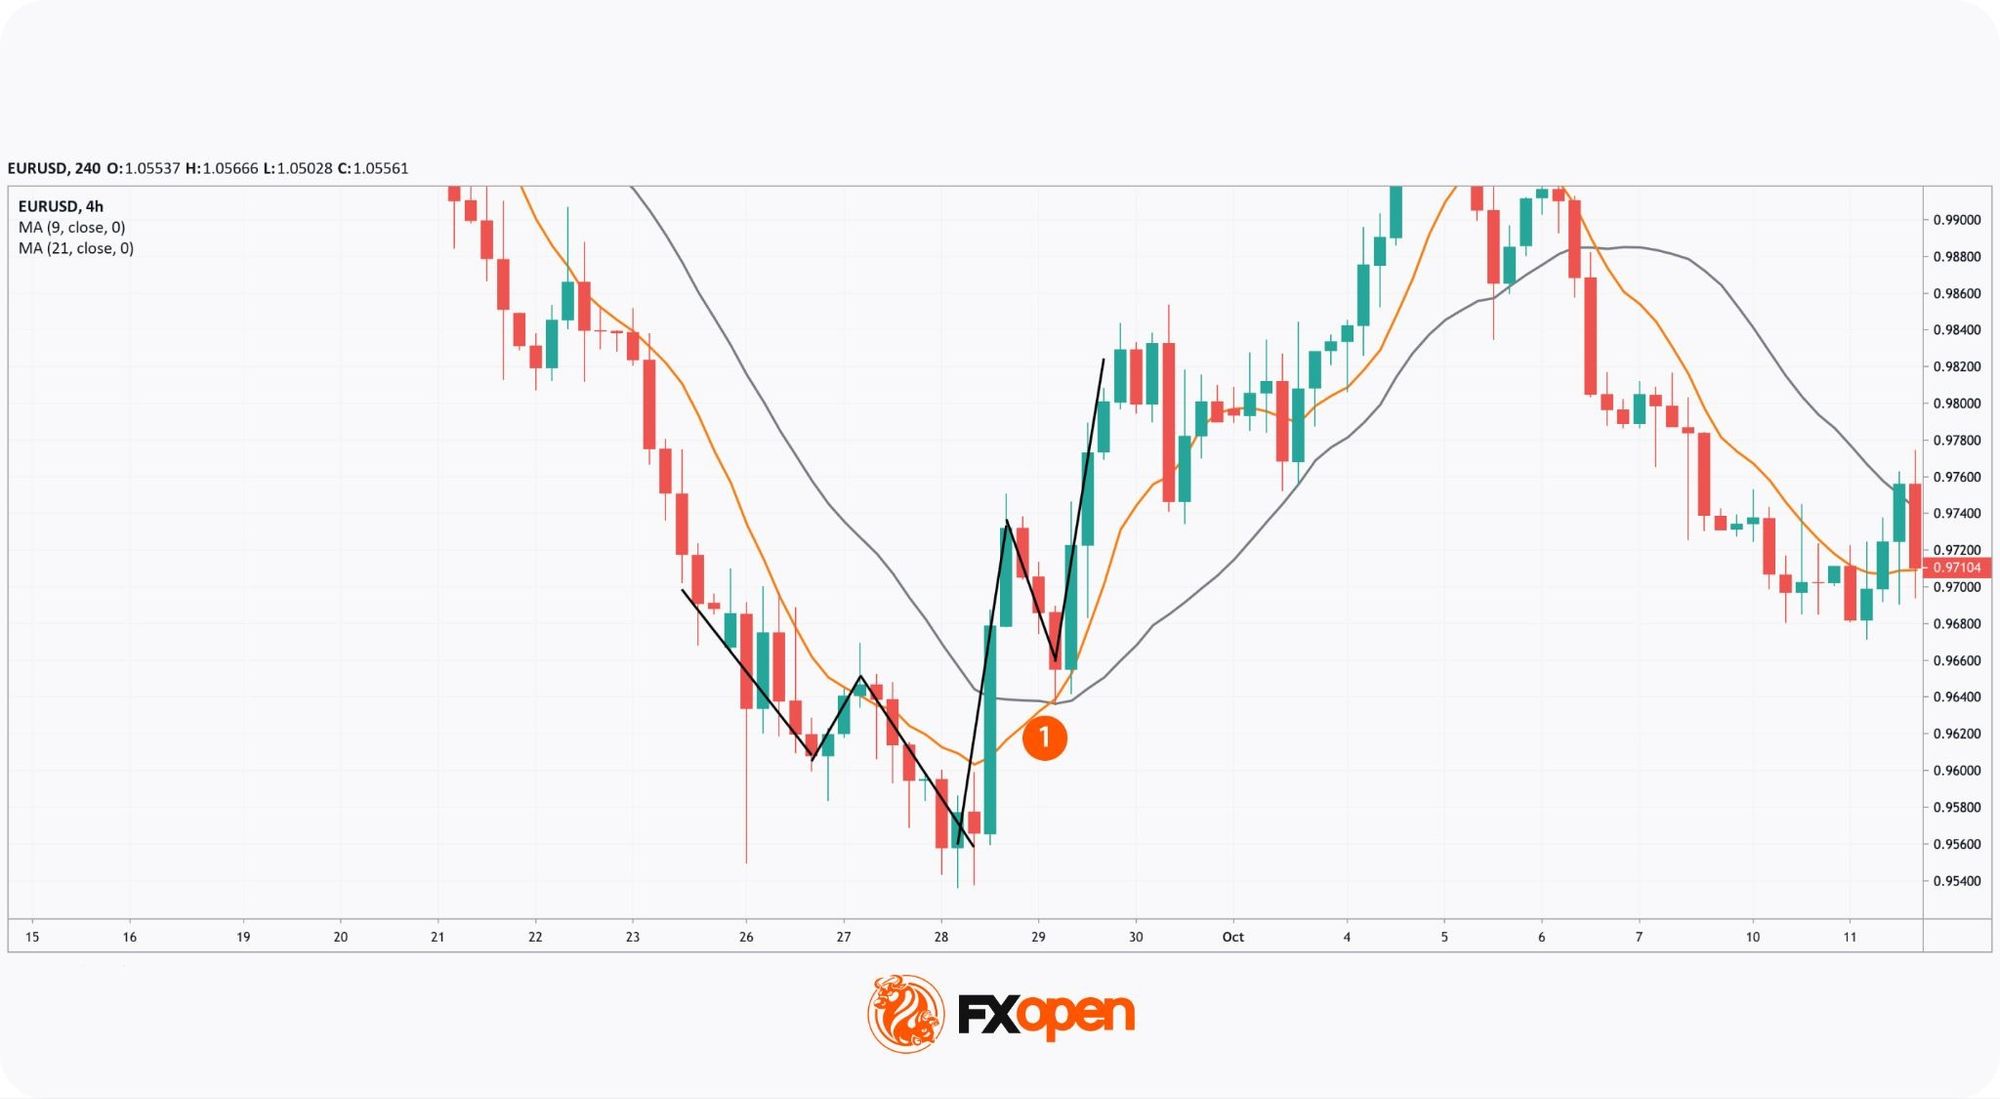
Let’s look at the 4-hour chart of the EUR/USD pair. The price formed an inverse QM. When the second bottom appeared on the chart, a 9-hour MA crossed the 21-hour MA from bottom to top (1). It’s a so-called golden cross that signals an upward movement. As the cross occurred before the price formed the third bottom of the QM, you could open a buy trade at the second shoulder with a strong confirmation.
MA periods should align with the trade’s timeframe. A QM on the 4-hour chart pairs naturally with a 9 and 21 MA, since those react fast enough to confirm the right shoulder. A daily QM calls for 50 and 200 MAs, which filter noise and reflect institutional trend bias.
Using short MAs on a high-timeframe QM produces too many crossovers and weakens the confirmation. Using long MAs on a short-timeframe QM lags the entry and may miss the reversal entirely.
If you want to practice spotting the QM pattern, you may consider using FXOpen’s TickTrader trading platform.
Execution Conditions for QM Pattern
Before executing a Quasimodo trading strategy, traders typically run through a checklist that combines pattern validity, confirmation, and risk control:
Pattern validity:
- The prior trend is clearly defined, not choppy or sideways.
- The head breaks the prior swing decisively, not by a few pips.
- The right shoulder sits below the head (bearish) or above the head (bullish), not at the same level.
Confirmation:
- At least one confirmation tool aligns with the reversal direction — divergence, MA crossover, or a clean reversal candle at the right shoulder.
- Higher-timeframe structure does not contradict the trade direction.
Risk control:
- Stop loss sits just beyond the head, with the distance accepted before entry.
- Risk-to-reward measures at least 1:1, with 1:2 or better preferred, after accounting for the take-profit at the prior swing.
- Position size respects the wider risk management plan, with potentially no more than 1–2% of account capital exposed per trade.
Additional reminders:
- Don’t confuse bearish and bullish formations. A QM is formed at the end of an uptrend, while an inverse QM appears when the downtrend ends.
- Don’t confuse the Quasimodo trading pattern with the Head and Shoulders.
Common Execution Errors
When trading the QM pattern, traders often fall into common mistakes:
- Ignoring confirmation signals: Failing to use additional indicators, momentum indicators, to confirm the pattern can lead to premature or losing trades. Consequence: traders enter at the right shoulder before momentum confirms the reversal, often catching a continuation move against them.
- Overtrading: Trying to trade every Quasimodo pattern without considering the broader market context or trend strength can result in overtrading and losses. Consequence: capital exposure compounds across multiple weak setups, eroding the account even when individual trades look reasonable in isolation.
- Neglecting market conditions: Not accounting for low volatility or trading during choppy market conditions can reduce the pattern’s reliability. Consequence: the QM relies on directional follow-through. In a range, price often returns to the head and triggers the stop-loss before reaching the take-profit.
- Misjudging pattern completeness: Entering trades before the second swing fully forms may result in false signals and unexpected reversals. Consequence: the right shoulder may extend past the head, invalidating the structure mid-trade and forcing an exit at the stop-loss.
- Improper position sizing: Failing to adjust position sizes based on market conditions or pattern strength can lead to excessive risk. Consequence: a single failed QM can wipe out the gains from several successful setups when sizing ignores the stop-loss distance.
Summary
The QM pattern is a reversal structure built on a failed continuation followed by a break of prior swing. Its execution rules tie entries to the right shoulder, stops to the head, and targets to the broken swing.
Confirmation through price structure, divergence, and moving average alignment strengthens the signal but does not replace it. A Quasimodo trading strategy is considered to work when the prior trend is well-defined and risk-to-reward measures at least 1:1.
Traders interested in applying these execution rules can open a trading account at FXOpen to test the QM pattern across forex and CFDs on stocks, indices, and commodities.
FAQ
What Does Quasimodo Mean in Trading?
In trading, the Quasimodo definition refers to a reversal pattern that signals a potential change in the trend direction. It indicates a shift from an uptrend to a downtrend (bearish Quasimodo) or a downtrend to an uptrend (bullish Quasimodo). Traders use it to identify entry and exit points.
What Is the Quasimodo Structure?
The Quasimodo consists of three peaks and two troughs in the bearish pattern and three troughs and two peaks in the bullish pattern. The middle peak or trough (head) is the most prominent, flanked by two smaller shoulders.
How May Traders Use the Quasimodo Pattern?
Traders use the Quasimodo pattern to enter trades at potential reversal points. Typically, they look to sell near the right shoulder in a bearish QM or buy near the right shoulder in a bullish QM. The invalidation level is usually set just beyond the head, while profit targets are placed at the closest swing.
What Is the Quasimodo Pattern in Crypto*?
The QM meaning in crypto* is the same as in other markets. The Quasimodo signals potential trend reversals in digital assets. The reliability of its signals often depends on market conditions and is typically confirmed with indicators like oscillators or those that reflect trends.
What Confirms a Valid Quasimodo Pattern?
Confirmation works in three layers. First, the price structure itself: the head must break the prior swing decisively, and the right shoulder must form below (or above) it. Second, momentum indicators like RSI or MACD showing divergence against price. Third, a moving average crossover that aligns with the reversal direction. A pattern with all three layers carries more weight than one supported by structure alone.
Does the Quasimodo Pattern Work on All Timeframes?
The QM pattern can form on any timeframe, but reliability tends to vary. Higher timeframes (4-hour, daily, weekly) produce fewer setups but with clearer structure and stronger follow-through. Lower timeframes (15-minute, 1-hour) produce more setups but carry more noise, more false breaks at the head, and more shallow shoulders that fail to develop. Most traders apply the pattern on medium-term timeframes.
*Important: At FXOpen UK, Cryptocurrency trading via CFDs is only available to our Professional clients. They are not available for trading by Retail clients. To find out more information about how this may affect you, please get in touch with our team.
This article represents the opinion of the Companies operating under the FXOpen brand only. It is not to be construed as an offer, solicitation, or recommendation with respect to products and services provided by the Companies operating under the FXOpen brand, nor is it to be considered financial advice.


Nigeria’s Senate has advanced a bill that could create formal rules for crypto firms and virtual asset operators.
Summary
- Nigeria’s Senate passed the Virtual Asset Service Providers Regulation Bill, 2026, for second reading.
- The bill would require crypto exchanges and other virtual asset service providers to obtain licenses.
- The proposal now moves to committee review before further readings and possible final approval.
The Virtual Asset Service Providers Regulation Bill, 2026, passed second reading on Tuesday and moved to committee review. The proposal seeks licensing, compliance rules, and consumer protection measures for one of the world’s largest crypto markets.
Nigeria Senate moves crypto bill forward
The Senate advanced the bill, listed as SB 956, after lawmakers debated digital asset oversight. Deputy Senate President Barau Jibrin sponsored it, while Senate Chief Whip Mohammed Monguno presented it. The bill now goes to the Senate Committee on Capital Market for further review.
The committee can examine the proposal, consider amendments, and invite public input. Passing second reading does not make the bill law. It must still pass committee review, third reading, and other required legislative stages.
The proposal seeks a legal and supervisory structure for virtual assets, digital assets, and service providers. It would place crypto exchanges and related operators under licensing requirements. The bill also proposes transparency and compliance rules for firms serving Nigerian users. Lawmakers said these measures would help reduce fraud and improve market order.
Bill targets licensing and global standards
The legislation seeks to align Nigeria’s crypto rules with international standards. Its backers cited frameworks linked to the Financial Action Task Force and International Monetary Fund. The bill would require virtual asset service providers to follow anti-money laundering rules. It would also support counter-terrorism financing controls across crypto operations.
Under the proposal, operators of exchanges and blockchain-based investment platforms would need licenses. Other digital asset service providers would also face regulatory standards Lawmakers said the current regulatory gap leaves major activity outside official oversight. They argued that investments, jobs, and revenue remain harder to track without clear rules.
Senate Whip Tahir Monguno said Nigeria trails some African peers on virtual asset laws. He pointed to Kenya, South Africa, and Ghana as countries developing related frameworks. The sponsor said the bill does not seek to block innovation. He framed it as a way to promote order, confidence, accountability, and consumer protection.
Crypto market awaits committee review
Nigeria remains one of the world’s most active crypto markets by adoption. Users rely on digital assets for remittances, cross-border payments, inflation hedging, and global financial access. The country’s crypto policy has changed over time. Banks once faced restrictions on servicing crypto firms, but regulators later moved toward structured oversight.
Recent efforts have included registration pathways for digital asset providers. The new bill seeks to combine scattered rules into a clearer legal framework. Lawmakers linked the proposal to President Bola Tinubu’s $1 trillion economy target. They argued that unregulated crypto activity limits the digital economy’s official contribution.
If passed, the bill would increase compliance duties for exchanges and other operators. However, supporters said clear rules could help legitimate firms attract investment. The next stage will determine the bill’s final shape. Its impact will depend on committee changes, licensing details, and final implementation rules.


Iran’s main military command has closed the Strait of Hormuz to all vessels after fresh US attacks.
Summary
- Iran’s Khatam al-Anbiya command said the Strait of Hormuz is closed to all vessels until further notice.
- Iranian media reported that Revolutionary Guards forces hit two ships attempting to pass through the waterway.
- US Central Command said it launched fresh strikes on Iran as Qatar sent a delegation to discuss the war.
Iran Iranian media said Khatam al-Anbiya Central Headquarters cited security threats in the waterway. The move came as talks to end the conflict faced new pressure.
Iran warns ships against Hormuz passage
Tasnim News Agency reported that Iran’s military command declared the strait “completely closed to all types of vessels.” The command said “any vessel traffic through the Strait of Hormuz will be targeted.”
Iran’s Revolutionary Guards navy said two ships tried to pass through the waterway. State television IRIB and the Mehr agency reported that Iranian forces hit both vessels. The Guards said the ships attempted to “illegally pass through the Strait of Hormuz.” They also warned ships against leaving anchorages in the Persian Gulf and Sea of Oman.
“Approaching the Strait of Hormuz will be considered cooperation with the enemy,” the Guards said. The warning followed earlier claims of US attacks near Iran’s southern coast. Iranian media also reported explosions near Bandar Abbas, Qeshm, Minab, and Sirik. Iranian sources said “enemy projectiles” hit Qeshm, Kargan, and Sirik.
US launches new strikes in Iran
US Central Command said it launched strikes against multiple Iranian targets on June 10. The command described them as “additional self-defence strikes.” CENTCOM said the strikes began at 5.15pm New York time. It added that the action answered Iran’s “unwarranted and continued aggression.”
As it was reported by crypto.news, the new attacks followed US strikes on June 9 after Iran downed a US Apache helicopter. Iranian media said those earlier strikes hit air defence, radar, and other sites. President Donald Trump accused Iran of delaying talks on an interim peace deal. He told reporters that US forces would “hit them hard” before the strikes began.
“We hit them hard yesterday, and we’re going to hit them hard again today,” Trump said. He declined to name the targets before the military announcement. Iran’s Foreign Ministry accused the United States of striking civilian infrastructure. US Defense Secretary Pete Hegseth said the strikes sought to push Iran toward a deal.
Talks continue as the Qatar delegation arrives
A White House official said negotiations continued, even as Washington increased military pressure. The official said the US would maintain pressure until both sides reach a deal. Trump later said the US military supported the passage of more than 200 commercial ships. He said those movements carried more than 100 million barrels of oil to market.
Trump also claimed the United States controls the Strait of Hormuz, “not Iran.” Tehran’s latest statement directly challenged that claim through its closure order. The semi-official Iranian Students’ News Agency reported that a Qatari delegation reached Tehran on June 10. The delegation planned to discuss the diplomatic process to end the war.
The closure announcement followed claims of repeated ceasefire violations by the “American enemy.” Iran said the Strait of Hormuz will stay closed until further notice. The waterway remains central to oil and commercial shipping between the Persian Gulf and global markets. Iranian media reported the closure after explosions across southern Iran near the strait.


Mastercard extended its payments network to autonomous AI agents on Wednesday, unveiling Agent Pay for Machines (AP4M) with more than 30 launch partners spanning crypto infrastructure, stablecoin issuers, payment processors and DeFi protocols. The company announced the launch Wednesday morning via… Read the full story at The Defiant
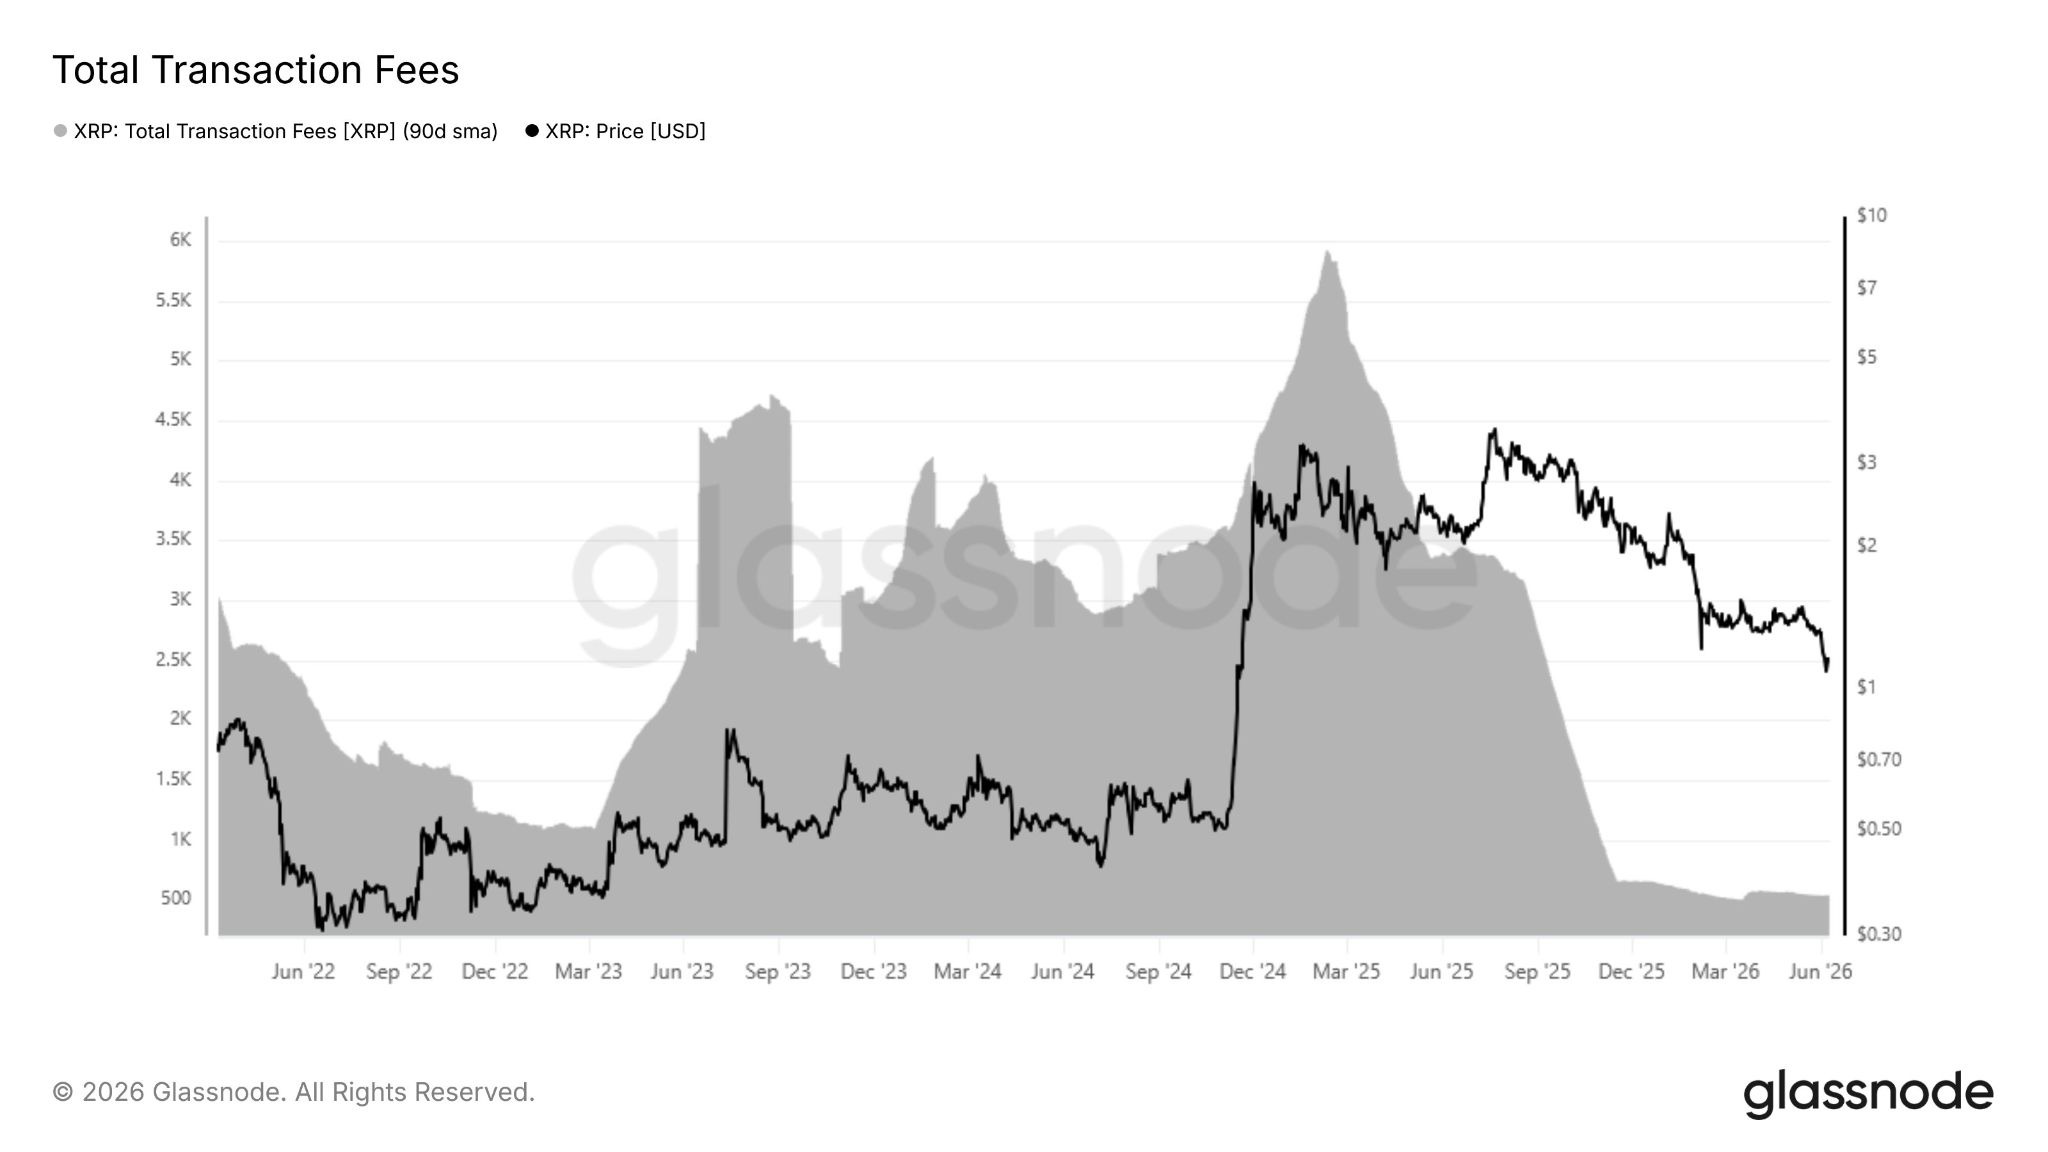
XRP’s (XRP) onchain activity has contracted sharply since its 2025 peak. The 90-day network fee average fell by 91.5%, while the realized profit-to-loss ratio dropped to 0.38 from 50, according to Glassnode.
The decline in activity and profitability comes as traders identify the $1.00-$0.65 region as a major area of interest.
XRP profit-taking flips to network capitulation
According to Glassnode, the 90-day simple moving average of total fees paid on the XRP network has fallen to just 500 XRP from 5,900 XRP in February, a decline of 91.5%.
The network fees are often used as a proxy for transaction demand. The drop points to a sharp slowdown in activity following the speculative surge that carried XRP above $3 in the first half of 2025.
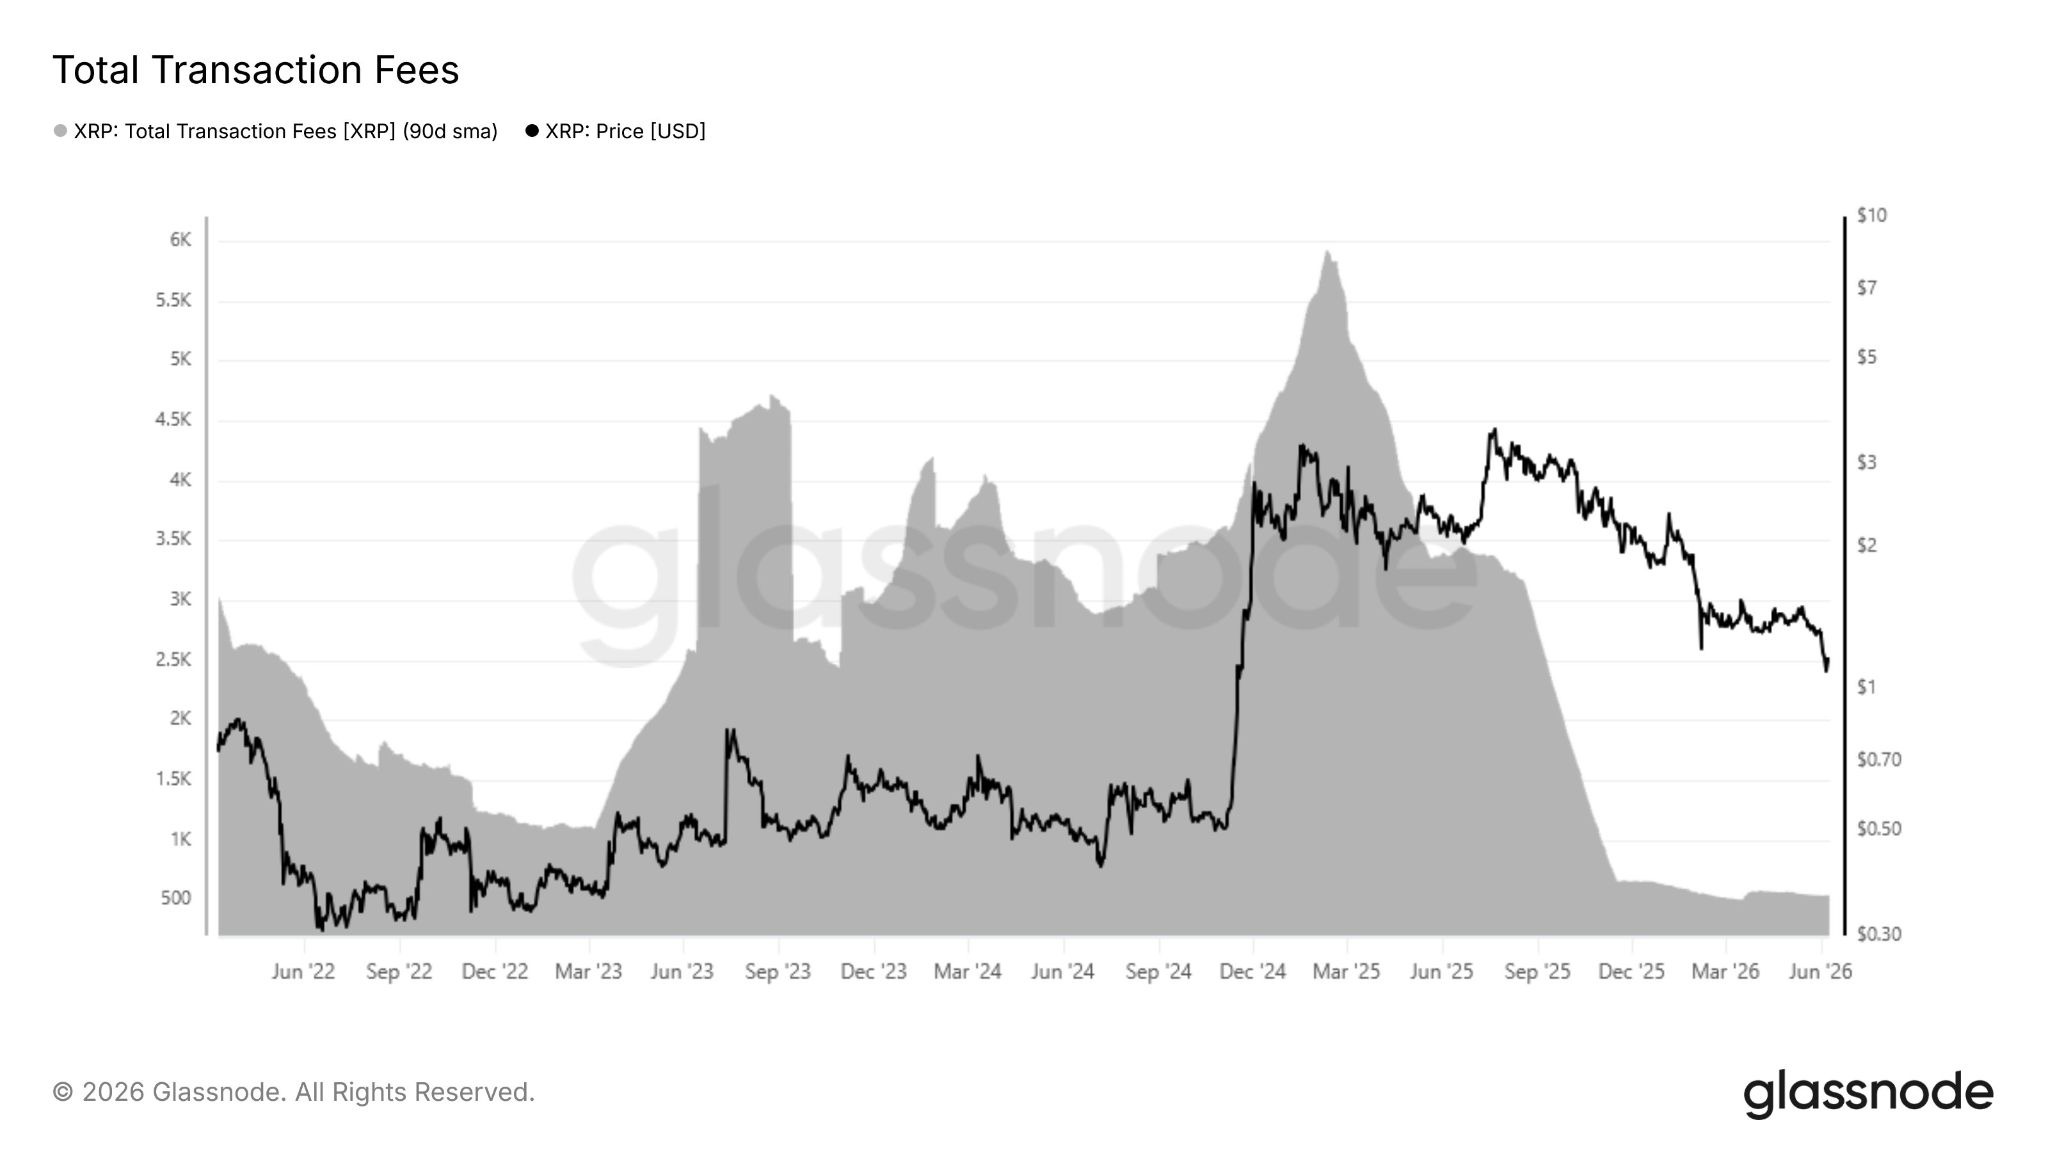
XRP total transaction fees. Source: Glassnode
XRP investor behavior has also shifted. Glassnode reported that XRP’s 90-day realized profit-to-loss ratio has fallen to 0.38, meaning market participants are realizing $1 in losses for every $0.38 in profits.
In January and July 2025, when the XRP price peaked near $3.40, the ratio reached 50 as profit-taking dominated the onchain flows. That balance has now reversed. This indicates that a larger share of onchain coins are being sold below their acquisition cost, a pattern commonly seen during capitulation phases.
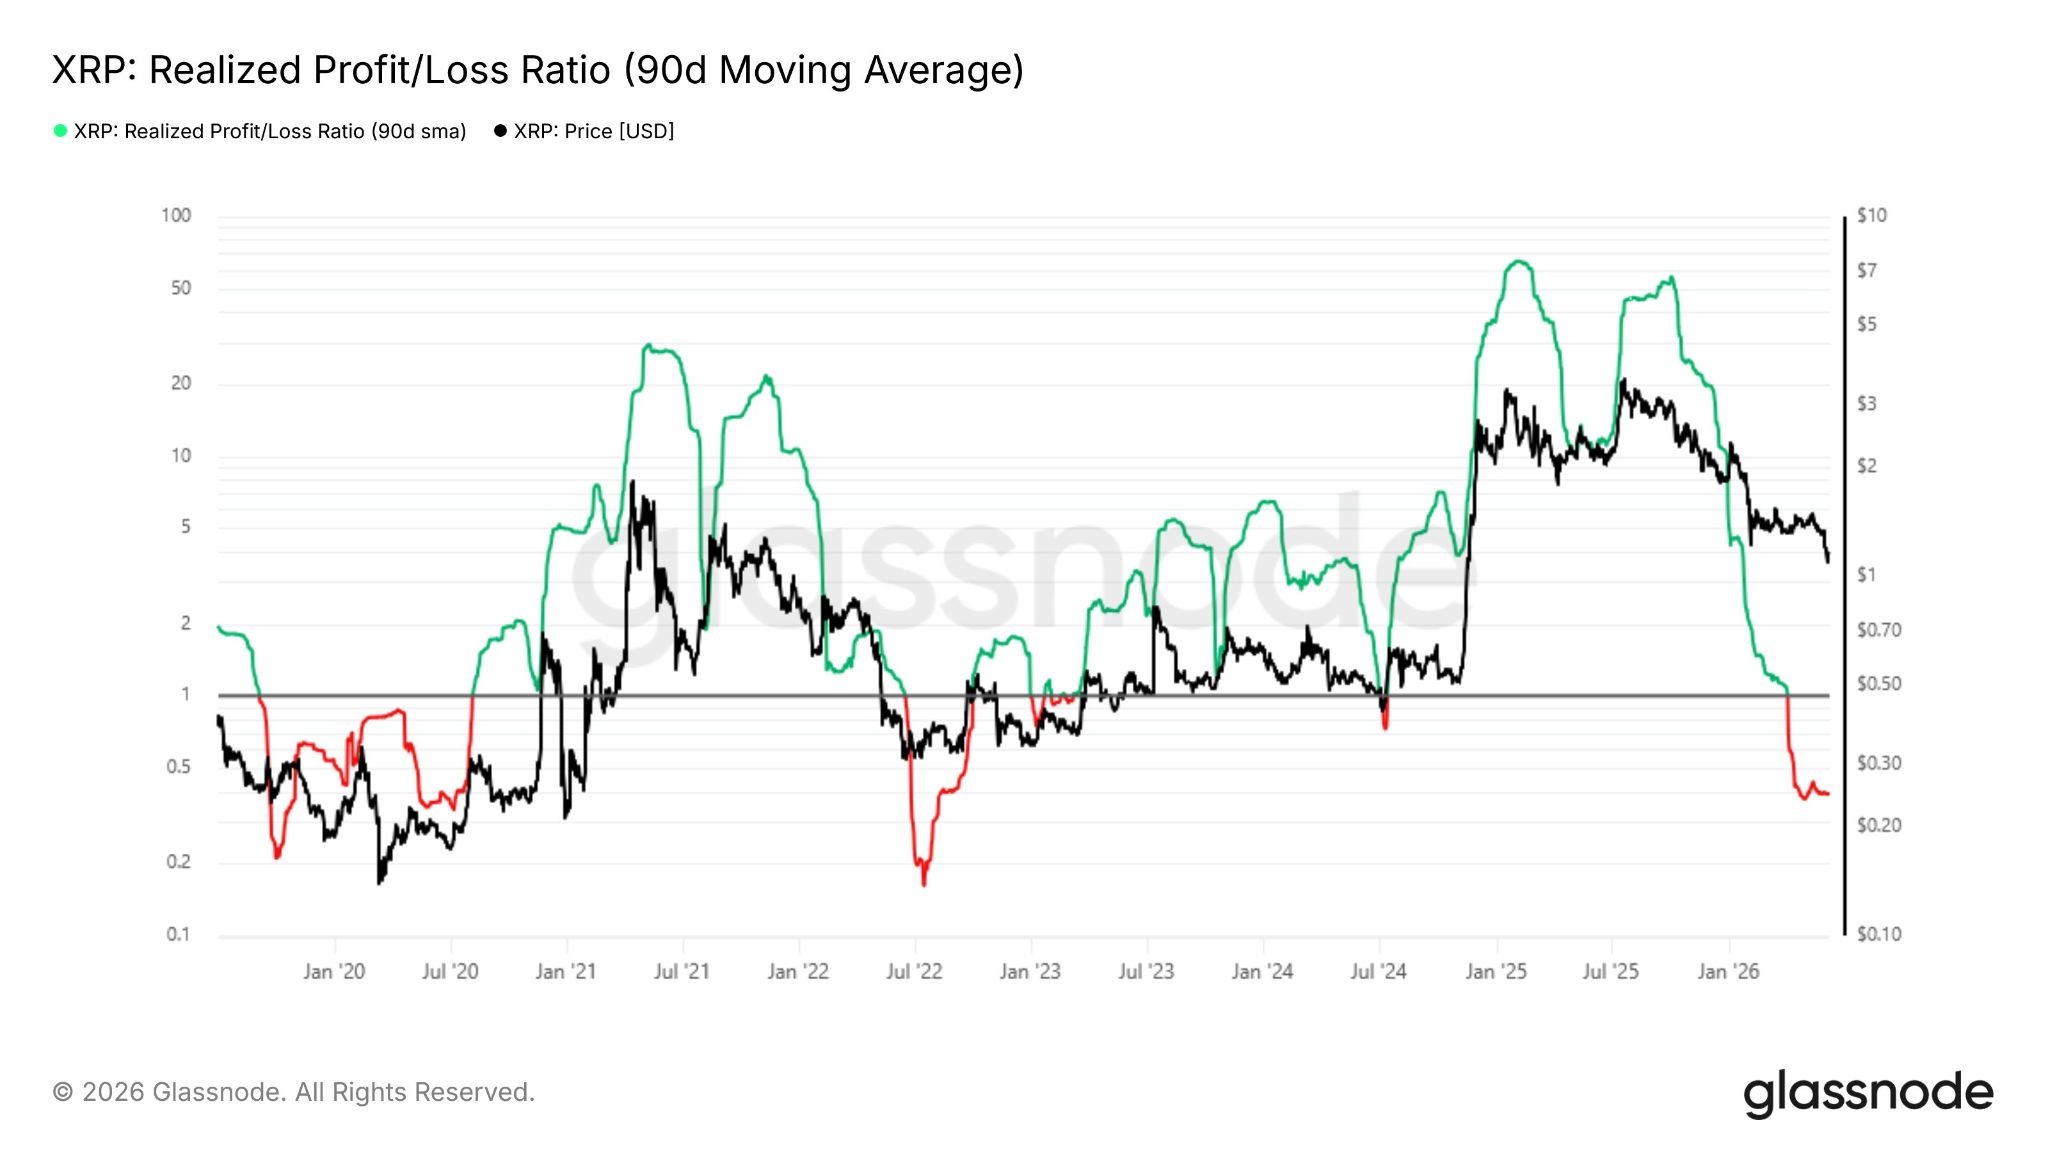
XRP realized profit/loss ratio. Source: Glassnode
Exchange data offers a different view of holder activity. Crypto analyst Pelin Ay noted that transfers of more than 1 million XRP to Binance have declined since XRP’s 2025 peak.
Historically, major corrections were preceded by sharp increases in both the 100,000–1 million XRP and 1 million-plus XRP inflow cohorts as large holders moved tokens to exchanges.
The current data shows a sustained decline in exchange-bound XRP from large holders, with inflows from the 100,000–1 million XRP and 1 million-plus XRP cohorts decreasing by 15% and 20%, respectively, since October 2025.
The analyst said the latest price weakness appears more closely tied to leverage-driven liquidations and risk-off sentiment than aggressive distribution by large holders.
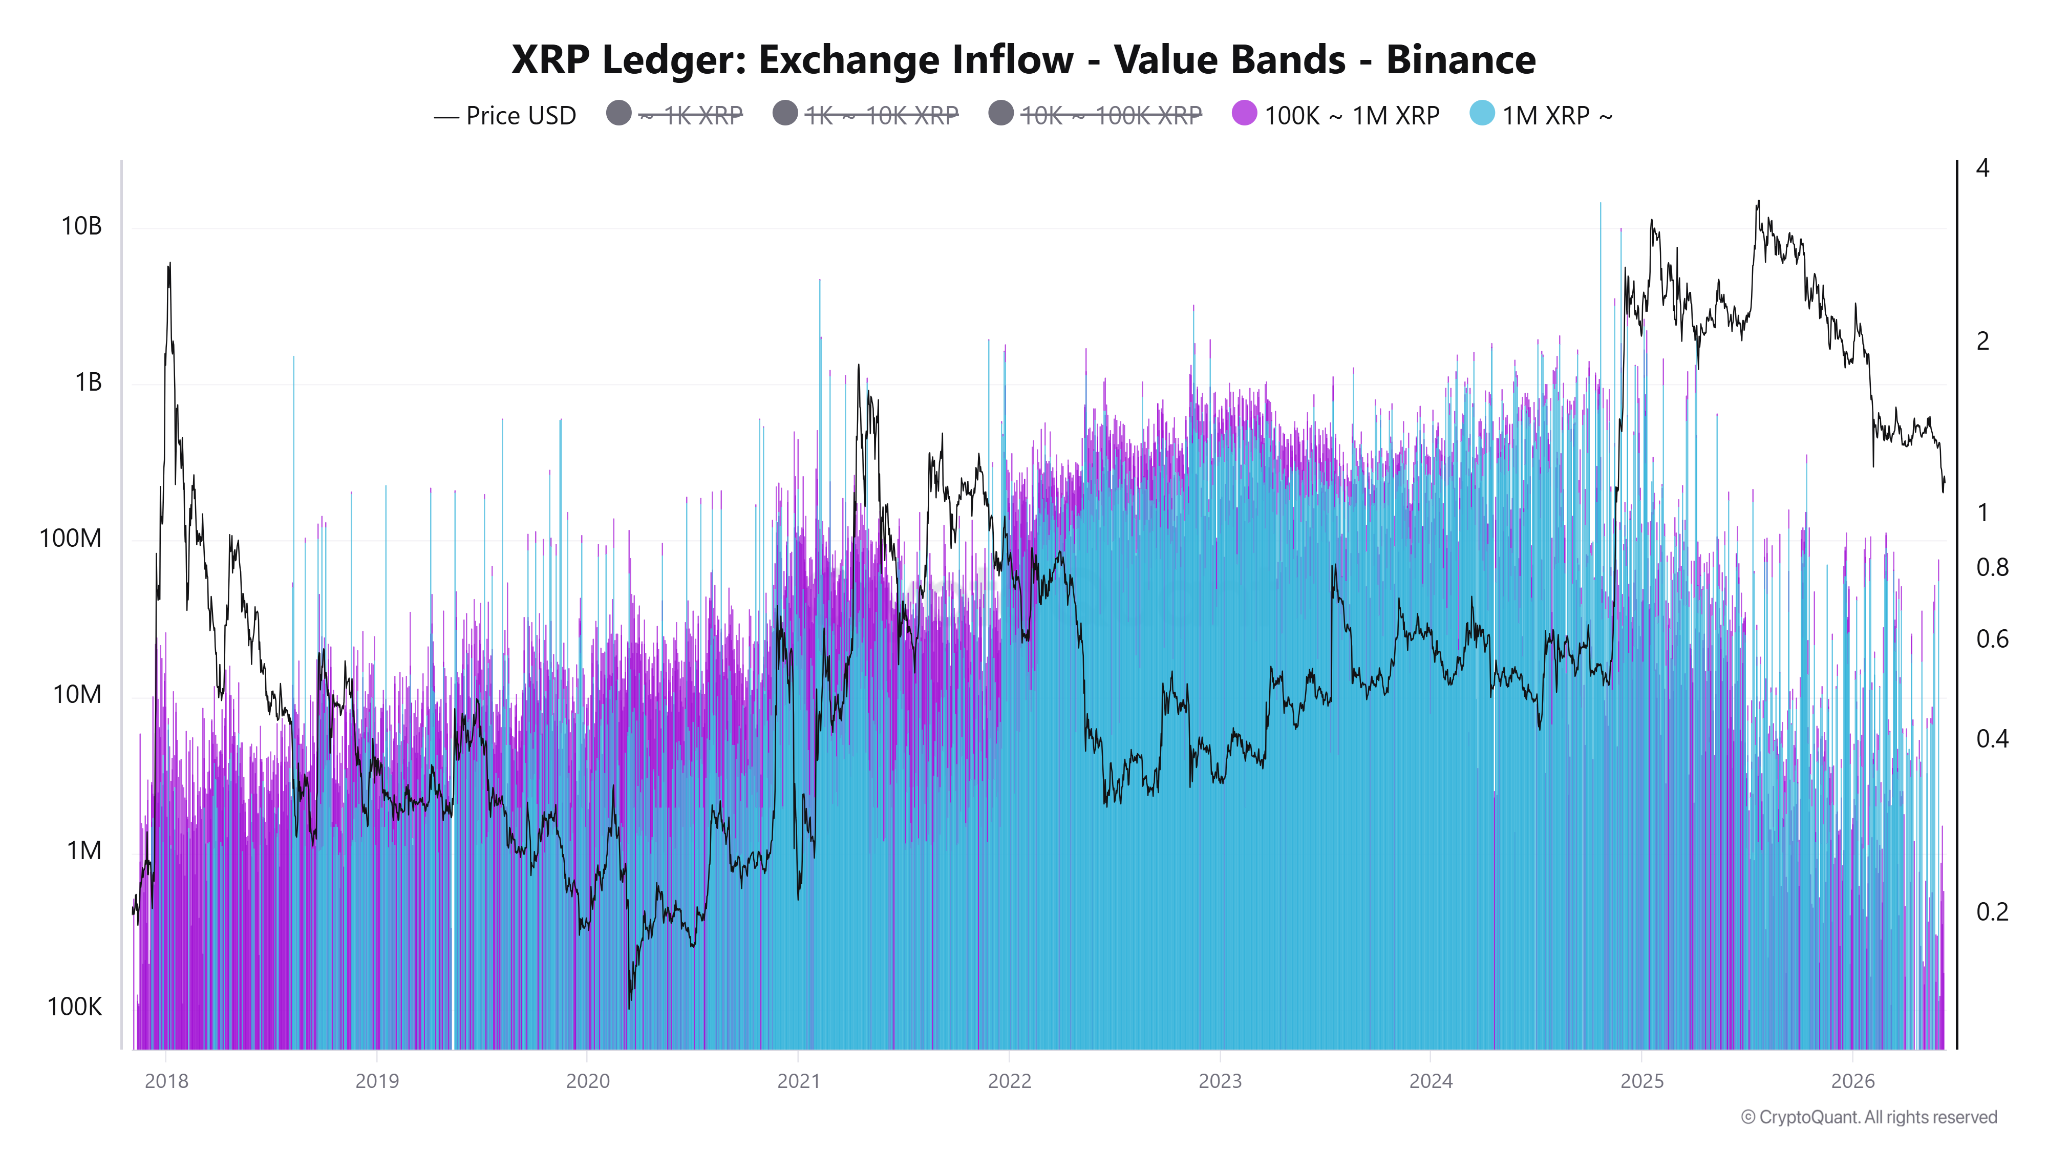
XRP exchange inflows value bands on Binance. Source: CryptoQuant
Related: Arthur Hayes dumps WLD days after Maelstrom’s AI IPO pitch
$0.63 is the key area for accumulation
XRP’s weekly chart highlights a cluster of technical levels between $1.00 and $0.65.
A large fair value gap spans roughly $0.63 to $1.00, created during XRP’s rapid rally in late 2024. The price has already started moving back toward that zone after losing support near $1.40.
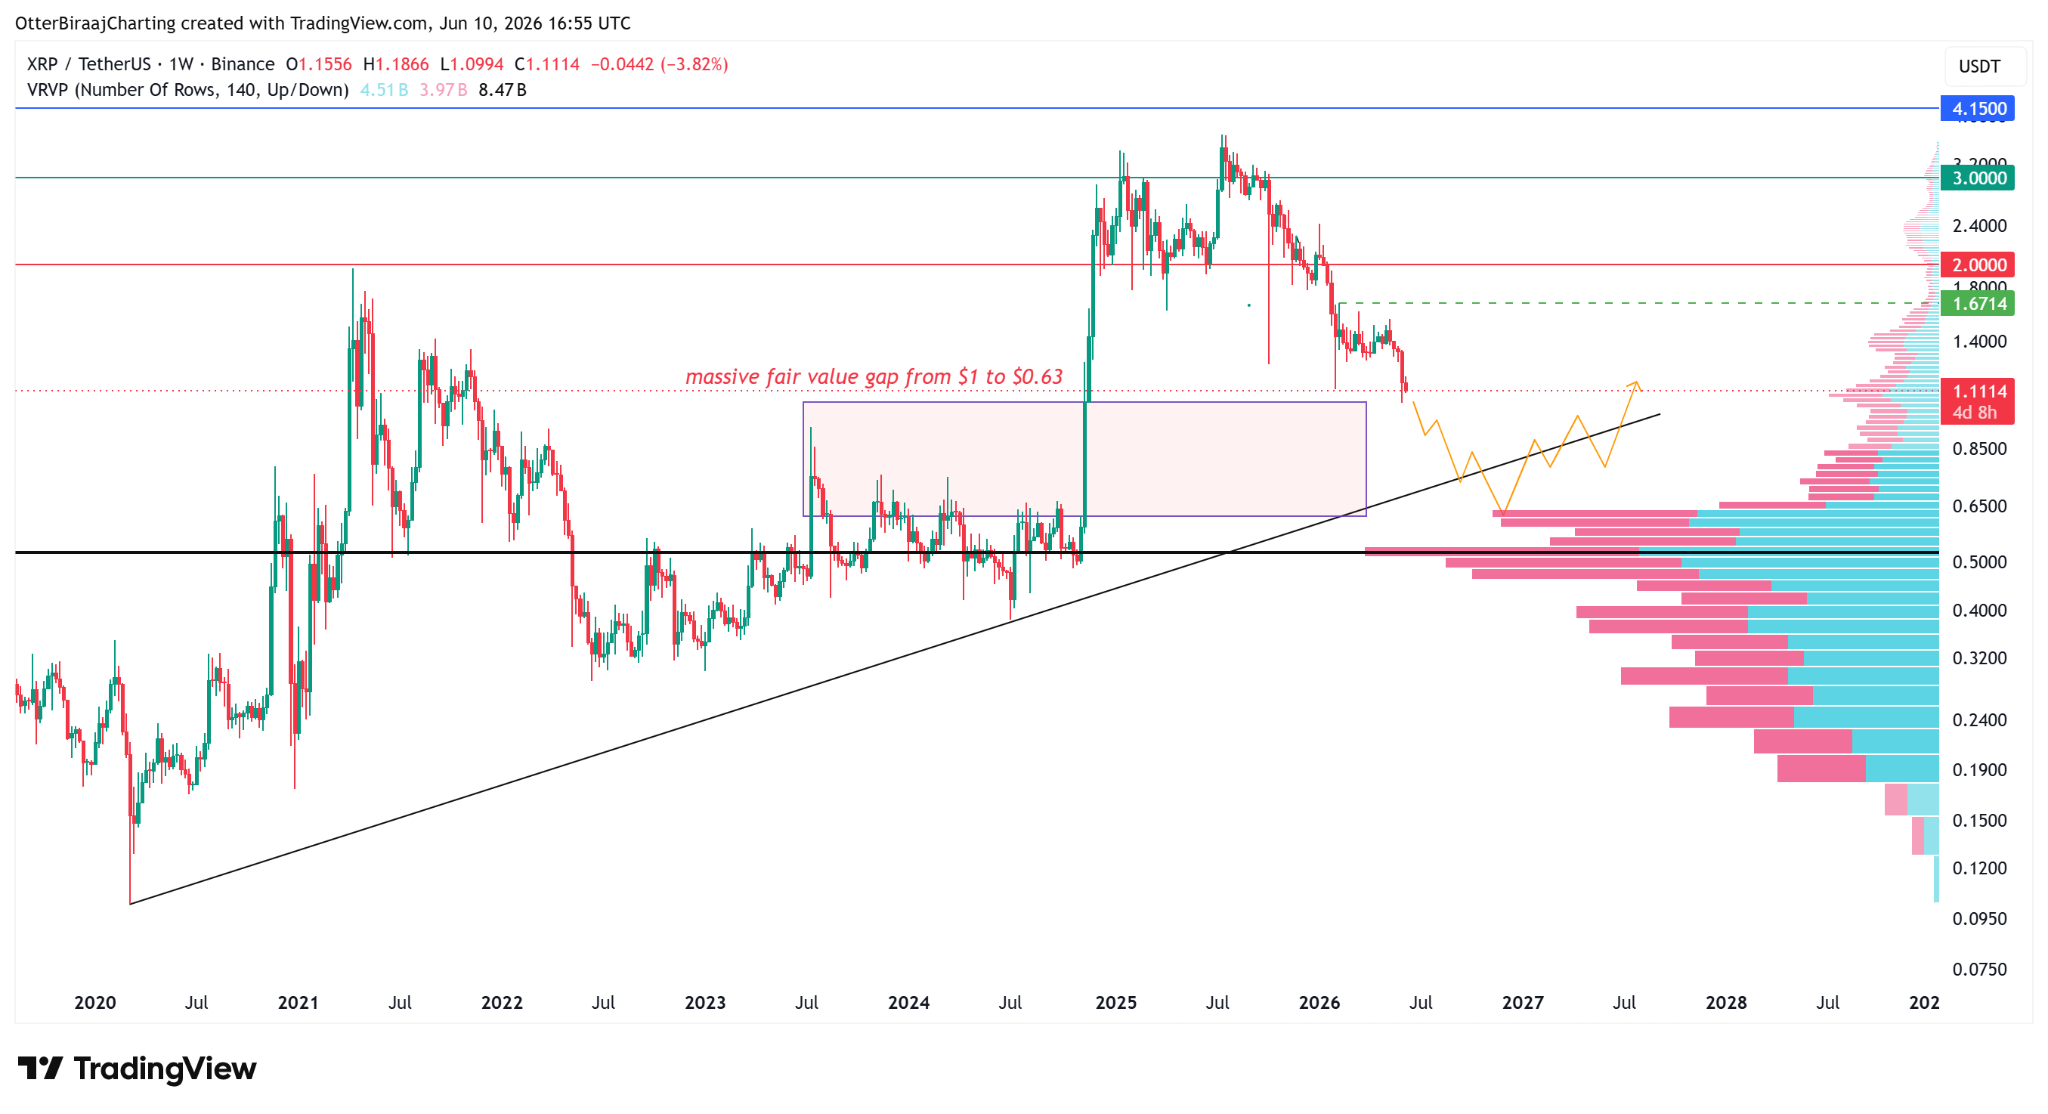
XRP/USDT, one-week chart. Source: Cointelegraph/TradingView
The visible-range volume profile data shows relatively light trading activity below current levels until a high-volume node around $0.50–$0.65. The point of control, which marks the price area with the highest traded volume, sits near $0.52–$0.55.
The same region aligns with XRP’s five-year ascending trendline, projected to intersect near $0.60–$0.65 in the coming months.
Some traders are already treating the zone as an accumulation range. Trader Crypto Patel identified $1.00 to $0.60 as a preferred buying range, while market analyst Javon Marks maintained his long-term breakout target of $15–$18, representing a 1,100% increase.
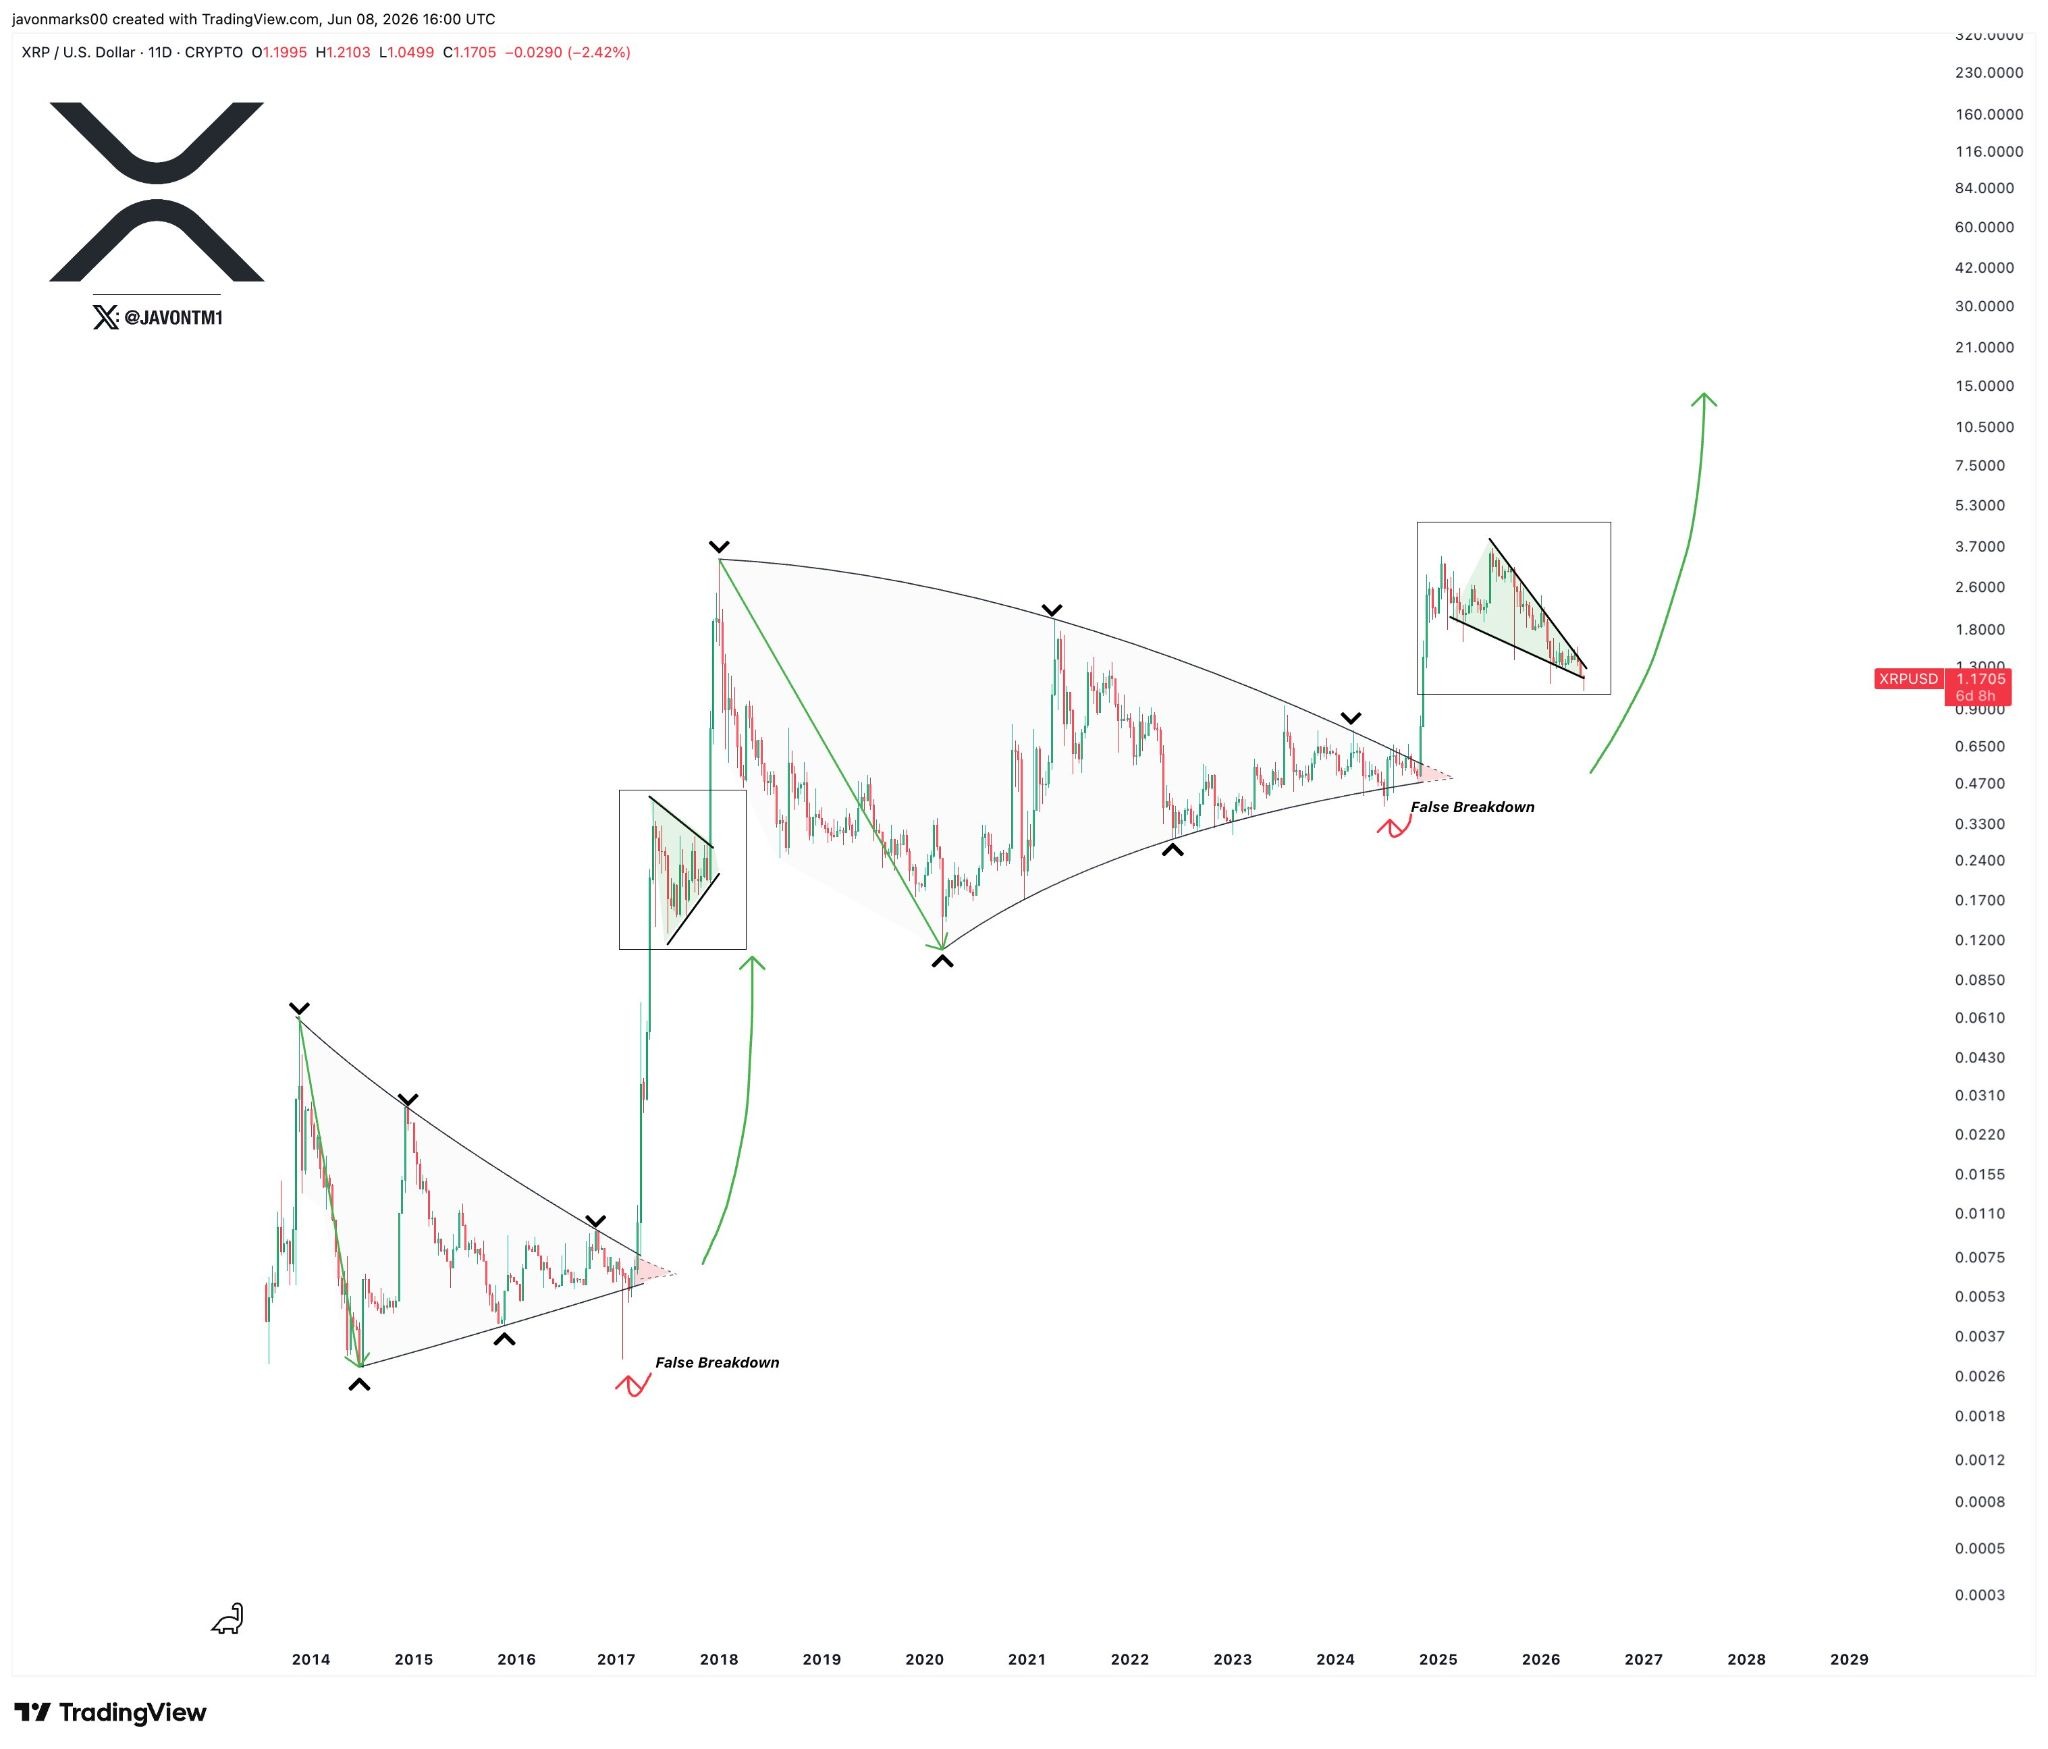
XRP long-term analysis by Javon Marks. Source: X
Related: ETH crash to $1K looms if key support breaks: Will futures traders step in?

TLDR:
- Fold sold ~$45M in Bitcoin at an average price of $71,000 to fund a full balance sheet reset.
- The company repaid $20M in Bitcoin-collateralized debt, eliminating all secured obligations.
- A $25M cash allocation targets Credit Card scaling, new products, and financing partnerships.
- Fold retains a Bitcoin treasury position and keeps its revolving credit facility available.
Fold Holdings has sold approximately $45 million in Bitcoin to eliminate secured debt and fund business expansion.
The Nasdaq-listed Bitcoin financial services company monetized the holdings at an average price of $71,000 per Bitcoin.
Proceeds were split between retiring $20 million in Bitcoin-collateralized debt and allocating $25 million toward growth initiatives.
The move strengthens Fold’s balance sheet ahead of several planned product launches across its consumer and enterprise platforms.
Fold Bitcoin Sale Clears All Secured Debt
The Fold Bitcoin liquidation marks a deliberate shift in the company’s capital strategy. By repaying all Bitcoin-backed secured debt, Fold eliminates monthly cash interest expenses immediately.
This improves the company’s net cash flow position starting in June 2026. Management expects further cash flow gains throughout the year as new products launch and customer activity increases.
Fold retains a meaningful Bitcoin treasury position after the sale. The company also keeps access to its revolving credit facility for future needs.
Management reserves the right to monetize additional Bitcoin holdings when returns justify it. This flexible approach keeps strategic options open as market conditions evolve.
The debt elimination removes a key risk factor tied to Bitcoin price swings. Bitcoin-collateralized loans carry liquidation risk during sharp market downturns.
Clearing that exposure gives Fold more operational stability. It also reduces pressure to make reactive decisions during volatile periods.
CEO Will Reeves positioned the transaction as a forward-looking move. “We believe Fold is poised for near-term growth and investing in that future is exactly what the company needs to do,” Reeves said.
He added that the company has built one of the strongest product roadmaps in its history. The recently launched Bitcoin Credit Card, Bitcoin Gift Cards, and Fold Business products anchor that pipeline.
$25 Million Fuels Fold Bitcoin Credit Card Growth
The $25 million cash allocation is primarily directed toward scaling the Fold Bitcoin Credit Card. Improved liquidity positions Fold to support a larger cardholder base going forward.
The company is also pursuing additional funding relationships to expand the credit program. Management considers the Credit Card among Fold’s highest long-term growth opportunities.
Greater financing flexibility allows Fold to capture more of the economics generated by the card program. As the cardholder base grows, revenue participation from the program increases.
This creates a compounding effect on company revenues over time. The strengthened balance sheet directly enables that participation.
Reeves addressed the strategic rationale directly. “We have reduced financing risk, strengthened our balance sheet, and ensured that short-term market volatility cannot stand in the way of executing our roadmap,” he said.
The statement points to deliberate risk management ahead of several product launches. Fold also plans to introduce additional products in the coming months.
Operating leverage is expected to improve as new products launch and financing partnerships come online. Each factor contributes to a stronger cash flow profile throughout the year.
With debt cleared and cash deployed, Fold Bitcoin operations enter a more stable phase. The company now has the resources to execute its plans without short-term financial constraints.

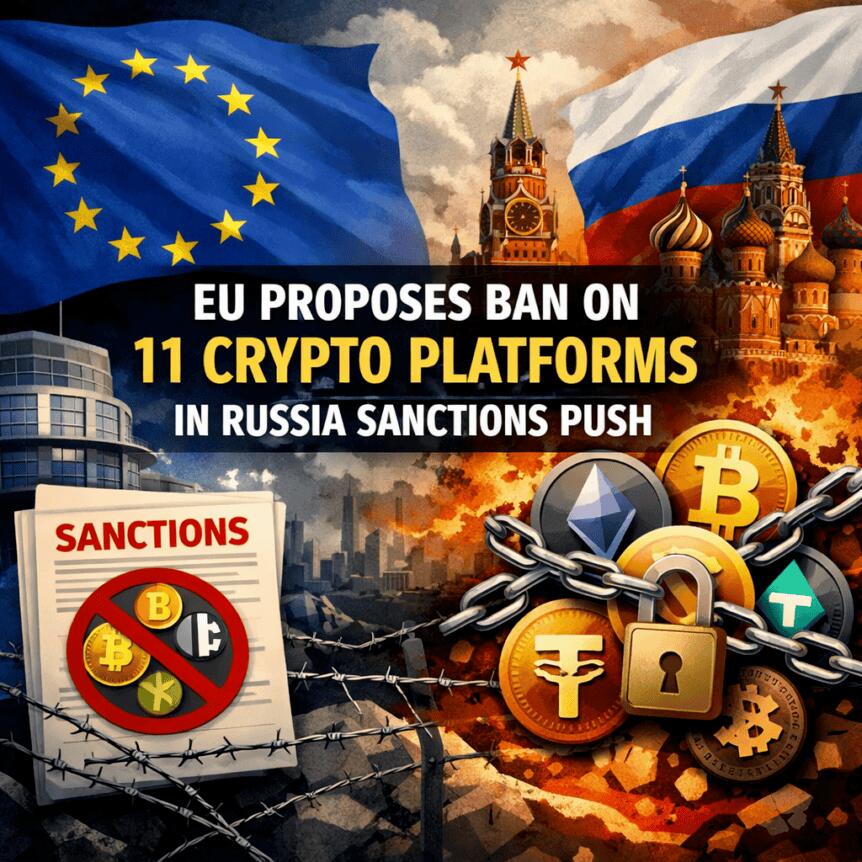
The European Union is expanding its sanctions toolkit to curb crypto-enabled evasion as part of the 21st package aimed at Russia. A proposed measure would ban transactions on 11 crypto platforms, broadening the bloc’s crackdown beyond traditional banks and energy revenues to the crypto sector believed to facilitate Moscow’s circumvention of existing restrictions.
Kaja Kallas, vice president of the European Commission and the EU’s high representative for foreign affairs and security policy, announced the move in a post on X, saying the package would tighten bans on crypto-asset services to certain third countries, add new designations, and ban transactions on 11 crypto platforms.
According to her remarks, the aim is to close gaps in enforcement where crypto firms may be used to move money or engage in activities that help sanctioned actors avoid penalties. The Commission, however, did not identify the 11 platforms in its public statements, and Cointelegraph sought clarification on which platforms would be affected; no additional details were provided before publication.
EU President Ursula von der Leyen later underscored that the package also targets 31 additional Russian banks and 20 entities in third countries, including banks, crypto platforms and oil traders, arguing these targets have either supported sanctioned individuals or enabled circumvention of EU measures.
EU proposal follows UK sanctions against HTX
The EU move arrives as the United Kingdom earlier in May targeted HTX Global S.A., the Panamanian entity behind HTX, over alleged support for Russia-linked financial networks. UK authorities said there were reasonable grounds to suspect HTX had provided financial services and funds to the Russian government via sanctioned entities such as A7 Limited Liability Company and Garantex.
HTX has denied the allegations, arguing the sanctioned entity is separate from the online exchange. A Global Ledger report later flagged that HTX processed roughly $21.06 billion in high-risk crypto flows from 2021 through May 2026, with about $7.64 billion tied to Russian high-risk entities and darknet markets, including Garantex, its successor Grinex, A7A5 and Hydra.
Regulatory researchers criticized the UK’s broader “tainting at the exchange level” approach, warning it could freeze legitimate users and complicate the effectiveness of on-chain compliance tools designed to trace illicit flows. The ongoing debate highlights the tension between tightening enforcement and preserving usable pathways for compliant market participants.
The wider context: why this matters for markets and policy
The EU’s proposed action reflects a broader shift in how regulators seek to police crypto activity amid geopolitical tensions and a persistent push to align crypto rules with traditional finance safeguards. By naming crypto platforms among the targeted channels for sanctions, Brussels signals a willingness to hold crypto intermediaries to account for facilitating cross-border flows that could bypass conventional restrictions.
For investors and traders, the development introduces additional friction points in cross-border transfers and fiat-to-crypto or crypto-to-fiat transactions that involve sanctioned jurisdictions or entities. Compliance teams at exchanges and custodians will be pressured to tighten screening, identify potential high-risk counterparties, and ensure robust end-to-end transaction monitoring to avoid inadvertent exposure to sanctioned networks.
The absence of publicly named platforms at this stage leaves a noteworthy element of uncertainty. Markets often react to clarity; when regulators publish a definitive list of designated platforms or counterparties, participants typically adjust risk models, pricing, and liquidity considerations accordingly. In the meantime, the signal from Brussels is clear: crypto rails will be scrutinized more intensely as part of international sanctions coordination.
What to watch next: enforcement, clarity, and industry response
Key questions loom as the EU moves toward formalizing these restrictions. Which platforms will be designated, and how quickly will the bloc—together with its member states—implement the ban on crypto-asset services to the specified third countries? How will this interact with existing anti-money-laundering and know-your-customer requirements, and what definitions will regulators rely on to determine “high-risk” crypto flows?
Observers will also be watching the cross-border dimension: will the UK and EU deliver a synchronized approach that minimizes loopholes for sanctioned actors while preserving legitimate access for compliant customers? The HTX case illustrates the delicate balance regulators attempt to strike when sanctioning entities with complex international structures and multiple affiliates.
In parallel, some analysts argue that the regulatory framework around crypto could increasingly favor tokenized and tradable assets that sit more clearly within centralized compliance regimes. Others note the ongoing debate around MiCA (Markets in Crypto-Assets) and how its architecture might evolve to address DeFi, tokenization, and cross-border settlement more explicitly, a topic that has surfaced in related coverage.
As Brussels weighs its 21st sanctions package, the concrete impact on the crypto landscape will hinge on several moving parts: the list of targeted platforms, the practical mechanics of enforcement, and how industry participants adapt to tighter controls without unduly hamstringing legitimate use of digital assets. The Commission’s remarks point to a comprehensive effort to integrate crypto services into the sanctions architecture, not merely as a matter of punitive action but as a strategic tool to prevent abuse of digital financial rails.
For readers tracking regulatory developments, the immediate next step is to watch for the official release of the 11 named platforms, along with any accompanying guidance from the European Commission or member states detailing compliance obligations for exchanges and custodians operating within the EU with respect to sanctioned counterparties.
According to the UK’s stance, the HTX actions and subsequent data-driven analyses underscore the risk that broad enforcement measures can create cascading effects across the crypto ecosystem—affecting liquidity, on-chain tracing, and the ability of compliant users to operate normally in international markets. The industry’s response will likely shape future policy iterations as regulators seek to strike a balance between deterrence and pragmatic usability for legitimate participants.
Related commentary has underscored a potential shift in EU regulatory emphasis toward tokenization and asset-backed structures as a complement or alternative to DeFi-centric regulation, suggesting that the sector may see a broader menu of tools used to regulate cross-border flows and protect sanctions regimes. The ongoing conversation around MiCA, DeFi, and tokenization will intersect with these developments and help define the next phase of Europe’s crypto policy.
Readers should stay tuned for updates on the list of targeted platforms, the specifics of how the ban will be enforced, and any subsequent designations that clarify the scope of the EU’s cross-border crypto-sanctions strategy.
What happens next will shape how crypto firms plan compliance, how sanctions risks are priced into markets, and how regulators coordinate across jurisdictions to close the gaps that currently exist between traditional finance controls and digital-asset rails.
As the EU advances this agenda, market participants should watch for concrete guidance from Brussels and for any parallel actions from national authorities, which together will determine the practical boundaries of sanctioned activity within the European crypto ecosystem.
Source context: EU sanctions package coverage and related UK actions are referenced through official statements and industry reporting, including comments from Kaja Kallas and Ursula von der Leyen, and UK sanctions coverage related to HTX. For background on the HTX allegations and subsequent data flows, see reports discussing HTX’s linkages to Russian-related entities and the broader debate over exchange-level sanction enforcement.
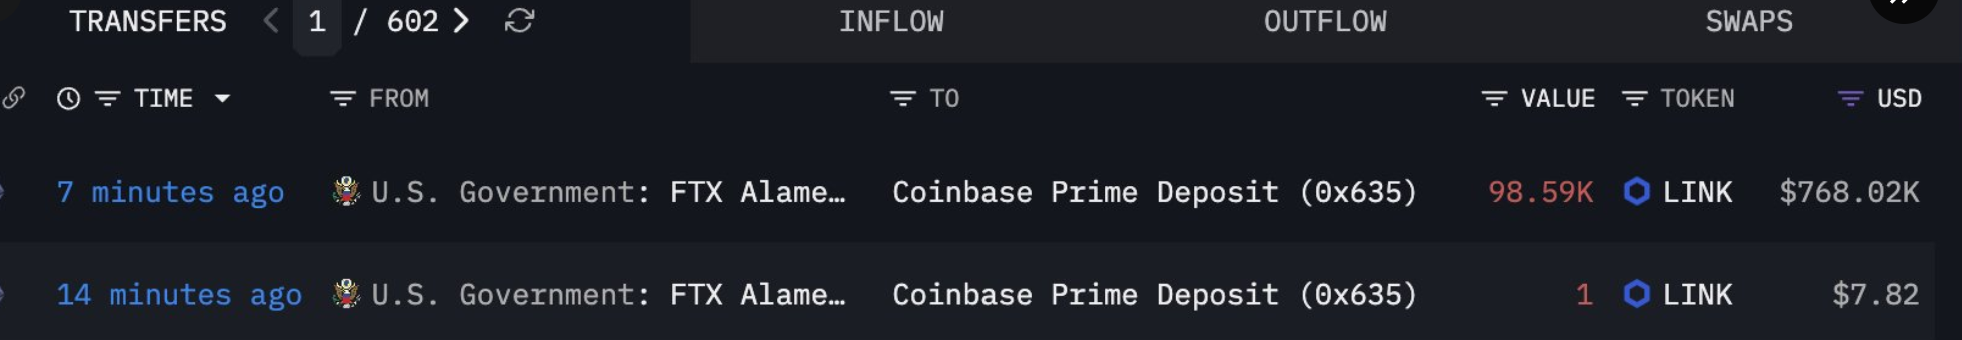
A wallet tied to US government seized FTX Chainlink holdings moved 98,590 Chainlink (LINK) tokens, worth about $768,000, to Coinbase Prime on Wednesday, reviving speculation over a potential sale.
Blockchain trackers flagged the deposit within minutes. However, on-chain data alone does not confirm that the tokens are headed for the open market.

Why the Seized FTX Chainlink Transfer Matters
On-chain tracker Lookonchain first reported the movement, and tracking account Solid Intel flagged the same deposit.
Arkham labels the sending address under its US government entity and has documented earlier movements from the same cluster.
Follow us on X to get the latest news as it happens
The funds originate from assets confiscated after FTX and Alameda Research collapsed in November 2022.
A federal judge later ordered Sam Bankman-Fried to forfeit $11 billion after his fraud conviction, with recovered funds directed toward victim compensation.
The US Marshals Service selected Coinbase Prime in July 2024 to custody and trade its large-cap digital assets.
“After a comprehensive process, the U.S. Marshals Service (USMS), a division of the U.S. Department of Justice, selected Coinbase Prime as its partner to safeguard and trade its “Class 1” (large cap) digital assets,” read an excerpt in a 2024 Coinbase blog.
Therefore, deposits to the platform often precede custody changes, over-the-counter deals, or liquidations.
The agency has managed seized crypto sales for over a decade, beginning with its auction of 30,000 Silk Road bitcoins in 2014.
Historically, it has favored structured sales over open-market dumps.
The transaction also extends a pattern of earlier seized altcoin transfers involving Uniswap (UNI), Render (RNDR), Ethereum (ETH), and The Sandbox (SAND), plus stablecoins.
Meanwhile, the FTX estate keeps repaying customers, with its fourth creditor distribution round delivering $2.2 billion in March.
Analysts See Limited Risk of a LINK Sell-Off
Chainlink’s current price sits near $7.66, down 2% over the past 24 hours. The token holds a $5.57 billion market cap and ranks 21st among cryptocurrencies.

The transferred amount equals less than 0.4% of LINK’s $225 million daily trading volume. It also represents roughly 0.01% of the 727 million tokens in circulation.
Consequently, even an outright sale would barely move market liquidity.
Sentiment around the token remains cautious after a 27% slide over the past 30 days. LINK has also shed 49% over the past year, leaving holders alert to new supply signals.
In contrast, Chainlink’s ETF inflow outlook suggests institutional demand could absorb modest government supply over time.
Whether the tokens move to an over-the-counter desk or stay in custody should become clearer in the coming days.
The wallet’s next transaction will reveal whether the deposit marks routine management or the start of a liquidation.
Until then, the sell-off fears look larger than the numbers behind them.
The post US Government Moves $768,000 Seized FTX Tokens, Sparks Chainlink Sell-Off Fears appeared first on BeInCrypto.
Crypto World
Nightrush.com Responds to the AI Personalization Wave Reshaping iGaming And Raises the Bar

[PRESS RELEASE – Norwich, United Kingdom, June 10th, 2026]
Nightrush.com, an independent iGaming comparison and review platform, today announced a comprehensive restructuring of its editorial operations and platform revamp.
The initiative responds directly to the widespread adoption of artificial intelligence (AI), machine learning, and adaptive personalization technologies by licensed operators, as well as the increasingly fragmented global regulatory landscape.
The goal is to serve intelligence content and provide resources for the players, focusing on responsible gaming advice and education.
The update arrives as data indicates the global iGaming market surpassed $105 billion in 2025 and is projected to exceed $133 billion by the end of 2026 according to the ICRRD Journal.
Market expansion has been accompanied by a shift toward data-driven, compliance-heavy operational environments, where international regulatory bodies are enforcing stricter standards on promotional bonuses, identity verification, and player safety protocols.
To address these market dynamics, Nightrush.com is implementing a modernized scoring and auditing methodology focused on three core operational pillars:
- Advanced Algorithmic Evaluation: The platform’s updated review metrics move beyond standard promotional offerings to analyze the integration of artificial intelligence within casino platforms. The editorial framework now assesses the performance of operator-side technologies, including predictive recommendation engines and responsive user interfaces.
- Behavioral Safety Monitoring: In response to heightened international regulatory standards, Nightrush.com has adjusted its operator qualification benchmarks. The platform now places significant weight on an operator’s deployment of proactive, real-time behavioral monitoring tools designed to detect and mitigate problematic gambling patterns.
- Jurisdictional Compliance Mapping: The editorial team has expanded its regional data coverage across North America, Europe, Scandinavia, and Oceania. This expanded matrix tracks localized licensing updates, legislative shifts, and consumer protection mandates to ensure accurate compliance reporting across distinct jurisdictions.
This operational realignment establishes an independent, verification-based reporting model designed to provide transparent market data for consumers navigating complex digital entertainment sectors.
Olesea Naidion, Brand Manager at Nightrush.com said: “The integration of artificial intelligence is fundamentally changing how platforms interact with users. Our updated editorial infrastructure ensures that our review standards evolve alongside these technical advancements, prioritizing objective transparency and independent validation over superficial marketing metrics.”
About Nightrush.com
Nightrush.com is an independent digital media platform and information resource specializing in the verification, review, and comparison of licensed international iGaming operators. Operating strictly as an informational affiliate platform rather than a gambling operator, the company provides market analysis, compliance tracking, and consumer safety evaluations across North America, Europe, Scandinavia, and Oceania. The platform is dedicated to maintaining high-integrity editorial standards to support informed consumer decision-making within regulated digital gaming markets.
The post Nightrush.com Responds to the AI Personalization Wave Reshaping iGaming And Raises the Bar appeared first on CryptoPotato.


Pennsylvania Gov. Josh Shapiro has unveiled standards for large data center projects seeking state support.
Summary
- Pennsylvania’s GRID Standards require data center developers to secure certification before receiving state incentives, fast permits, or tax benefits.
- The rules require developers to pay for new power generation and disclose project size, water use, and efficiency details.
- Separate bills from state lawmakers could change data center tax exemptions, water rules, power requirements, and local zoning powers.
Duane Morris Government Strategies said the GRID Standards set conditions for incentives, fast permits, and tax benefits. The rules come as residents question power demand, water use, and infrastructure costs.
GRID standards tie incentives to certification
The Governor’sResponsible Infrastructure Development Standards require certification before developers receive state benefits. Two state offices will manage certification. Certified projects can access Pennsylvania’s Permit Fast Track Program and sales tax exemptions for computer equipment. They may also qualify for selected tax programs.
The standards do not give permanent approval to any project. Developers must submit compliance reports before operations and file yearly updates. According to Duane Morris Government Strategies, the framework links economic support with more oversight.
The blog called it one of the most detailed state frameworks. Pennsylvania officials now want lawmakers to codify the GRID Standards through legislation. They also want the data center tax exemption tied to certification.
Energy and local input shape project rules
The standards require developers to pay the full cost of new power generation. The rule prevents developers from shifting costs to current utility customers. New power capacity must come from new or incremental generation resources. The resources must sit within the same PJM Locational Deliverability Area.
Facilities larger than 100,000 square feet must support future solar installations. The requirement places energy planning into early design work. The framework also requires developers to identify facility end users and hold public meetings.
Those meetings must occur before major design decisions. Project disclosures must include size, expected water use, and efficiency metrics. Local governments must receive early consultation before final plans.
Lawmakers advance separate data center bills
Developers must commit at least $250 million in investment to qualify. They must also create at least 200 construction jobs. The standards require 50 permanent jobs within four years. Those jobs must pay at least 125% of Pennsylvania’s average wage.
Hiring plans must explain how local workers can access apprenticeships and construction opportunities. The standards connect state support with job targets. Sen. Tracy Pennycuick has proposed a separate data center bill. Her plan would require large facilities to provide power and meet water limits.
Her proposal would create a Pennsylvania Data Center Advisory Committee. It would ban governments from signing nondisclosure agreements with developers. Sen. Jarrett Coleman and Rep. Jamie Walsh have introduced another bill. Their proposal would repeal the current equipment tax exemption.
Their legislation would allow temporary municipal pauses on data center applications. Municipalities could use that time to update zoning rules. Pennsylvania’s tax exemption could cost over $517 million yearly by fiscal 2030-31. State officials want that exemption tied to GRID certification.

The US Commodity Futures Trading Commission (CFTC) has proposed new rules for prediction markets, signaling that sports event contracts are generally not contrary to the public interest even though federal law classifies them as “gaming.”
Released on Wednesday, the proposal distinguishes sports event contracts from games of pure chance, saying markets based on final scores and win-loss records can aid price discovery. Contracts tied to player injuries, officiating decisions or other outcomes that could encourage manipulation, however, are unlikely to meet the public interest test.
The proposal also clarifies that election contracts are not considered “gaming” under the relevant federal laws. Reuters reported this could further ease regulatory uncertainty for platforms such as Kalshi and Polymarket, which rose to prominence during the 2024 US presidential election as traders increasingly turned to prediction markets to gauge the race’s outcome.
The draft rules are open for public comment for 45 days and could help define the future regulatory framework for US prediction markets.
Gary Kalbaugh, a partner at Cahill Gordon & Reindel LLP in New York, said the proposal is principles-based rather than a blanket approval, noting that each contract would still be subject to a case-by-case public interest analysis.
“‘Gaming’ is defined more broadly than anticipated and sweeps in sports events,” Kalbaugh wrote on Wednesday. “Contracts settling on aggregate outcomes (final scores, win-loss, season stats) are presumptively permissible.”
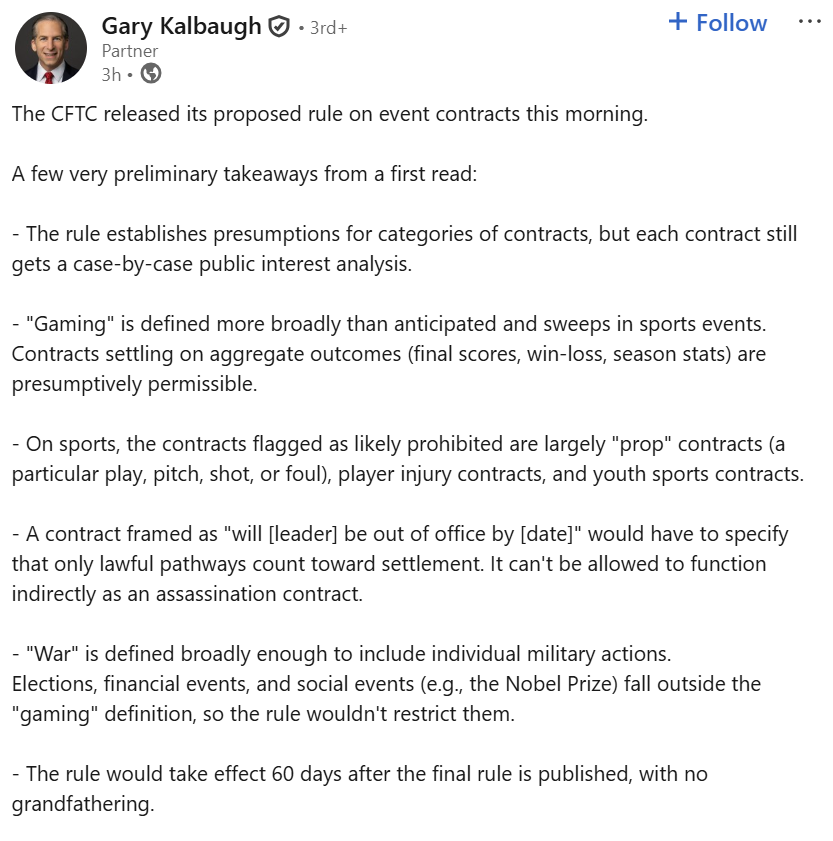
Source: Gary Kalbaugh
Related: Anchorage backs Treasury’s GENIUS AML rules, seeks secondary-market sanctions clarity
Increased regulatory clarity comes as prediction markets see adoption surge
The proposed rules come as prediction markets — described as an “asset class” in the draft — continue to gain momentum, with Kalshi and Polymarket reaching multibillion-dollar valuations amid rising investor and institutional interest.
Both companies have expanded their ties to traditional financial markets. Kalshi recently partnered with Nasdaq to launch a new category of prediction markets that allows users to forecast the future valuations of private companies ahead of their initial public offerings.
Polymarket, meanwhile, has partnered with Dow Jones to integrate real-time prediction market data into its media brands, including The Wall Street Journal.
“The prediction markets continue to become more mainstream, with newly formed partnerships with news organizations and more firms moving quickly into this space,” said Melinda Roth, a professor of sports law and corporate finance at Georgetown University Law Center. “As these markets continue to grow, the unanswered question is if event contracts are financial instruments or are they simply gambling.”
Analysts at Bernstein say prediction markets are seeing growing institutional adoption as investors seek alternative macro-hedging tools through binary-outcome contracts.
Magazine: How to fix suspected insider trading on Polymarket and Kalshi

Nigeria Senate advances bill to regulate crypto exchanges
Drew Sidora & Ralph Pittman Divorce, Child Support Surfaces

Oxford Industries, Inc. (OXM) Q1 2026 Earnings Call Transcript


-

 Fashion5 days ago
Weekend Open Thread: Evereve – Corporette.com
-
 Crypto World6 days ago
Jensen Huang Approves Samsung, SK Hynix, and Micron for NVIDIA (NVDA) HBM4 Memory Supply
-

 Crypto World3 days ago
Anatomy of the June crypto crash: Fed, Iran, Saylor
-
 Entertainment4 days ago
The Best Mystery Series of All Time Is Surging on Streaming 30 Years After It Ended
-

 NewsBeat3 days ago
Alexander Zverev wins the French Open to finally earn a 1st Grand Slam title
-

 Tech5 days ago
Suspicious Polyfill login prompts pop up on Toshiba, Muji websites
-
Crypto World4 days ago
Senator Cynthia Lummis Calls CLARITY Act the Most Consequential Financial Legislation of This Generation
-

 Tech6 days ago
Microsoft launches MXC, an OS-level sandbox for AI agents, with OpenAI and Nvidia already on board
-
 Tech4 days ago
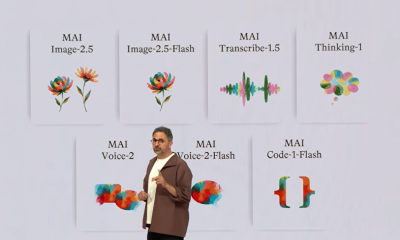
Microsoft unveils seven homegrown AI models in new bid for ‘long term self-sufficiency’
-

 Business6 days ago
(VIDEO) Justin Bieber Delivers Surprise Happy Birthday Serenade to Diners at Los Angeles Mexican Restaurant
-
 Business4 days ago
The Pain Points Taking a Fragile Tech Rally Down a Notch
-
 Crypto World3 days ago
Eli Lilly (LLY) Stock Surges 4% Following Breakthrough Sleep Apnea Trial Results
-
Crypto World6 days ago
LBank Surpasses 25 Million Users Worldwide as AFA Partnership Continues to Drive Global Growth
-

 Tech5 days ago
Von der Leyen’s AI envoy pick draws conflict-of-interest fire
-

 Tech5 days ago
Meta steals a tactic from Tesla and builds data centers in tents
-

 Crypto World3 days ago
Trump’s AI Ownership Plan Could Benefit Anthropic at OpenAI’s Expense
-
 Sports1 day ago
Bangladesh beat Australia after 20 years in ODIs, register only their second win over six-time world champions | Cricket News
-

 Business3 days ago
High Stakes for Wembanyama as New York Pushes for 3-0 Lead
-

 Tech5 days ago
Hackers now exploit SolarWinds Serv-U flaw to crash servers
-

 Tech3 days ago
Notion restores access to Anthropic after service disruption
You must be logged in to post a comment Login