

Crypto World
Ripple Rolls Out Mint to Widen Institutional Access to RLUSD


Ripple has introduced Ripple Mint, a new institutional platform aimed at simplifying how businesses interact with its US dollar-pegged stablecoin, Ripple USD (RLUSD). The company positions the service as a unified gateway for key stablecoin operations—minting, redeeming, and ongoing management—either through a web interface or via direct API integrations.
Ripple Mint was announced on Thursday as Ripple continues to emphasize enterprise workflows. For investors and builders, the release matters because stablecoins are increasingly being assessed not just on liquidity or issuance, but on how easily companies can integrate them into payments, trading, and treasury systems.
Key takeaways
- Ripple Mint is designed to let institutions access RLUSD through a single platform for minting, redeeming, and management.
- The platform supports both manual workflows via a web interface and automated workflows through API integrations.
- Ripple Mint’s launch follows RLUSD’s December 2024 debut, which has been oriented toward institutional use cases while also drawing retail attention.
- RLUSD has grown into one of the larger US dollar stablecoins by market cap, reaching the top 10 less than a year after launch, according to Cointelegraph.
- CoinGecko data cited by Cointelegraph shows RLUSD briefly surpassed $1.8 billion in market cap on June 1, 2026.
What Ripple Mint adds for institutions
Ripple describes Ripple Mint as a unified platform intended to provide institutions with “flexible access” to digital dollars through the workflows that best fit their internal operations. In practical terms, that means organizations can manage RLUSD in ways tailored to how they already handle financial processes.
Ripple’s announcement also underlines a dual approach: organizations that prefer a more manual setup can use the platform through a web interface, while those looking to automate stablecoin operations can connect through application programming interfaces. This distinction is important for institutions because stablecoin adoption often hinges on whether issuance and redemption can plug into existing systems without creating operational bottlenecks.
Ripple noted that Ripple Mint is built to support both manual activity and automated integrations as stablecoins increasingly move into roles involving payments, trading, and treasury.
How RLUSD’s positioning has evolved
RLUSD launched in December 2024 with an institutional focus, although Cointelegraph previously reported that it also found traction among retail users. That broader adoption profile is part of the context for Ripple Mint: stablecoin issuers and infrastructure providers are competing on the full lifecycle—acquisition, operational handling, and controls—not only on token availability.
Cointelegraph reported that RLUSD grew into one of the larger US dollar-pegged stablecoins by market capitalization, reaching the top 10 in less than a year after launch. The token’s scale helps explain why a platform like Ripple Mint is being emphasized now: as stablecoins attract more diverse holders, the demand for structured, institution-friendly tooling typically increases.
Market cap momentum around the launch
Ripple Mint arrives during a period where RLUSD has shown notable market-cap momentum. Cointelegraph linked CoinGecko data indicating that RLUSD recorded an all-time high in market capitalization on June 1, 2026, when it surpassed $1.8 billion.
Cointelegraph also stated that around the Ripple Mint launch, RLUSD’s market cap briefly moved from roughly $1.54 billion to about $1.64 billion before settling near $1.59 billion. At the time of publication, the token was ranked as the ninth-largest USD-pegged stablecoin by market cap, per CoinGecko’s data view of the category.
For readers, it’s worth separating two things: market capitalization performance reflects overall demand and supply dynamics, while institutional tooling reflects an issuer’s push to reduce friction for business use. Ripple Mint speaks directly to the latter, but it can also influence the former over time if it improves integration speed and lowers operational complexity for institutions considering stablecoin deployments.
Why API-first stablecoin access matters now
Stablecoin adoption has repeatedly stalled at the integration layer. Even when an asset meets the requirements for settlement or treasury management, institutions often need to connect minting/redemption and operational controls into internal platforms such as ERP systems, compliance tooling, and treasury workflows. Ripple Mint’s emphasis on both web access and API integration targets exactly that problem.
As Cointelegraph noted earlier coverage of stablecoin payment and infrastructure efforts across the industry, the market is moving toward more structured stablecoin plumbing—payments acceptance, liquidity handling, and treasury automation. Ripple Mint fits into that direction by focusing on the operational functions institutions typically care about most: managing supply, executing lifecycle events, and doing so in a way that aligns with both human-in-the-loop processes and fully automated execution.
There is still an open question for investors: how quickly institutions will adopt the new platform and whether Ripple Mint becomes a meaningful driver of RLUSD usage beyond existing channels. The token’s positioning by market cap suggests strong interest, but adoption of infrastructure often plays out over quarters rather than days.
Going forward, market participants should watch for evidence that Ripple Mint is accelerating institutional onboarding—such as increased RLUSD volumes tied to enterprise activity, broader mentions of RLUSD integrations, and any further product expansions that deepen automation and controls for regulated workflows.

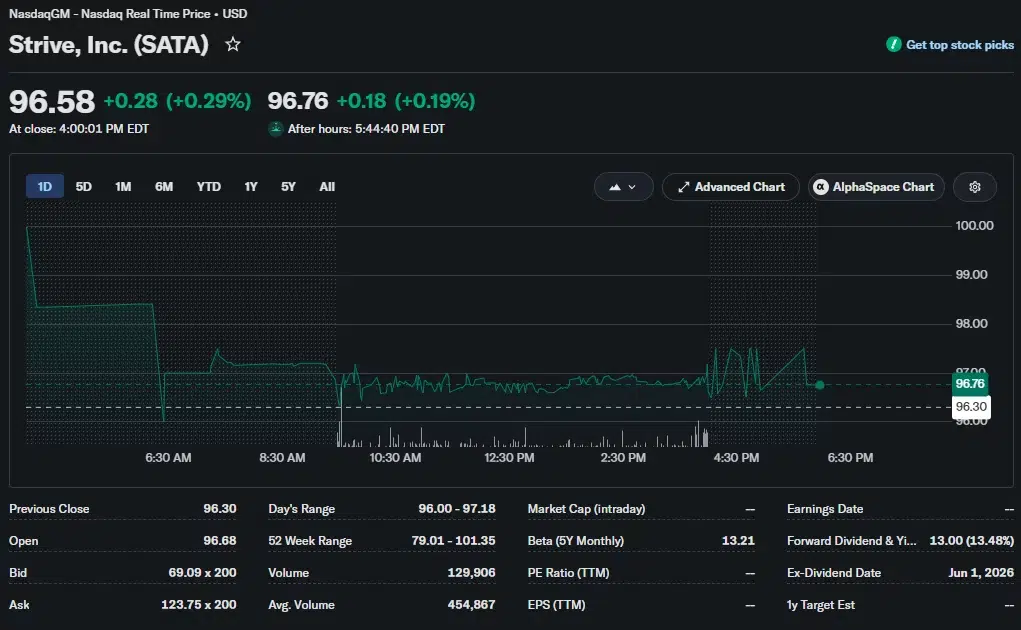
Strive’s SATA preferred shares have recovered nearly 16% from their June low to about $97, prompting Jan3 CEO Samson Mow to predict that the rebound could help Strategy’s STRC return to its $100 par value.
Summary
- Strive’s SATA has rebounded nearly 16% from its June low to about $97.
- Samson Mow expects SATA’s recovery to help Strategy’s STRC return toward its $100 par value.
- Three major U.S. preferred stock ETFs collectively hold $756 million worth of STRC.
Yahoo Finance data show SATA has climbed from $83.30 and now trades within roughly 3% of the level it was designed to track. The recovery has erased most of the preferred stock’s late-June decline, while STRC remains about 13% below par despite receiving increased demand from major U.S. exchange-traded funds.
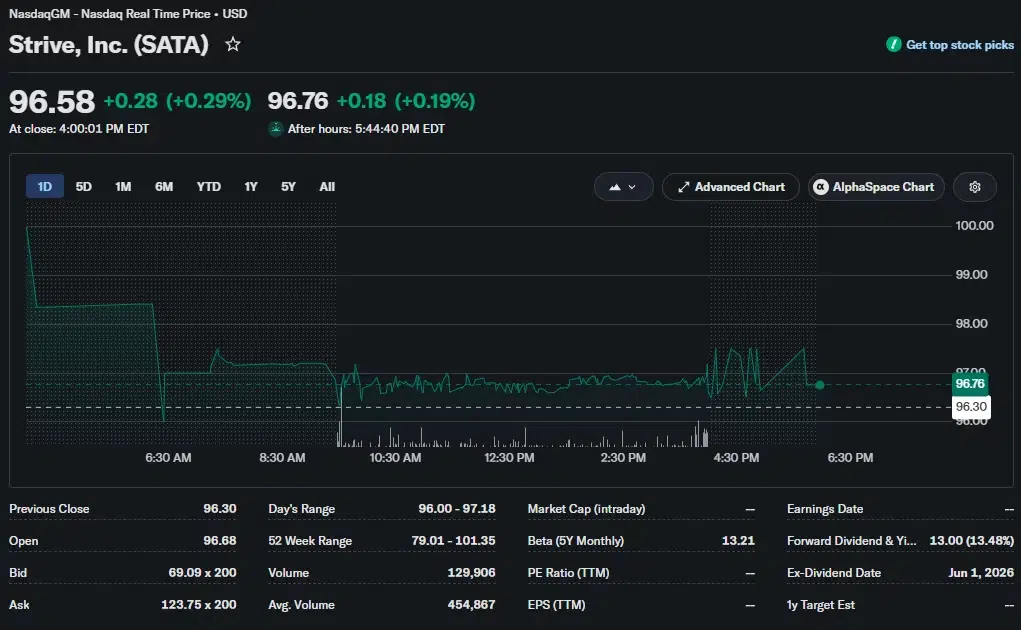
According to Mow, steps taken by Bitcoin treasury companies to improve their balance sheets and support their preferred shares have started rebuilding confidence in the products. He told Cointelegraph that SATA’s return toward $100 could reassure investors that the funding structure used by Strive and Strategy remains functional.
“I think every action that Strategy has undertaken to strengthen their balance sheet and encourage STRC to go back to par is also working.”
Mow expects the two securities to move together because investors are assessing whether Bitcoin-linked preferred shares can continue funding their dividends and hold close to their stated values.
“But everything sort of works in tandem. I think as SATA returns to par, you’re going to see STRC return to par too, because people say, ‘OK, this model’s not broken.’ Everyone is capitalized for three or more years of dividend payments… there was no reason to panic all along,” he added.
SATA’s recovery supports confidence in Bitcoin preferred shares
Strive introduced SATA in November 2025 to raise money for expanding its Bitcoin holdings without issuing more common stock. The variable-rate perpetual preferred shares use dividend adjustments to encourage trading around their $100 par value.
By changing the payout rate when needed, Strive can make SATA more or less attractive to investors as its market price moves. The company designed the structure to provide recurring access to capital while limiting dilution for common shareholders, according to its stated treasury strategy.
Strategy launched STRC in 2025 under a similar model. The preferred stock also uses a variable dividend to keep its price near $100, placing it in a category that Strategy calls “digital credit.”
During the late-June selloff, both products dropped well below their intended levels. SATA has since recovered to around $97, but Yahoo Finance data show STRC closed at $86.89 on July 24 after gaining 2.29% during the session. It later rose to $87.14 in after-hours trading.
Mow views the difference between their recoveries as temporary rather than evidence that STRC’s structure has failed. His forecast rests on investors treating SATA’s rebound as proof that preferred shares backed by Bitcoin treasury companies can recover after a sharp decline.
Alongside the price recovery, Mow pointed to companies refining how they raise capital and manage their Bitcoin holdings. He cited Lyn Alden’s Orange Juice treasury company, launched on July 15, as an example of a new entrant using a different operating model and starting with a lower Bitcoin acquisition cost.
BitcoinTreasuries ranks Strategy as the largest corporate Bitcoin holder, with 843,775 BTC. Strive holds 19,921 BTC, placing it seventh among public companies tracked by the platform.
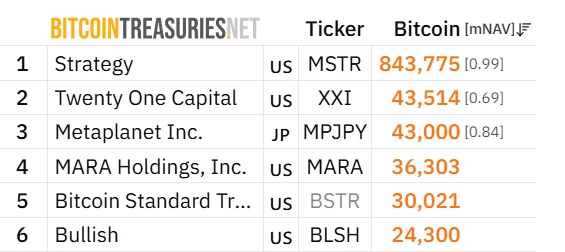
Those holdings create different levels of Bitcoin exposure, but both companies rely on capital-market products to support their treasury plans. For Strive, SATA offers a route to fresh funds without selling more common shares, while Strategy uses STRC and other securities to finance additional Bitcoin purchases.
ETF demand strengthens STRC despite its discount
Institutional demand has already placed STRC at the top of three large U.S. preferred stock ETFs, even though the security continues to trade well below par.
Michael Saylor, Strategy’s co-founder and executive chairman, disclosed on July 24 that STRC is now the largest holding in BlackRock’s iShares Preferred and Income Securities ETF, Virtus InfraCap’s U.S. Preferred Stock ETF and VanEck’s Preferred Securities ex Financials ETF.
According to figures shared by Saylor, the three funds collectively hold $756 million of STRC. Their portfolios also contain preferred shares issued by established U.S. companies, giving ETF investors indirect exposure to Strategy’s Bitcoin-linked security alongside traditional income products.
In his X post, Saylor presented the ETF positions as evidence that Strategy’s “digital credit” securities are entering institutional portfolios. The holdings show that asset managers have allocated substantial capital to STRC, although its July 24 closing price remained 13.11% below $100.
STRC’s discount matters to Strategy because the company sells the preferred shares to fund Bitcoin purchases. Strategy can issue stock near or above par and direct the proceeds into Bitcoin, but a large discount reduces the amount of capital it can raise from each newly issued share.
Selling more STRC while it trades around $87 would therefore produce less funding per share than an issuance completed near $100. The lower price could weaken the economics of using the security for Bitcoin accumulation, even if existing ETF demand continues.
Mow’s outlook links SATA’s recovery with a possible improvement in those conditions. If investors interpret Strive’s return toward par as evidence that variable-rate Bitcoin preferred shares can stabilize, his view suggests STRC could attract enough demand to narrow its discount and restore a more efficient funding channel for Strategy.
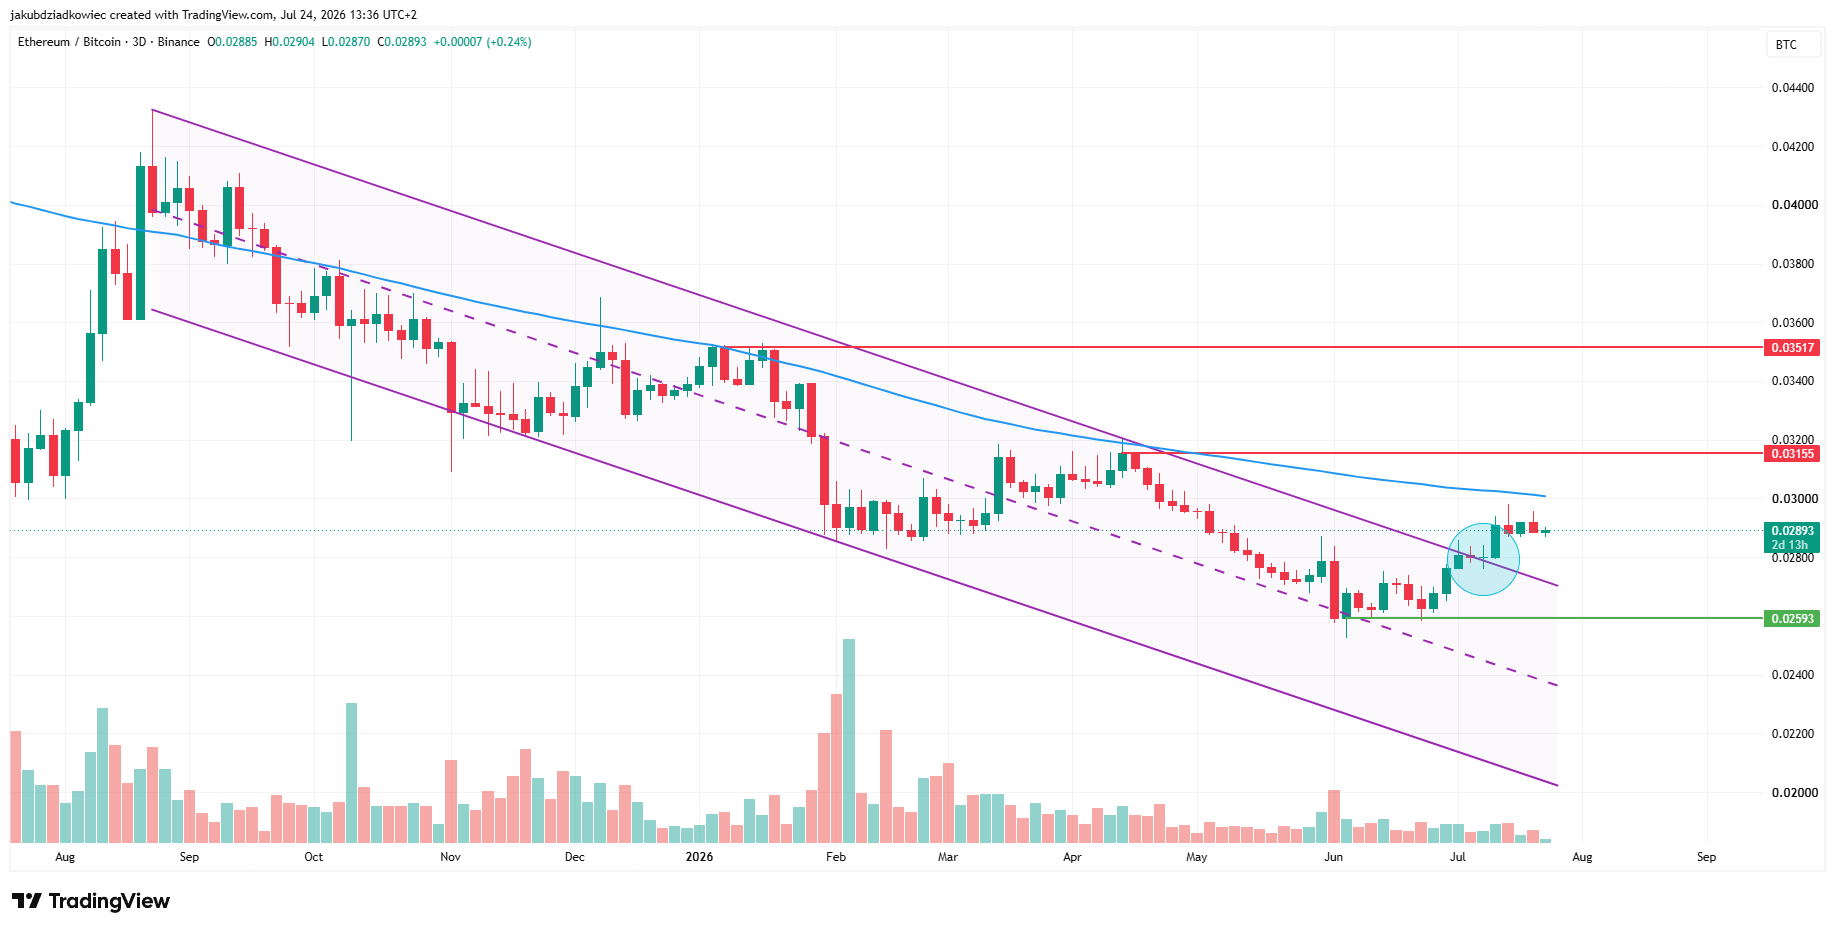
Ethereum (ETH) has printed its first sustained advance against Bitcoin (BTC) in almost a year, breaking out of the descending channel that capped the pair since August 2025.
Bitcoin dominance tells a more cautious story, however. The metric is climbing back to 60%, and analysts remain divided on whether a real altcoin season can start in 2026.
Ethereum Breaks Out Against Bitcoin as Price and Momentum Align
The ETH/BTC three-day chart shows a descending parallel channel in force since August 2025. The pair printed consistent lower lows and lower highs inside it for almost a year.
In July, the ratio finally closed above the channel’s upper boundary. It now trades near 0.0289, with Ethereum at $1,881, down 2.2% in 24 hours. Fresh whales accumulated 50,000 ETH this month as the ratio jumped 6%.
The breakout faces two obstacles overhead. The immediate resistance sits at 0.0316, while the next barrier waits at 0.0352. Moreover, the ratio still trades below the 200-day moving average (blue line). A reclaim of that line could open the road to the first resistance area.
If the pair pulls back, the nearest support stands at 0.0259. That level roughly coincides with the broken channel boundary, which may soon flip into confirmed support.

Momentum broke out first. The three-day Relative Strength Index (RSI) escaped a long-term falling wedge, a bullish pattern, at the end of June. Price followed weeks later, a sequence that often validates trend reversals.
The RSI now reads around 57. Therefore, it has cleared the neutral zone and holds room to run before overbought territory near 70.

Analyst Michael van de Poppe called the move the pair’s first real advance in over a year. Still, he expects Bitcoin to lead in the short term.
Bitcoin Dominance Defends 60% and Delays the Rotation Signal
The monthly Bitcoin dominance chart frames the bigger picture. A long-term descending trendline has capped the metric since 2017, and each touch (blue circle) has started an altcoin season. The first came in 2017 near 80%, and the second in 2021 near 73%.
The third touch arrived in mid-2025, when dominance was rejected at 66%. The metric then slipped below the 0.236 Fibonacci retracement at 59.63%. However, it never reached the 0.382 level at 55.66%, let alone the 0.618 at 49.23%. A drop to those levels would put a full rotation in place.

The three-day chart sharpens the trigger. Dominance has moved sideways between 58% and 60.7% since August 2025. An ascending support line inside that range broke down at the end of May.
Dominance now retests the broken line from below, near 59.5%. The retest coincides with the long-term 0.236 Fibonacci level, creating a confluence of resistance. A rejection here could send the metric through the 58% floor and directly to 55.66%. In contrast, a reclaim would target 61% and delay the altcoin rotation, even as the index shows early momentum.

Benjamin Cowen, founder of IntoTheCryptoverse, offered a counterpoint in his contribution to BeInCrypto’s Market Intelligence expert council and the accompanying video analysis. He argues the classic rotation may never arrive this cycle.
“This is a cycle where Bitcoin topped on apathy rather than euphoria.”
According to Cowen, an apathy top leaves no crowd to rotate into riskier assets. He points to 2019 as the closest parallel and keeps October 2026 as his base case for the cycle bottom.
What Would Confirm Altcoin Season 2026
The ETH/BTC charts suggest a rotation is loading. Price and momentum broke their downtrends within weeks of each other, and softer inflation has supported risk appetite.
The dominance charts demand patience, though. Bulls need dominance rejected near 59.6%, followed by a break under 58% and a slide to 55.66%. Until then, ETH/BTC holding above 0.0259 keeps the setup alive, while a dominance reclaim of 61% would hand the cycle back to bitcoin.
The post ETH/BTC Breakout Fuels Altcoin Season 2026 Hopes as Bitcoin Dominance Holds 60% appeared first on BeInCrypto.
BitMEX once ruled crypto trading. Now it is shutting down. On September 23, 2026, the exchange that invented the perpetual swap will close for good. The reasons why BitMEX shut down go far beyond the vague review it blamed.
The closing looks calm, not a crash. But three forces pushed BitMEX to quit instead of sell. The same forces now threaten other exchanges too.
1. BitMEX Lost the Market It Built
Why BitMEX Shut Down Began With a Lost Market
BitMEX launched in 2014. It invented the perpetual swap, a trade that never expires. Almost every rival later copied the idea. For years, it was the top spot for leveraged crypto bets.
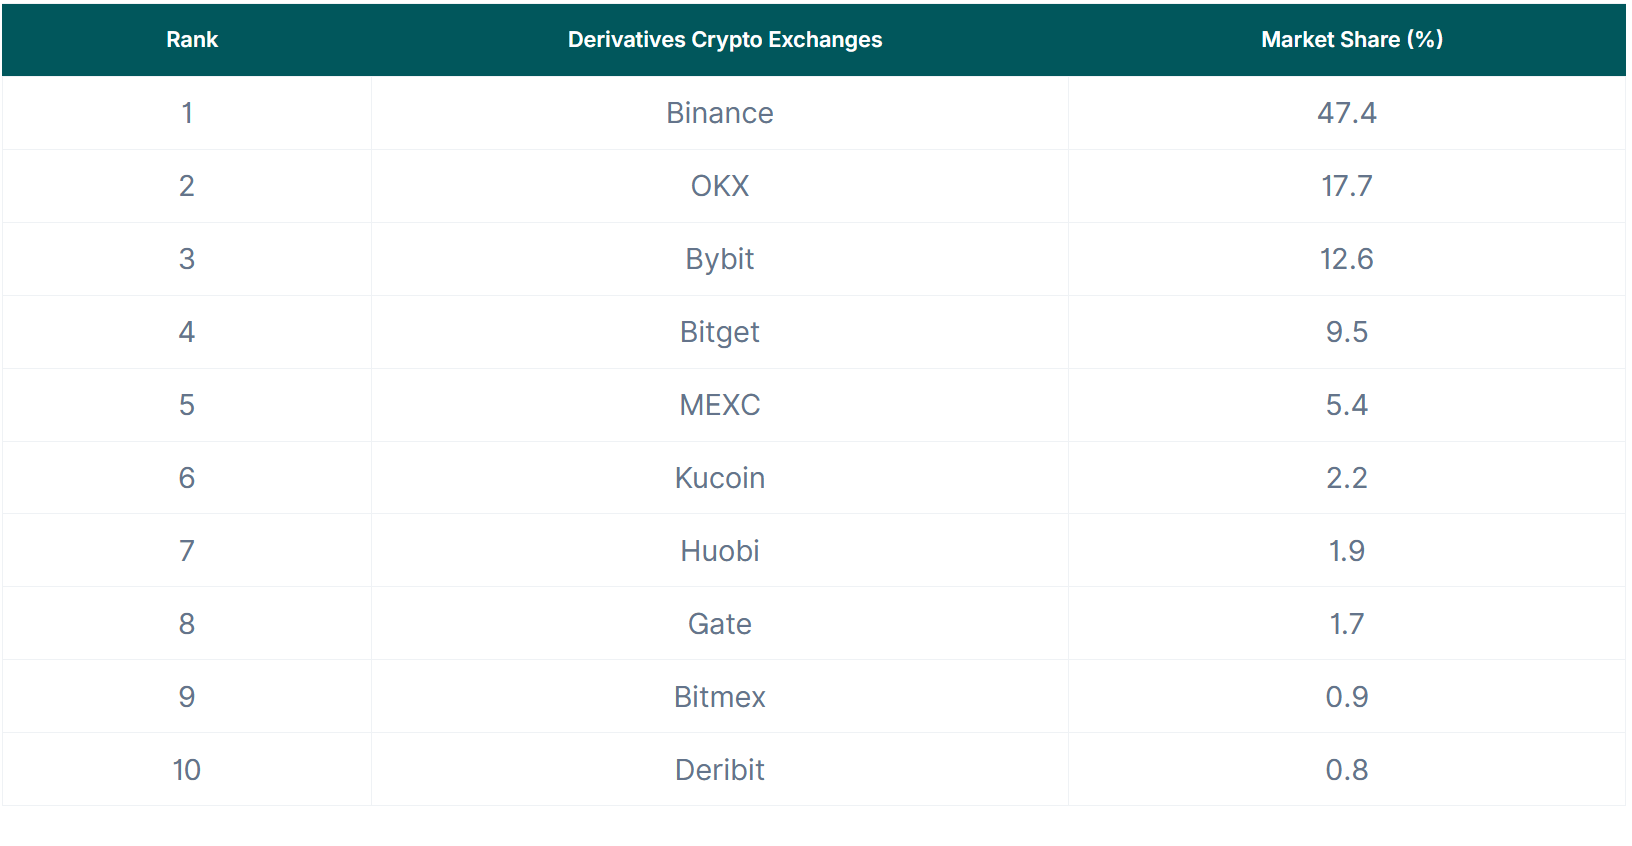
Then it fell behind. By August 2023, CoinGecko data ranked BitMEX 9th. It held just 0.9% of derivatives trades. Binance had 47.4%.

The slide kept going. This month, market tracker Kaiko put its share below 0.01%. Daily volume was about $400,000. Reuters reported the figures.
Traders go where other traders are. They left for bigger venues. BitMEX handed rivals its share of a market it once led.
2. No Buyer Would Take the Deal
A weak exchange can still be sold. BitMEX could not close a deal.
Crypto researcher Hasu has reportedly followed the firm since 2018. He says the exchange looked for a buyer from February 2025. No sale ever happened. Rivals, meanwhile, raised fresh capital from big finance.
The legal past scared buyers away. US regulators charged BitMEX and its founders in 2020 with weak anti-money laundering controls. All four fought the case, then pleaded guilty. They paid fines but avoided prison.
The bills piled up. A 2021 deal with two US regulators cost $100 million. In January 2025, BitMEX paid another $100 million in criminal fines and received two years of probation. President Donald Trump pardoned the founders in March. BitMEX announced its September shutdown this week.
3. A $270 Million Insurance Fund It Couldn’t Cleanly Sell
What the Insurance Fund and On-Chain Data Show.
Here is the deeper reason. Every leverage exchange keeps a safety pot. It is called an insurance fund. The pot pays out when a losing trade cannot cover itself. In busy times it grows, fed by scraps from closed-out trades.
BitMEX built one of the biggest. On-chain data tells the story. The fund peaked near 37,795 Bitcoin (BTC) in October 2021. Today, it holds about 3,694 BTC. It also holds roughly $30.8 million in Tether (USDT), a stablecoin. That is about 90% smaller than the peak.
BitMEX deliberately reduced the fund in November 2025. Even so, it kept far more cover than its rivals. Its cushion covered 0.88 times open bets. Binance covered just 0.11 times.

The fund was never in danger. On October 10, crypto had its biggest wipeout on record. Traders lost $19.35 billion due to forced sales, or liquidations.
BitMEX barely felt it. Its own report showed just $38.5 million of that on its books. The fund gave up only about $2 million.
So a big, healthy fund sat inside a dying exchange. That raised a simple question. Why keep so much cash in a business that is closing?

Analysts value what is left at nearly $270 million.
Hasu, like Martin, thinks the fund made BitMEX too hard to sell. He warned about its design back in 2018.
“It started as the golden goose, and then became the noose,” the researcher wrote.
Not everyone agrees. BitMEX calls the closure a business choice. On-chain, the fund has not moved since the news. Binance founder Changpeng Zhao (CZ) blamed years of US pressure instead.
A lawsuit landed the next day. Two former users say BitMEX took cash from their forced trades and fed the fund. They want about 623 BTC back in coins, not dollars. They point to a March 2020 outage. Users were locked out for 25 minutes while $800 million in bets were wiped.
“BitMEX announces it’s shutting down on Sept 23… then the NEXT DAY a proposed class action lands alleging the exchange deliberately designed its platform to FORCE LIQUIDATE customers and seize their bitcoin. Coincidence?” posed Ariel Givner, IP & corporate attorney in FinTech.
Who Could Be Next After BitMEX
BitMEX did not blow up like FTX, the exchange that collapsed in 2022. It closed while it still had the money to pay everyone. Even so, its exit is a warning.
The market keeps shrinking to a few winners. In 2023, the top three venues already ran about 78% of trades. That gap is wider now. Small players are getting squeezed.
The ones most at risk look alike:
- They offer high leverage.
- They hold little spare cash.
- They carry legal baggage.
- And they run a few other lines of business.
Much of this trading is also moving on-chain. The top perpetual futures venues there cleared trillions last year.
On-chain is not safe either. A TRM Labs report counted 207 hacks and about $972 million stolen in early 2026. In the October 10 crash, Hyperliquid alone saw $10.31 billion in liquidations.
Regulated rivals are moving in too. Kalshi launched the first US perpetual futures in May. Kraken added its own in June. Coinbase started a year earlier.
One big question remains. Where does the $270 million fund go after September? Neither BitMEX nor Arthur Hayes has said.
The lawsuit may force an answer.
For every other exchange, the lesson is simple. Stay relevant. Keep clean books. Be easy to sell. That may be what keeps you alive now.
The post 3 Real Reasons Why BitMEX is Shutting Down, and Who Could Be Next appeared first on BeInCrypto.

Strive’s SATA preferred shares have rebounded sharply after a late-June selloff, according to Yahoo Finance. The variable-rate perpetual preferred stock rose from a June low of $83.30 to roughly $97, recovering most of its declines and trading within about 3% of its $100 par value.
The rebound matters because SATA is part of a growing slate of Bitcoin-treasury-linked preferred-share products designed to keep their share price near par by dynamically adjusting dividend rates. For investors watching whether this “preferred equity for Bitcoin treasuries” model can hold up during market stress, the way SATA and peers respond to volatility may be the clearest near-term signal.
Key takeaways
- Yahoo Finance shows Strive’s SATA preferred shares recovered from a June low of $83.30 to around $97, nearing the $100 par value.
- SATA was introduced in November 2025 as Strive’s mechanism to fund expansion of its Bitcoin treasury through preferred equity rather than issuing more common shares.
- Similar products are emerging in the Bitcoin corporate sector; Strategy’s STRC launched in 2025 with a related “variable dividend near par” concept.
- Samson Mow argues that improvements across Bitcoin treasury balance sheets—and SATA’s return toward par—can help restore confidence in the broader preferred-share category.
- Data from BitcoinTreasuries.NET places Strive as the seventh-largest public Bitcoin treasury holder, with 19,921 BTC.
SATA’s move back toward par
Strive launched SATA in November 2025, framing it as a preferred-equity tool to support its Bitcoin treasury strategy. The company’s approach centers on a variable-rate perpetual preferred share: instead of relying on a fixed coupon, the dividend rate is designed to adjust so the security trades close to its $100 par value.
In practice, that structure gives the market a built-in adjustment lever during changing conditions. When investors re-price the expected dividend stream—whether due to interest-rate moves, crypto sentiment, or company balance-sheet expectations—SATA’s performance can reflect how well the variable dividend mechanism is restoring equilibrium.
After falling to $83.30 in June, the stock’s subsequent recovery to around $97 suggests sellers have largely faded and that the market may be recalibrating its view of the product’s stability.
Why preferred equity is gaining attention in Bitcoin treasuries
SATA is not an isolated concept. The same general idea—linking corporate capital-raising to Bitcoin treasury objectives while using preferred equity to manage dilution—has become a recognizable segment among companies that describe such structures as “digital credit,” an emerging framing that Cointelegraph has discussed previously in connection with Bitcoin-focused financing products.
Strive’s stated goal is straightforward: raise capital for its Bitcoin treasury without issuing additional common shares. For public equity holders, that can be a significant difference. Common-stock issuance can be dilutive in the near term, while preferred structures are often marketed as a way to finance growth while keeping the common share count stable.
That said, the market still has to price risk: preferred shares can be sensitive to how investors assess dividend durability, treasury management, and credit-like features tied to corporate performance. The question investors are effectively testing is whether the “variable dividend to par” design meaningfully limits downside during periods of broader risk-off sentiment.
Strategy’s STRC as a reference point
Strategy’s STRC provides a direct comparison point. Introduced in 2025 with a similar objective of maintaining a $100 share price through a variable dividend framework, STRC also fell sharply during the late-June selloff. However, it has not fully returned to par; Yahoo Finance shows STRC trading at about $87.
The divergence between SATA nearing par while STRC remains below it highlights an important reality: even products built on similar mechanics can experience different market trajectories depending on timing, investor expectations, and how quickly confidence returns.
Still, both examples appear to be rooted in the same investor promise—mechanical dividend adjustments supported by a treasury-focused balance sheet. If that promise continues to be validated, it could reduce the “model break” fear that emerges during drawdowns.
Market confidence and sector refinements
Speaking to Cointelegraph, Jan3 founder and CEO Samson Mow suggested that adjustments by Bitcoin treasury companies are starting to restore confidence in preferred-share products. He linked the broader improvement in this niche to ongoing efforts to strengthen balance sheets and encourage securities like STRC to move back toward par.
Mow’s core point was that market participants are looking for evidence that these structures can withstand volatility rather than requiring panic-driven repricing. In his view, when SATA returns to par, it could reinforce the argument that the overall model is functioning as intended—potentially supporting STRC’s path as well.
He also pointed to new entrants refining approaches to treasury management. As an example, Mow cited Lyn Alden’s Orange Juice treasury company, which launched on July 15 with plans to operate a Bitcoin treasury and with an explicit intent of running a lower Bitcoin cost basis through its own strategy.
For investors, the practical takeaway is not just that more products are appearing, but that the sector is iterating. The preferred-share idea is still young, and each cycle of stress tests can determine which variations earn durability in the eyes of the market.
Meanwhile, the underlying Bitcoin treasury competition remains a key backdrop. BitcoinTreasuries.NET data places Strive at seventh among public Bitcoin treasury companies, holding 19,921 BTC, while Strategy remains the largest with 843,775 BTC.
Going forward, traders and investors should watch whether SATA’s move near par translates into broader confidence for comparable products like STRC, and whether further treasury-linked preferred issuances continue to attract stable bids during risk-off periods. The durability of the variable-dividend-to-par mechanism—and investors’ belief in dividend resilience—will likely remain the central question.


The exchange, already sanctioned by the UK, is now on a list of 18 entities “providing crypto-assets services or payment services“ in defiance of the EU’s measures against Russia.
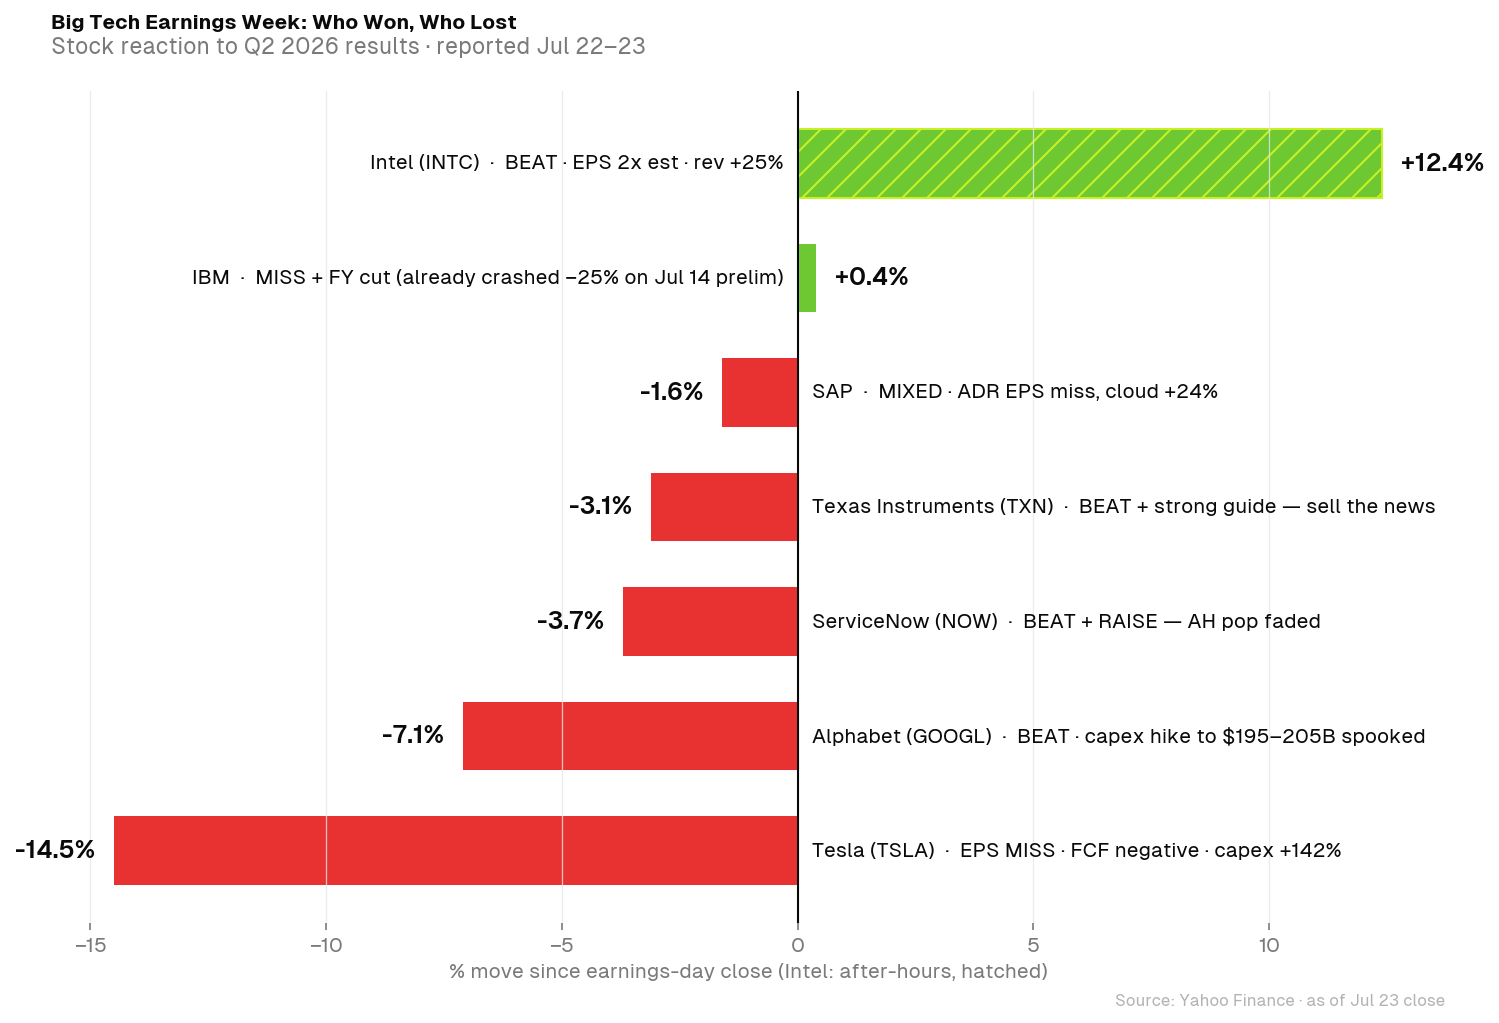
Big tech earnings week closed with a strange scoreboard. Most companies beat Wall Street’s estimates, yet almost every stock fell, and hundreds of billions of dollars in market value vanished in two sessions.

Four signals explain it better than the headlines. Price reaction, money flow, options positioning, and analyst revisions show who actually won the week.
Why This Big Tech Earnings Week Mattered
Seven heavyweights reported in four days. Texas Instruments opened on July 21, Alphabet, Tesla, IBM, and ServiceNow followed on July 22, and Intel and SAP closed the set on July 23.
The week doubled as the first real test of AI capital spending at scale, after earlier calls to dump tech into the reports. Investors wanted proof that record data center budgets are turning into profit.
Commentators estimated the megacap group shed $800 billion in a single day, the worst since April 2025.
Spending guidance now moves these stocks more than earnings do.
Who Won Big Tech Earnings Week?
Only two names left the week stronger. One won loudly on results, while the other won quietly on positioning.
Intel
Intel delivered the cleanest beat. Revenue rose 25% to $16.1 billion, its fastest growth in almost 15 years, and earnings of $0.42 per share doubled estimates. Consequently, the stock jumped more than 12% after hours.
Money tells a more cautious story. Chaikin Money Flow (CMF), a proxy for institutional money flow, sat at −0.13 into the print.

Barchart showed put/call open interest, the tally of contracts still held, at 0.96.This is a clear case of growing bearish hedging against Intel’s 0.6-0.75 baseline.

Analysts lifted targets without lifting ratings. Morgan Stanley kept its Hold at $84, and JPMorgan stayed at Sell at $85, per TipRanks.
ServiceNow
ServiceNow fell 3.7% in the session after its report, which looks like a defeat. The details argue otherwise. It beat on earnings, grew subscription revenue 24.5%, and raised its outlook.
CMF slipped to −0.10, so big money has not yet confirmed a recovery.
However, both put/call ratios fell after the print, from 0.54 to 0.42 on volume and 0.83 to 0.80 on open interest, showing bullish buildup.

Analysts raised targets at Bernstein and Evercore against a single KeyBanc Sell. Positioning treated the dip as an entry.
Who Lost the Week?
The losers shared one flaw, and it was not weak demand. Markets punished heavy spending harder than soft results.

Tesla
Tesla failed all four tests. Earnings of $0.33 per share missed the $0.51 consensus, free cash flow turned negative, and capital spending jumped 142%. The stock fell 14.5%, its worst session in over a year, capping a tense Tesla earnings preview week.
Money confirmed the damage. CMF worsened from −0.06 to −0.12, meaning sellers pressed harder on record deliveries.

Put volume climbed from 0.78 to 0.83 times calls, and at least six firms cut targets, including JPMorgan and UBS.
Alphabet
Alphabet posted the week’s best numbers and still lost. Alphabet’s July earnings showed revenue up 24% to $119.8 billion, with Cloud growing 82%, per CNBC. Yet management raised 2026 capital spending guidance to as much as $205 billion, and the stock dropped 7.1%.
That spending pushed quarterly free cash flow negative for the first time in over two decades, analysts noted, so shareholders are funding the AI buildout upfront.
The money left before the headlines did. CMF faded from 0.14 on July 20 to 0.03 after the report, so institutional buyers were stepping back all week. Analysts kept Buy ratings while JPMorgan, Piper Sandler, and UBS cut targets, and open interest edged up from 0.68 to 0.70.

Investors who had priced big earnings swings got exactly that, weeks after AI spending faced scrutiny.
Three Stocks Ended the Week Neutral
Three names finished in between, with signals pointing in opposite directions. That tension makes them the ones to watch.

Texas Instruments: The week’s broadest analyst raises, with JPMorgan going to $340, could not stop put volume doubling from 0.38 to 0.76.

Yet CMF improved to −0.03, so buyers absorbed the profit-taking dip. A mixed reaction, indeed.
IBM: It missed, cut guidance, and took the sharpest target cuts, including Morgan Stanley’s move to $190. Still, the stock closed green and CMF improved to −0.09, because the July 14 crash of 25% had already priced the pain.

The Put-Call ratio remains bullish.
Moreover, several Wall Street analysts still hold higher targets. Jefferies even assigned a post-result Buy.

SAP: Earnings on its American Depositary Receipt (ADR), the US-listed version of the German stock, missed while cloud backlog grew 27%.
Put volume collapsed from 1.99 to 0.60 as speculators exited, yet hedges rose to 1.10.

Here are all the key analyst targets, sourced directly from TipRanks.

The pattern from big tech earnings week is hard to miss.

Markets now reward companies that collect AI spending and punish those that write the checks. The week ahead will show whether money flow and fresh options data confirm Intel as the week’s loudest winner.
The post Big Tech Earnings Week is Over. Who Won and Lost? appeared first on BeInCrypto.

Pseudonymous crypto trader NoName says Ethereum has just crossed into the price zone where its bear market has historically bottomed, pointing to four straight lower highs as proof the downtrend has run its course.
The trader, who is buying through the dip with a long-term target of $7,000, argues that the same crowd psychology that made ETH everyone’s favorite trade at $4,900 is now working against it below $2,000.
Mapping Out the Bottom Zone
In a post shared Friday, NoName laid out Ethereum’s decline through four descending peaks: $4,957, then $3,400, then $2,460, then $1,950, calling it a textbook downtrend. Each top landed lower than the one before it, and the trader said that sequence has now pushed price into the $1,300 to $1,900 range, the zone treated as the eventual floor.
The reasoning is less technical than psychological, with the analyst noting that ETH at $4,900 was a favorite while ETH under $2,000 gets called a dead chain, even though nothing about the network changed. “That’s not logic, that’s psychology, and psychology marks bottoms,” NoName wrote, adding that the climb back up will likely be rough.
Other signals moved the same day, including a bullish crossover in ETH’s MVRV ratio against its 160-day moving average as pointed out by chartist Ali Martinez. That setup has come right before several major recoveries in the past by marking the end of distribution phases.
Meanwhile, Arab Chain reported that Ethereum’s 30-day funding rate average on Binance climbed roughly 0.00339, its highest reading in six months, with ETH trading near $1,920 at the time, a sign of improving sentiment though not yet at levels tied to past corrections.
The world’s second-largest cryptocurrency was itself changing hands just below $1,900 at the time of writing, per CoinGecko data, up close to 12% over the past month but still 62% below the $4,946 all-time high it hit last August. The token slipped from a seven-week high near $1,950 earlier this week and needs to reclaim $2,000 to build any further push.
Not Everyone Is Convinced the Bottom Is In
CryptoQuant struck a more cautious note on Thursday, noting that ETH was trading roughly 17% below its realized price but that only two of five bottom-signal metrics it tracks have reached historical extremes. “Capitulation is still missing,” the platform said.
Whale buying has continued regardless. Lookonchain tracked a wallet purchasing 27,000 ETH worth $52 million through Galaxy Digital’s OTC desk, and Arthur Hayes, whose BitMEX exchange recently announced it will be shutting down in September, added another 644 ETH, bringing his total over eight days to 3,270 ETH.
At the same time, spot Ethereum ETFs have pulled in over $408 million this month, and Kalshi traders are pricing ETH near $3,200 by year’s end.
But not every path lines up with NoName’s. Analyst Nonzee expects one more rally toward $2,000, or $2,200 if Bitcoin climbs to $70,000, but calls that level a bull trap rather than a real breakout, with a drop toward $900 to $1,300 still likely first. His long-term target, though, lands in the same place as NoName’s: $7,000.
The post Ethereum Bear Market Bottom Is In: Analyst Eyes $7K Long-Term appeared first on CryptoPotato.


- Ethena (ENA) is testing critical support at $0.085.
- A 290M ENA wallet transfer raised selling concerns.
- Bitcoin’s next move could determine ENA’s direction.
Ethena is back in focus after a large wallet transfer drew attention at a time when the token is already testing a crucial price level.
While the transfer sparked concerns about potential selling pressure, the broader market reaction has remained measured.
ENA tests key support as whale transfer attracts attention
Ethena was trading at $0.08695, down 2.4% over the past 24 hours, after moving between $0.08530 and $0.09125 during the session.
Although the daily decline has put pressure on the token, ENA is still up 8.3% over the past seven days and 11.1% over the last two weeks, showing that it has recovered part of the losses recorded earlier this year.
The latest market attention came after a wallet linked to Ethena’s Coinbase custody holdings transferred approximately 290 million ENA, valued at about $26.4 million, to another wallet that has previously interacted with cryptocurrency exchanges.
Today, Ethena’s Coinbase custody wallet (0x631) transferred 290m $ENA, worth $26.41m, to the personal wallet 0xfDD.
Based on its transaction history, wallet 0xfDD typically transfers ENA to personal wallets, which are then used to sell the tokens on Binance and Coinbase.… https://t.co/CkCGU73kLv pic.twitter.com/jkB8dFUNEG
— Nazoku (@Nazo_ku) July 23, 2026
Transactions of this size often raise concerns because they can precede exchange deposits and increased selling activity.
However, the transfer alone did not trigger an immediate wave of selling.
Market data showed that exchange netflows remained negative, meaning more ENA continued leaving exchanges than entering them. That suggests the transaction has not yet translated into confirmed selling pressure in the spot market.
The transfer has therefore become an important signal for traders rather than confirmation of a bearish trend.
Focus is now on whether additional transfers to centralised exchanges follow in the coming sessions.
Falling trading volume points to weak selling conviction
Another notable development is the decline in trading activity.
ENA recorded approximately $89.4 million in 24-hour trading volume, while recent market data showed that daily trading activity had dropped by more than 40% compared with previous sessions.
Lower trading volume during a price decline often indicates that sellers are becoming less aggressive rather than accelerating their positions.
While this does not guarantee a reversal, it also means the recent weakness has not been accompanied by unusually strong conviction from the market.
The token’s historical price action also provides additional context.
ENA reached an all-time high of $1.52 in April 2024 but currently trades about 94.3% below that level.
At the same time, it remains roughly 23.4% above its all-time low of $0.07023, recorded on June 30, 2026.
These figures highlight that ENA continues to trade much closer to its recent lows than its previous peak, making current support levels particularly significant for short-term price direction.
$0.085 remains the level traders are watching
From a technical perspective, $0.085 has emerged as the most important near-term support level.

A sustained move below this area, especially if accompanied by rising trading volume, would increase the likelihood of a decline toward the next major support around $0.080.
On the upside, resistance is beginning to form between $0.093 and $0.096.
Price data also shows a concentration of short liquidation levels just above $0.093, meaning a successful breakout through that region could trigger additional buying as short positions are forced to close.
For now, ENA remains caught between these two key technical zones, leaving traders focused on confirmation rather than anticipation.
Bitcoin’s next move could shape ENA’s direction
Beyond token-specific developments, Bitcoin continues to play an important role in ENA’s short-term outlook.
Market participants are watching whether Bitcoin can remain above $64,000, as broader weakness in the largest cryptocurrency has weighed on sentiment across the digital asset market.
If Bitcoin stabilises, buying interest could return to several altcoins, including ENA.
Conversely, continued weakness in Bitcoin would increase pressure on support levels that are already being tested.
That makes Bitcoin’s price movements an important external factor alongside the developments surrounding the large ENA wallet transfer.
Ethena also continues to maintain strong protocol activity, with approximately $3.992 billion in total value locked (TVL).
While TVL reflects ongoing capital committed to the protocol, traders are currently placing greater emphasis on price action, exchange flows, trading volume, and macro market conditions when assessing ENA’s next move.
For now, attention remains fixed on three developments: whether the $0.085 support can hold, whether the 290 million ENA wallet transfer eventually results in meaningful exchange deposits, and whether Bitcoin can provide enough market stability to support a broader recovery.


The US House of Representatives has passed a congressional stock-trading ban by a 232-198 vote, sending the measure to the Senate despite criticism that it leaves existing holdings untouched.
Summary
- The House passed the Stop Insider Trading Act in a 232-198 vote.
- Elizabeth Warren criticized loopholes allowing lawmakers to retain and sell existing stocks.
- Bryan Steil has proposed similar restrictions for congressional prediction-market wagers.
According to a statement from Representative Bryan Steil’s office, the House approved the Stop Insider Trading Act on Wednesday, July 22. The Wisconsin Republican introduced the legislation in January and urged senators to send it to President Donald Trump for his signature.
Under the bill, members of Congress, their spouses and dependent children would no longer be allowed to buy securities issued by publicly traded companies. The restriction would apply to new purchases, but lawmakers and their relatives could retain stocks already in their portfolios.
Existing shares could still be sold, provided the owner files a public notice before the transaction. The bill requires notice at least seven days and no more than 14 days before a planned sale, with filings submitted to the clerk of the House or the secretary of the Senate.
Steil presented the proposal as a way to prevent lawmakers from using information obtained through public office for personal gain. Speaking after its passage, he called the bill “a major step forward for ethics reform on Capitol Hill.”
Penalties would combine a financial charge with the loss of trading profits. Congressional ethics committees would impose either $2,000 or 10% of the covered investment’s value, whichever amount is higher, while violators would also have to surrender any profit earned from a prohibited transaction.
During the House debate, Steil noted that lawmakers had not previously received a comparable opportunity to vote on the issue. The bill secured bipartisan support, though the 232 votes in favor represented only a narrow share of the chamber.
Senate opposition threatens the stock-trading ban
After receiving the legislation on Thursday, the Senate became the next obstacle for Steil’s proposal. Senator Elizabeth Warren, a Massachusetts Democrat who has backed stricter limits on congressional trading, rejected the House language because it would permit officials to keep and sell stocks they already own.
“The bill has major loopholes,” Warren wrote on Thursday, adding that the current version was “not gonna fly in the Senate.” She argued that members of Congress should be barred from owning, buying or selling individual stocks rather than facing restrictions limited mainly to future purchases.
Steil has defended the advance-notice requirement as a deterrent against trades based on confidential information. Because a planned sale would become public before execution, lawmakers could face scrutiny over the transaction and any government action connected to the company.
Warren’s objection, however, points to a basic difference between the two approaches. Her preferred restriction would force lawmakers out of individual stock ownership, while the House bill would let current portfolios remain in place and regulate how their holdings are sold.
The proposal also covers fewer federal officials than the ethics language being considered as part of the Digital Asset Market Clarity Act. Steil’s stock bill applies to Congress and the immediate family members specified in the text, leaving the president, vice president and their families outside its restrictions.
A revised 616-page CLARITY Act draft takes a different approach to crypto-related conflicts. According to the proposed text reported this week, covered federal officials, including the president, vice president, lawmakers and federal judges, would be prohibited from issuing or sponsoring digital assets through Jan. 20, 2029.
Crypto intermediaries would also be prevented from listing assets issued or sponsored in violation of those provisions. Unlike the permanent trading rules proposed by Steil, CLARITY’s ethics restrictions would expire on the specified 2029 date.
Prediction-market rules target similar conflicts
Alongside the stock legislation, Steil has proposed a separate measure covering wagers made through prediction platforms such as Kalshi and Polymarket. The House Administration Committee chairman introduced the Stop Lawmakers from Predicting Act on June 18, citing the risk that officials could profit from information unavailable to the public.
According to the House Administration Committee, the legislation would prevent members of Congress, their spouses and dependent children from wagering on political outcomes or public-policy questions. Steil argued that lawmakers should write policy rather than place bets on its outcome.
Its penalty structure closely follows the House-approved stock bill. A violation would carry a charge equal to $2,000 or 10% of the prohibited wager’s value, whichever is higher, plus forfeiture of the net gain from the contract.
Public scrutiny of prediction markets has increased following reports of users profiting from political information. One reported case involved a soldier who allegedly earned more than $400,000 from contracts linked to Venezuelan President Nicolás Maduro’s removal by US forces in January.
A former Trump teleprompter operator was separately reported to have made more than $90,000 from Kalshi contracts tied to words and phrases used during the president’s speeches. Arizona officials later cited the reported activity while tightening rules against government employees using nonpublic information on prediction platforms.
Steil’s two proposals apply the same principle to different financial products: congressional officials should not be able to turn privileged knowledge into personal returns. Their progress now differs, however, as the stock bill awaits Senate action while the prediction-market measure remains at an earlier stage of the legislative process.

Once again, Litecoin has become an area of focus as the crypto nears a crucial technical resistance level that will dictate whether it moves on a fresh trend direction. For months, Litecoin has been consolidating inside a descending channel, but recently, the crypto has started signaling growing strength amid continued support from buyers at key levels.
While the breakout is yet to be confirmed, positive developments in terms of price structure, derivatives positioning, and increasing buying activity have shifted the market’s interest to the prospect of a breakout move.
Descending Channel Set for a Tough Test
As per technical analysis provided by ZAYK Charts, Litecoin faces a critical test against the upper boundary of the well-established descending channel that has been constraining price moves upwards for many months. Sellers repeatedly defended resistance during the course of the correction and created lower highs and lows along the way.
In recent weeks, though, the market structure has improved. The buyers managed to defend the support level of the descending channel in June and since then formed a pattern of higher swing lows. Instead of making sharp retracements after rallies, Litecoin trades close to resistance, indicating increasing buying pressure.
This sort of price action is frequently indicative of improving market sentiment, although most technical analysts would consider a daily close above resistance to be necessary to confirm a breakout. Should that be seen, the measured move from the descending channel is estimated at around 31% upside. Chart projections do not guarantee anything about future performance but give technical targets based on the completed price action patterns.
Price Action Stays Positive
As of writing, Litecoin is currently priced at about $47.10, marking a 1.39% price gain in the current trading session. The session kicked off near the $46.40 level, where buyers formed a consolidation area, then slowly moved prices above the psychologically important level of $47.00.
The momentum continued to build throughout the session and allowed Litecoin to touch an intraday high near the $47.55 level. After some profit-taking took place, buyers still managed to hold on to the $47 mark, which allowed prices to move sideways between about $47.10 and $47.30, without much selling pressure.
A slow upward movement is perceived as better compared to a quick spike, as it could indicate real buying interest rather than speculation momentum.
However, there is one crucial element that is missing from the equation so far. Daily trading volume fell by about 12.8% to around $187.46 million, suggesting that there is not enough participation in the rally from the whole market yet.
Liquidations Point to a Healthy Market
In addition to the price movement, Litecoin’s derivative market also shows some positive signs. The recent liquidation figures indicate that excess leverage has gradually been stripped away from the market after two major corrections.
The biggest surge of long liquidations was recorded at the end of January and beginning of February, where leveraged positions incurred losses of around $10.86 million. This led to a further decline of prices due to traders being squeezed out of their positions.
The other liquidation instance was observed in late May to early June, during which the price of Litecoin moved down from around $49 to about $42-$43 range. After the correction, the volume of liquidations began to normalize, implying that most of the speculative leverage had been stripped away.
The short-side liquidations have been relatively low during the same period, indicating that the bull traders had mostly covered themselves in the market’s forced changes.
Reduced liquidation activity makes the market a healthier one as the price changes will not be driven by excess leverage but market demand.
Breakout Confirmation Remains The Critical Indicator
The Litecoin technical picture continues to show signs of improvement, with buyers defending important levels of support amid continued resistance from the long-term descending resistance. As the technicals continue to favor buyers, with reduced risks of leverage, the emphasis has been on confirmation of the breakout.
However, despite the positive technicals mentioned above, there has not yet been an outright daily close above the channel resistance. Until that happens, that will be the important resistance for the moment. If buyers succeed in breaking that level with conviction, it would signal a move towards more bullish levels for Litecoin.

7 Financial Milestones to Hit By 45 (Even If You Started Late)

Nvidia, Microsoft urge US to protect open AI models amid policy debate

Samson Mow says SATA rebound could pull Strategy’s STRC to par

Renter of Home in Anne Heche Crash Denies Settlement With Son

No Jackpot Winner as $257 Million Prize Rolls Over to $269 Million Monday Draw

Weekend Open Thread: Staud – Corporette.com
7 Financial Milestones to Hit By 45 (Even If You Started Late)

Money by Rob Moore | Complete Book Summary in Hindi | Know More Make More Give More | Story Reads

The Next Financial Crisis Isn’t In Banks. It’s In Insurance & Private Credit | Nick Nemeth
-
 Crypto World7 days ago
Ripple Payments Joins MiCA With 14 Firms, Does It Mean Anything For XRP?
-

 Politics7 days ago
The House | The City of London can help the new chancellor deliver growth in every postcode
-

 Fashion5 hours ago
Weekend Open Thread: Brooks Brothers
-

 Politics5 days ago
Democrats look to World Cup watch parties to register thousands of voters
-

 Crypto World4 days ago
Grayscale Files For Worldcoin ETF, WLD Registers Sharp Rise
-
 Tech4 days ago
Sail Virtually Aboard The “Itanic” With IA-64 Emulator
-

 NewsBeat4 days ago
Unregistered fitter used Gas Safe logo on business flyers
-
 Tech4 days ago
Turtle Beach Command Series KB7 review: a nifty screen-equipped gaming keyboard
-

 News Videos5 days ago
Big Money Is Entering XRP
-
 Business3 days ago
New Jersey voter registration controversy explained: How 6,600 noncitizens got on the rolls, and what happens next
-

 Crypto World6 days ago
Kaspersky exposes OkoBot’s 20-module crypto wallet attack
-
 Entertainment3 days ago
Johnny Depp’s R-Rated Gothic Cult Classic Gets New Release Ahead of Sydney Sweeney Remake
-

 NewsBeat7 days ago
Durham County Council to send out electoral registration emails
-

 Crypto World2 days ago
Ethics, other provisions in crypto Clarity Act to be further discussed
-

 Crypto World7 days ago
MiCA Licensing Faces Delays as ESMA Adds 14 CASPs to Register
-

 Crypto World7 days ago
Chip Stocks Enter Bear Market After Moonshot Ai Unveils Kimi K3 Model
-
 NewsBeat4 days ago
Shanghai science forum photos show China’s AI and robotics advances in rivalry with US
-

 Tech4 days ago
Watch Flock Safety CEO Garrett Langley discuss the future of surveillance at TechCrunch Disrupt 2026
-

 Tech5 days ago
Subway Sandwich Computers Get a Second Life as Gaming Machines
-

 Tech4 days ago
The 35 Best Board Games for Family Game Night
You must be logged in to post a comment Login