

Crypto World
Ripple (XRP) Keeps Dominating ETF Flows, but Cracks Are Starting to Show
There seems to be a clear winner in terms of investors’ behavior toward crypto-based exchange-traded funds, and it’s not the two market leaders, BTC and ETH.
The financial vehicles tracking the performance of Ripple’s cross-border token continue to defy the overall market weakness with another week in the green. The HYPE ETFs also marked another positive week, but it was a significant decline from the previous one.
Ripple ETF Streak on Track
After the impressive end to the previous business week, in which investors poured $15.63 million into the spot XRP ETFs on Friday, hopes for another strong start were high. And the numbers provided by SoSoValue show that reality wasn’t far away, as another $15.34 million entered the ETFs on Monday.
However, the trend changed on Tuesday and Wednesday. Net withdrawals dominated, with investors pulling out $2.83 million and $1.86 million, respectively. This was a rare occasion since the funds have not seen too many red days lately despite the broader ETFs’ trend. The last one was a month ago, on June 3.
Moreover, the last time when there were two consecutive days in the red was nearly three months ago, in early March. However, unlike the events back then, the tides reversed once again, as the funds saw $6.55 million net inflows on Thursday (the last trading day of the week due to the July 4 holiday).
Consequently, the week ended well in the green again, with net inflows of $17.19 million. Thus, the spectacular streak of green-only weeks continues, as the last one (barely) in the red was in late April/early May.
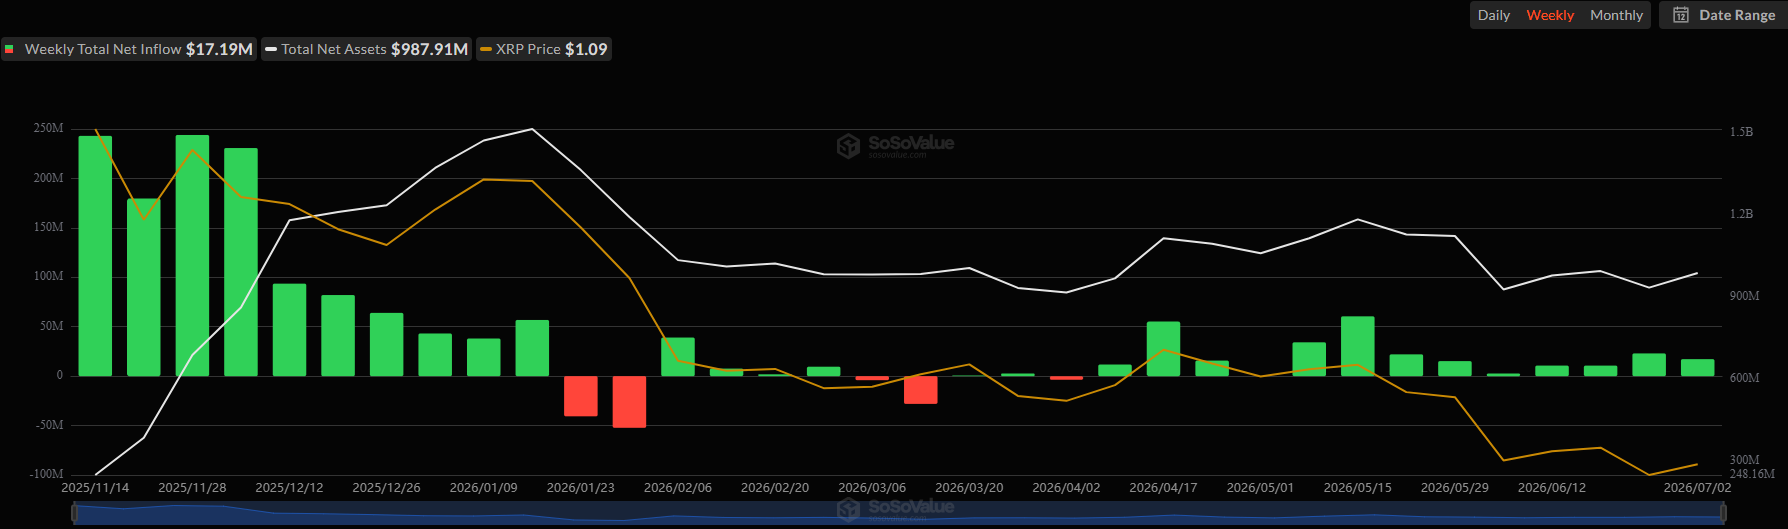
Perhaps driven by the positive developments on the ETF scene, the underlying asset’s price has risen by over 8% in the past week and now sits close to $0.15.
HYPE ETFs Also in the Green
The HYPE ETFs also enjoyed the last full business week of June, seeing a massive net inflow of $111.36 million, which was by far the largest ever. Although the past four-day business week was also in the green, it was a lot more modest, with just $4.32 million entering the funds.
Nevertheless, the cumulative total net inflows sit at an all-time high of almost $300 million, despite the $3.01 million leaving the ETFs on Tuesday.
The post Ripple (XRP) Keeps Dominating ETF Flows, but Cracks Are Starting to Show appeared first on CryptoPotato.


Bitcoin traded near $62,675 on July 5, according to crypto.news market data. The asset was up about 0.1% over 24 hours and 4.03% over seven days. Its market cap stood near $1.26 trillion, while 24-hour volume was about $17.57 billion.
Summary
- Bitcoin trades near $62,675 as traders test whether the weekly 200MA can still hold firm.
- Saylor’s “digital energy” post added a macro angle while technical analysts focused on resistance overhead.
- ETF inflows and short squeezes lifted sentiment, but weak volume keeps confirmation limited for now.
The latest 24-hour range showed Bitcoin moving between $62,462 and $63,383. That kept BTC close to the $63,000 area after a short-term rebound from the late-June low near $58,000 to $59,000.
Michael Saylor added to the wider market discussion with a short post on X, saying “Bitcoin is Digital Energy.” The comment came days after he argued that Bitcoin’s long-term role depends on capital markets, credit and institutional adoption.
Shorts cleared near $63K
Trader Daan Crypto Trades said Bitcoin shorts were cleared twice as price moved toward $63,000 on July 4. He called the move a “classic short squeeze,” where sellers are forced to close positions as price rises into a crowded short zone.
He also raised doubt over the next move, asking whether “$62.6K (Weekly 200MA) holds as support” or whether the move only cleared liquidity before another pullback. That level now sits near the center of the short-term Bitcoin debate.
Crypto.news reported that Bitcoin had already rebounded near $61,700 after U.S. spot Bitcoin ETF inflows returned. The report said BTC needed to reclaim $62,800 and $65,000 to confirm stronger bullish momentum.
That framework remains useful as price trades near $63,000. Holding above the weekly 200MA may support the recovery, while a failure could bring attention back to $60,000 and the late-June low area.
Falling wedge keeps breakout hopes alive
Analyst BATMAN said Bitcoin remains inside a daily falling wedge while the RSI shows a bullish divergence. In simple terms, price made lower lows, but momentum did not fall with the same force.
The analyst said this may show that bearish pressure is fading. He also pointed to the $67,500 to $71,000 area as a bearish imbalance above current price, where Bitcoin may seek liquidity if a confirmed breakout occurs.
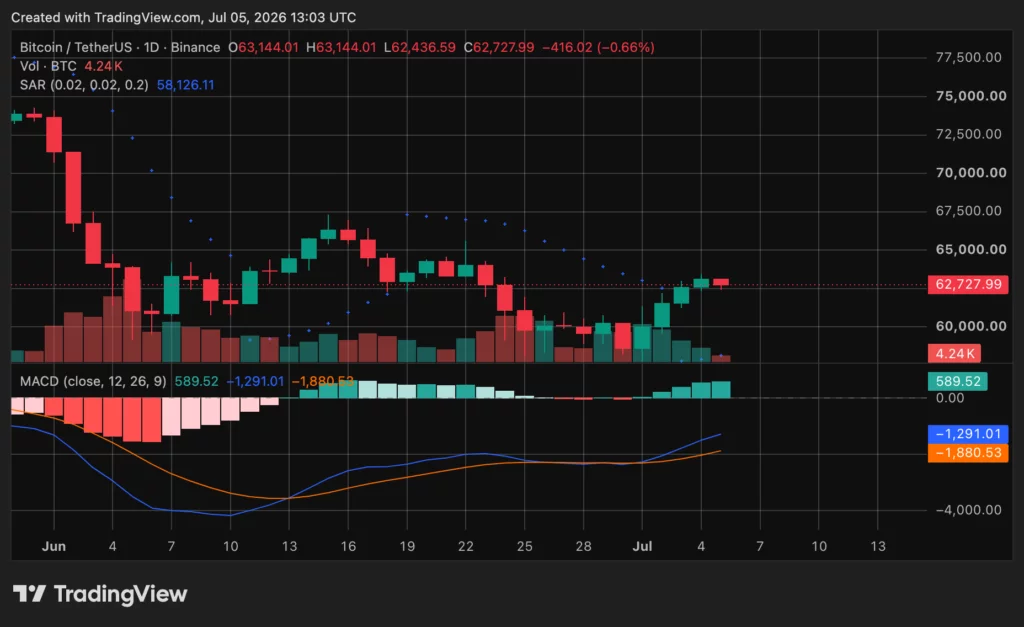
The daily BTC/USDT setup shows a short-term recovery after the bounce from the $58,000 to $59,000 zone. The latest daily candle was slightly red near $62,700, showing hesitation after the rebound.
The Parabolic SAR sits below price near $58,126, which keeps the short-term structure supportive. A move below that area would weaken the recovery and bring sellers back into focus.
Momentum improves, but volume stays weak
The MACD has improved. The histogram is positive near 589.52, and the MACD line is above the signal line. This shows that bullish momentum has returned after the recent bounce.
Still, both MACD lines remain below the zero level. That means the wider trend has not fully turned bullish. It shows recovery momentum, not a confirmed trend change.
Volume also remains low at about 4.24K BTC on the chart reviewed. That limits confirmation behind the rebound. For a stronger move, Bitcoin would need higher volume and a clear break above the $63,000 to $65,000 resistance zone.
source: TradingView
The downside levels remain clear. Bitcoin must hold $62,600 to keep the short-term squeeze alive. Below that, traders may watch $60,000, then the $58,100 to $58,500 zone near the Parabolic SAR and recent lows.
Saylor’s Bitcoin view meets market caution
Saylor’s “digital energy” post fits his wider Bitcoin view. Crypto.news recently reported that Saylor has called for balance between adoption, innovation and stability as companies, banks and governments build around Bitcoin.
Crypto.news also reported that Saylor has argued Bitcoin’s old four-year cycle is losing control, with capital flows now shaping BTC more than miner issuance alone. That view places more weight on ETF flows, corporate treasury moves and credit markets.
For now, the market remains technical and cautious. Bitcoin has squeezed shorts and recovered from late-June lows, but it still needs a clean move above $65,000 to improve the broader chart.
Until that happens, the key test is simple. BTC must hold the weekly 200MA near $62,600, defend the $60,000 area, and attract stronger volume before traders can treat the rebound as more than a liquidity move.
Ethereum traded near $1,764.43 on July 5, according to crypto.news market data. The token was up 0.2% over 24 hours and 11.58% over seven days. Its market cap stood near $212.91 billion, while 24-hour volume was about $11.16 billion.
Summary
- Ethereum remains trapped between $1,700 support and $1,800 resistance as liquidation clusters frame price action.
- Vitalik Buterin’s Lean Ethereum roadmap focuses on STARKs, quantum resistance, privacy and future scalability.
- ETH’s MACD shows improving momentum, but weak volume keeps a confirmed bullish reversal out of reach.
The latest daily range showed ETH moving between $1,751.18 and $1,801.59. That placed the token close to the $1,800 resistance area after a recovery from the June low near $1,500.
ETH/USDT remains in a broader downtrend from the May highs. Still, the short-term chart has improved after buyers defended the $1,500 region and pushed price back above $1,700.
Liquidation clusters keep ETH boxed in
Traders are watching two large liquidity zones around Ethereum. One sits above price near $1,800 to $1,830, while another sits below around $1,700. This keeps ETH inside a narrow range where quick moves can reverse fast.
One trader said, “As long as Ethereum stays in this range, I’d expect chop and fakeouts.” The same view points to a bigger move only after one side of the liquidity zone gets cleared.
Crypto.news previously reported that Ethereum liquidation heatmap data showed large leverage clusters near $1,700 to $1,760 and another major zone near $1,800. Those levels remain close to the current price range.
Professor Crypto also said ETH has started to build momentum after defending the $1,500 area. He said bulls need to reclaim and hold $1,800 before the market can target $1,900 to $2,000.
Momentum improves, but confirmation is limited
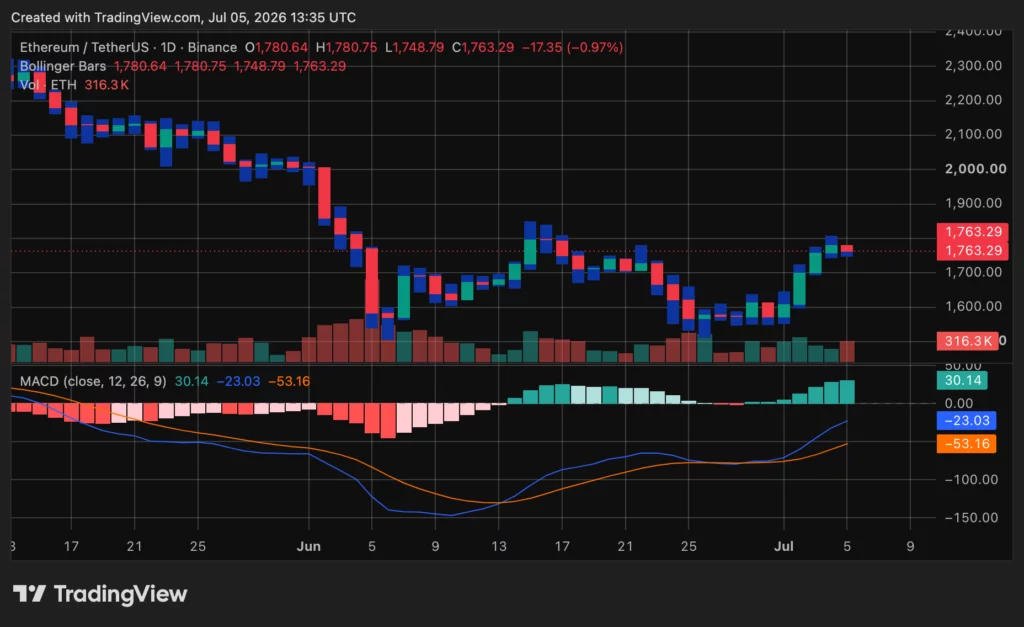
The daily chart shows ETH struggling to extend above $1,780 to $1,800. The latest candle opened near $1,780.64, reached $1,780.75, and dipped to $1,748.79 before stabilizing.
Nearby support sits around $1,700. A loss of that level could return focus to $1,600 and then $1,550. A clean break above $1,800 may bring $1,830 to $1,850 into focus.
The MACD continues to improve. The histogram is positive near 30.20, while the MACD line stays above the signal line. That shows short-term bullish momentum.
Still, the MACD line remains below zero. This means ETH is in a recovery phase, not a confirmed trend reversal. Volume near 315,730 ETH also remains moderate, so buyers still need stronger activity to confirm continuation.

Source: TradingView
Crypto.news reported that Ethereum recently targeted $1,800 after a rare TD buy signal. The report also said failure to hold $1,700 could return focus to $1,650 and the lower support area near $1,500.
Vitalik’s Lean Ethereum roadmap adds long-term focus
Ethereum’s price action also came as Vitalik Buterin shared a new long-term roadmap called Lean Ethereum. The plan focuses on faster verification, stronger security and better scalability over the next several years.
The roadmap includes native recursive STARKs, post-quantum cryptography, new virtual machine designs and a larger state architecture. Reports also said the upcoming Glasterdam upgrade may raise Ethereum’s gas limit.
The plan does not guarantee short-term price gains. It does, however, shift part of the discussion away from daily ETH moves and toward Ethereum’s technical future.
For now, ETH traders remain focused on the same near-term levels. Ethereum needs to hold $1,700, break $1,800, and attract stronger volume before the recovery can target the $1,900 to $2,000 zone.

Key Takeaways
- ASTS shares are hovering near $85.13, while optimistic projections suggest a fair value reaching $170 — approximately 50% upside from present levels
- Recent achievements include full operational status for BlueBird satellites and establishment of a subsidized joint venture with Rakuten in Japan
- CNBC’s Jim Cramer labeled ASTS “a great speculative stock,” expressing confidence the firm could achieve profitability in under two years
- While Pictet Asset Management boosted holdings by 146.8% during Q1, Wall Street consensus remains at “Reduce” with a mean target of $85.09
- Company insiders have liquidated more than $280 million in stock over the past quarter, with the CFO alone selling $4.3 million worth in June
AST SpaceMobile (ASTS) started Friday’s session at $85.13, almost perfectly aligned with the Street’s consensus price objective of $85.09 — creating an intriguing juncture for evaluating the investment opportunity.
The satellite communications company has experienced significant developments recently. The firm’s BlueBird satellite constellation has achieved full operational capability, while simultaneously finalizing a Japanese joint venture partnership with Rakuten that includes government financial support. These represent tangible achievements for an enterprise still advancing toward full commercial deployment.
Looking at recent performance, ASTS gained 19.15% over the trailing week. However, extending the timeframe to 30 days reveals a contrasting narrative — shares declined 20.65% across that period. The 12-month view shows an 86.69% advance, demonstrating substantial longer-term appreciation despite recent volatility.
The Bull Case: $170 Valuation Target
An optimistic analyst framework establishes fair value at $170 per share — representing nearly 100% potential appreciation from current trading levels. This projection depends on AST successfully expanding its BlueBird satellite network, transforming carrier agreements into stable recurring revenue streams, and ultimately achieving telecommunications-scale operations. The valuation employs a 7.108% discount rate.
The company’s financial position lends some credibility to this outlook. According to March 31, 2026 figures, AST maintained approximately $3.5 billion in cash reserves, with management stating no plans for additional convertible debt issuance during the current year. For a company in aggressive expansion mode, this represents considerable financial flexibility.
Yet valuation concerns persist. The price-to-book ratio stands at 12.2x, dramatically exceeding the US telecom sector’s 1.6x average. Even relative to immediate competitors at 12.6x, the premium appears justified only marginally. This represents an elevated multiple for an enterprise still generating substantial losses.
Wall Street Split, Executives Exiting
Analyst opinions vary considerably. Roth MKM maintains a buy recommendation with a $108 price target. Barclays holds an underweight stance at $65. Deutsche Bank downgraded from buy to hold while reducing its target to $106. UBS remains neutral at $80. MarketBeat’s aggregated consensus settles on “Reduce.”
First quarter results disappointed investors. AST disclosed a per-share loss of $0.66, substantially missing the consensus forecast of -$0.23. Revenue totaled $14.73 million versus analyst expectations of $39.01 million. Despite year-over-year revenue expansion of 1,952%, the significant shortfall drew attention.
Insider transaction activity has been uniformly negative. Over the previous three months, company insiders liquidated more than 3.1 million shares totaling approximately $280.6 million. CFO Andrew Martin Johnson sold 45,809 shares at $93.81 per share on June 11, decreasing his position by 8.34%.
Institutional activity presents a contrasting picture. Pictet Asset Management expanded its stake by 146.8% in Q1, concluding the quarter holding 79,666 shares worth $6.6 million. Total institutional ownership represents 60.95% of outstanding shares.
Jim Cramer offered his perspective recently, characterizing ASTS as “a great speculative stock” while expressing belief the company could reach profitability within a two-year horizon. He positioned it as a high-risk, high-conviction play — emotion-driven rather than data-driven.
The 52-week trading range extends from $36.08 to $133.86. The 50-day moving average sits at $87.38 while the 200-day moving average is $89.44. Current analyst projections anticipate a full-year per-share loss of $1.47.


South Africa’s tax authority, the South African Revenue Service (SARS), has published draft guidance that explains how crypto assets should be taxed under the country’s existing income tax and capital gains tax frameworks. The proposed rules—released on Wednesday—aim to offer interpretive clarity rather than create entirely new obligations.
In a draft notice issued for public comment, SARS indicates that many common crypto activities, including trading, swapping and using crypto to pay for goods or services, are likely to be treated as disposals for tax purposes. However, the tax outcome would still depend on the taxpayer’s specific facts and circumstances, with the guidance stressing that intention and conduct over time matter.
Key takeaways
- SARS says crypto should generally be treated as an intangible asset, not legal tender or foreign currency, for tax purposes.
- Many crypto activities may trigger tax events because they can be viewed as disposals under existing income tax and capital gains tax rules.
- Whether someone is a trader or a long-term investor hinges on behavior, transaction frequency, and the purpose of holding crypto.
- The draft also suggests crypto can potentially fall under donations tax if transferred as “property,” with donation tax rates between 20% and 25% depending on value.
- The guidance is open for public comment until August 31 and is not yet final law.
Why SARS is issuing draft crypto tax guidance
The publication of draft guidance marks another step in South Africa’s effort to bring greater consistency to crypto taxation. SARS says the intent is to clarify how the existing tax regime applies to crypto, particularly under the Income Tax Act, 1962, along with capital gains tax principles.
That matters for local holders because tax treatment can affect how individuals and businesses account for crypto-related gains and losses—especially when transactions involve frequent trading or payments. SARS also noted in 2024 that at least 5.8 million residents held crypto assets, underscoring the scale of potential compliance implications if the guidance is adopted.
Crypto is treated as property, not currency
A central theme in the draft is how SARS characterizes crypto assets legally for tax purposes. According to the guidance, crypto assets are not treated as legal tender or foreign currency. Instead, SARS describes them as intangible assets—“not ‘currency’” and therefore not “foreign currency.”
The guidance draws a line between the asset and its function. While crypto can be used in ways that resemble money—such as trading, settlement, or payment—it is still framed as a distinct tax object. That distinction can be important because different categories of assets may be taxed under different rules, and the tax analysis may change depending on how SARS views the nature of the instrument involved.
Disposals, trading activity, and the role of intent
The draft repeatedly returns to the idea that many real-world crypto actions are economically similar to selling or exchanging an asset, which under tax law can amount to a disposal. SARS states that most crypto activities—including trading, swapping and spending—are generally treated as disposals and may trigger tax events.
At the same time, SARS cautions that the tax treatment will not be uniform for everyone. A key determinant is the taxpayer’s intention. The guidance explains that classification as a trader versus a long-term investor depends on behavior, including how often transactions occur and why the crypto is being held.
SARS also highlights that intention is not necessarily static. In the agency’s view, tax assessment should consider the taxpayer’s intention:
- at the time of acquisition,
- at the time of selling or disposing, and
- while holding the asset—recognizing that a person’s purpose can change over time.
This approach implies that taxpayers who rotate between investment and active trading could face different outcomes for different periods or different lots, depending on the evidence available. SARS says this requires a broad assessment of all relevant facts and circumstances, which may increase the importance of record-keeping—particularly for frequent traders and those who use crypto for payments rather than holding it untouched.
Potential reach to donations tax
The draft guidance also extends beyond routine trading and investing. SARS indicates that crypto assets may fall within South Africa’s donations tax rules because the assets are treated as “property” under tax law.
Under the framework described in the guidance, donations tax rates range from 20% to 25%, depending on the value of the donation. While the draft does not claim that every crypto transfer will automatically be subject to donations tax, it signals that SARS is prepared to treat certain transfers as taxable events in the context of property transfers, not just in the context of sale-like disposals.
What happens next: comment period and broader market context
The guidance is not final legislation. SARS says the draft is open for public comment until August 31, and the agency positions it as interpretive clarity rather than an attempt to introduce new legal obligations.
For market participants, this timing is significant. Many taxpayers will be deciding how to interpret their existing tax position in the lead-up to any final version of the rules. If the final guidance meaningfully narrows or expands the application of concepts like intention, disposal treatment, or property classification, taxpayers may need to adjust accounting methods and documentation practices accordingly.
South Africa is also one of Africa’s most active crypto markets. According to Chainalysis’ October 2024 report, the country received about $26 billion in crypto value during the one-year period covered by the study. Chainalysis also found that institutional and professional-sized transactions were the largest contributors, particularly from late 2023 through the first quarter of 2024, pointing to a gradual shift toward larger and more structured activity.
That trend can heighten the importance of clear tax rules for compliance. As trading volumes rise and more professional participation enters the market, inconsistency or uncertainty in how transactions are classified can translate into larger compliance risks—making guidance like SARS’s particularly relevant not only for retail investors but also for intermediaries and more active market participants.
As the August 31 comment deadline approaches, holders, traders, and businesses will want to watch for how SARS responds to submissions and whether the final version tightens the standard for determining intent, the treatment of swaps and payments, and the boundaries between trading and long-term investing.

Key Takeaways
- NBIS shares surged 19.5% in June before erasing most gains during early July trading
- First quarter 2026 revenue skyrocketed 684% compared to the prior year, with full-year guidance exceeding $3 billion
- Strategic partnership with Meta Platforms valued at $27 billion plus support from Nvidia have fueled investor enthusiasm
- Year-to-date gains stand at 158%, though shares have retreated 16% in the most recent five-day period to approximately $215
- Analyst consensus leans toward Moderate Buy with a mean price target of $237.38, suggesting roughly 10% potential upside
Nebius Group (NBIS) has emerged as a 2026 market leader. This AI-focused cloud infrastructure provider has delivered a remarkable 158% gain since January, with shares more than quadrupling over the trailing twelve months. However, recent volatility serves as a stark reminder of the stock’s unpredictable nature.
Shares experienced a 19.5% June rally before surrendering nearly all those advances during the opening week of July. Trading at approximately $215.62 as of July 5, NBIS declined almost 6% in a single session.
Recent selling pressure intensified following a Bloomberg report suggesting Meta Platforms might monetize its surplus computing resources. Certain market participants interpreted this news as potentially problematic for neocloud providers like Nebius. However, counterarguments emphasized that AI computational demand continues to significantly exceed available supply.
The situation carries notable complexity — Meta simultaneously represents one of Nebius’ most significant clients. Their collaboration encompasses a $27 billion commitment, with Meta supporting approximately 300 MW of AI infrastructure capacity. Additionally, Nvidia CEO Jensen Huang has actively facilitated connections between AI-focused enterprises and Nebius, further validating the company’s market position.
Astronomical Revenue Expansion
The financial performance of Nebius presents compelling evidence of growth. Second quarter 2025 revenue totaled merely $105 million. By the fourth quarter, annualized revenue reached a run rate of $1.25 billion. The first quarter of 2026 showcased extraordinary 684% year-over-year revenue acceleration.
Executive leadership now projects 2026 revenue will surpass $3 billion, with projections suggesting another potential doubling throughout 2027. Supporting this trajectory requires substantial data center infrastructure expansion.
Contracted power capacity projections have escalated dramatically from a minimum 1 GW last August to exceeding 4 GW currently. Nebius has already locked in 1.2 GW of power resources and real estate for a Pennsylvania-based AI facility. The company also formalized a strategic alliance with Bloom Energy to deploy supplementary power infrastructure for ongoing data center construction.
Analyst Community Remains Divided
Skepticism persists regarding current valuation sustainability. NBIS has achieved approximately $55 billion in market capitalization, representing an aggressive multiple even against projected 2027 revenue figures.
Northland analyst Nehal Choksi maintains a Buy rating alongside a $248 price target, highlighting Nebius’ strategic pivot toward more profitable AI-native clientele as justification for optimism. He views the Tavily acquisition as enhancing customer value propositions.
Morgan Stanley’s Josh Baer presents a contrasting perspective. His Hold rating accompanies a $144 price target — substantially below present trading levels. While Baer recognizes customer momentum, he contends that near-term objectives appear overly ambitious, citing unproven profitability metrics and substantial additional bookings needed to achieve guidance.
The Street’s aggregate assessment registers as Moderate Buy, comprising six Buy recommendations and four Hold ratings. The consensus price target of $237.38 suggests approximately 10% appreciation potential from current pricing.
Competitor CoreWeave operates within identical market segments, and any deceleration in AI infrastructure investment could disproportionately impact NBIS compared to the broader technology sector.
The stock’s 52-week trading range spanning $43.89 to $299.86 provides clear evidence of the extraordinary volatility investors have navigated.

Key Takeaways
- CRM shares opened Friday at $165.94, reflecting a ~41% decline year-to-date and a ~58% drop from the late-2024 high
- Guggenheim shifted its stance from Neutral to Buy, establishing a $228 target and arguing valuations reflect an “Armageddon” baseline
- Analyst consensus averages Moderate Buy, with a mean target near $254 — suggesting potential gains of 55%–57%
- Q1 results topped forecasts: EPS reached $3.88 against $3.13 estimates, while revenue hit $11.13B, climbing 13.3% year-over-year
- The company’s AI portfolio — spanning Agentforce and Slack-integrated agents — now drives more than $2.3B in ARR
Shares of Salesforce (CRM) began Friday trading at $165.94, marking a steep year-to-date decline of approximately 41% and a roughly 58% retreat from the late-2024 high around $276.80. The downturn stems primarily from investor anxiety that AI-powered agents might render conventional CRM platforms redundant.
Yet a growing number of Wall Street voices believe the market has overreacted.
This week, Guggenheim analyst John DiFucci elevated CRM from Neutral to Buy, establishing a $228 price objective. His rationale: trading at approximately 3.7x recurring revenue and 11x EV/NTM free cash flow, the valuation assumes perpetual 5% business contraction — a scenario he deems implausible.
Citigroup likewise moved Salesforce to Buy this week, joining a widening group of analysts convinced the correction has exceeded rational bounds.
Current Street consensus shows Moderate Buy, with 28 Buy ratings, 6 Hold recommendations, and 4 Sell calls.
The mean price objective hovers around $254, pointing to approximately 55%–57% potential appreciation from present levels. Citizens JMP maintains the Street’s highest conviction with a $315 target.
Strong Q1 Results and Forward Outlook
Salesforce delivered Q1 figures on May 27th that surpassed Wall Street projections. Earnings per share landed at $3.88, topping the $3.13 consensus by $0.75. Revenue totaled $11.13 billion, representing 13.3% year-over-year growth and edging past the $11.05 billion forecast.
For fiscal 2027, management projects full-year EPS in the $14.060–$14.120 range. Second-quarter fiscal 2027 guidance calls for EPS between $3.250 and $3.270.
The stock trades within a 52-week range of $146.32 to $276.80. The 50-day moving average currently stands at $173.23, while the 200-day moving average registers at $197.71.
AI Product Suite Driving Material Revenue
Despite apprehension surrounding AI-driven disruption, Salesforce’s proprietary AI offerings are already delivering substantial financial contributions. The product lineup — encompassing Agentforce, Data 360, Slack-integrated AI agents, and Headless 360 APIs — currently generates north of $2.3 billion in rapidly expanding annual recurring revenue.
This metric serves as a focal point for analysts arguing the enterprise isn’t merely protecting existing market share — it’s actively capturing emerging opportunities.
On the institutional front, Kepler Cheuvreux Suisse SA expanded its CRM position by 284.1% during Q1, acquiring an additional 12,568 shares to reach a total stake of 16,992 shares valued around $3.17 million.
Vanguard Group maintains 89.8 million shares worth approximately $23.8 billion. State Street controls 50 million shares, with institutional investors collectively representing 80.43% of outstanding equity.
Salesforce distributed a $0.44 quarterly dividend per share on July 2nd, equating to a $1.76 annualized payout and yielding roughly 1.1%.
The board greenlit a $25 billion buyback authorization in March, permitting repurchases of up to 14.1% of outstanding shares via open market transactions.
HC Wainwright took a contrarian stance, lowering CRM to Negative on June 18th — representing one of just four Sell-rated opinions currently assigned to the stock.


Artem Tolkachev is Chief RWA Officer at Falcon Finance, which builds collateral-first dollar infrastructure.
What actually determines whether a stablecoin gets used, not just parked, is whether the venues where people trade, borrow and hedge will accept it as collateral. Can you post it as margin on an exchange? Does it get a sensible loan-to-value in a lending market? Can it move across venues without losing so much to haircuts that it becomes irrelevant? Collateral acceptance is the line between a dollar token that sits in a wallet earning a coupon and one that does real work in the financial system.That difference, parked versus used, isn’t academic. A parked token is inert capital; a token the market accepts as collateral lets its holder trade, borrow and hedge without selling it, which is the whole reason to hold a dollar on-chain rather than dollars in a bank.
This is the variable almost no one is pricing in. We are about to add tens of billions of dollars in new stablecoin supply on the assumption that supply equals genuine adoption. It doesn’t. If that supply arrives while exchange and venue risk teams leave their collateral frameworks exactly where they are, the result won’t be adoption, it will be stranded collateral: tens of billions of dollars that are technically live, dutifully earning their 3%, and going precisely nowhere.


In the Nevada Supreme Court, Kalshi lost an effort a few days ago to halt a requirement that it block its customers in the state from much of the platform’s trading activity. The denial signed by three state justices on Wednesday said they were “not persuaded” by the business’ emergency motion, and Kalshi may also face legal trouble for failing to geofence its business by a court-imposed deadline.
In Ohio, Kalshi sued the gaming regulator on Monday — following earlier, parallel court arguments from the Commodity Futures Trading Commission — seeking to halt Ohio’s penalty against the company on accusations it’s run an unlicensed sports-betting operation.
The next day, a local court in Michigan granted that state’s gaming regulators a temporary, two-week restraining order against Kalshi to stop it from offering, advertising or facilitating sports betting there.
“Kalshi is targeting Michigan’s most vulnerable residents with sports betting dressed up as investing — and without intervention, the harm will keep getting worse,” said Michigan Gaming Control Board Executive Director Henry Williams in a Tuesday statement.
On the positive side for prediction platforms: The CFTC and its pro-innovation chairman, Mike Selig, are aggressively trying to make the case that Kalshi and the others belong under the sole jurisdiction of the agency as the U.S. derivatives regulator, arguing in its own lawsuits against several states that the contracts sold in the prediction markets are effectively the same as those an agricultural business might buy to hedge against future crop prices changes.

Cardano’s founder and arguably the most important person behind the project caused some controversy in June, which led to a surge of fear, uncertainty, and doubt and a price collapse for the underlying token.
However, ADA has decoupled from the rest of the larger-cap alts over the past week or so, posting a massive 40% surge from that multi-year low.
ADA FUD Over?
It was a month ago when Charles Hoskinson said he would be taking a break from Cardano and warned that multiple projects operating on the Layer-1 blockchain might face immediate failures. The impact on the native token was immediate and violent, with ADA plummeting from over $0.20 to under $0.19, then $0.16, and ultimately below $0.14 by the end of June, its lowest price since 2020.
The overall bearish market sentiment was also a factor behind ADA’s collapse, and the subsequent revival has helped as well. However, while most larger-cap cryptocurrencies are up by 5-10% in the past week or 10 days, Cardano’s native token has staged a significantly more profound recovery.
The asset soared by over 40% since that low and tapped $0.20 earlier today for the first time in a month. The analyst from Santiment Intelligence commented on the move, suggesting that ADA has decoupled from the other alts after “peak FUD created rifts in [the] community last month.”
They added that the Cardano network is “showing signs of life again,” with nearly 15,000 non-empty ADA wallets added since the recent bottom.
“Retail support has been one of ADA’s strongest traits even through ugly market stretches. After weeks of fear, this renewed holder growth suggests the crowd is gaining trust again after a short stretch of rapid market cap growth,” Santiment concluded.
Or Possible Buy The Rumor Event?
Another major reason behind ADA’s impressive revival has been the hype around the upcoming RealFi Phase 1 Testnet upgrade. Hoskinson described it as the “largest” in the project’s history and is scheduled to be completed by July 6.
Such moves typically excite the community and are often preceded by major price rallies for the underlying asset. Once they are completed, though, the actual ‘buy-the-rumor, sell-the-news’ event takes place, and the token tanks.
For now, ADA remains one of this week’s top performers, climbing by 30% since last Sunday. Its market cap is back to $7 billion once again after it dipped below $5 billion recently.
The post Cardano Shows Signs of Life Again as ADA Rockets 40% After Massive FUD appeared first on CryptoPotato.

XRP traded near $1.13 on July 5, according to crypto.news market data. The token was down 1.04% over 24 hours but remained up 7.79% over seven days. Its market cap stood near $70.26 billion, while 24-hour volume was about $1.67 billion.
Summary
- XRP’s current price near $1.13 keeps the token below the key $1.20 weekly average.
- A weekly death cross could turn the 200-week SMA from support into future resistance.
- Crypto.news analysis keeps $1.10, $1.20 and $1.40 as key levels for XRP traders.
The price remains close to a key technical zone after a short recovery from the $1 area. XRP has moved back above short-term support, but it has not reclaimed the higher resistance area near $1.20.
A post from ChartNerd warned that XRP is close to printing a weekly 20 EMA and 200-week SMA death cross. The analyst said the 200-week SMA near $1.20 may turn from a support floor into a supply ceiling.
That level now matters because price remains below it. A weekly close above $1.20 would weaken the bearish case. Failure to reclaim it may keep sellers active during future rallies.
Weekly death cross keeps traders cautious
A death cross happens when a shorter moving average falls below a longer moving average. In this case, the focus is on the weekly 20 EMA and the 200-week SMA.
The signal does not confirm an instant drop by itself. It shows that medium-term momentum has weakened against the long-term trend. Traders often watch how price reacts after the cross appears.
ChartNerd said “the 200-week SMA ($1.20) now has the potential to flip from a historical support floor into a supply ceiling.” The analyst added that XRP must reclaim that area to reject the bearish setup.
The analyst also pointed to two past examples. In 2022, XRP formed a bottom shortly after a similar signal. In the 2018 to 2020 bear market, the final low came months later after repeated failures near the 200-week SMA.
Daily chart shows short-term recovery
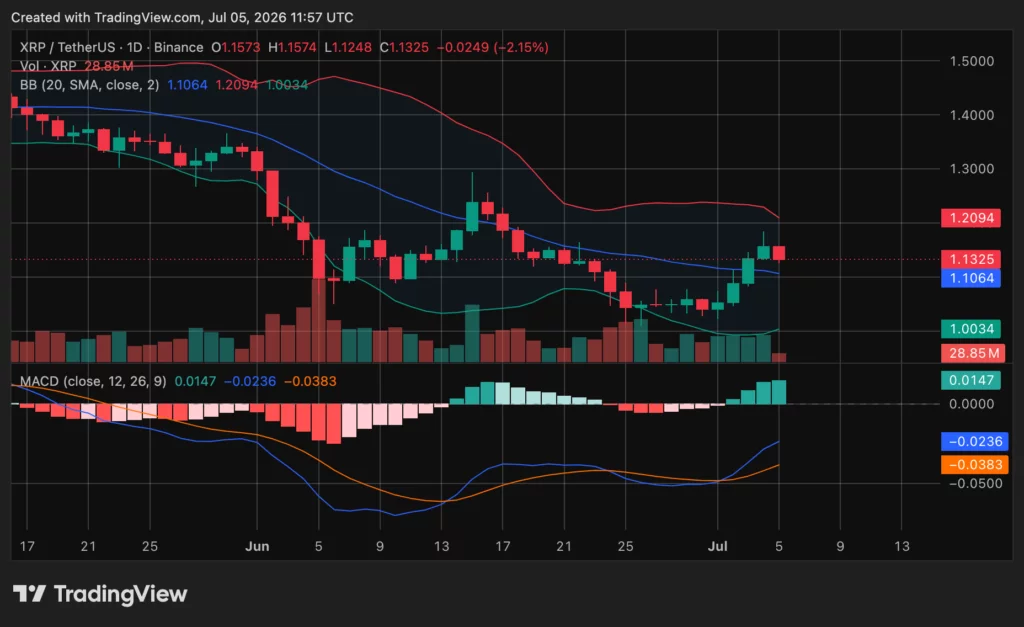
The XRP/USDT daily chart still shows a broader downtrend, with lower highs from May into late June. The token recently bounced from the lower Bollinger Band near $1 and moved back above the middle band.
The latest candle is red near $1.1325, showing a pullback after the rebound. Price remains between the middle Bollinger Band near $1.1064 and the upper band near $1.2094.
Holding above $1.1064 keeps the short-term recovery alive. A drop below that level would weaken the bounce and bring the $1.00 to $1.03 area back into focus.
The MACD has improved, with the MACD line above the signal line and a positive histogram. Still, both lines remain below zero. That means momentum is recovering, but the wider trend has not fully turned.
Source: TradingView
Crypto.news data keeps $1.20 in focus
Crypto.news reported on July 3 that XRP climbed to a three-day high after Ripple’s European expansion and a fresh Supertrend buy signal. The report said XRP moved from around $1.02 on July 1 to an intraday high near $1.11.
A separate crypto.news analysis said XRP needed to reclaim $1.20 to $1.25 to support a stronger rebound. It also placed $1.10 as a key support level and warned that wider weakness could bring $0.90 and $0.80 back into view.
The same report said a monthly close above $1.40 would help confirm a stronger double-bottom case. Until then, XRP remains in a cautious zone, even after the recent rebound.
At press time, traders are watching three levels. XRP must hold $1.10 to protect the short-term bounce, reclaim $1.20 to weaken the death cross warning, and clear $1.40 to improve the larger structure.

Bitcoin tests $63K as Saylor calls BTC digital energy

South Africa’s Michael Hollick eagles final hole to claim his first European tour victory

Spotify’s streaming fraud issue runs so deep that Kalshi traders are profiting from rigged charts


-

 Fashion2 days ago
Weekend Open Thread: High Hopes
-

 Politics2 days ago
The House | “Reframing the debate from a binary discussion of winners and losers”: Yuan Yang reviews ‘We Are Not Machines’
-

 Crypto World5 days ago
Strategy authorizes up to $1.25B in Bitcoin sales under new capital plan
-

 News Videos7 days ago
MAJOR BITCOIN & MARKET UPDATE!!!! (MUST WATCH ASAP!!!)
-

 Tech6 days ago
Anonymous researcher drops 0-day ‘exploitarium’ repo
-

 News Videos5 days ago
How to Build INSANE Live Financial Dashboards With Claude
-

 Business5 days ago
Australia treasurer says alleged access of prime minister’s bank data ’incredibly concerning’
-
 NewsBeat10 hours ago
Taylor Swift and Travis Kelce wedding staffer hilariously struggles to keep her cool while checking in megastars
-
 Business6 days ago
The AI boom won’t burst all at once. It will pop in ‘rolling bubbles’: Macquarie
-

 Sports4 days ago
Broncos roster: OL Ben Powers (No. 74) entering final year of contract
-

 Crypto World3 days ago
Binance stock trading tops $1B in first month after launch
-

 NewsBeat5 days ago
Presenter Caroline Flack’s brother Paul Flack dies aged 55
-

 Crypto World3 days ago
Alibaba-affiliate Ant Group enters the humanoid robot market with 12 deals
-
 NewsBeat3 days ago
New exhibition reflects five decades of movement between island of Ireland and GB
-
 Crypto World4 days ago
Airdrop Registration Becomes Key Focus For Remittix As RTX Launch Updates Approach
-

 Business2 days ago
What a 10 Percent Drop Means for Buyers, Sellers and Renters
-

 Business4 days ago
Meta Platforms Stock Jumps 7% Today as Bloomberg Reports Company Plans to Enter the Cloud Business
-

 Crypto World3 days ago
Binance Re-Enters Philippines As EU MiCA Rules Restrict Access
-
 Crypto World2 days ago
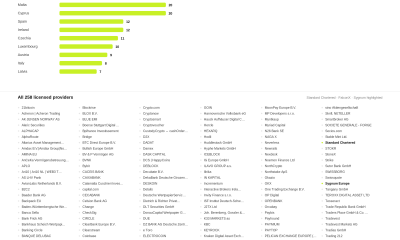
Standard Chartered Secures MiCA License as ESMA Adds 37 New Crypto Firms
-

 Tech6 days ago
The attack that hijacked Claude Code came through Sentry. Datadog, PagerDuty, and Jira have the same exposure.
You must be logged in to post a comment Login