
Crypto World
Shipfinex taps ADI Chain to tokenize $500M vessel portfolio



Dubai-based Shipfinex has partnered with ADI Chain to tokenize about 35 vessels valued at roughly $500 million, with the planned structure designed to give shipowners access to blockchain-based financing and investment channels.
Summary
- Shipfinex has partnered with ADI Chain to tokenize about 35 vessels valued at roughly $500 million through separate special purpose vehicles.
- The planned tokens could represent vessel backed credit, charter linked income or other economic interests, with ADI Chain providing distribution and settlement infrastructure.
- Stablecoins denominated in UAE dirhams, U.S. dollars and other currencies are expected to support primary allocations and distributions.
- The project remains in the pilot and operational readiness stage, with no Maritime Asset Tokens publicly issued and the regulated issuance route still being finalized.
- Tokenized real world assets totaled about $38.1 billion as of Aug. 9, while Standard Chartered expects the market to reach $4 trillion by the end of 2028.
According to Shipfinex, each vessel in the planned pipeline will be placed inside a separate special-purpose vehicle, creating a legal structure through which tokens can represent economic interests tied to individual ships.
Shipfinex plans $500 million vessel tokenization pipeline
Depending on how each transaction is structured, the tokens could represent vessel-backed credit, income linked to charter agreements, or other economic interests connected to a specific ship. Separating the vessels into individual SPVs would also allow the economic rights associated with one ship to be structured independently from the rest of the portfolio.
ADI Chain will provide the blockchain infrastructure for distribution and settlement under the partnership. Primary allocations and subsequent distributions are expected to use stablecoins denominated in UAE dirhams, U.S. dollars and potentially other currencies.
The companies have not yet moved the planned assets into public issuance. Shipfinex said the partnership remains in its pilot and operational-readiness phase, while the regulated route required to issue the Maritime Asset Tokens is still being finalized.
As a result, none of the planned Maritime Asset Tokens have been publicly issued so far, despite the companies identifying a pipeline of about 35 vessels.
The $500 million portfolio would represent only a fraction of the value held in the global maritime industry. Clarksons Research valued the world fleet and ship orderbook at approximately $2.1 trillion at the beginning of 2026.
Shipfinex’s planned structure would bring vessels, an asset class traditionally financed through bank loans, leasing arrangements and private capital, into a tokenization model where defined economic rights can be represented and settled through blockchain infrastructure.
A similar model has already emerged elsewhere in the maritime sector. In June, crypto.news reported on Ethra Ship’s launch of a blockchain protocol for investments linked to operating maritime assets.
Ethra’s structure separated its SHIP governance token from a regulated real-world asset investment layer backed by vessel-owning SPVs. The platform was supported by Ethra Invest, which had been acquiring, managing and commercially operating vessels since 2021.
Ethra also said individual ships in the market can cost between $30 million and $120 million, illustrating the amount of capital that can be required to gain direct exposure to maritime assets. Its model used operating vessels and charter revenue as the economic base for its tokenized investment structure.
ADI Chain provides stablecoin settlement infrastructure
For Shipfinex, ADI Chain’s role extends beyond recording the planned vessel-linked tokens. The network is expected to support their distribution and settlement, including transactions involving currency-denominated stablecoins.
ADI Chain has already been involved in digital asset infrastructure projects in Abu Dhabi. In May, a previous report covered BNY’s launch of institutional Bitcoin and Ether custody services in Abu Dhabi Global Market through a collaboration involving Finstreet Limited and the ADI Foundation.
BNY, which had $59.4 trillion in assets under custody and administration at the time, initially offered custody for Bitcoin and Ether to regional institutional clients. The platform was also intended to support stablecoins and tokenized real-world assets as its services expanded.
ADI Chain has separately been used for dirham-denominated stablecoin infrastructure. DDSC, a stablecoin backed one-to-one by UAE dirham reserves, launched on ADI Chain in February after receiving approval from the UAE Central Bank.
The stablecoin was initiated by International Holding Company and First Abu Dhabi Bank, according to the announcement at the time. Its presence on ADI Chain provides existing dirham-based settlement infrastructure as Shipfinex prepares a model that could use UAE dirham-denominated stablecoins for vessel token allocations and distributions.
Tokenized real-world assets reach $38.1 billion
Shipfinex is preparing the vessel program while the value of tokenized real-world assets continues to increase across government debt, commodities, private credit and other asset classes.
Data from RWA.xyz showed approximately $38.1 billion in tokenized real-world assets as of Aug. 9. U.S. Treasury debt accounted for about $16.2 billion of the total, while tokenized commodities represented another $4.9 billion.
The market had already expanded sharply earlier in the year. By May, RWA.xyz and other market data placed tokenized real-world assets at roughly $31 billion to $34 billion, compared with around $5.4 billion at the start of 2025. Ethereum hosted about 60% of the value at the time, while tokenized U.S. Treasuries accounted for roughly $15 billion.
Growth has also extended into assets that have historically been difficult to divide or distribute to investors. Vessel tokenization falls into that category because ownership, financing and income rights can be tied to individual physical ships through legal entities rather than existing natively on a blockchain.
Under Shipfinex’s proposed setup, the SPVs would provide that off-chain legal structure, while ADI Chain would handle the blockchain-based distribution and settlement layer. The exact rights attached to each token would depend on whether a transaction represents credit, charter-linked income or another economic interest.
Standard Chartered sees tokenized assets reaching $4 trillion
Institutional forecasts have put the potential tokenization market far above its current size. In a report released Monday, Standard Chartered forecast that tokenized real-world assets could reach $4 trillion by the end of 2028, according to Geoff Kendrick, the bank’s global head of digital asset research.
An earlier Standard Chartered forecast covered in May projected $4 trillion of tokenized assets on-chain by the end of 2028, split evenly between stablecoins and real-world assets.
Kendrick said at the time that established decentralized finance protocols with strong risk controls could capture much of the activity as traditional financial assets move on-chain. He cited BlackRock’s BUIDL tokenized Treasury fund as an example of an institutional asset that can generate Treasury yield while also being used within blockchain-based financial products.
The bank’s projection included a $2 trillion target for stablecoins and another $2 trillion for tokenized RWAs by the end of 2028. Standard Chartered also estimated that roughly 1,000 times more assets remained off-chain than on-chain when it published the earlier forecast.
Shipfinex, meanwhile, has yet to publicly issue any of the Maritime Asset Tokens in its proposed $500 million vessel pipeline, with the company still working through pilot preparations, operational readiness and the regulated issuance route for the planned tokens.



Nasdaq agreed on Aug. 11 to acquire all equity interests in LeveL Markets LLC, adding one of the largest U.S. alternative trading systems to a broader strategy built around longer trading hours, tokenized securities and digital market infrastructure.
Summary
- Nasdaq agreed to acquire LeveL Markets, the third largest U.S. alternative trading system by volume.
- LeveL reaches more than 2,500 clients and trades across more than 7,000 symbols each day.
- Nasdaq created Digital Liquidity Networks to combine tokenization, liquidity platforms and digital asset technology capabilities.
- The SEC approved Nasdaq tokenized securities rules in March, then longer trading hours during April.
- LeveL will remain FINRA regulated and separately managed after closing, subject to required regulatory approvals.
Financial terms were not disclosed in the company’s release.
The deal comes after two major U.S. regulatory approvals for Nasdaq this year. The SEC approved its tokenized securities rules in March and its plan for 23 hour weekday trading in April. Nasdaq now plans to launch the longer trading schedule on Dec. 6, while the newly created Digital Liquidity Networks unit will bring LeveL into the same organization as its digital asset and tokenization capabilities.
LeveL gives Nasdaq a larger U.S. off exchange foothold
Nasdaq says LeveL is the third largest U.S. ATS by trading volume. The platform processes hundreds of millions of shares each day, trades more than 7,000 symbols and reaches over 2,500 buy side and sell side clients. More than 300 institutional buy side firms use the venue, which connects through more than 15 order and execution management systems.
Nasdaq first acquired a minority interest in LeveL in 2021. LeveL later merged with Luminex in 2022, while its average daily volume increased 56% in 2025. Nasdaq’s move from minority investor to prospective owner gives the exchange operator a larger position in U.S. trading that takes place away from traditional exchange order books.
The structure will not disappear after the purchase. Nasdaq said LeveL will keep its own management team, participant confidentiality and structural separation while remaining a registered ATS under FINRA oversight. Until the transaction closes, both businesses will continue operating independently.
Nasdaq already has SEC approval for 23 hour trading
The U.S. angle extends beyond the acquisition. The SEC granted accelerated approval to Nasdaq’s 23 hour, five day trading proposal on April 10. Under the approved structure, the day session runs from 4 a.m. until 8 p.m. ET, followed by a night session from 9 p.m. until 4 a.m. ET. The intervening hour allows maintenance and corporate action processing.
Nasdaq has set Dec. 6, 2026, as its planned launch date for the expanded hours. The change is intended to give investors in other time zones greater access to U.S. equities and puts a major national exchange into trading periods where ATS operators already compete for orders.
Washington is still examining how far the transition should go. The SEC will hold a Sept. 17 roundtable covering overnight trading, market operations, resiliency and investor safeguards. Chair Paul Atkins said the U.S. is moving toward a market that trades through more of the day and night. As crypto.news reported in its 24 hour trading coverage, regulators are now examining the infrastructure needed to support that shift.
Tokenized securities are moving closer to production
Nasdaq’s digital market strategy is also moving from regulatory approval toward implementation. On March 18, the SEC approved rules allowing eligible securities to trade in tokenized form on Nasdaq. Tokenized and traditional versions can use the same order book and execution priority when they share the same CUSIP, trading symbol and shareholder rights.
The approved framework relies on DTC infrastructure rather than creating a separate pool of synthetic equity exposure. Eligible assets under the pilot include Russell 1000 securities and ETFs tracking major indexes. Trades handled through DTC will continue to settle on a T+1 basis, according to Nasdaq’s regulatory filing.
That infrastructure is approaching another milestone. DTCC processed live production transactions involving DTC tokenized assets on July 15 with more than 30 firms and is targeting October for the Tokenization Service launch. In related DTCC tokenization coverage, crypto.news reported that participants will be able to move eligible securities between traditional records and approved blockchain wallets.
Nasdaq is separately working with Payward, Kraken’s parent company, on an xStocks powered gateway designed to connect regulated equity markets with blockchain networks in eligible jurisdictions. As previously reported in Nasdaq and xStocks partnership coverage, the companies are developing infrastructure linking permissioned markets with blockchain based financial applications.
What happens next for Nasdaq and LeveL Markets
The LeveL acquisition remains subject to customary closing conditions and required regulatory approvals. Nasdaq has not disclosed the purchase price or a target closing date. After completion, LeveL is expected to sit inside Digital Liquidity Networks, led by Roland Chai, who has overseen Nasdaq’s digital assets strategy since early 2026.
Chai said the unit intends to build “programmable, always-on market infrastructure of the future.” That is Nasdaq’s stated objective rather than an existing market structure. The company said DLN will combine liquidity platforms, tokenization capabilities and technology products serving digital asset markets.
Several concrete dates will test that strategy. The SEC’s roundtable is scheduled for Sept. 17. DTCC plans to launch its tokenization service in October. Nasdaq plans to begin 23 hour weekday trading on Dec. 6, while its separate equity token design and related distributed ledger services are expected to begin operating in the first half of 2027.
Those initiatives are separate from the LeveL acquisition and are not disclosed closing conditions for the deal. Together, however, they show Nasdaq directing investment toward off exchange liquidity, longer U.S. trading hours and blockchain based settlement as the structure of American equity markets changes.

MoneyGram expanded its blockchain payments strategy on Aug. 11 by launching MoneyGram Ramps on Solana, giving wallets, exchanges and developers access to its cash network through one API.
Summary
- MoneyGram Ramps now gives Solana applications cash withdrawals across more than 170 countries and territories.
- Cash deposits are available in over 25 countries through one developer API without banking integrations.
- Rift became the first Solana wallet to integrate MoneyGram Ramps for crypto and local currency.
- MoneyGram already operates a Solana validator after joining the network and developer platform in June.
- U.S. Ramps access excludes Alaska, Louisiana, Hawaii and New York, according to MoneyGram’s product page.
The company’s release says the integration supports cash deposits in more than 25 countries and cash withdrawals in more than 170 countries and territories.
Rift is the first Solana wallet to integrate the service. The launch builds on MoneyGram’s June entry into Solana as a validator and participant in the Solana Developer Platform, extending the relationship from network infrastructure into customer facing payment access.
MoneyGram Ramps gives Solana cash access in 170+ markets
MoneyGram says developers can obtain API credentials, use a sandbox and integrate software development kits without building separate banking connections. Solana has embedded Ramps in the payments module of its Developer Platform, allowing apps to connect onchain activity with MoneyGram’s physical cash network.
MoneyGram says its wider network serves more than 60 million active customers and includes nearly half a million retail locations. Solana’s announcement lists international payouts, stablecoin payroll and aid distribution as possible applications. Those are proposed use cases, not announced customer deployments.
MoneyGram’s corporate site says its broader network spans more than 200 countries and territories, with more than 480,000 retail locations and over five billion digital endpoints. Ramps does not mirror that full footprint: the product currently advertises crypto to cash access in more than 170 countries, while cash deposits are available in more than 25.

The current MoneyGram Ramps page describes customer flows using USDC. Users can add cash to a crypto wallet at participating locations or convert USDC into cash. The Solana announcement does not say MoneyGram’s MGUSD stablecoin is moving networks. MGUSD launched on Stellar in June, initially in the U.S., as crypto.news reported in its June stablecoin coverage.
U.S. access comes with state limits
The launch also carries a direct U.S. payments angle. MoneyGram Payment Systems is registered as a money services business with FinCEN and says it is authorized to do business in all 50 states, Washington, D.C., and U.S. territories. However, its current Ramps page says the product is unavailable in Alaska, Louisiana, Hawaii and New York.
Solana developers can therefore connect to a U.S. regulated payments operator, but customer availability still depends on location and product rules. MoneyGram says it handles identity checks, compliance and real time stablecoin settlement within Ramps. Its existing licensing does not make every Ramps function available everywhere.
The product page says MoneyGram handles stablecoin settlement, fiat payout and compliance checks behind the integration. That setup lets a wallet or exchange add cash access without separately assembling MoneyGram’s underlying payment and compliance connections.
The integration follows MoneyGram’s June 22 move to become an active Solana validator and join the Solana Developer Platform, as crypto.news reported in its earlier validator coverage. MoneyGram said it stakes SOL, processes transaction blocks and participates directly in network consensus.
What happens next for MoneyGram’s Solana push
MoneyGram is positioning Ramps as a multichain product rather than replacing its Stellar work. Its latest official materials still identify MGUSD as natively issued on Stellar, while Solana now gains access to the company’s cash connectivity. The approach also puts MoneyGram alongside established payment firms expanding blockchain rails, including Western Union’s Solana expansion covered in related reporting.
MoneyGram CEO Anthony Soohoo described the launch as “another step toward building a truly open, global payments network.” The statement sets out the company’s objective, but the immediate measure will be adoption. MoneyGram has not announced another Solana wallet integration beyond Rift or provided a timetable for additional partners.
MoneyGram’s current Ramps page also marks bank, mobile wallet and card withdrawals, along with debit card and bank account funding, as “coming soon.” Those functions would extend Ramps beyond physical cash locations if released. No firm launch date is listed, so the Solana rollout currently centers on the cash access announced this week.

Arthur Hayes published a new essay this week arguing that the US Treasury and Japan’s Ministry of Finance have settled on a single method to strengthen the yen: running newly printed dollars through the Federal Reserve’s currency swap facility.
Hayes says the mechanics point to a wave of dollar liquidity hitting the global markets, and he’s positioning Bitcoin (BTC), gold, and Ethereum (ETH) to catch the bulk of it.
The Plan, and Why Hayes Says It’s the Only One That Works
Hayes lays out three ways Japan could push the yen higher. The Bank of Japan could raise rates aggressively, but doing so would deepen losses on its own mountain of low-yield bonds and raise Tokyo’s debt service costs.
Japan could also lean on institutions like the pension fund GPIF to sell foreign assets and buy domestic ones, but that would turn one of the largest holders of US Treasuries into a seller, something Washington can’t stomach given how dependent American markets are on that demand.
The third option, which Hayes calls the preferred one, works differently. The MOF would repo its Treasury holdings to the Fed through the FIMA facility in exchange for dollars, then sell those dollars to buy yen in the open market.
The catch now is size. The facility caps each counterparty’s outstanding loan at $60 billion, and a recent joint intervention burned through more than $100 billion while only pushing the yen up 5% for a few trading days. Removing that cap and adding counterparties like GPIF would change the math. Between Japan’s government and GPIF, Hayes counts $1.373 trillion in Treasury holdings that could theoretically flow through the facility, a number he compares to the roughly $4 trillion the Fed printed during COVID.
Hayes frames the outcome bluntly. “The more they print, the higher Bitcoin goes,” he wrote, adding that he’d rather see the liquidity land in Bitcoin and gold than in AI infrastructure spending he considers wasteful.
Among altcoins, he singled out ETH as undervalued relative to other majors and named Ethena’s ENA token as a smaller bet he thinks could still multiply several times over.
The Yen Backdrop Driving the Bet
Hayes’s essay follows weeks of analysts flagging the same currency pressure from different angles. After the Bank of Japan held rates at 1% in late July, EGRAG CRYPTO warned that Japan is approaching one of the most dangerous monetary crossroads in modern financial history, cautioning that unwinding yen-funded trades could force selling across stocks, bonds, and Bitcoin alike.
That came weeks after the yen fell to its weakest level against the dollar since 1986, a move Spot On Chain’s Hupzy said would keep supporting crypto as long as the macro tailwind from currency depreciation persists until the rate differential narrows.
The post Arthur Hayes: Japan Yen Fix Could Fuel Bitcoin and Ethereum Rally appeared first on CryptoPotato.








Ethereum price fell 2.6% toward $1,870 on Aug. 11 after another rejection below $1,950 triggered long liquidations, while traders reduced risk ahead of the latest U.S. inflation report.
Summary
- Ethereum price fell 2.6% toward $1,870 after buyers failed to sustain a move above $1,900.
- The daily RSI remains neutral at 51.63, but ETH is below three major moving averages.
- Liquidation clusters at $1,895 and $1,940 could amplify a recovery, while $1,857 anchors downside liquidity.
- Analysts identify $1,850 as the bullish invalidation level and $1,950 as the breakout threshold.
Ethereum price falls below $1,900
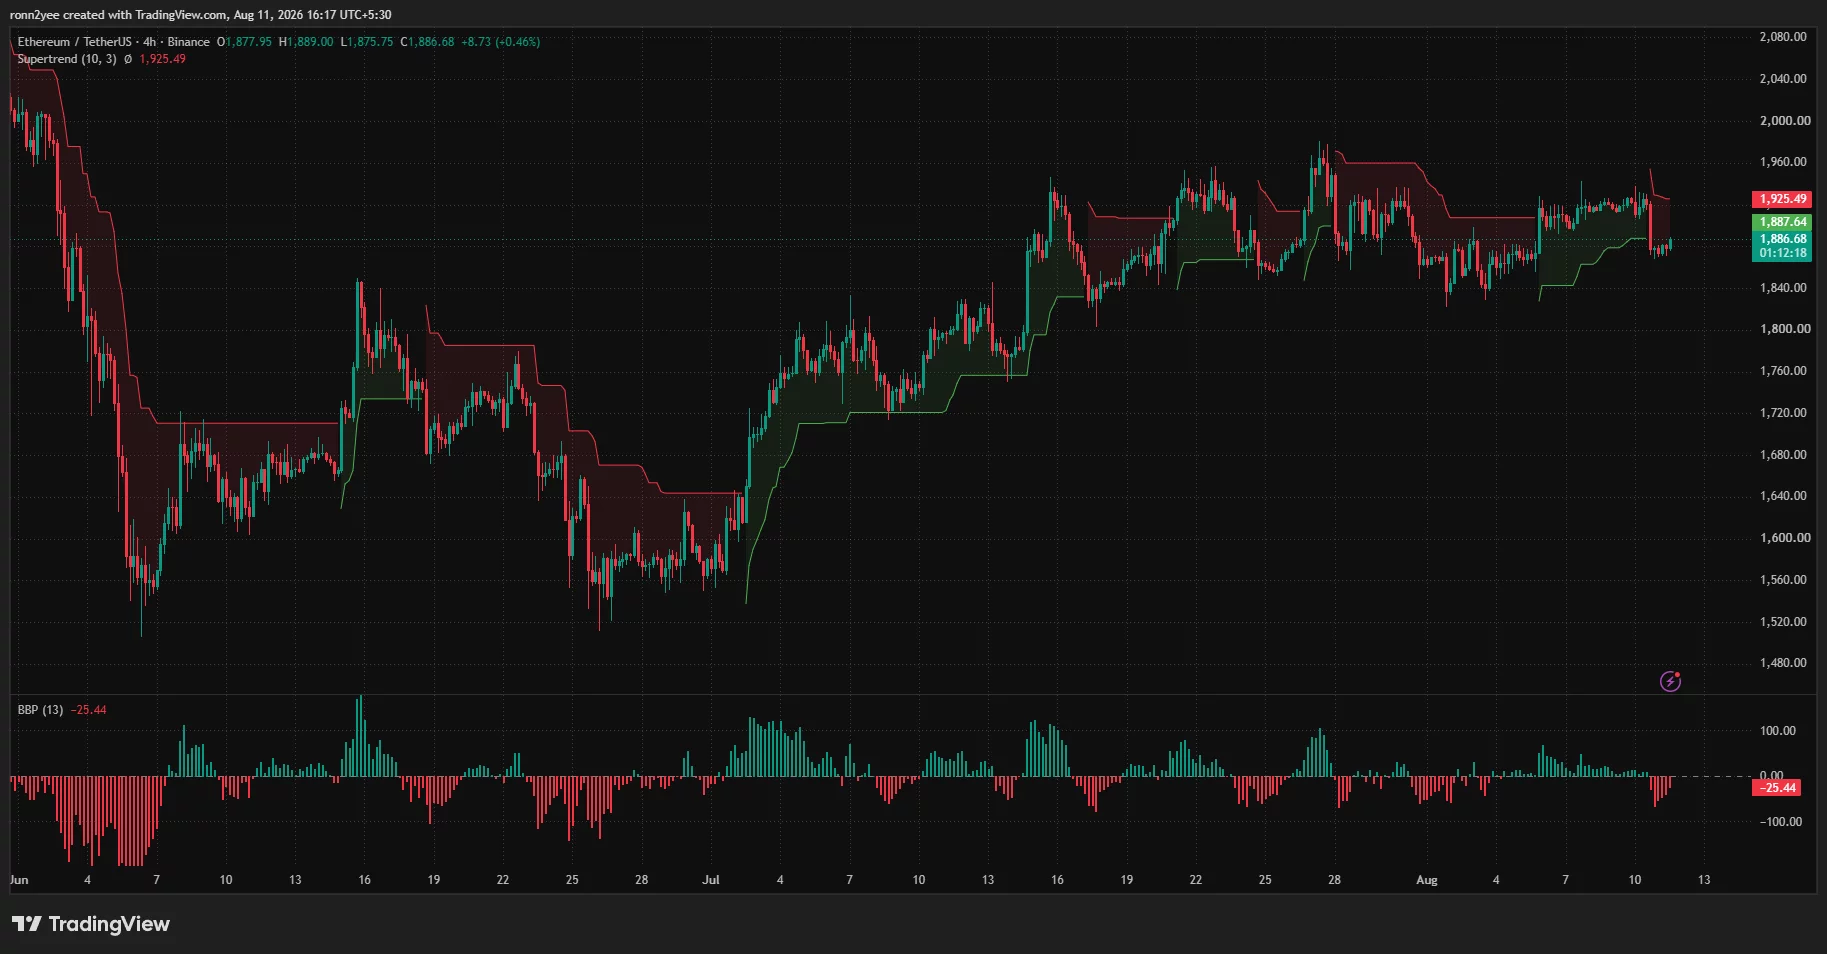
According to data from crypto.news, Ethereum (ETH) price traded near $1,870 during the latest session after sellers rejected another attempt to hold above the $1,900 psychological level. The decline extended from the Aug. 10 high near $1,935 and briefly pushed the token toward an intraday low of approximately $1,867.
ETH had recovered to around $1,886 by the time the accompanying charts were captured, reducing part of the daily loss. However, the rebound left the price below the short-term resistance area that has contained every advance since late July.
The decline follows several days of compression between roughly $1,850 and $1,950. Ethereum briefly approached the upper end of that range during the previous session, but buyers could not generate enough momentum to secure a daily close above $1,900.
That rejection reversed the setup observed one day earlier, when Ethereum had held $1,900 while traders watched liquidity near $1,950. The loss of $1,900 has now returned attention to the lower boundary of the range.
The 4-hour chart shows that ETH remains in a wider recovery from its late-June low near $1,520. Still, its recent sequence of higher lows has not produced a decisive higher high above the July peak near $1,970, leaving the market without a confirmed breakout.
Why Ethereum price is under pressure
The immediate pressure came from Ethereum’s failure to clear the $1,900–$1,950 resistance zone. Repeated rejections in the same area encouraged short-term traders to take profits, while the move below $1,900 exposed leveraged long positions opened in anticipation of a breakout.
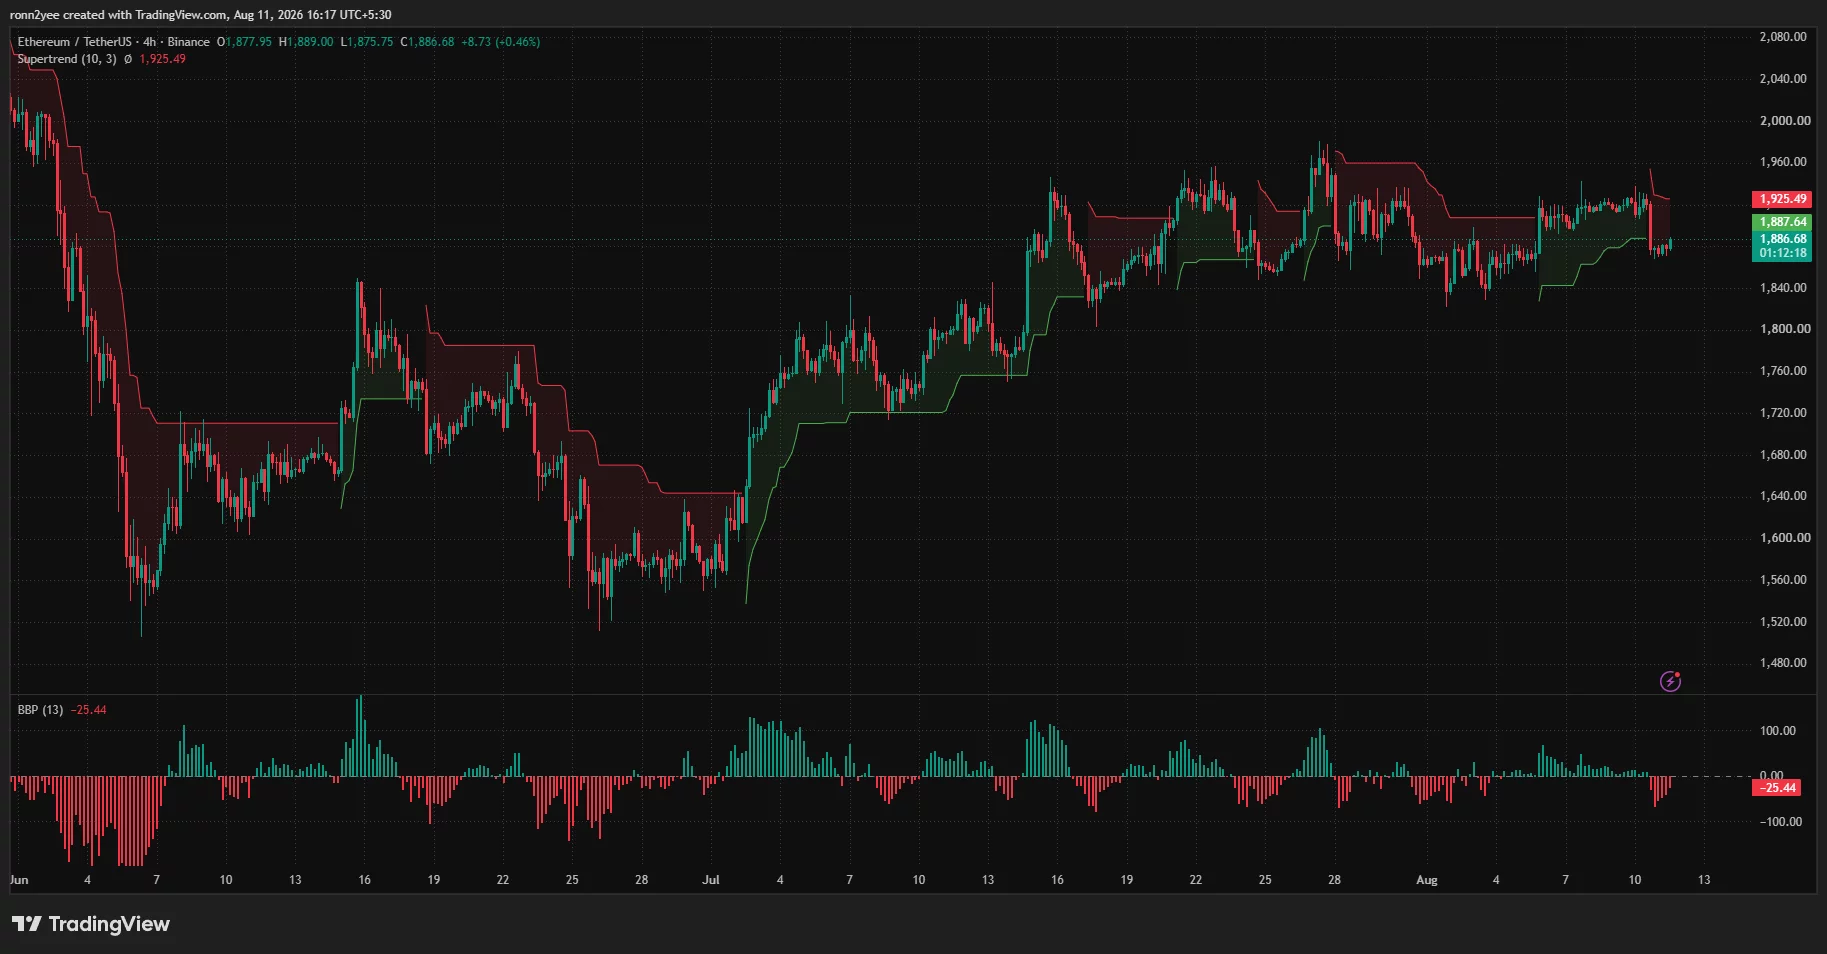
The 4-hour Bull Bear Power indicator has fallen to -25.44, showing that sellers have regained short-term control. Negative readings do not guarantee an extended decline, but they show that buying pressure has weakened since ETH approached $1,930.
The 4-hour Supertrend has also flipped bearish, placing dynamic resistance at approximately $1,925. ETH would need to reclaim that level before the indicator supports another move toward $1,950.
Broader risk appetite remains cautious before the July U.S. Consumer Price Index report. The Bureau of Labor Statistics will publish the data on Aug. 12 at 8:30 a.m. Eastern, making it the next major macroeconomic catalyst for U.S. crypto traders.
A hotter-than-expected reading could support a higher-for-longer Federal Reserve policy outlook and pressure speculative assets. Softer inflation, by contrast, could improve liquidity expectations and help ETH challenge its overhead resistance.
Rising energy prices have added uncertainty to that outlook. Higher oil costs can feed into headline inflation and complicate expectations for future U.S. interest-rate decisions, although the direct effect on Ethereum will depend on the CPI result and the market’s response.
ETH liquidation map points to $1,895 and $1,940
The 3-day CoinGlass liquidation heatmap shows a dense concentration of leveraged positions near $1,895, just above Ethereum’s current price. This is the closest major upside liquidity pool and could attract price if ETH’s recovery continues.
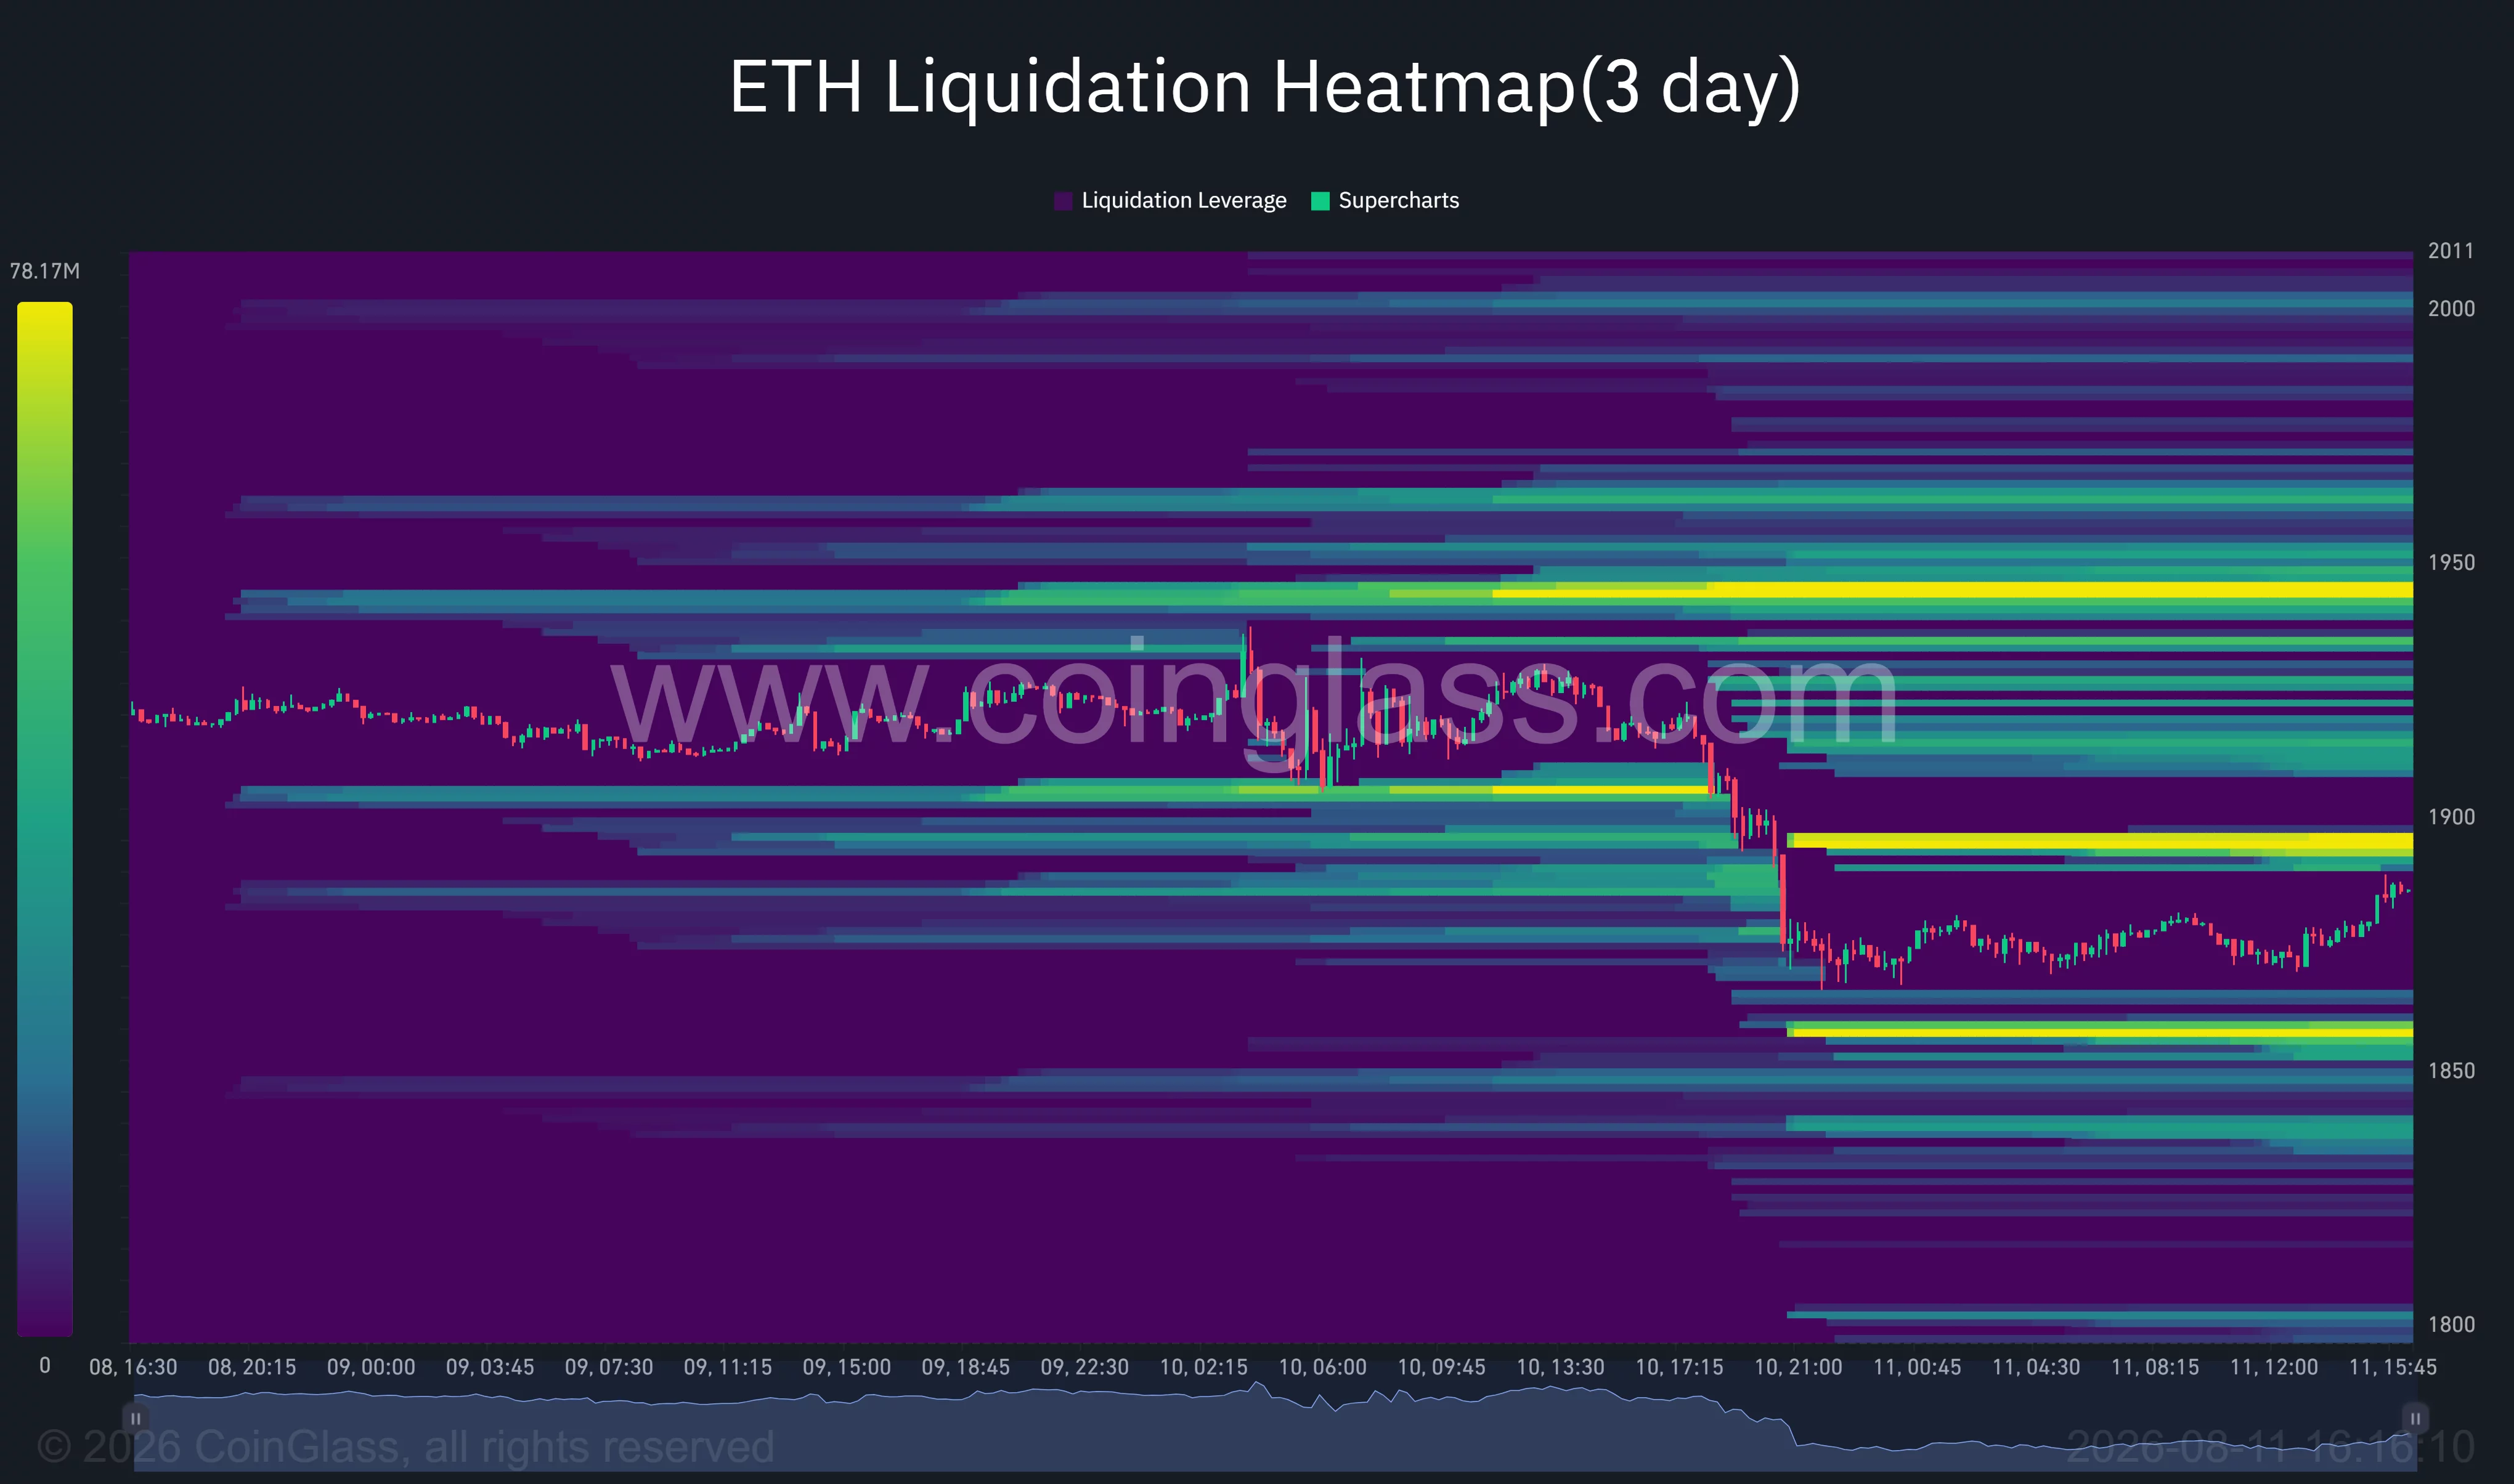
A move through $1,895 could liquidate nearby short positions and accelerate a return above $1,900. The resulting forced buying may then expose smaller liquidity bands between approximately $1,915 and $1,930.
The strongest overhead concentration appears near $1,940. That level sits inside the same resistance zone that stopped Ethereum’s recent advances, making it both a technical barrier and a potential short-squeeze target.
Downside liquidity is concentrated around $1,857. A decline into that area could trigger another wave of long liquidations before buyers attempt to defend the broader $1,840–$1,850 support zone.
The heatmap therefore places ETH between two nearby leverage targets. Price compression within this structure raises the chance that a break on either side produces a sharper move as exchanges close positions caught offside.
Ethereum technicals keep $1,850 in focus
Ethereum’s daily chart presents a mixed setup. ETH is trading below its 20-day simple moving average at $1,892.52 and its 100-day average at $1,895.32, creating immediate resistance around $1,890–$1,900.
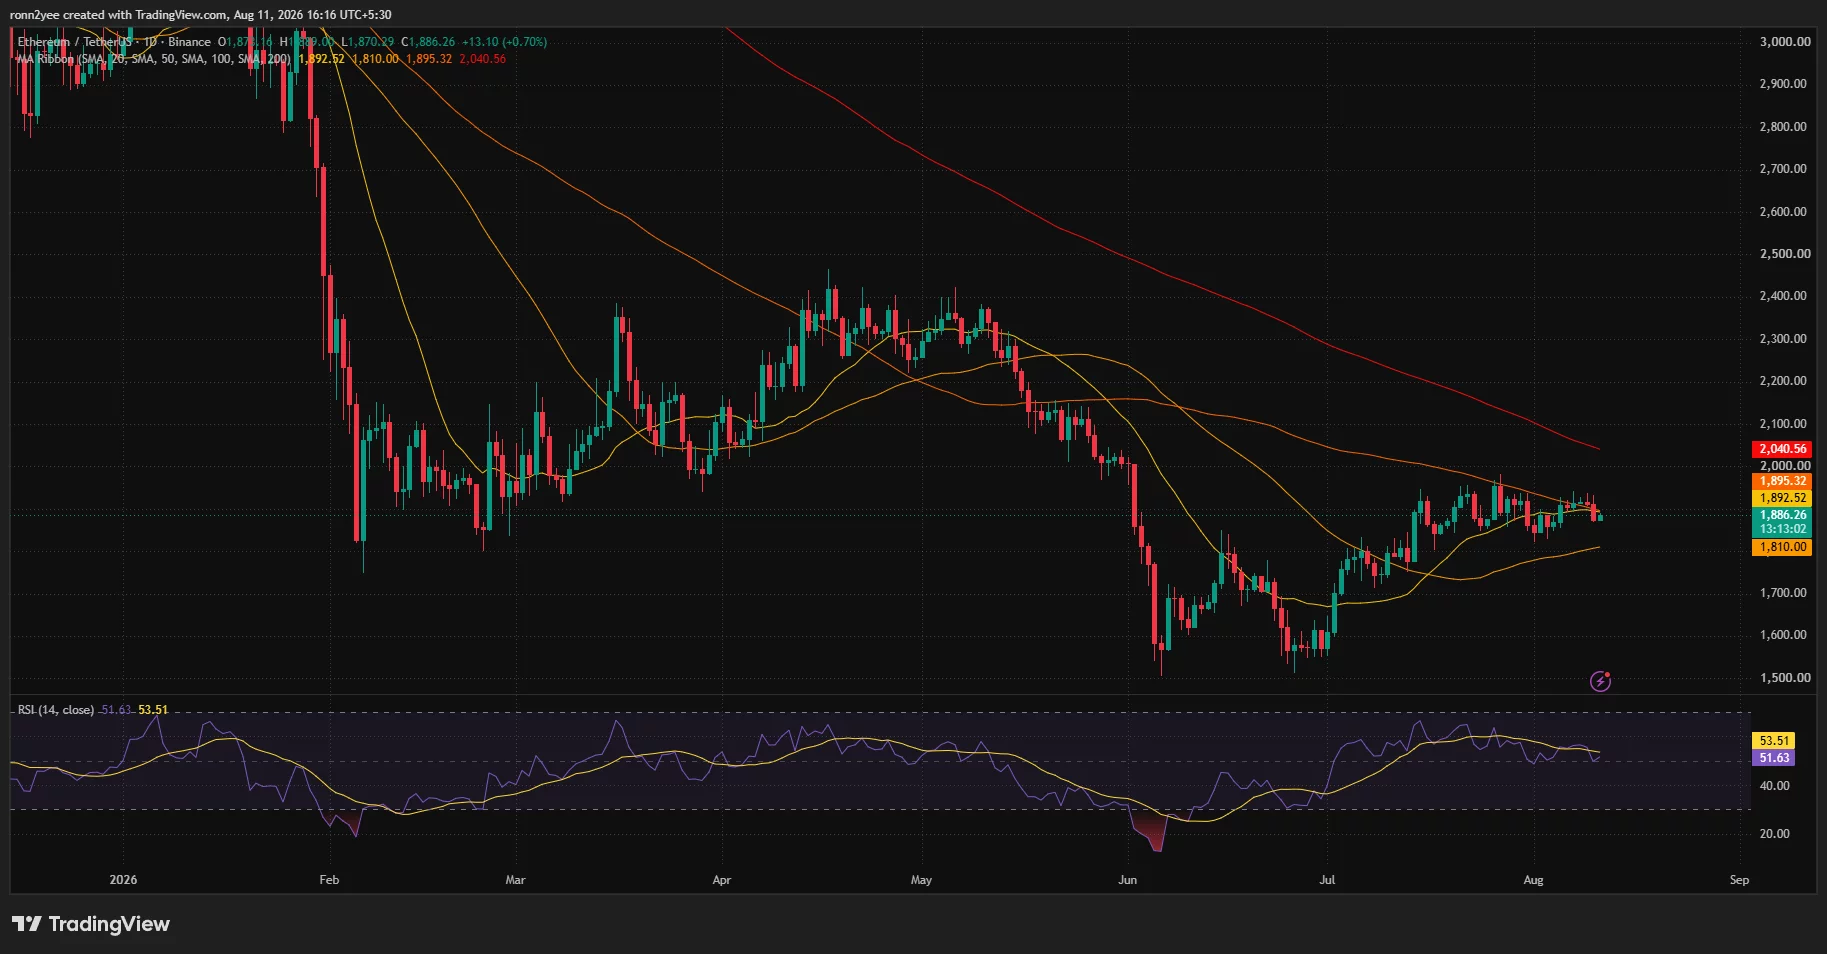
The token also remains well below the 200-day SMA at $2,040.56. That long-term average would become relevant only if ETH first breaks $1,950 and then establishes support above $2,000.
The 50-day SMA at $1,810 provides the closest major dynamic support below the current range. Its upward slope reflects the recovery from June, but a move toward that average would confirm that the $1,850 floor had failed.
Daily momentum remains neutral rather than deeply bearish. The Relative Strength Index stands at 51.63, slightly below its signal average of 53.51. That reading gives sellers some short-term control without placing Ethereum near oversold conditions.
Analyst Ted Pillows identified $1,850 as a must-hold area if Ethereum is to produce another push above $1,900. His chart places subsequent upside levels near $2,000 and $2,190, while a confirmed loss of the current support could open a decline toward $1,700 and eventually the $1,550 region.
Daan Crypto Trades offered a similar range assessment, arguing that ETH must break and hold $1,950 to open a move above $2,100.
“Especially seeing how compressed price has been here, a breakout (to either side) should come with a decent squeeze of positions that are caught offside.”
He also marked $1,850 as the bullish invalidation level. Together, the two assessments establish a clear short-term structure: $1,850 controls the downside, while $1,950 separates continued consolidation from a stronger recovery.
U.S. CPI could decide Ethereum’s next move
Institutional demand provides some support despite the short-term price weakness. U.S. spot Ethereum ETFs attracted approximately $244.9 million during the week ended Aug. 7, according to recent flow data.
Those inflows challenge the idea that institutional investors have completely withdrawn from ETH. However, ETF demand has not yet been strong enough to force a breakout through the $1,950 resistance area.
The next directional move may depend on whether U.S. inflation data strengthens or weakens the dollar and Treasury yields. A favorable response could help Ethereum reclaim $1,900 and target the $1,925 Supertrend level, followed by the $1,940–$1,950 liquidity zone.
Failure to recover $1,900 would keep ETH vulnerable to another test of $1,857 and $1,850. A daily close below that support would expose the 50-day SMA near $1,810, while sustained selling could place the July consolidation area around $1,700 back in focus.
For now, Ethereum remains compressed between a well-defended floor and heavy overhead supply. The reaction at $1,850 or a confirmed break above $1,950 will provide stronger evidence of the market’s next trend.
Disclosure: This article does not represent investment advice. The content and materials featured on this page are for educational purposes only.
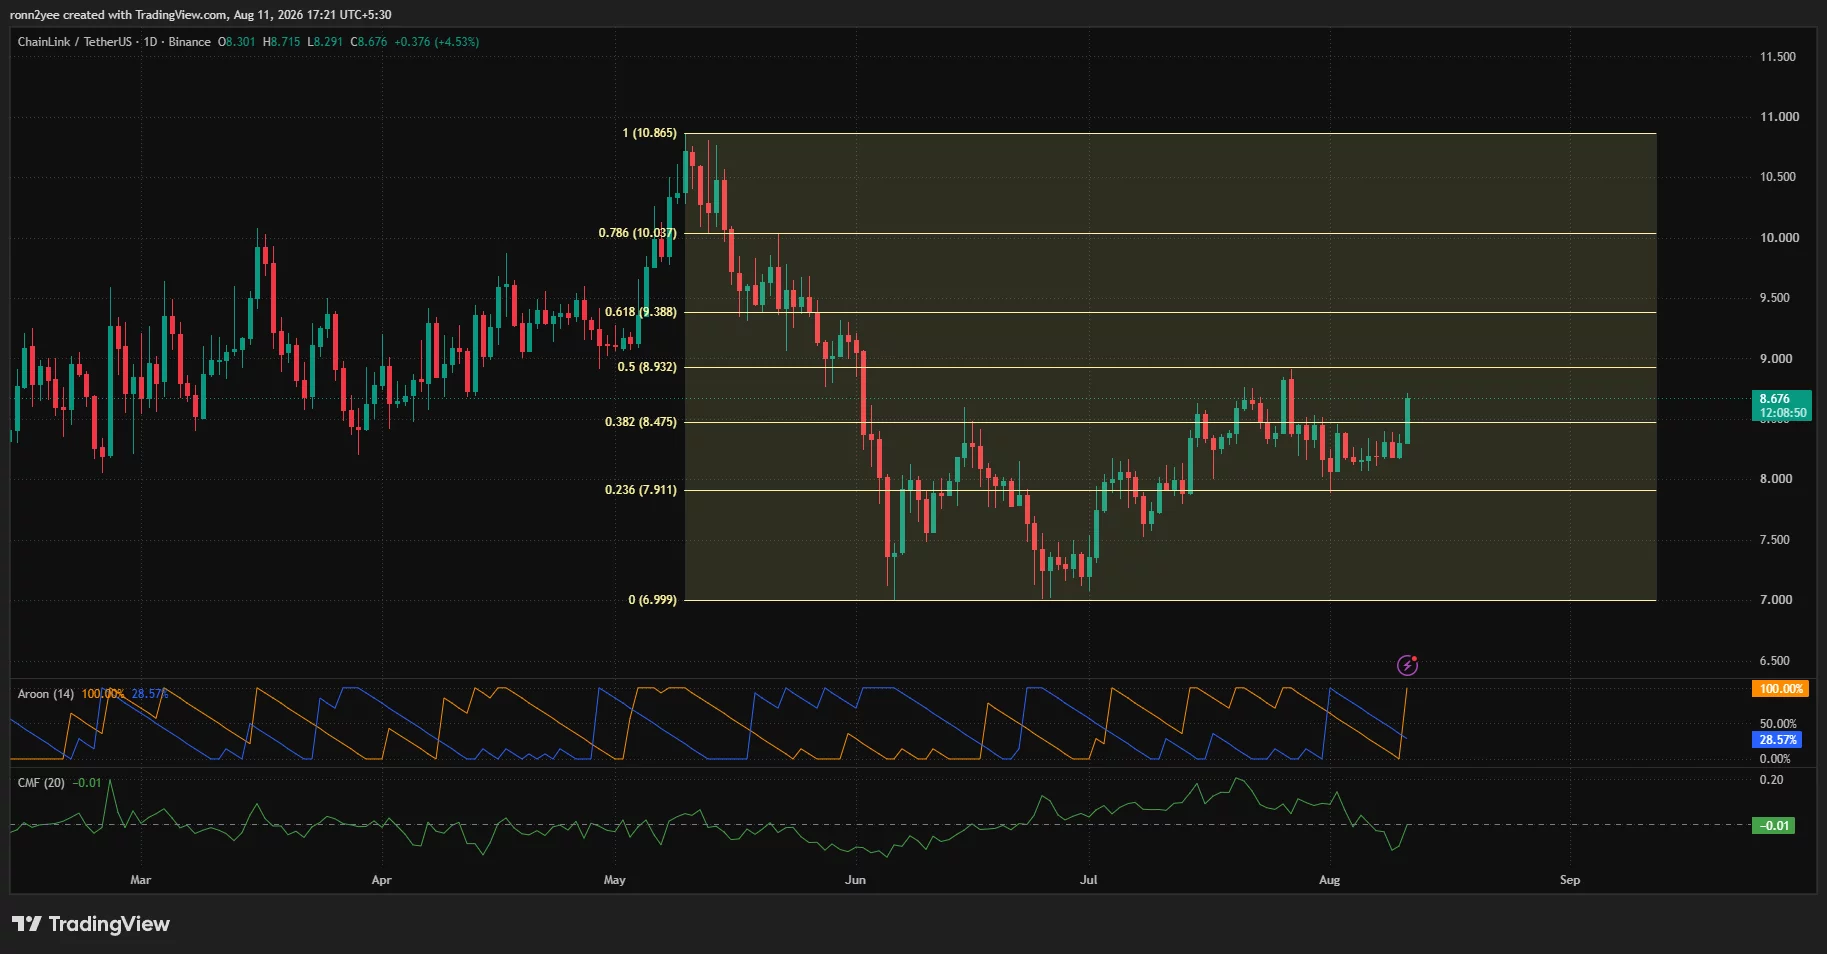
Chainlink price rose 4.5% to $8.67 on Aug. 11 after Standard Chartered initiated coverage with a $200 target for 2030, while technical indicators pointed to improving short-term momentum.
Summary
- Chainlink gained 4.5% to $8.67, breaking above the daily chart’s $8.48 Fibonacci level.
- Standard Chartered projected LINK could reach $200 by 2030 as asset tokenization expands.
- LINK’s 4-hour Supertrend turned bullish, establishing immediate dynamic support near $8.21.
- Liquidation clusters above $8.70 and $8.90 could pull LINK price toward the next resistance zone.
Chainlink price rallies above $8.48 resistance
According to data from crypto.news, Chainlink (LINK) price traded at $8.67 at the time of writing, up 4.5% over the previous 24 hours. LINK opened the daily session near $8.30, fell briefly to $8.29, and then climbed as high as $8.72.
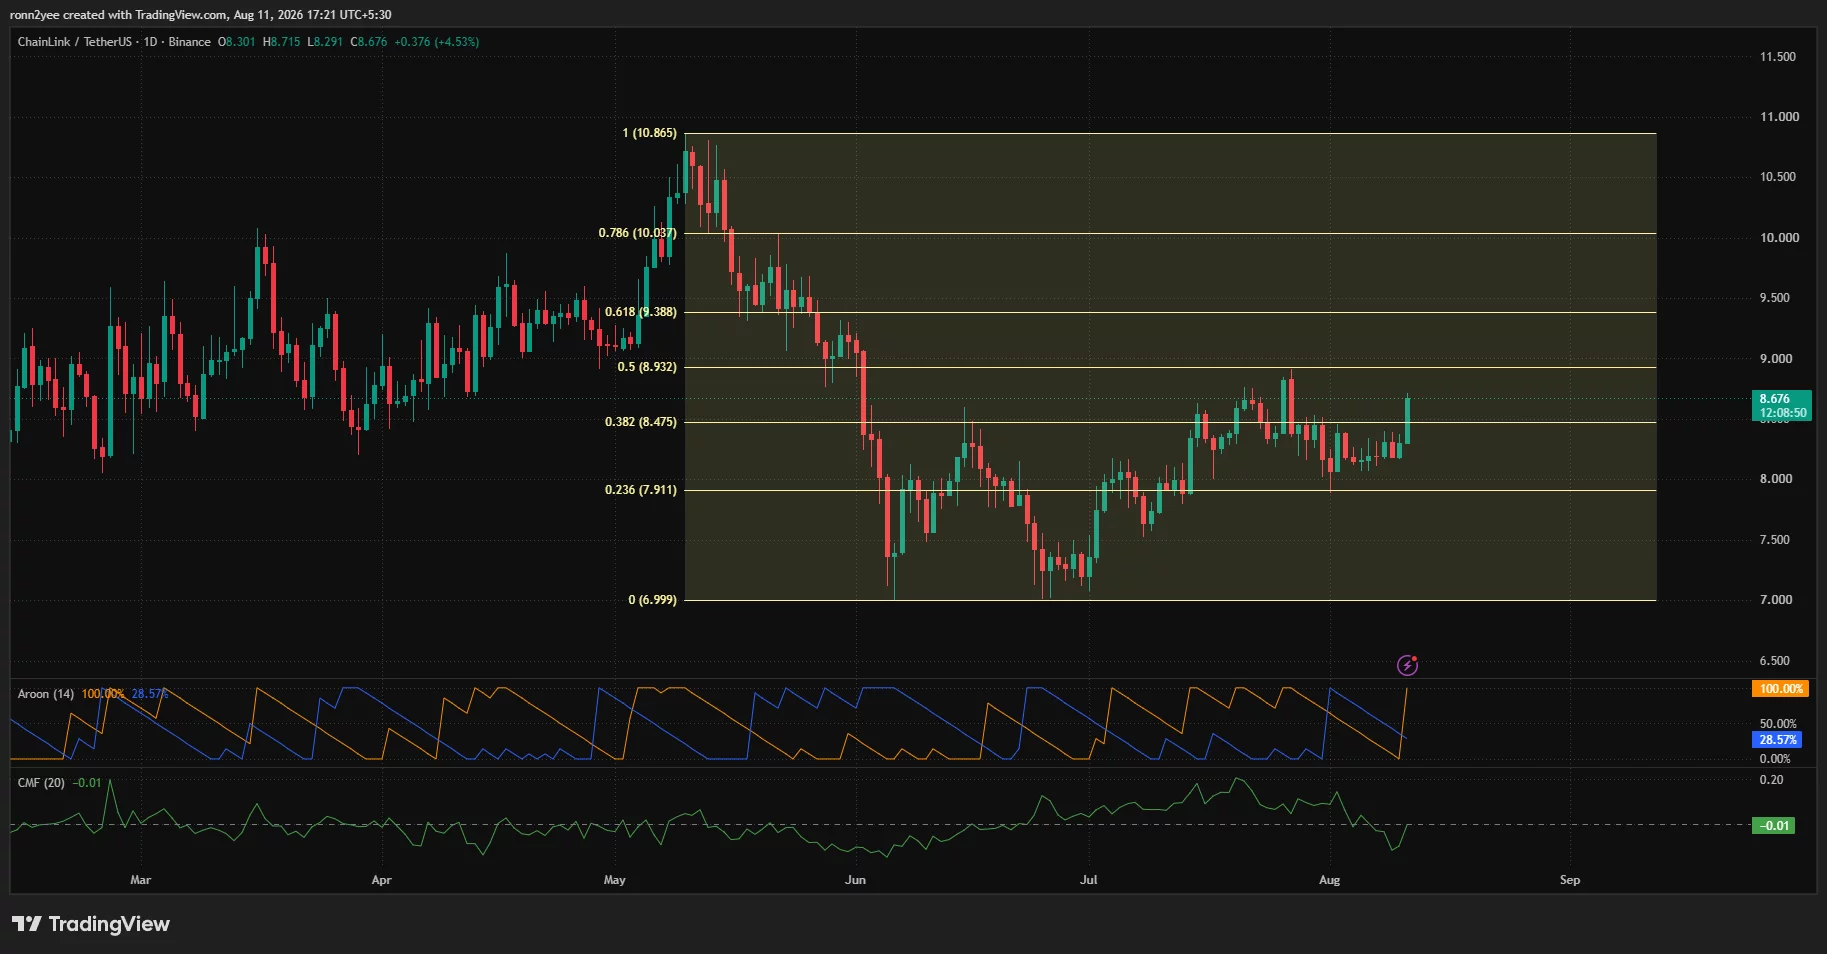
The move pushed LINK above the 38.2% Fibonacci retracement level at $8.48, calculated from its May high of $10.87 to its June low near $7.00. That level had restricted several recovery attempts since late July.
Holding above $8.48 would give buyers a stronger base for challenging the 50% retracement at $8.93. The latter also sits near a local high identified by trader Daan Crypto Trades, making the $8.90–$8.93 area the most important immediate resistance zone.
LINK has now recovered about 24% from its late-June low. However, it remains below its May peak and has yet to confirm a broader trend reversal on the daily chart.
The daily Aroon indicator showed a sharp improvement in bullish momentum. Aroon Up reached 100%, compared with Aroon Down at 28.57%, indicating that LINK recorded a recent high while downside momentum weakened.
Still, the Chaikin Money Flow remained marginally negative at -0.01. The reading suggests that the price breakout has not yet received strong confirmation from sustained capital inflows. A move above zero would add weight to the bullish setup.
Standard Chartered’s $200 LINK target drives demand
The rally followed a Standard Chartered research note that initiated coverage of LINK with a $200 price target for the end of 2030. The target represents a gain of more than 2,200% from the token’s current price.
Geoff Kendrick, the bank’s global head of digital assets research, reportedly set interim targets of $13 for the end of 2026, $41 for 2027, $82 for 2028, and $133 for 2029.
The forecast rests largely on Standard Chartered’s expectation that tokenized assets held on public blockchains could grow from about $340 billion to $4 trillion by the end of 2028. The bank expects increased tokenization to raise demand for oracle data, cross-chain transfers, and compliance infrastructure.
Chainlink currently secures more than $110 billion in oracle-dependent value, representing about 70% of the global market and over 80% of the value secured by oracles on Ethereum, according to figures cited in the report.
Standard Chartered also estimated that Chainlink’s fee revenue could expand about 25-fold by 2030 as tokenized assets move between traditional finance and decentralized networks. However, the $200 figure remains a long-term forecast rather than a guaranteed price outcome.
The positive report arrived as LINK supply on centralized exchanges continued to decline. More than 15.7 million tokens reportedly left exchanges over a recent one-month period, reducing exchange-held supply by about 12%.
Separately, approximately 1.26 million LINK, valued at more than $10 million at the time, left centralized platforms in one day in early August. Exchange withdrawals can reduce immediately available selling supply, although they do not reveal whether holders intend to accumulate, use the tokens on-chain or transfer them elsewhere.
LINK technical indicators favor another test of $8.90
The 4-hour chart supports the short-term bullish case. LINK broke above the Supertrend resistance near $8.37, causing the indicator to flip positive and establish trailing support at $8.21.
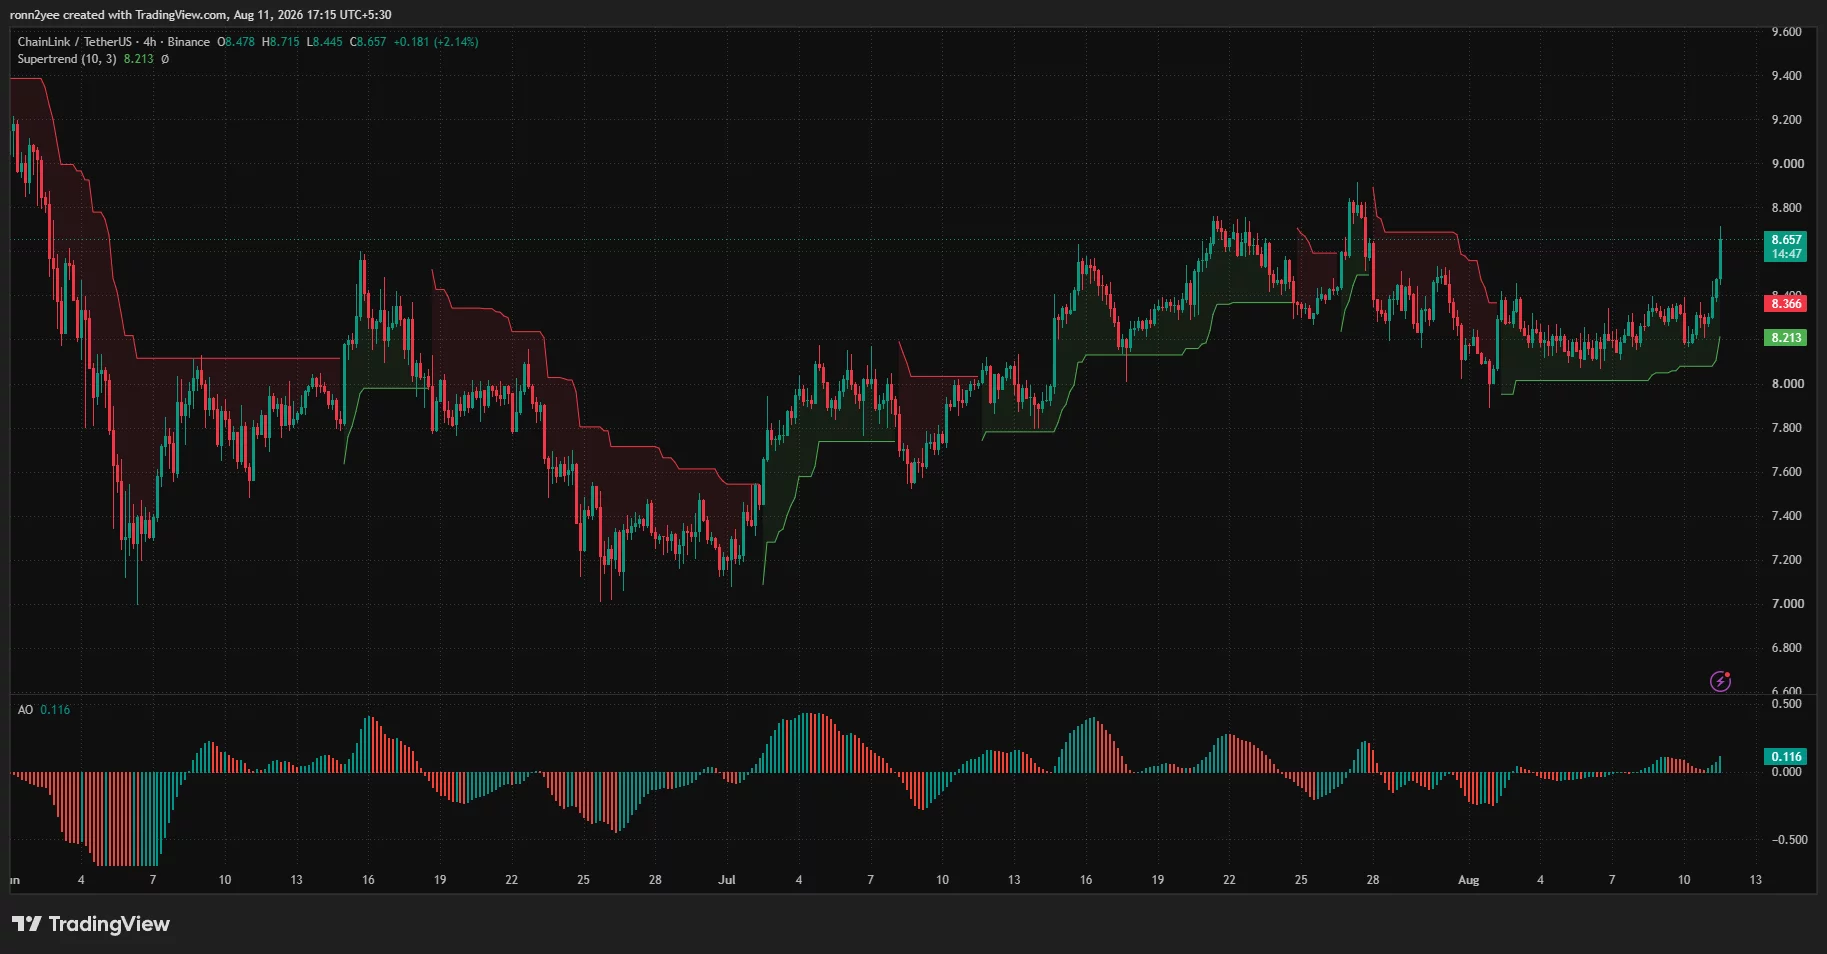
Price also cleared the narrow consolidation range between roughly $8.10 and $8.40 that had been in place since the beginning of August. Buyers must now defend the former upper boundary around $8.36 during any retest.
The Awesome Oscillator rose to 0.116 and printed an expanding green bar above the zero line. This shows that short-term momentum is accelerating relative to the longer-term average.
Immediate resistance sits around $8.72, corresponding with Tuesday’s intraday high. A close above that level would leave $8.90–$8.93 as the next target. Beyond $8.93, the daily Fibonacci chart identifies resistance at $9.39, followed by $10.04.
A rejection from the current area would put $8.48 back in focus. Below that, the former Supertrend resistance at $8.36 and active Supertrend support at $8.21 form the main defense for the breakout.
Losing $8.21 could invalidate the immediate bullish setup and expose LINK to $7.91, the daily chart’s 23.6% Fibonacci level. The larger downside liquidity concentration sits near $8.00, making that psychological level important if broader crypto market conditions weaken.
Liquidation map points to volatility above $8.70
CoinGlass’ one-week LINK liquidation heatmap shows that the token has already moved through a dense concentration of leveraged positions around $8.45–$8.55. LINK’s price was approaching another set of liquidation bands above $8.70 when the chart was captured.
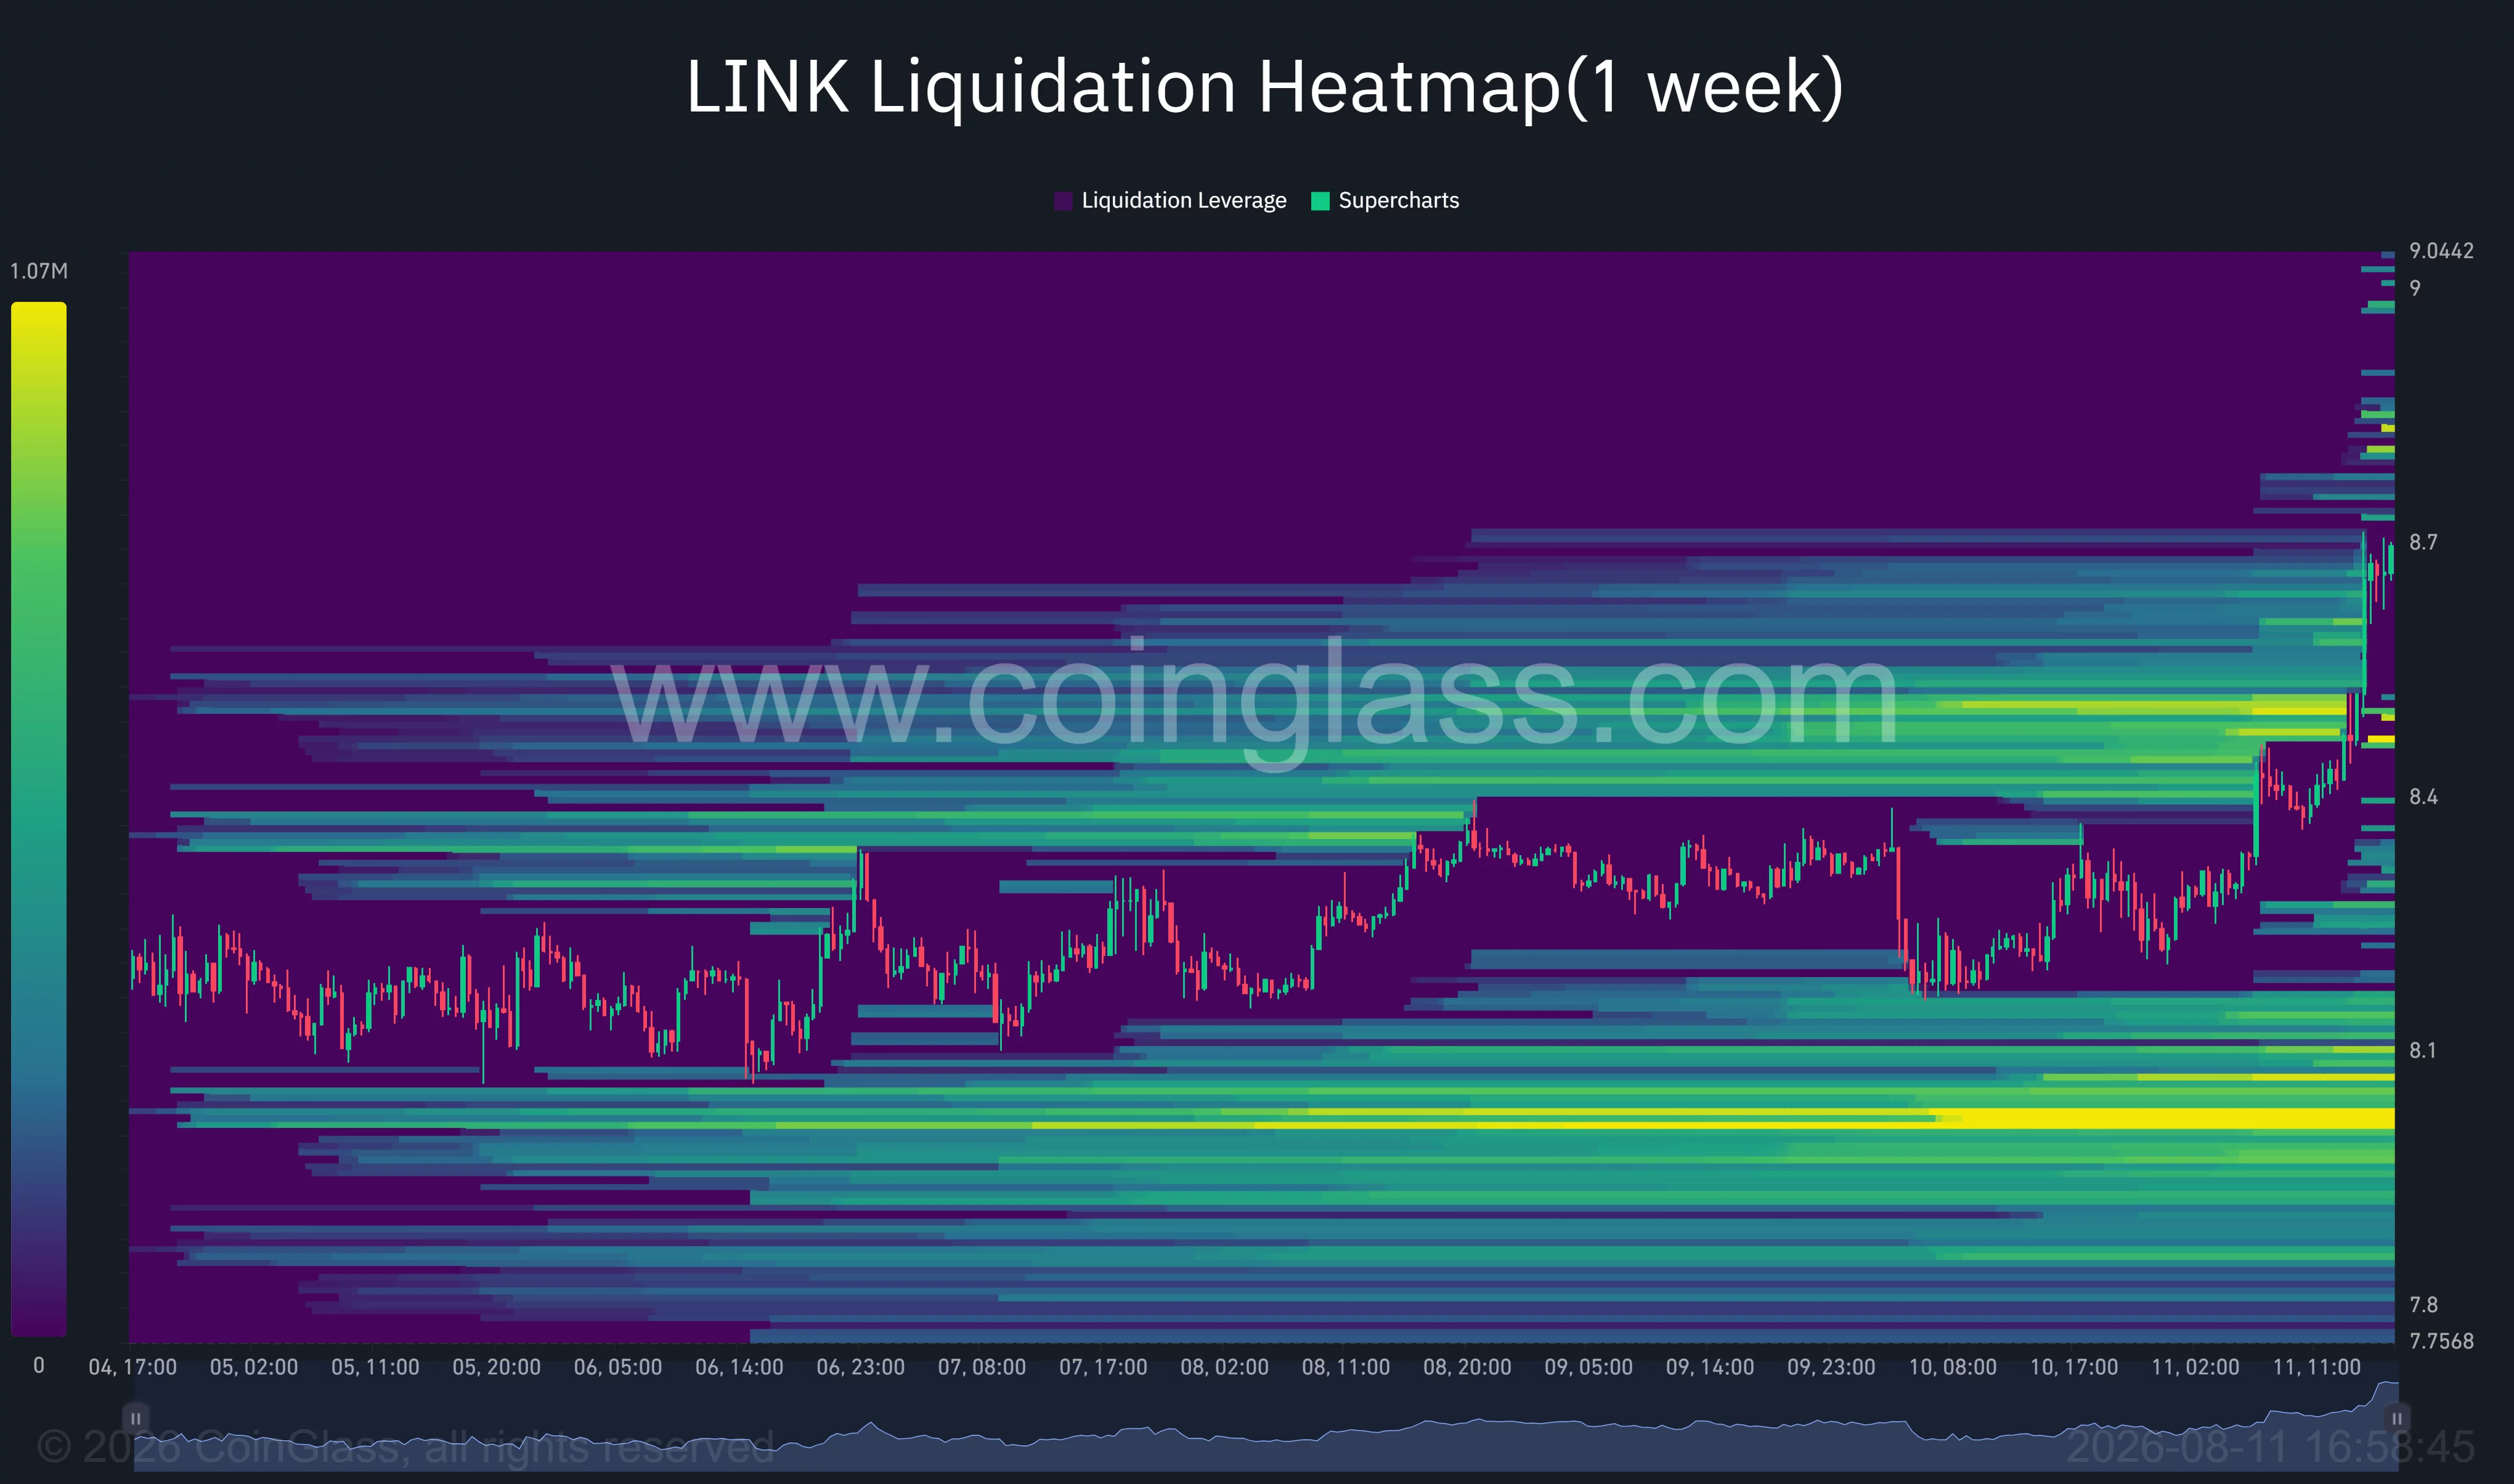
Further short-liquidation liquidity appears between approximately $8.80 and $8.90. If LINK holds above $8.60, these positions could provide fuel for another short squeeze toward the $8.93 technical target.
On the downside, the largest visible liquidation cluster lies near $8.00–$8.05. A failed breakout and decline below $8.21 could therefore accelerate as leveraged long positions are closed.
Daan Crypto Trades also identified $8.90 as the key level needed to confirm a continuation. The trader said LINK had returned to its highest-volume historical price area and was holding higher-time-frame support.
“I want to see a move above $8.9 to break the local high and get a move going,” Daan said.
For U.S. traders, the next macro risk is the July Consumer Price Index report. A stronger-than-expected inflation reading could pressure crypto assets by reducing expectations for Federal Reserve rate cuts. LINK’s ability to hold $8.48 during a broader risk-off move would provide a clearer test of whether the Standard Chartered-driven demand can extend beyond the initial rally.
Disclosure: This article does not represent investment advice. The content and materials featured on this page are for educational purposes only.
eToro has agreed to acquire U.S.-focused brokerage TradeZero for up to $231 million as the trading platform pushes further into the American market while crypto activity among its users continues to fall.
Summary
- eToro agreed to acquire U.S. brokerage TradeZero for up to $231 million as it expands its presence in the American trading market.
- TradeZero generated about $80 million in revenue with an 81% gross margin during the 12 months ended June 30, 2026.
- eToro reported $1.34 billion in crypto revenue for the second quarter, down about 30% from $1.9 billion a year earlier.
- Crypto trading activity continued to fall, with July trades dropping 73% year over year to 1.4 million and the amount invested falling 50%.
- The TradeZero acquisition is expected to close in the first half of 2027, subject to regulatory approvals and customary closing conditions.
eToro said Tuesday that the cash-and-stock transaction would add TradeZero’s active-trader customer base and brokerage infrastructure to its U.S. operations, with the acquisition expected to close in the first half of 2027 after regulatory approvals and other customary closing conditions are met.
The company expects the purchase to increase adjusted earnings per share during the first year after completion. TradeZero generated about $80 million in revenue during the 12 months ended June 30, 2026, with an 81% gross margin, according to eToro.
Founded in 2015, TradeZero serves active traders in the United States and also operates in Canada and international markets. Its platforms provide trading in stocks and options alongside extended-hours access, short-selling tools, market scanners and other services geared toward frequent traders.
“Today’s announcement is an important step in building our US business,” eToro co-founder and CEO Yoni Assia said. He added that combining the companies would provide “a faster path to launching new products for US customers.”
TradeZero deal adds to eToro’s U.S. expansion
The acquisition would give eToro additional infrastructure in a market where the company has operated since launching its U.S. platform in 2019. Europe and the U.K. have historically accounted for much of eToro’s business, while the company has been expanding in the Americas and Asia-Pacific.
Under the transaction terms, eToro would pay cash and issue up to 2.5 million new Class A shares, with total consideration reaching as much as $231 million after customary purchase-price adjustments.
Jefferies is acting as eToro’s exclusive financial adviser, while Simpson Thacher & Bartlett is serving as its lead deal counsel. J.P. Morgan Securities is advising TradeZero, with Choate, Hall & Stewart serving as the brokerage’s lead counsel.
The deal was announced alongside eToro’s second-quarter results, when adjusted earnings reached $0.68 per share, above the $0.61 expected by analysts surveyed by LSEG. Net trading income from equities, commodities and currencies increased 24% year over year to $141.6 million, led mainly by equities trading.
Trading patterns among existing customers also changed during the quarter. More than 60% of users who had traded commodities during the previous two quarters went on to trade equities during the second quarter, according to the company.
Chief Financial Officer Meron Shani said nearly nine in ten of the users who moved from commodities into equities had also traded cryptocurrencies on eToro, showing significant overlap between customers using its different asset classes.
Crypto trading on eToro has continued to fall
Crypto activity remained much weaker than a year earlier despite eToro continuing to invest in digital-asset products.
The company reported $1.59 billion in total revenue for the second quarter, compared with about $2 billion during the corresponding period of 2025. Revenue reported from crypto assets fell to roughly $1.34 billion from $1.9 billion a year earlier.
Because eToro reports cryptoasset revenue on a gross basis, much of the figure is offset by the cost of acquiring the cryptoassets involved in customer transactions. Crypto-related cost of revenue reached about $1.35 billion during the quarter, while net income attributed to crypto assets was $19.7 million.
Total company net income stood at $53.4 million, while equities and commodities-related trading generated about $141 million in net trading income.
The decline followed weakness recorded earlier in the year. In May, crypto.news reported on eToro’s results showing that April crypto trades had fallen 32% from a year earlier to 2 million, while the amount invested per crypto trade dropped 22% to $207. The company nevertheless posted $82 million in first-quarter net income, up 37% year over year.
The drop accelerated into July. eToro recorded about 1.4 million cryptocurrency trades during the month, 73% fewer than a year earlier, while the amount invested in crypto fell 50%.
Earlier first-quarter figures showed the same pattern in crypto-related earnings. Crypto generated about $13 million in profit during Q1, down from $46 million in the same quarter of 2025, even as eToro’s overall net contribution increased to $258 million.
At the same time, assets under administration reached $17 billion at the end of March, up 15% year over year, while funded accounts increased 12% to 4.02 million. By April, assets under administration had increased further to $18.7 billion.
eToro is still building its crypto business
Lower crypto trading activity has not stopped eToro from adding products and infrastructure tied to digital assets.
On April 30, the company completed its acquisition of Zengo, a self-custodial crypto wallet provider that uses multi-party computation technology rather than conventional seed phrases. eToro said the purchase would help connect its traditional financial products with onchain infrastructure.
The company also activated its BitLicense earlier this year to begin offering cryptocurrency trading in New York. At the time, eToro had expanded its crypto offering to more than 150 assets globally, including more than 100 assets available to U.S. customers.
In July, eToro led a $12.5 million strategic investment in decentralized perpetual futures exchange Extended, with Jump Crypto also participating. As previously covered by crypto.news, the financing was accompanied by a partnership between Extended and Zengo to explore access to financial markets through onchain trading infrastructure.
Extended operates using StarkWare’s StarkEx technology and focuses on perpetual futures that can be traded through a self-custodial structure. The platform opened trading to all users in late 2024.
eToro has also pushed equities onto blockchain rails
eToro’s work around digital assets has included attempts to combine its equities business with blockchain-based settlement rather than relying only on cryptocurrency trading.
In July 2025, eToro announced plans to issue tokenized versions of U.S.-listed stocks on Ethereum, alongside 24/5 trading for 100 U.S. stocks and exchange-traded funds. The company also disclosed work with CME Group on spot-quoted futures.
Under the proposed tokenization model, users would be able to move supported stock tokens onto Ethereum and redeem them against underlying positions held through eToro. Assia said at the time that the company planned to start with stocks as part of its tokenization work.
The initiative followed eToro’s 2019 acquisition of Danish tokenization company Firmo and its subsequent introduction of tokenized gold, silver and fiat currencies. Its U.S. product expansion has since continued alongside those blockchain initiatives, including New York crypto trading, the Zengo purchase and the planned acquisition of TradeZero.

Adam Peaty’s ‘hero worship’ of father-in-law Gordon Ramsay has led to copycat poses in a ‘desire to impress him and bond with him’, body language expert claims

OPINION: Regional WA needs migrants to survive

Nasdaq targets 24 hour trading with LeveL acquisition

Renter of Home in Anne Heche Crash Denies Settlement With Son

No Jackpot Winner as $257 Million Prize Rolls Over to $269 Million Monday Draw

Weekend Open Thread: Staud – Corporette.com

The Money Making Expert: The 7,11,4 Hack That Turns $1 Into $10K Per Month! Daniel Priestley

X PAYMENTS JUST WENT LIVE! ELON MUSK, RIPPLE & XRP TIES EXPOSED!

WOW XRP RIPPLE DOESN’T NEED CLARITY XRPL DEFI POTENTIAL UNLOCKED XRP ARMY GET READY
-

 Fashion4 days ago
Weekend Open Thread: Mattifying Sunscreen
-

 Fashion5 days ago
Frugal Friday’s Workwear Report: Cap-Sleeve Pointelle Crewneck Sweater
-

 Sports6 days ago
Jordan Coyle & Cordiamo take Laya Arena Stakes at RDS
-

 News Videos4 days ago
Can Astrology Help Find Gold and Silver Trends? A Financial Astrology Guide
-
 Business6 days ago
US stocks: Dow closes at record on Mideast optimism; SpaceX, AMD drag Nasdaq
-

 Politics6 days ago
Reform UK And Greens Sink To Lowest Favourability Ratings To Date
-

 Business6 days ago
Supply chain issues impact Ingredion
-

 Tech4 days ago
Rinn Pharma & Biopharma to join NordicPharmaTrain network
-

 Business3 days ago
How to Start a Cleaning Business: A Step-by-Step Guide
-

 Business3 days ago
Datadog: Best Of Breed For Multiple Reasons
-

 Business3 days ago
BDC Weekly Review: Private BDC Q2 Numbers Are Strong
-

 Business7 days ago
McDonald’s (MCD) Q2 2026 earnings
-
 NewsBeat5 hours ago
Communication cards help banking customers access services or report scams
-

 Fashion6 days ago
Suit of the Week: Me + Em
-
Sports6 days ago
Spider-Man: Brand New Day ending explained: Is Peter Parker alive?
-

 Crypto World7 days ago
Robinhood files $200M second venture fund focused on YC startups
-

 Tech5 days ago
Price Hikes May Be Coming for PC Motherboards Next
-
 Fashion7 days ago
Birthstone pendant necklaces for women by ottomanhands – 18ct gold plated
-
 Crypto World6 days ago
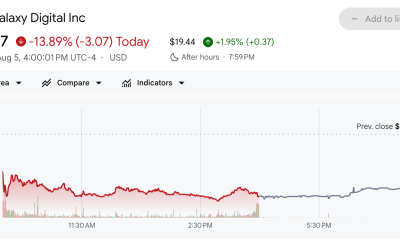
Galaxy Digital Stock Slides 14% as Crypto Prices Hit Earnings
-

 Business5 days ago
Brightwater secures funding for WA-first dementia projects
You must be logged in to post a comment Login