
Crypto World
SOL Holders Could Face New Risk
Solana price has moved sideways in recent sessions, showing consolidation rather than decisive recovery. Despite this bounce, investor behavior suggests confidence remains limited across the broader crypto market.
The past 10 days have reflected relative stability within a defined trading range. However, stability has not translated into renewed accumulation.
Sponsored
Sponsored
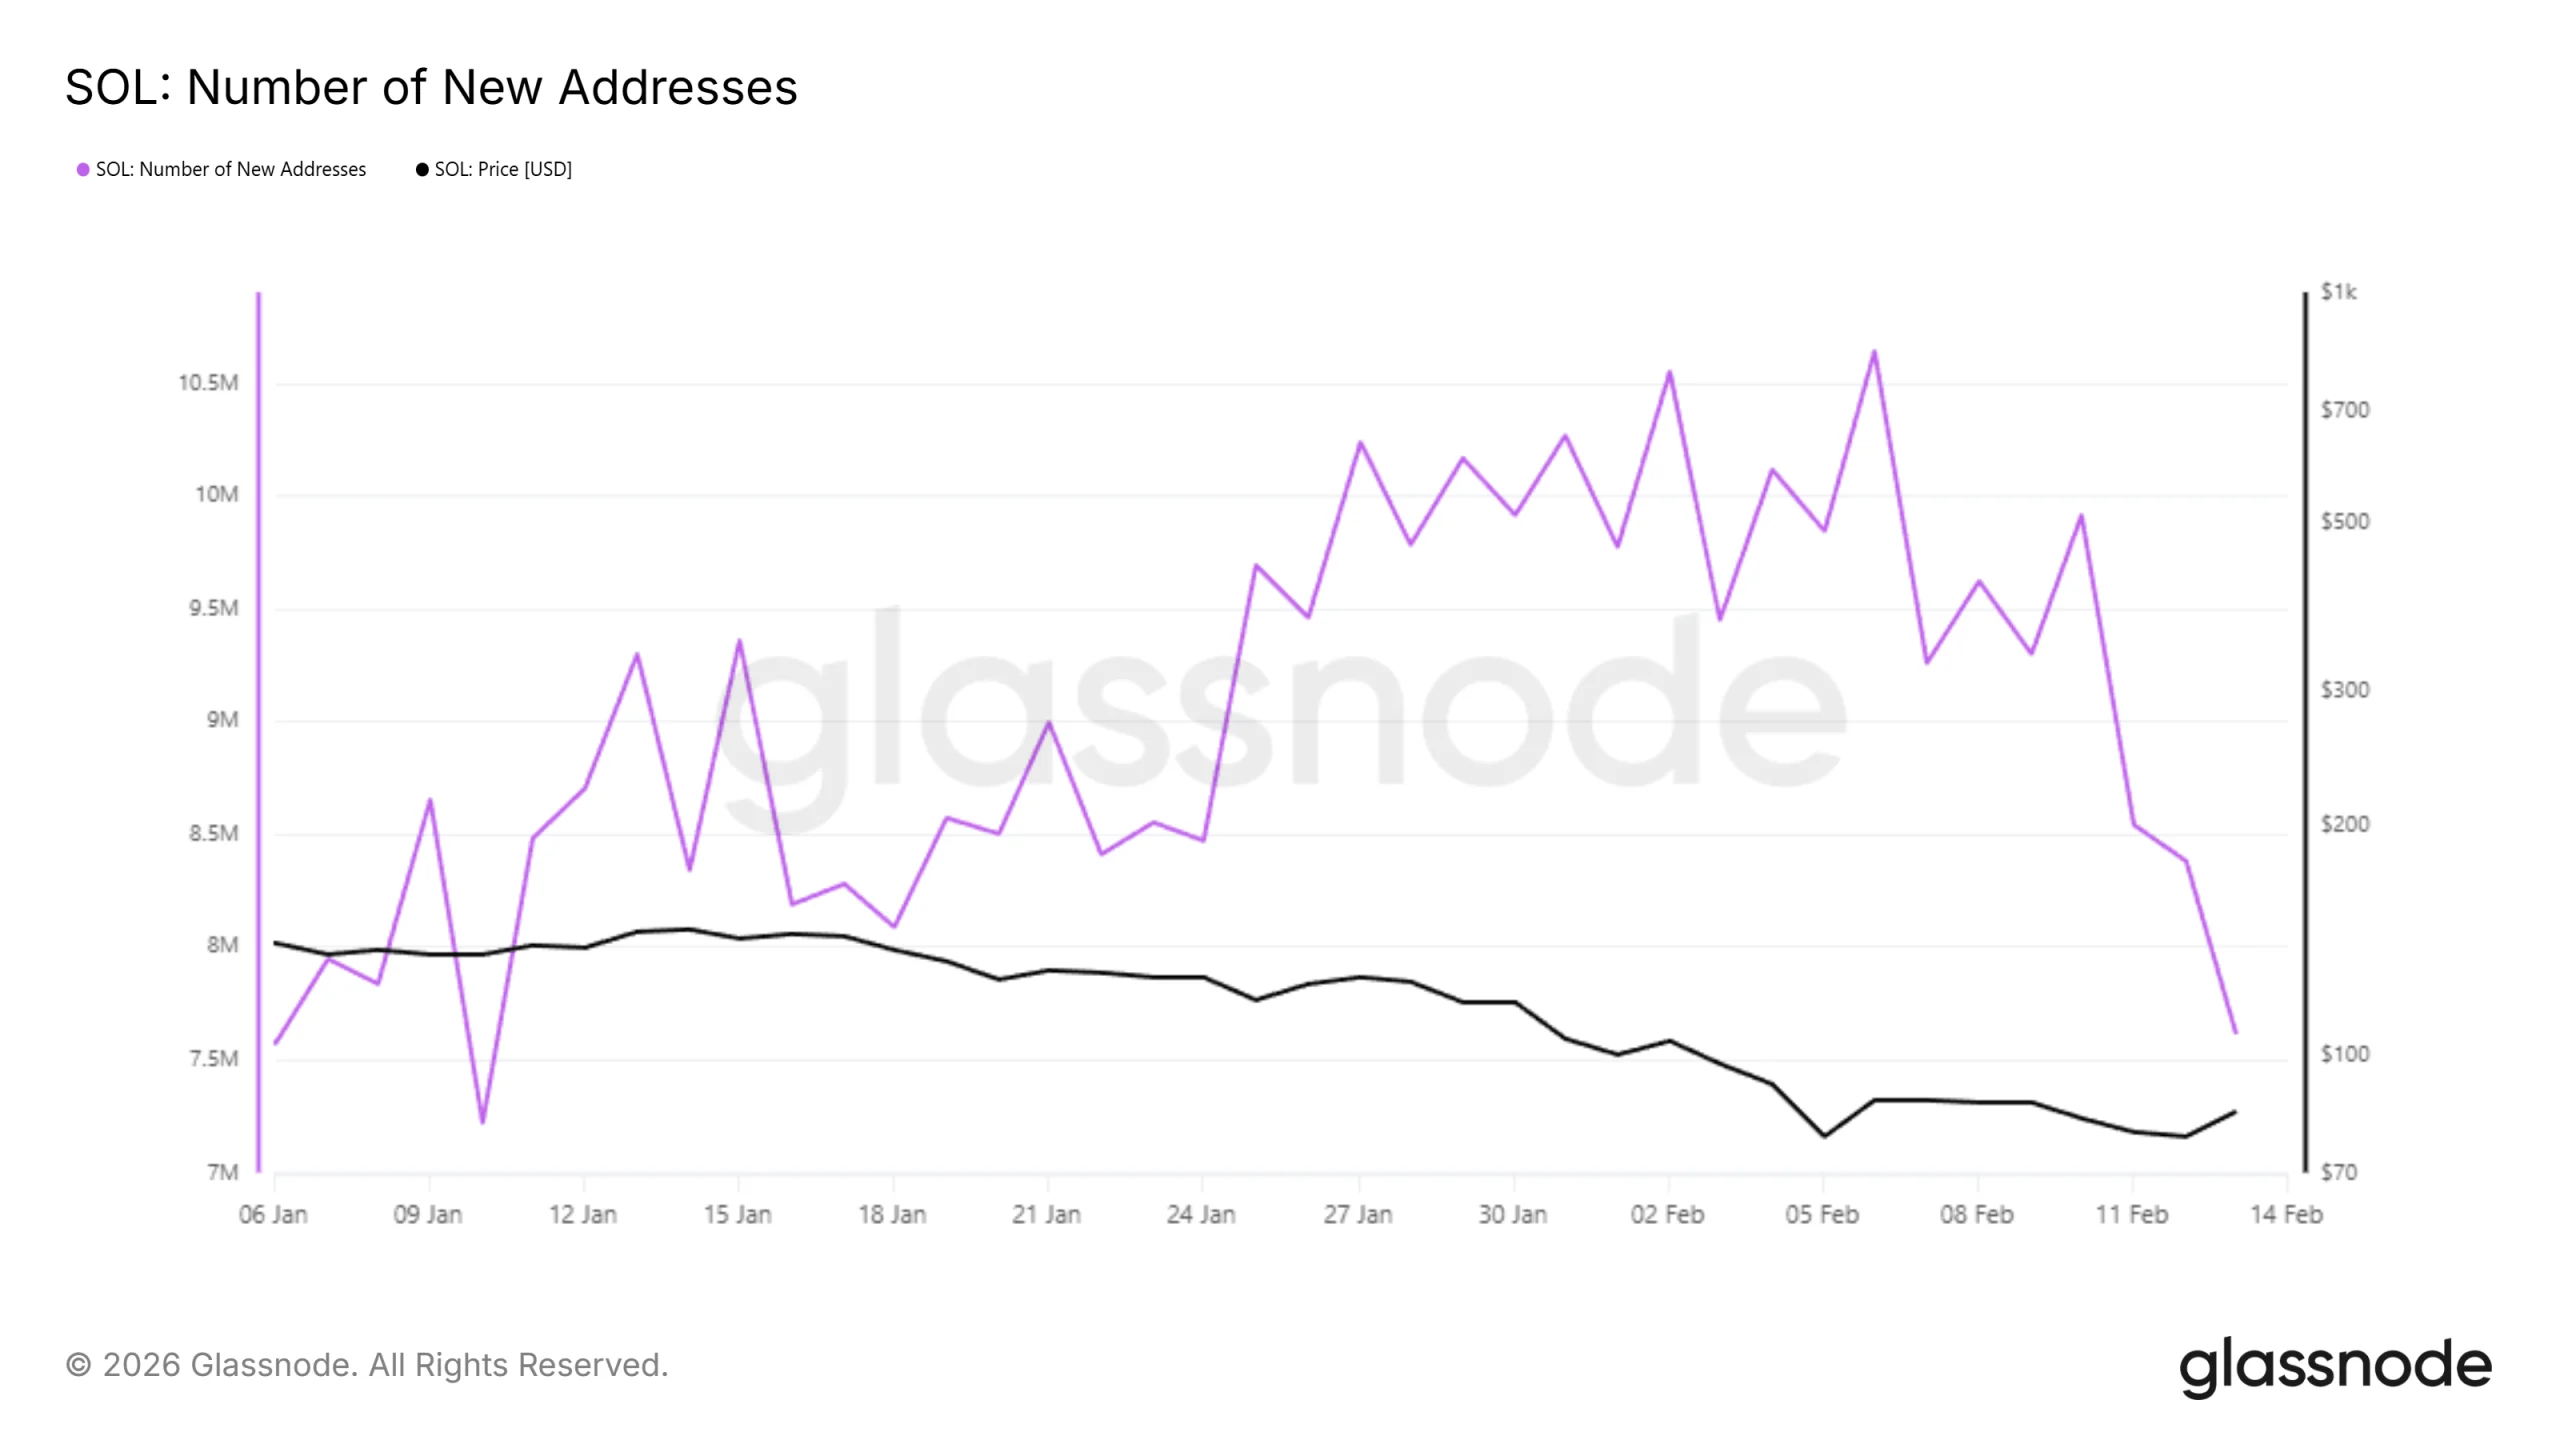
Solana Is Losing New Holders’ Confidence
New Solana investors were the first to reduce activity. Addresses completing their first transaction on the network are classified as new addresses. Earlier this year, Solana recorded nearly 10 million new addresses at peak engagement.
Over the past four days, that number has declined by 23% to 7.62 million. The contraction signals a slowing of onboarding momentum. Reduced network expansion often reflects hesitation among prospective buyers waiting for clearer recovery signals.
Want more token insights like this? Sign up for Editor Harsh Notariya’s Daily Crypto Newsletter here.
This pullback indicates that holders expect stronger upside confirmation before returning aggressively. Many appear unwilling to chase short-term rallies. Until consistent price appreciation emerges, onboarding growth may remain subdued.
Solana Holders Are Also Pulling Back
Exchange net position change data highlights a shift from buying to selling pressure. Green bars represent inflows to exchanges, which typically signal intent to sell during bearish phases. Recent readings show increasing transfers of SOL to trading platforms.
Sponsored
Sponsored
Approximately 1.4 million SOL entered exchanges over the last 48 hours, worth around $117 million. Such inflows increase available supply on exchanges. Elevated balances can limit upside momentum if buyers fail to absorb distribution.
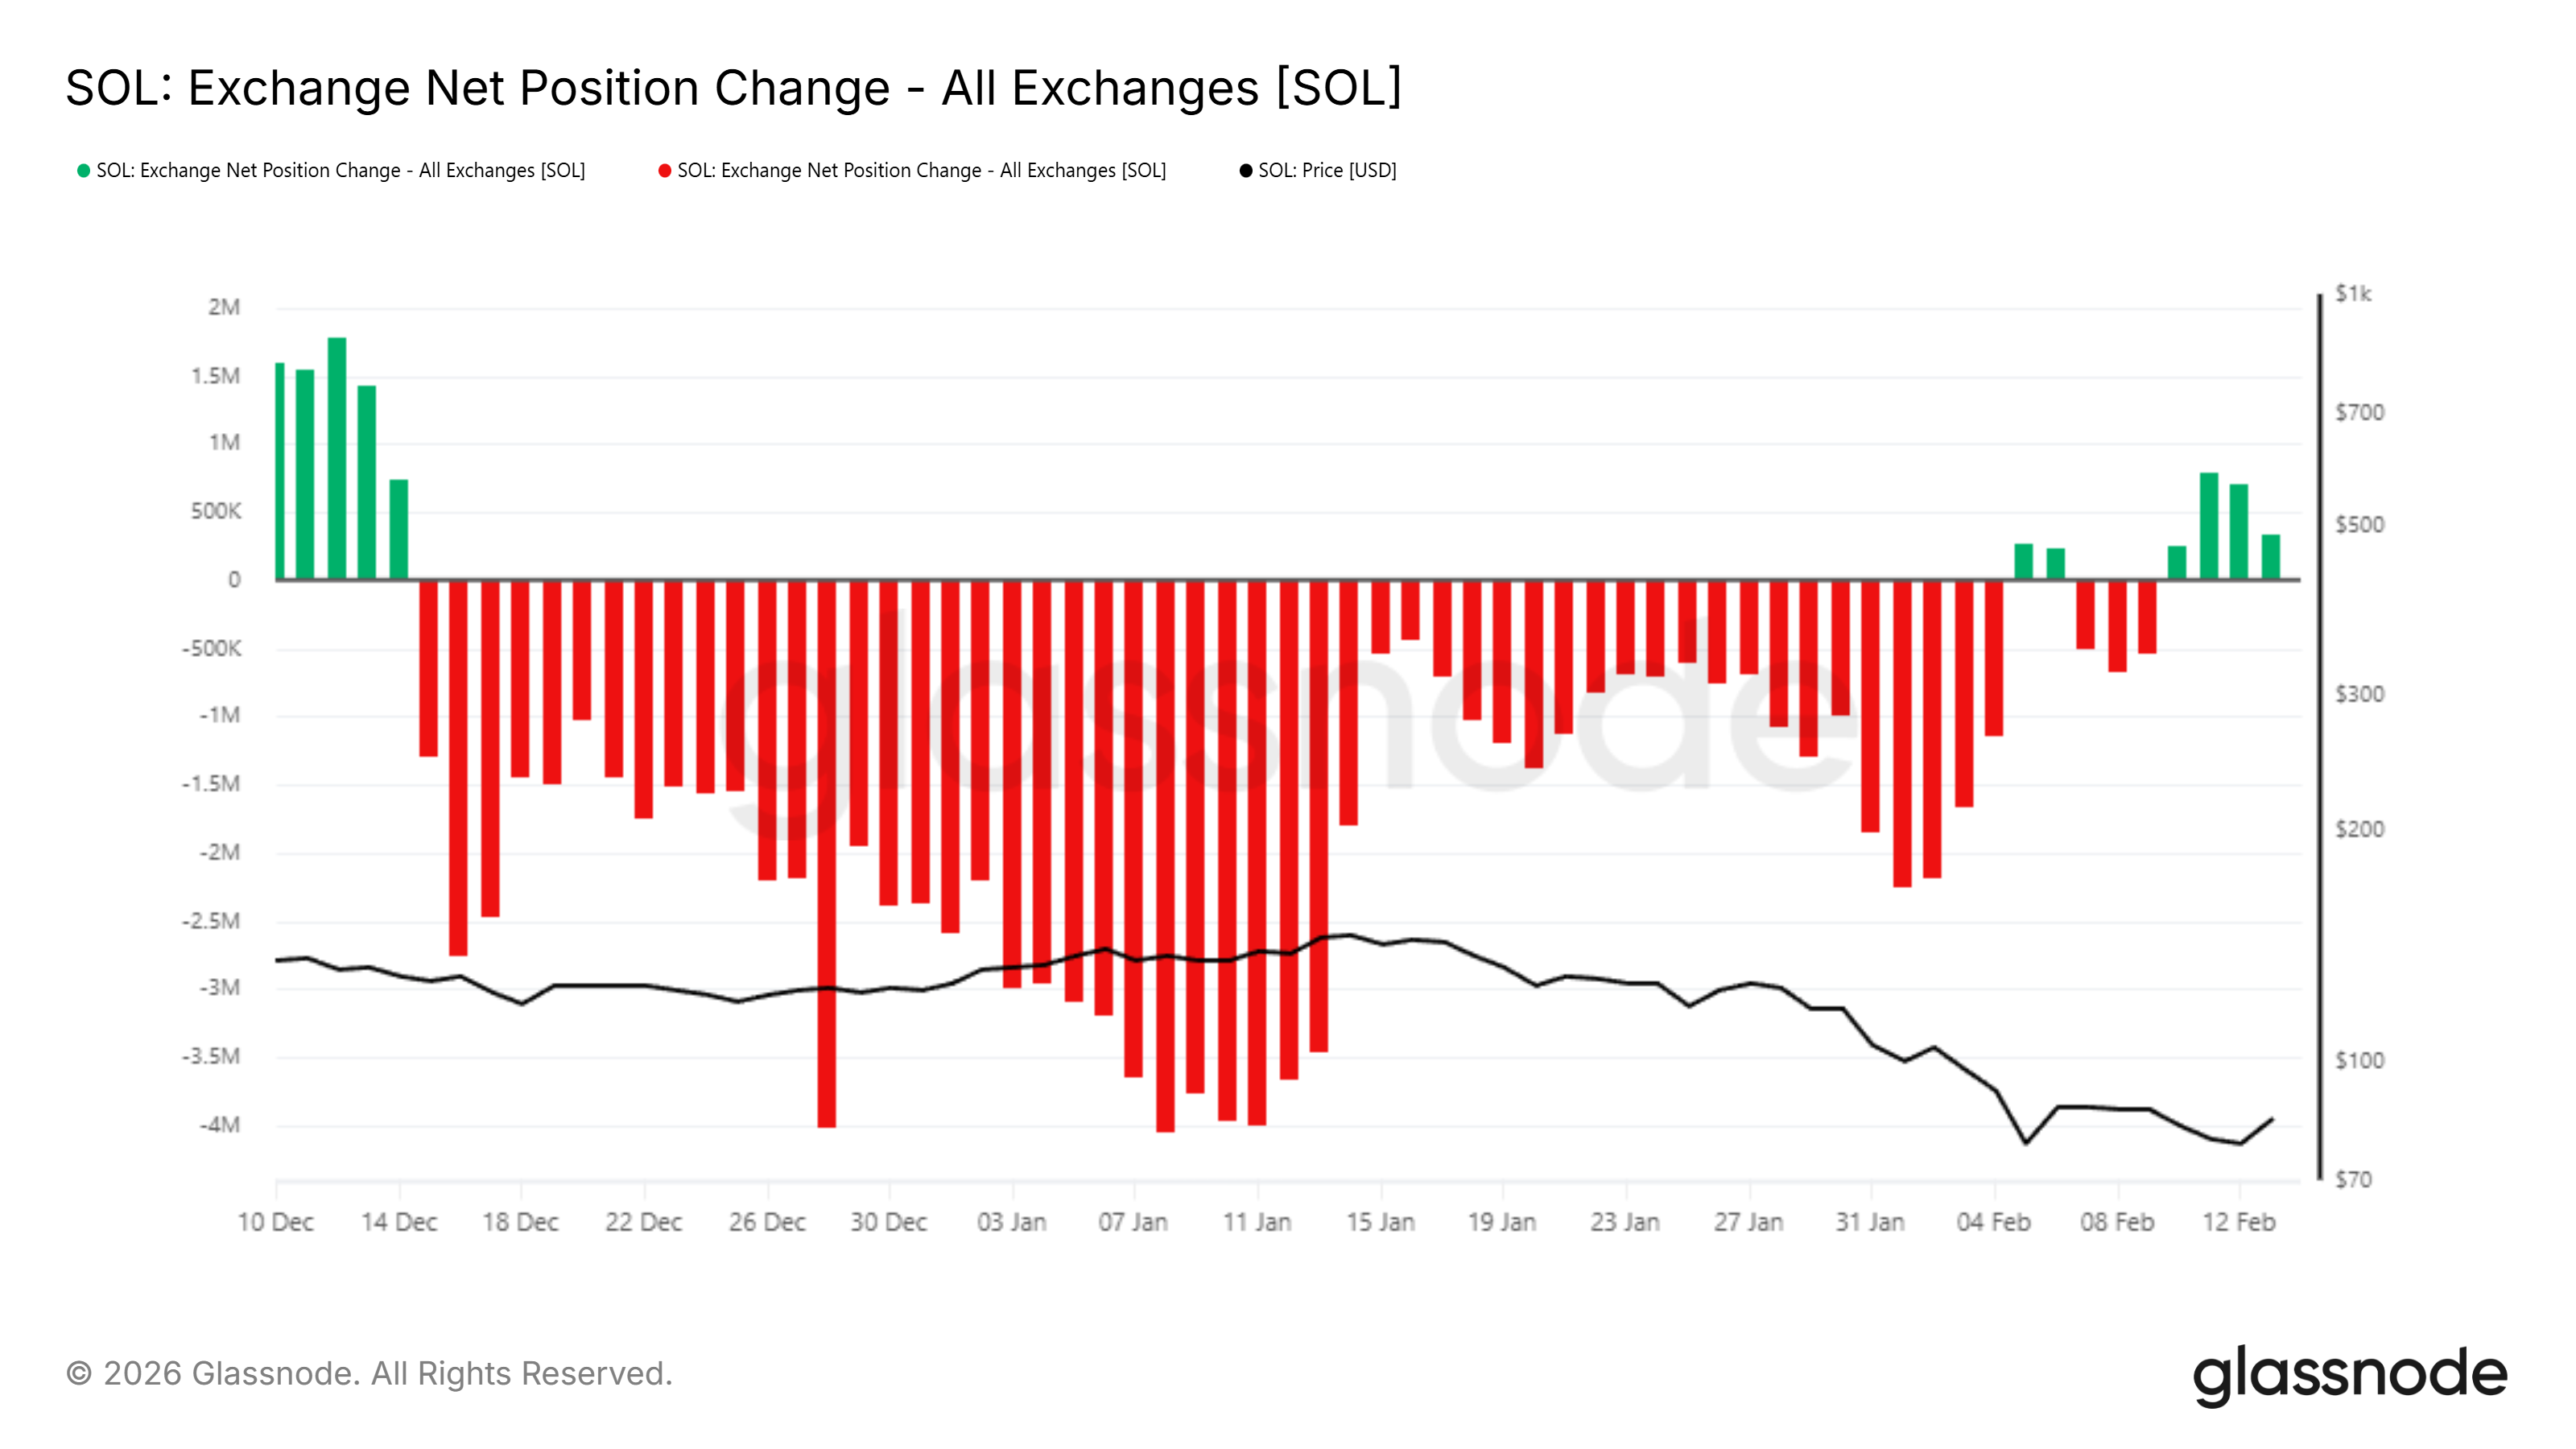
If SOL price continues rising, short-term holders may intensify profit-taking. That behavior often caps rallies in range-bound markets. Sustained inflows would reinforce consolidation rather than support a sustained breakout.
SOL Price Breakout Unlikely
Solana price remains range-bound between $89 resistance and $78 support. The current level at $86 places SOL near the midpoint of this channel. While the 10% daily gain improves sentiment, broader recovery remains uncertain.
Given slowing new address growth and rising exchange inflows, downside risk persists. A failure to hold $78 could send SOL toward $67. Such a move would confirm the continuation of the prevailing bearish structure.
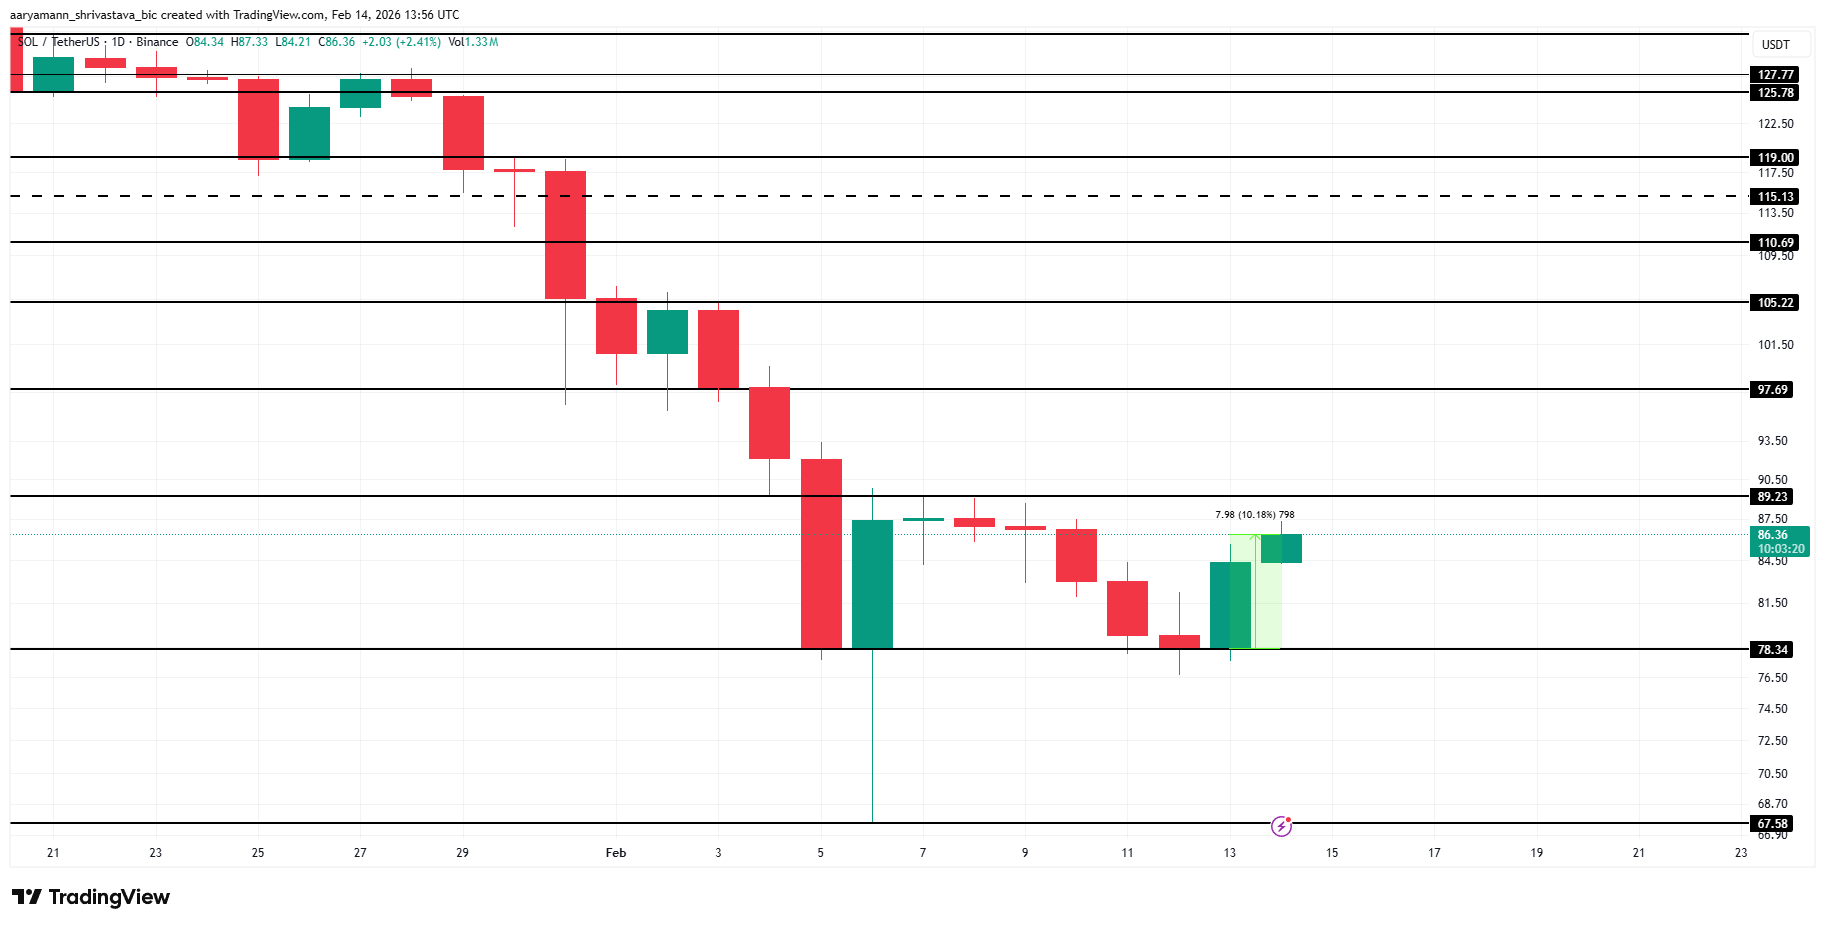
If investors halt selling and inflows diminish, SOL could challenge $89 resistance. A breakout above that level may push the price toward $97. Sustained strength beyond $97 could target $105, invalidating the bearish thesis and signaling structural recovery.

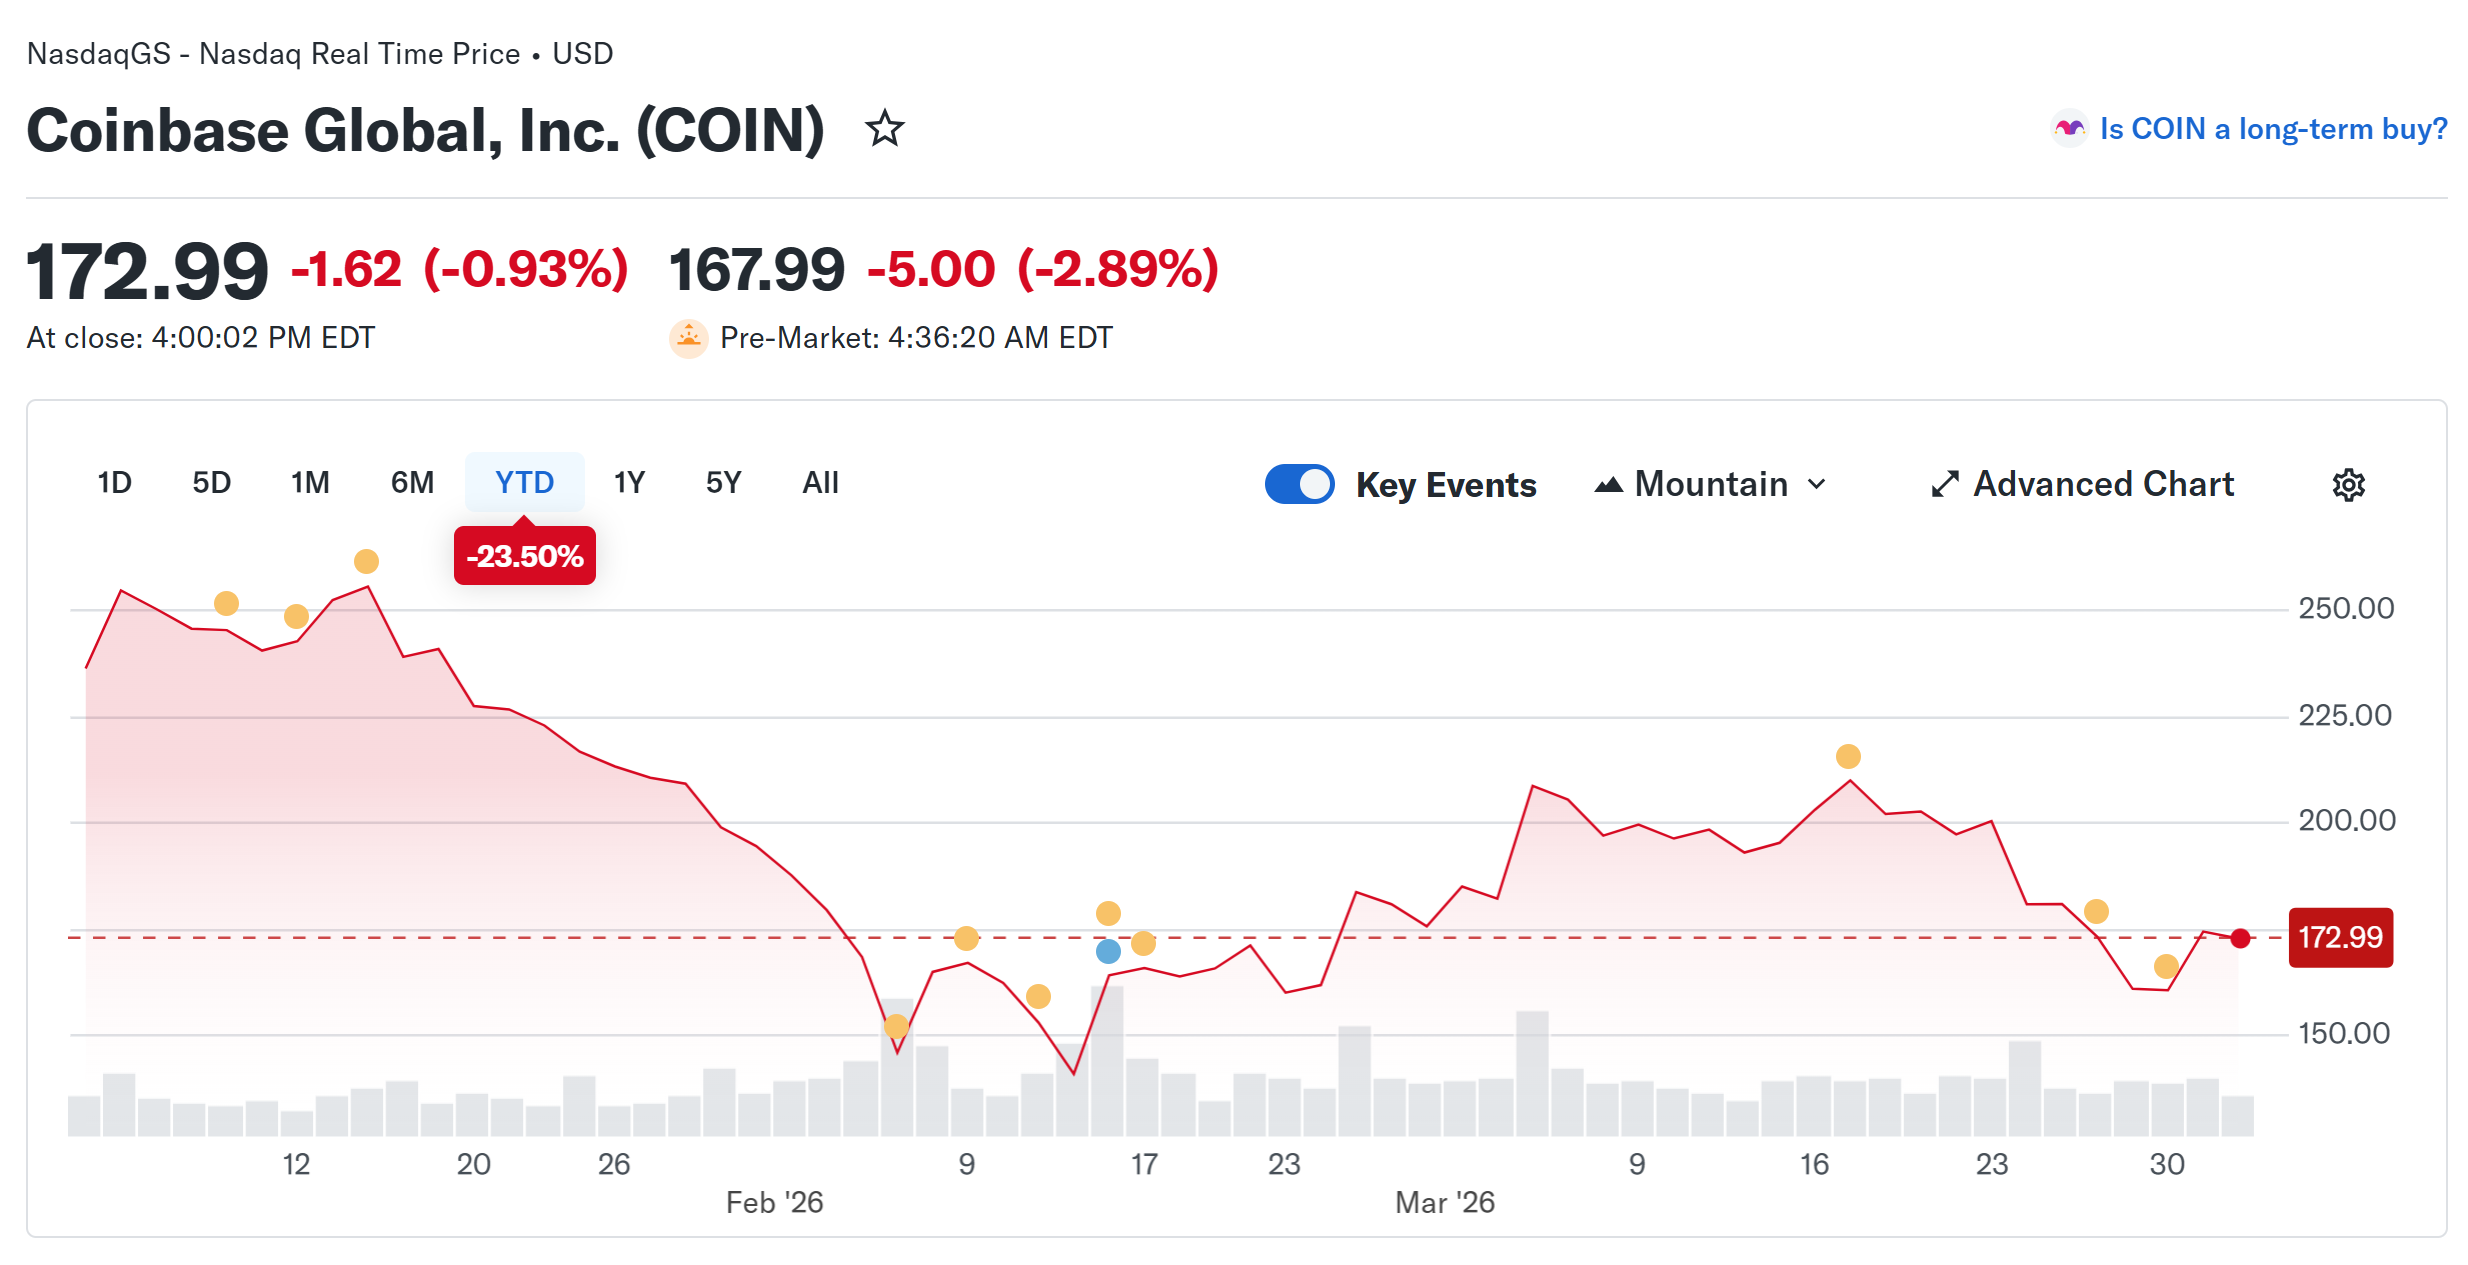
Coinbase chief legal officer Paul Grewal said the US Digital Asset Market Clarity Act is “moving toward” a markup hearing in the US Senate Banking Committee and could eventually move to a floor vote if senators resolve the stablecoin yield dispute and schedule a markup.
Speaking in a Wednesday interview on Fox Business, Grewal said lawmakers are nearing agreement on core elements of the crypto market structure bill, even as debate continues over stablecoin yield. “I think we’re very close to a deal,” he said.
The remarks point to possible movement on one of the last major sticking points in Senate talks over crypto market structure legislation: whether stablecoin issuers or platforms should be allowed to offer yield or similar rewards. The dispute has helped delay a Senate Banking Committee markup, leaving the broader effort to set federal rules for digital asset oversight still unresolved.
US banks have pushed for restrictions, arguing that such incentives could draw deposits away from traditional institutions and disrupt the banking system. Grewal pushed back on that claim, saying there is no evidence to support fears of deposit flight.
The US House of Representatives passed the CLARITY Act on July 17, 2025. In January, Senate Banking Committee Chair Tim Scott delayed a planned markup, which has yet to be rescheduled.
Related: Crypto investor sentiment will rise once CLARITY Act is passed: Bessent
Trump blames banks for stalling crypto bill
Last month, US President Donald Trump accused banks of undermining efforts to pass crypto market structure legislation, saying they are blocking progress over disagreements on stablecoin yield payments. “The Banks should not be trying to undercut The Genius Act, or hold The Clarity Act hostage,” he wrote.
It was later reported that Trump met privately with Coinbase CEO Brian Armstrong just hours before issuing the statement.

In January, Armstrong said Coinbase could not back the market structure bill “as written,” pointing to draft amendments that would eliminate stablecoin rewards and let banks restrict competition.
Related: CLARITY Act 2026 odds ‘extremely low’ if not passed before April: Exec
CLARITY delay could expose crypto to crackdowns
Last week, Coin Center executive director Peter Van Valkenburgh warned that failure to pass the CLARITY Act could leave the crypto industry vulnerable to a future US administration taking a tougher stance. He argued that rejecting developer protections in favor of short-term business interests risks creating a system shaped by political shifts rather than clear law.
“The point of passing CLARITY is not to trust this administration. It is to bind the next one,” he said.
Magazine: Bitcoin may take 7 years to upgrade to post-quantum — BIP-360 co-author


OpenEden has introduced HYBOND, the first tokenized product tied to BNY Investments’ Global Short-Dated High-Yield Bond strategy, expanding the scope of institutional-grade investments available onchain.
The new token gives qualified investors 1:1 exposure to a managed portfolio of short-dated corporate bonds overseen by BNY Investments, a unit of BNY.
The product introduces higher-yield fixed income exposure to a market segment that has so far been dominated by tokenized cash-equivalent and treasury strategies. Data from rwa.xyz shows over $12 billion of the more than $27 billion in the tokenized real-world asset market are U.S. Treasury debt.
HYBOND is issued by OpenEden Digital Limited, a Bermuda-regulated entity licensed under the Digital Asset Business Act, according to a press release on Wednesday.
While BNY Investments serves as the investment manager for the underlying bond portfolio, it has no direct involvement in the token itself, which is managed and issued by OpenEden.
“Tokenization has proven its product market fit with cash-equivalent and treasury strategies. HYBOND represents the next step by bringing actively managed corporate bond exposure on-chain within a regulated framework,” said Jeremy Ng, OpenEden’s CEO.
BNY and OpenEden previously collaborated on TBILL, a tokenized U.S. Treasury bill product. HYBOND builds on that relationship by pushing into riskier credit instruments, which may appeal to investors seeking greater yield.
As of year-end 2025, BNY oversaw $2.2 trillion in assets under management and more than $59 trillion in assets under custody.
Crypto World
Bitcoin treasury sell-off accelerates as Riot, Bhutan, and public companies exit positions


Those who rushed into bitcoin over the past two years are now heading for the exits and it’s not a great sign for the market.
Public companies, once seen as long-term holders, are increasingly selling bitcoin as prolonged price weakness weighs on balance sheets and strategic plans.
Take Empery Digital (EMPD), which announced on Wednesday that it sold 370 BTC at an average price of $66,632, generating $24.7 million, leaving the company with 2,989 BTC. The firm used part of the proceeds to repay its outstanding term loan fully and also released approximately 1,800 BTC that had previously been held as collateral.
Empery Digital began building its bitcoin treasury in July 2025 and accumulated a peak position of roughly 4,000 BTC. The firm’s shares are down 75% from its 2025 all time high of $15.80.
Genius Group (GNS), an AI-powered, bitcoin-focused education company that held up to 440 BTC in March last year, has completely sold off its stash. Recently, it liquidated its last remaining 84 BTC to repay $8.5 million in debt. The company stated it will resume building its bitcoin treasury when it believes market conditions are more favorable.
This trend is not restricted to just mid-sized players. Riot Platforms (RIOT), one of the largest publicly traded bitcoin mining companies in the U.S., has also reportedly been selling, according to blockchain data tracked by Lookonchain.
The company supposedly moved 500 BTC for roughly $34.13 million on Wednesday as it continues to tap its bitcoin treasury to fund its pivot into AI and high-performance computing, a strategy increasingly seen across the mining industry.
Riot sold approximately $200 million worth of bitcoin in the final two months of 2025. Riot Platforms has accumulated bitcoin continuously through its mining operations, rather than adopting a single start date for a treasury strategy, and reached peak holdings of over 19,000 BTC. The company now holds roughly 17,500 BTC.
Meanwhile, the Bhutan government continues to reduce its bitcoin holdings, having sold a total of 3,103 BTC. A single transaction on March 30 alone is said to have liquidated 375 BTC, further trimming its position, according to Glassnode data. Bhutan’s government built its bitcoin holdings over several years through state-backed mining operations, reaching a peak of over 13,000 BTC in October 2024.
While the recent trend of liquidations is certainly disappointing for bulls, all is not lost yet.
Public bitcoin treasury companies still hold around 1,164,800 BTC, according to BitcoinTreasuries.net. That’s over 5% of the total BTC supply of 21 million.
As of writing, bitcoin changed hands at $66,500, down over 2% since midnight UTC, according to CoinDesk data.
Read More: MARA Holdings higher by 10% after selling $1.1 billion in bitcoin to fund debt buyback
Solana price fell nearly 9% following a major exploit on its Drift Protocol DeFi platform that drained nearly $300 million in digital assets.
Summary
- Solana price dropped about 9% after a $285 million exploit on Drift Protocol, one of the largest hacks in the network’s history.
- Broader market weakness tied to escalating U.S.–Iran tensions and rising oil prices added to selling pressure on SOL.
- Technical indicators signal continued downside risk, with key support at $75, while a move above $93 could invalidate the bearish setup.
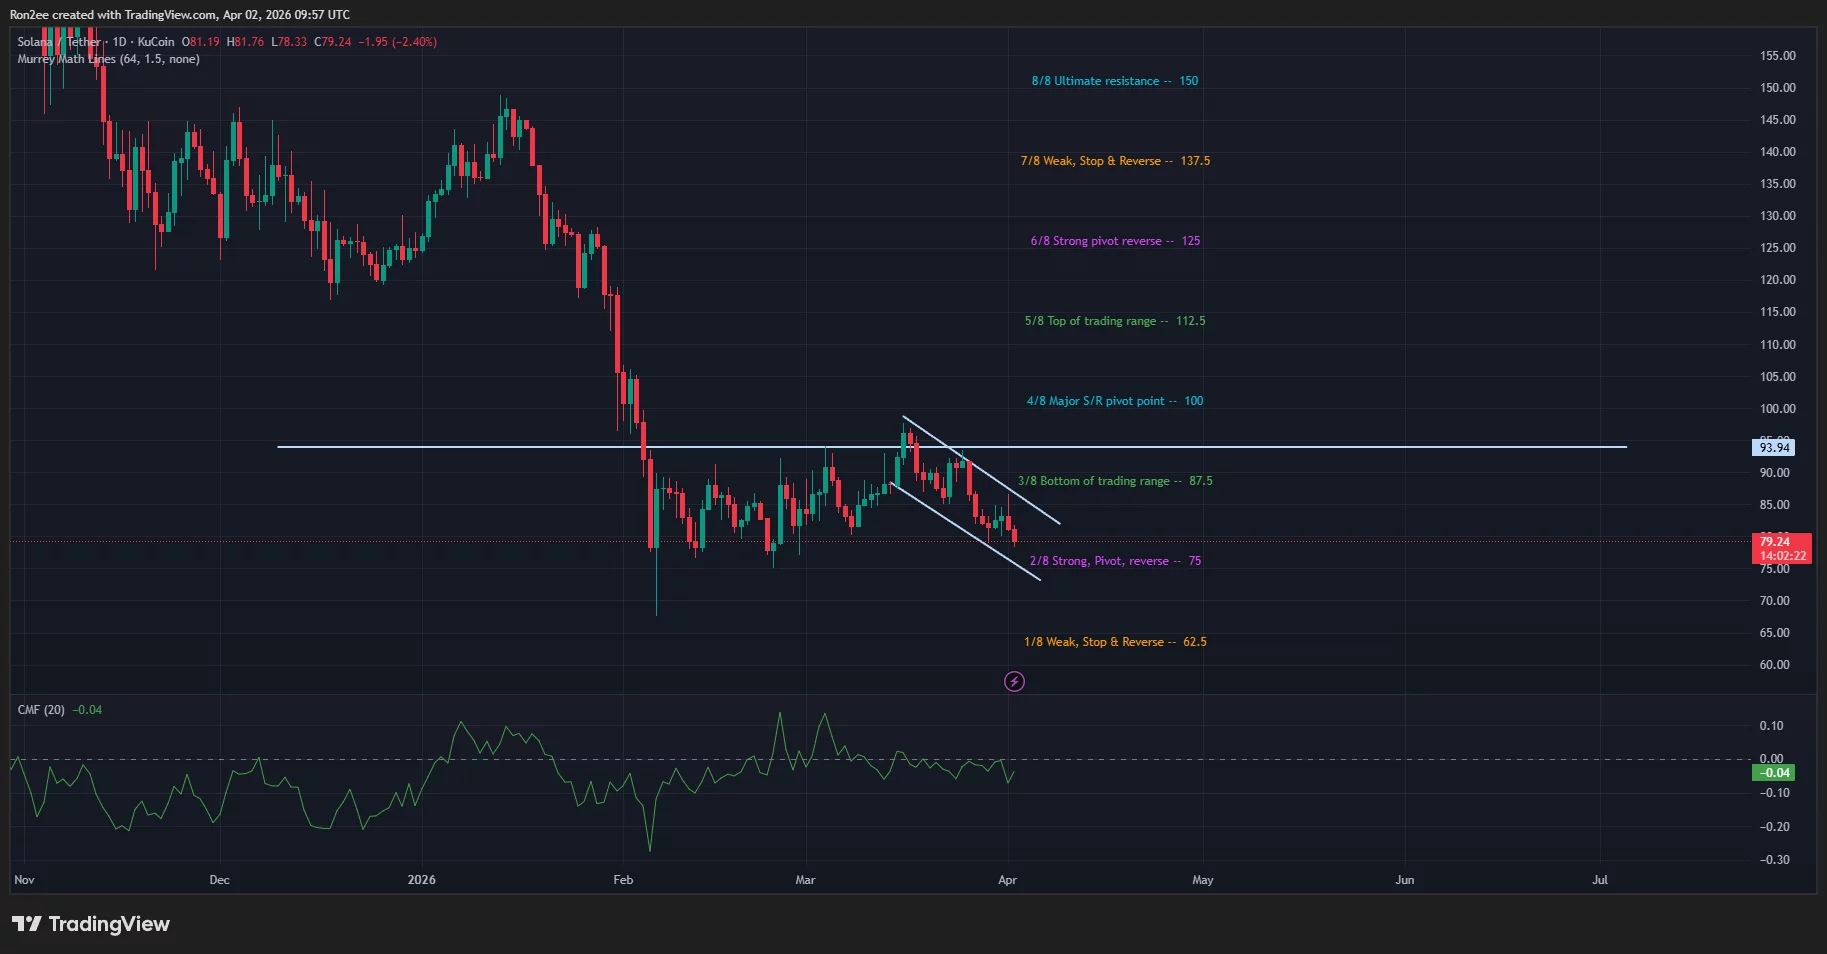
According to data from crypto.news, Solana (SOL) price fell 9% to an intraday low of $78.6 on April 2, bringing its market cap down to $45.5 billion. Over the past 7 days, SOL price has fallen by over 10%, marking the steepest loss among the top 10 cryptocurrencies in the market.
Solana price crashed following a major exploit on the Drift Protocol that left investors concerned about the security of decentralized finance applications on the network. Notably, the $285 million hack stands as one of the largest hacks in the Solana ecosystem over the past 5 years.
The token also fell along with a broader market drop as investors retreated to the sidelines on news of an escalation of the U.S. and Iran conflict in the Middle East, which has led oil prices to climb back above $100.
Solana price has also suffered due to lackluster demand from institutional investors. Data from SoSoValue show that spot Solana ETFs have recorded no inflows over the past nine days aside from the $4.64 million inflow seen last Thursday.
On the daily chart, Solana price has followed a descending channel pattern that it has respected since mid March. Cryptocurrencies tend to form lower lows and lower highs within this range as long as they remain under bearish pressure.

Technical indicators suggest more caution for traders over the short term. Notably, the 20-day SMA has formed a bearish crossover with the 50-day SMA.
Additionally, the Chaikin Money Flow index shows a negative reading of 0.04, a sign that investors are drawing away capital or funds from the Solana market, likely due to the recent security breach.
For now, $75, a support level that aligns with a strong pivot reverse of the Murrey Math lines, serves as the next key floor that traders should keep an eye on. A sharp drop below this level can accelerate the downward momentum.
On the contrary, a rebound above $93, a level where previous resistance sits, could signal the start of a new uptrend for the asset.
Disclosure: This article does not represent investment advice. The content and materials featured on this page are for educational purposes only.

Bitfarms’ (BITF) shares rose about 6.6% on Tuesday even as the miner reported a widened net loss for 2025, underscoring the market’s focus on its strategic pivot from Bitcoin mining to high-performance computing and artificial intelligence infrastructure.
The company’s full-year results show revenue climbing 72% year over year to $229 million, but cost of revenue running at $248 million produced a gross loss. General and administrative expenses also increased, contributing to a challenging bottom line. The change in fair value of digital assets swung to a $50.5 million loss in 2025 from a $26 million gain in 2024, though a $28.2 million realized gain on the sale of digital assets helped soften the impact.
The earnings backdrop highlights the pressure facing Bitcoin miners as the cycle shifts. Bitcoin mining profitability margins have narrowed as the price of Bitcoin has fallen about 46% from its October peak, and mining difficulty has risen roughly 58.5% since the last halving in May 2024, according to market trackers.
During the earnings call, Bitfarms CEO Ben Gagnon outlined the company’s bold strategic pivot. The firm “made the decision to walk away” from its Bitcoin mining operations in November and has since built a new business focused on HPC and AI data centers. He said, “No half-measures, no compromises, and in time, no Bitcoin. We built a new company.” The plan includes rebranding to Keel Infrastructure and relocating the company’s legal base from Canada to the United States, with shareholder approval already secured.
As part of the pivot, Bitfarms indicates it still holds approximately $161 million in unencumbered Bitcoin, a asset base it intends to leverage as it scales its new infrastructure strategy. Gagnon stressed that the HPC/AI thesis requires “top-tier infrastructure” to support hyperscalers and neoclouds for the next wave of AI applications, and the company is pursuing a large-scale build-out across North America. The filing describes a 2.2 gigawatt digital infrastructure development pipeline designed to deliver this capability.
Bitfarms is part of a broader wave among Bitcoin miners expanding into AI and HPC to pursue higher-margin opportunities. Peers such as Iris Energy, Cipher Mining, Riot Platforms, and MARA Holdings have all signaled or pursued AI-enabled hosting and data-center strategies to diversify beyond pure BTC mining. The competitive backdrop underscores a larger industry transition as miners seek to align their capital-intensive operations with the growing demand for AI-ready compute capacity.
“We are not here to compete with hyperscalers or Neoclouds. We are here to enable them. Our focus is providing the critical and largely invisible foundation that will allow the world’s most advanced AI platforms to deploy on time and scale without interruption.”
Bitfarms is actively advancing the infrastructure push, with a 2.2 GW pipeline across North America intended to support the transition to HPC/AI workloads. The company’s leadership argues that the shift is essential to capture the growth in AI-enabled compute demand, even as the current Bitcoin cycle weighs on near-term profitability.
Market context remains important for readers assessing the viability of Bitfarms’ pivot. The mixed signals from the sector—persistent BTC price volatility, rising mining difficulty, and the capital intensity of large-scale HPC deployments—mean investors will be watching not only the execution of the Keel Infrastructure plan but also how the business manages cash flow during the transition. The company’s 2025 results and the pace at which it converts its unencumbered Bitcoin into strategic capital will shape how the market price of BITF responds in the coming quarters.
BITF shares closed Tuesday trading hours up 6.64% to C$2.73, with investors parsing the company’s long-run opportunity as a strategic reorientation rather than a conventional mining update. For context, the full-year results and the pivot plan were outlined in the company’s results statement available here: full-year results statement. Market data on the stock can be followed at Google Finance.
Bitcoin price data referenced in market coverage shows a substantial decline from October’s highs, while mining difficulty metrics corroborate the tougher operating environment for traditional miners. These dynamics help explain why Bitfarms’ management is pursuing a long-horizon transformation into a scalable AI-ready infrastructure provider, rather than relying solely on cyclical BTC mining margins.
As the transition unfolds, investors should monitor how Keel Infrastructure positions itself with hyperscalers, the pace of North American site development, and any changes to the company’s capital structure or debt strategy. The next earnings cycle and potential partnerships will be telling indicators of whether the new infrastructure-focused strategy can translate into sustainable profitability amid a still-choppy crypto market.
Looking ahead, the key questions are how quickly Bitfarms can scale its HPC/AI deployments, how the company manages the cost of capital during the transition, and whether the pivotal rebrand and US relocation can unlock the longer-term value of its unencumbered Bitcoin and new compute assets.
Metaplanet (3350) acquired 5,075 BTC for approximately $398 million during the first quarter of 2026, pushing its total holdings to 40,177 BTC and vaulting past MARA Holdings in the global bitcoin treasury rankings.
The Tokyo-listed firm now sits behind only Strategy (MSTR) and Twenty One Capital (XXI) among publicly traded companies by bitcoin held on their balance sheets.
MARA’s Sell-Off Opens the Door
Metaplanet’s rise to third place owes as much to its own accumulation as to MARA Holdings’ (MARA) significant retreat.
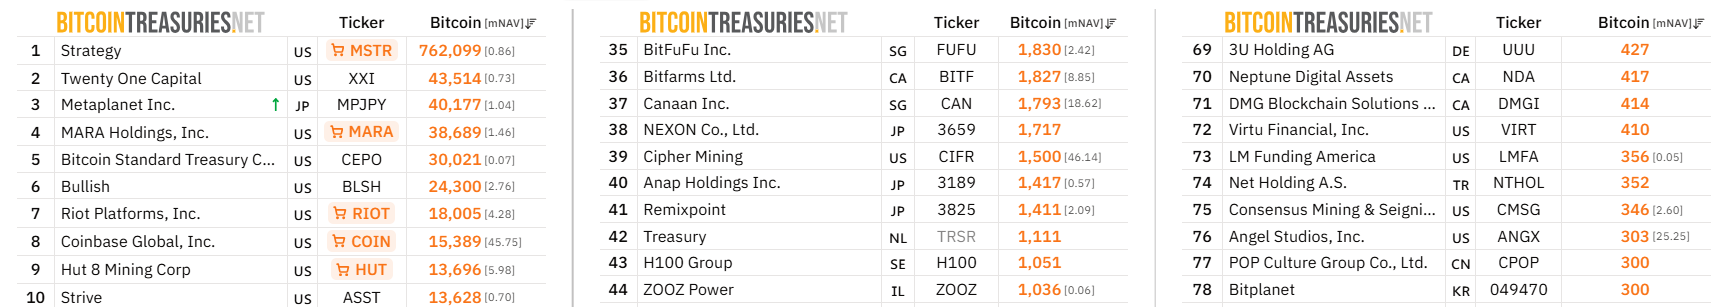
The US-based miner sold 15,133 BTC between March 4 and March 25 for roughly $1.1 billion, using the proceeds to repurchase $1 billion in convertible senior notes due 2030 and 2031.
That sale cut MARA’s holdings to 38,689 BTC, down from 53,822 BTC at the start of the year. The company framed the move as balance sheet management, noting it reduced outstanding convertible debt by approximately 30%.
MARA had already posted a $1.7 billion net loss in the fourth quarter of 2025 after taking a $1.5 billion write-down on its digital asset holdings.
Its pivot toward AI infrastructure and data centers added further reason to lighten the bitcoin stack.
Metaplanet’s Accumulation Strategy
Metaplanet paid an average of roughly $78,000 per coin for its Q1 purchases. Its total cost basis across all 40,177 BTC sits at approximately $97,000, implying a total outlay of about $3.9 billion.
The firm has reported a BTC yield of 2.8% year-to-date. Metaplanet’s broader ambitions are far larger.
Under its “555 Million Plan,” it targets 100,000 BTC by the end of 2026 and 210,000 BTC by the end of 2027.
To fund continued purchases, the company has raised capital through international stock offerings and warrant exercises.
It recently secured approximately $255 million from global institutional investors with the potential for an additional $276 million.
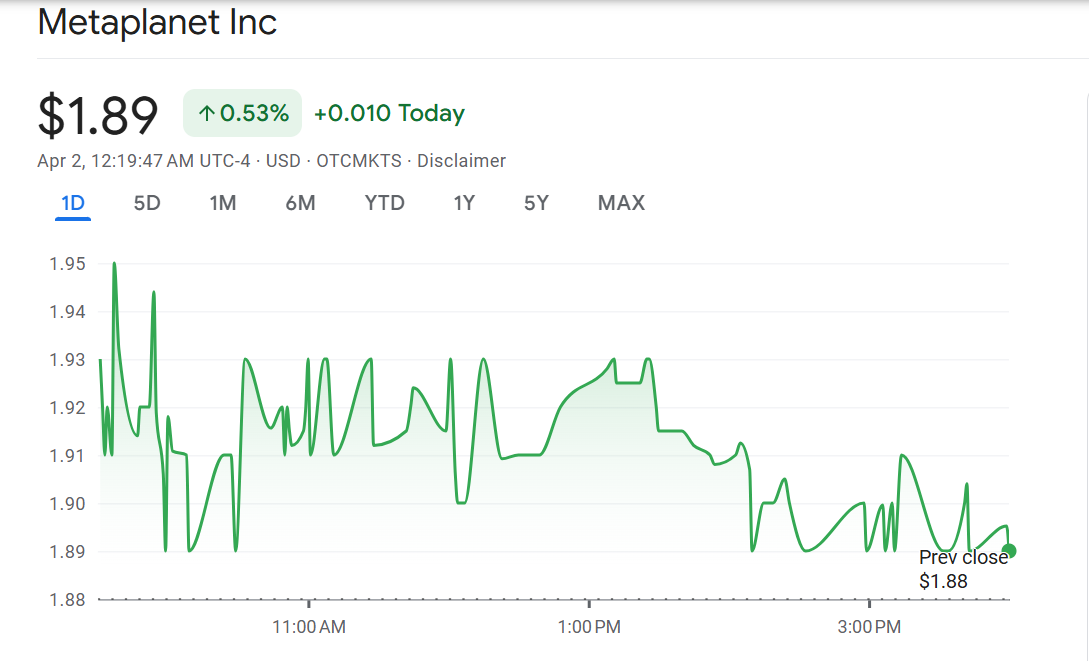
However, shares have not kept pace with the bitcoin buying spree. Metaplanet stock traded at 302 yen ($1.89) on April 2, down roughly 2% on the day and well below its June 2025 peak of 1,930 yen.
A Widening Gap at the Top
The gap between the top two holders and the rest of the field remains vast. Strategy holds 762,099 BTC, more than 18 times Metaplanet’s stack. Twenty One Capital sits at 43,514 BTC.
Below Metaplanet, the competition includes firms like Bitcoin Standard Treasury Corp (CEPO) at 30,021 BTC and Bullish (BLSH) at 24,300 BTC, according to BitcoinTreasuries data.
Whether Metaplanet can hold its new ranking depends on continued access to capital and MARA’s willingness to sell further.
With Bitcoin trading for $66,372 as of this writing, and Metaplanet’s average cost basis roughly 46% above that level, the firm’s treasury remains significantly underwater even as its position on the leaderboard improves.
The post MARA’s $1.1 Billion Bitcoin Sell-Off Hands Metaplanet the Number 3 Spot appeared first on BeInCrypto.

Key Highlights
- ACHR advanced approximately 5% during Tuesday’s session to reach $5.185, up from the previous day’s close of $4.94, with trading volume hitting ~33.5 million shares.
- The company fell short of Q4 projections for both earnings per share (($0.26) actual vs. ($0.17) forecast) and quarterly revenue ($0.30M actual vs. $1.4M forecast).
- Institutional investors now control more than 50% of shares, including Vanguard Index Funds’ 5.86% position and ARK’s holdings of roughly 35 million shares.
- Wall Street consensus remains at “Moderate Buy” with a mean price objective of $12.00; TipRanks shows an average projection of $13.20.
- Archer concluded 2025 holding approximately $2 billion in liquid assets and received FAA approval for its eVTOL compliance methodology, maintaining its late 2026 passenger service launch schedule.
Archer Aviation ($ACHR) shares have declined approximately 30% since the beginning of 2026, but Tuesday brought a modest recovery as the stock advanced roughly 5% intraday to $5.185, briefly hitting $5.23 during the session. Monday’s closing price stood at $4.94.
Trading activity reached approximately 33.5 million shares, representing about 7% less than the typical daily volume of roughly 35.9 million. The security’s 50-day simple moving average stands at $6.83, while the 200-day average rests at $8.41, indicating that both short-term and long-term technical indicators remain significantly above present trading levels.
The company’s latest quarterly financial results, published on March 2, presented challenges for shareholders. Archer reported a per-share loss of ($0.26), falling short of the analyst consensus forecast of ($0.17) by nine cents. Quarterly revenue totaled just $0.30 million, substantially below the anticipated $1.40 million. However, revenue demonstrated a remarkable 29,900% year-over-year increase from an essentially negligible base.
Despite the earnings shortfall, the company maintains a robust financial position. Archer finished 2025 holding approximately $2 billion in cash reserves, carrying a minimal debt-to-equity ratio of just 0.05, and showing a current ratio of 19.89. This financial runway provides management with flexibility to pursue commercial objectives without immediate capital constraints.
Regarding regulatory progress, the FAA has approved Archer’s eVTOL compliance methodology, preserving the company’s schedule for initial commercial passenger operations. Management continues to target a service debut by late 2026. This upcoming milestone represents a cornerstone of the investment thesis for bullish investors.
Wall Street Perspectives Vary, With Bullish Bias
Analyst opinion remains divided but leans optimistic. Five analysts assign a Buy rating, two recommend Hold, and one maintains a Sell rating. The mean price objective among analysts reaches $12.00, indicating significant appreciation potential from present levels. TipRanks, incorporating more current analyst updates, displays a Strong Buy consensus with a $13.20 mean target — suggesting possible upside of approximately 148% from the $5.185 level.
Needham reduced its price objective from $10.00 to $9.00 in early March while maintaining a Buy recommendation. Goldman Sachs launched coverage with a Neutral stance and an $11.00 target in December. Weiss Ratings continues to hold a Sell rating.
Insider transactions have skewed toward stock sales recently. During the past 90 days, company insiders disposed of approximately 380,750 shares worth roughly $2.6 million. CTO Thomas Muniz sold 9,580 shares on March 13 at $6.27 per share, while insider Tosha Perkins sold 10,949 shares at the identical price on the same date.
Large Investors Accumulate Shares
Notwithstanding the stock’s recent decline, major investors have expanded their holdings. Institutional and hedge fund ownership currently represents approximately 59% of outstanding shares. ARK Investment Management controls approximately 35.2 million shares following an addition of roughly 3.9 million shares during Q4. BNP Paribas expanded its stake by 423% in Q4, elevating its total position to approximately 5.1 million shares.
Vanguard Index Funds maintains a 5.86% ownership stake, positioning them as the top institutional shareholder. CEO Adam Goldstein holds approximately 4.89% of outstanding shares.
Among exchange-traded funds, the SPDR S&P Aerospace & Defense ETF ($XAR) maintains a 2.94% position, with the ARK Innovation ETF ($ARKK) holding 2.58%.
The company’s market capitalization stands at $3.86 billion with a beta of 3.10, demonstrating the stock’s tendency toward heightened volatility compared to broader market movements.


Bitcoin faced renewed selling pressure as risk assets sagged in response to headlines around a potential escalation in the Iran situation following a key address by U.S. President Donald Trump. Trading data showed BTC dipping toward the $66,000 area, roughly 2% lower on the day, as equities and gold declined and the U.S. dollar steadied its footing. The move underscored how macro jitters continue to spill over into the crypto space, even as traders weigh the asset’s longer-term narrative beyond daily headlines.
The broader macro backdrop added to Bitcoin’s near-term challenges. The U.S. Dollar Index (DXY) rebounded toward the 100 level, reflecting renewed demand for cash amid geopolitical uncertainty and higher oil prices. In tandem, crude markets traded above the $100 per barrel mark, with WTI reaching around $104, buffeting risk appetite further. Analysts characterized the day’s move as a continuation of a risk-off regime that has pressured risk assets across equities, gold and cryptocurrencies in recent sessions.
Key takeaways
-
Bitcoin slid about 2% on the day, with intraday lows near $66,200 as markets reacted to Trump’s address and the Iran situation.
-
The U.S. dollar strengthened, with the DXY approaching 104 in what traders described as a renewed breakout risk for major risk assets.
-
Oil surged back above $104 per barrel, contributing to higher hedging costs and tighter financial conditions that tend to weigh on speculative assets including BTC.
-
Bitcoin’s chart pattern remained under watch as a bear-flag setup persisted, raising the prospect of further downside if support fails.
-
Analysts pressed for clarity on de-escalation prospects, with commentary highlighting the risk of a renewed risk-off cycle if the geopolitical backdrop worsens.
Markets in a wary mood as geopolitics loom
Market participants were left interpreting whether Trump’s national address would signal de-escalation or a continuation of tensions. Observers noted that the lack of a clear de-escalation message left traders updating risk models to account for an extended period of volatility. In a rapid-fire sequence of commentary on social media, analysts noted that the tone of the speech did not provide the reassurance markets had hoped for, leaving open the possibility of a further escalation path.
Beyond geopolitics, the macro mix of a firmer dollar and elevated oil prices reinforced a cautious stance for investors. The dollar’s climb tended to weigh on non-yielding assets such as gold and growth-oriented assets, including equities and BTC, which often trade inversely to the USD in times of stress. Oil’s move above the $100 threshold added to the sense that financial conditions could tighten, complicating the recovery narrative for risk assets.
Analysts highlighted how these dynamics feed into Bitcoin’s complex narrative. While BTC had shown resilience during earlier risk-off periods, the current pricing environment has kept a lid on fresh strength, with traders watching for signs that the macro environment might pivot back toward risk-on as geopolitical concerns ease. As one trader noted, scenario planning now hinges on whether a de-escalation or further escalation unfolds in the near term.
Bitcoin’s bear-flag in focus as technicals meet macro headwinds
On the technical side, Bitcoin’s price action continued to echo a bear-flag formation that began to form earlier in the year. Market participants have warned that the pattern carries the risk of a breakdown if the price cannot hold above key support levels. In a recent assessment, Keith Alan, cofounder of trading resource Material Indicators, observed that BTC/USD still lacks clear directional momentum and that the current structure bears a strong resemblance to the prior bear-flag setup. “Structurally, BTC price action is still nearly identical to the prior bear flag structure,” he wrote, noting that the pattern may persist unless price deviates from the established path.
Analysts also weighed in on how external catalysts might interact with BTC’s technical canvas. The persistence of a risk-off regime—driven by macro data, currency moves and energy prices—could push the bear-flag toward a breakdown, potentially setting new psychological and technical levels for traders to monitor. Conversely, a renewed risk appetite amid easing geopolitical tensions or favorable macro signals could provide relief rallies that test the upper boundaries of the flag pattern.
Specifically, Bitcoin’s momentum has been a topic of ongoing debate among traders. Some observers contend that the asset’s recent behavior is consistent with a broader macro-driven compression, where liquidity constraints and cross-asset correlations keep BTC tethered to a lower range until catalysts shift. Others emphasize the importance of a sustained close above critical trendlines to reassert upside potential. This tug-of-war between macro headwinds and technical resistance will shape Bitcoin’s near-term trajectory as markets await clearer directional cues.
“The market, which was finally beginning to show some signs of calming, is now highly agitated, with US oil prices back to $104 per barrel, stocks down sharply, and the bond market melting down again,” one trader observed, highlighting how the macro backdrop feeds into crypto’s volatility.
“The address did not present a clear de-escalation,” another analyst commented, underscoring why risk assets remain under pressure and BTC remains in a cautious posture.
What to watch next for traders
Looking ahead, market watchers will be focused on several key inflection points. The trajectory of the dollar will be central: a decisive breakout toward the high-100s, or a rollback, could significantly shift risk sentiment for crypto and equities alike. Oil’s price action will also matter, as sustained energy-market pressures can prolong macro tightening and complicate recovery bets for risk assets.
From a crypto-specific lens, BTC’s ability to hold the current support envelope and to navigate the bear-flag without accelerating toward new lows will determine whether the market can stage a relief rally or slip into deeper correction territory. Traders will be watching for a potential breakout in either direction, as well as any news flow on sanctions, geopolitical developments, or policy shifts that could recalibrate risk appetite in the near term.
In the near term, investors and traders should prepare for continued volatility. The confluence of a fragile macro backdrop, a stronger dollar, elevated oil prices, and a persistent bear-flag pattern means Bitcoin could remain range-bound for a while, with outsized moves possible on unexpected headlines or new macro data leaving a clearer path for traders to follow.
For readers seeking color on the latest macro and crypto context, ongoing commentary from market analysts and relevant data points remain critical. As this narrative evolves, the next moves in BTC, the dollar, and risk assets will likely be tightly interwoven with geopolitical headlines and central-bank communications.
As the scene unfolds, the question remains: will a de-escalation signal eventually arrive to rekindle risk appetite, or will geopolitical tensions keep crypto markets tethered to a cautious, downside-biased regime? The coming days should reveal which trajectory dominates and where Bitcoin stands within that broader spectrum.


Crypto exchange Bithumb is reportedly delaying plans for its IPO until after 2028, according to local media.
Summary
- Bithumb has pushed its IPO timeline to after 2028 as it works to strengthen accounting standards and internal controls following regulatory setbacks.
- The exchange remains under scrutiny after a $40 billion internal balance error and a 36.8 billion won fine tied to anti-money laundering violations.
Per a report from Maeil Business News Korea citing a Bithumb official, the South Korean crypto exchange is set to “focus on preparing for the listing until 2027.”
Bithumb’s CFO Jeong Sang-gyun said at the company’s annual shareholder meeting that the company was strengthening its accounting policies and internal controls following an IPO advisory agreement with Samjong KPMG.
Bithumb recently reappointed CEO Lee Jae-won for a two-year term at the Tuesday meeting, where the IPO delay was also addressed. Initially, the listing was expected around 2025.
The delay also comes as Bithumb remains under sustained regulatory and operational scrutiny, with a series of incidents raising questions around internal controls and compliance standards.
In February, the exchange mistakenly credited users with 2,000 Bitcoin instead of 2,000 Korean won during a promotional event that created internal balances exceeding $40 billion.
While most of the funds existed only on the platform’s internal ledger and were later reversed, the incident drew regulatory attention over how such large discrepancies could be processed within minutes.
Separately, South Korea’s Financial Supervisory Service has been examining the incident to assess potential weaknesses in Bithumb’s electronic ledger systems and oversight mechanisms.
Earlier this month, the exchange was also fined 36.8 billion won, about $24.5 million, for violations of anti-money laundering rules.
The exchange allegedly processed 45,772 crypto transfers involving 18 unregistered overseas virtual asset service providers, in breach of regulatory requirements.
Despite the delays, a major exchange going public could carry broader implications for crypto adoption and capital markets in the country.
Meanwhile, Dunamu, which operates Upbit, has also announced plans for an IPO following the completion of a share swap with Naver Financial, expected later this year.

Ethereum price is holding critical support despite macro headwinds and bearish prediction battering the broader crypto market. ETH is barely holding the $2,000 support, down more than 4% across the past 24 hours, yet on-chain metrics continue signaling underlying demand that price alone doesn’t capture.
Network activity shows that transaction volumes have remained elevated through the recent volatility, and developer deployment activity on Ethereum-adjacent infrastructure has not slowed. Aggregated forecast models currently place ETH in a contested range, with short-term targets diverging sharply between bulls and bears.
That divergence itself is a signal. As we know, markets rarely split this cleanly without a decisive catalyst incoming. Broader geopolitical uncertainty is amplifying volatility across all major pairs, keeping institutional positioning cautious.
Discover: The best pre-launch token sales
Ethereum Price Prediction: $2,500 This Month?
Ethereum is currently consolidating just above the $2,000 range, a zone that has acted as both support and resistance across multiple sessions. Short-term forecast models flag $2,000 as the psychological floor, and a clean break below would likely trigger accelerated selling toward the $1,800-$1,900 band, a level last tested during the 2024 Q4 pullback.
Volume has thinned relative to the February peak as a sign of indecisionn. The 50-day moving average is curling downward, pressing on price from above near $2,280. RSI on the daily sits in the mid-40s, not oversold, but far from a bounce signal.
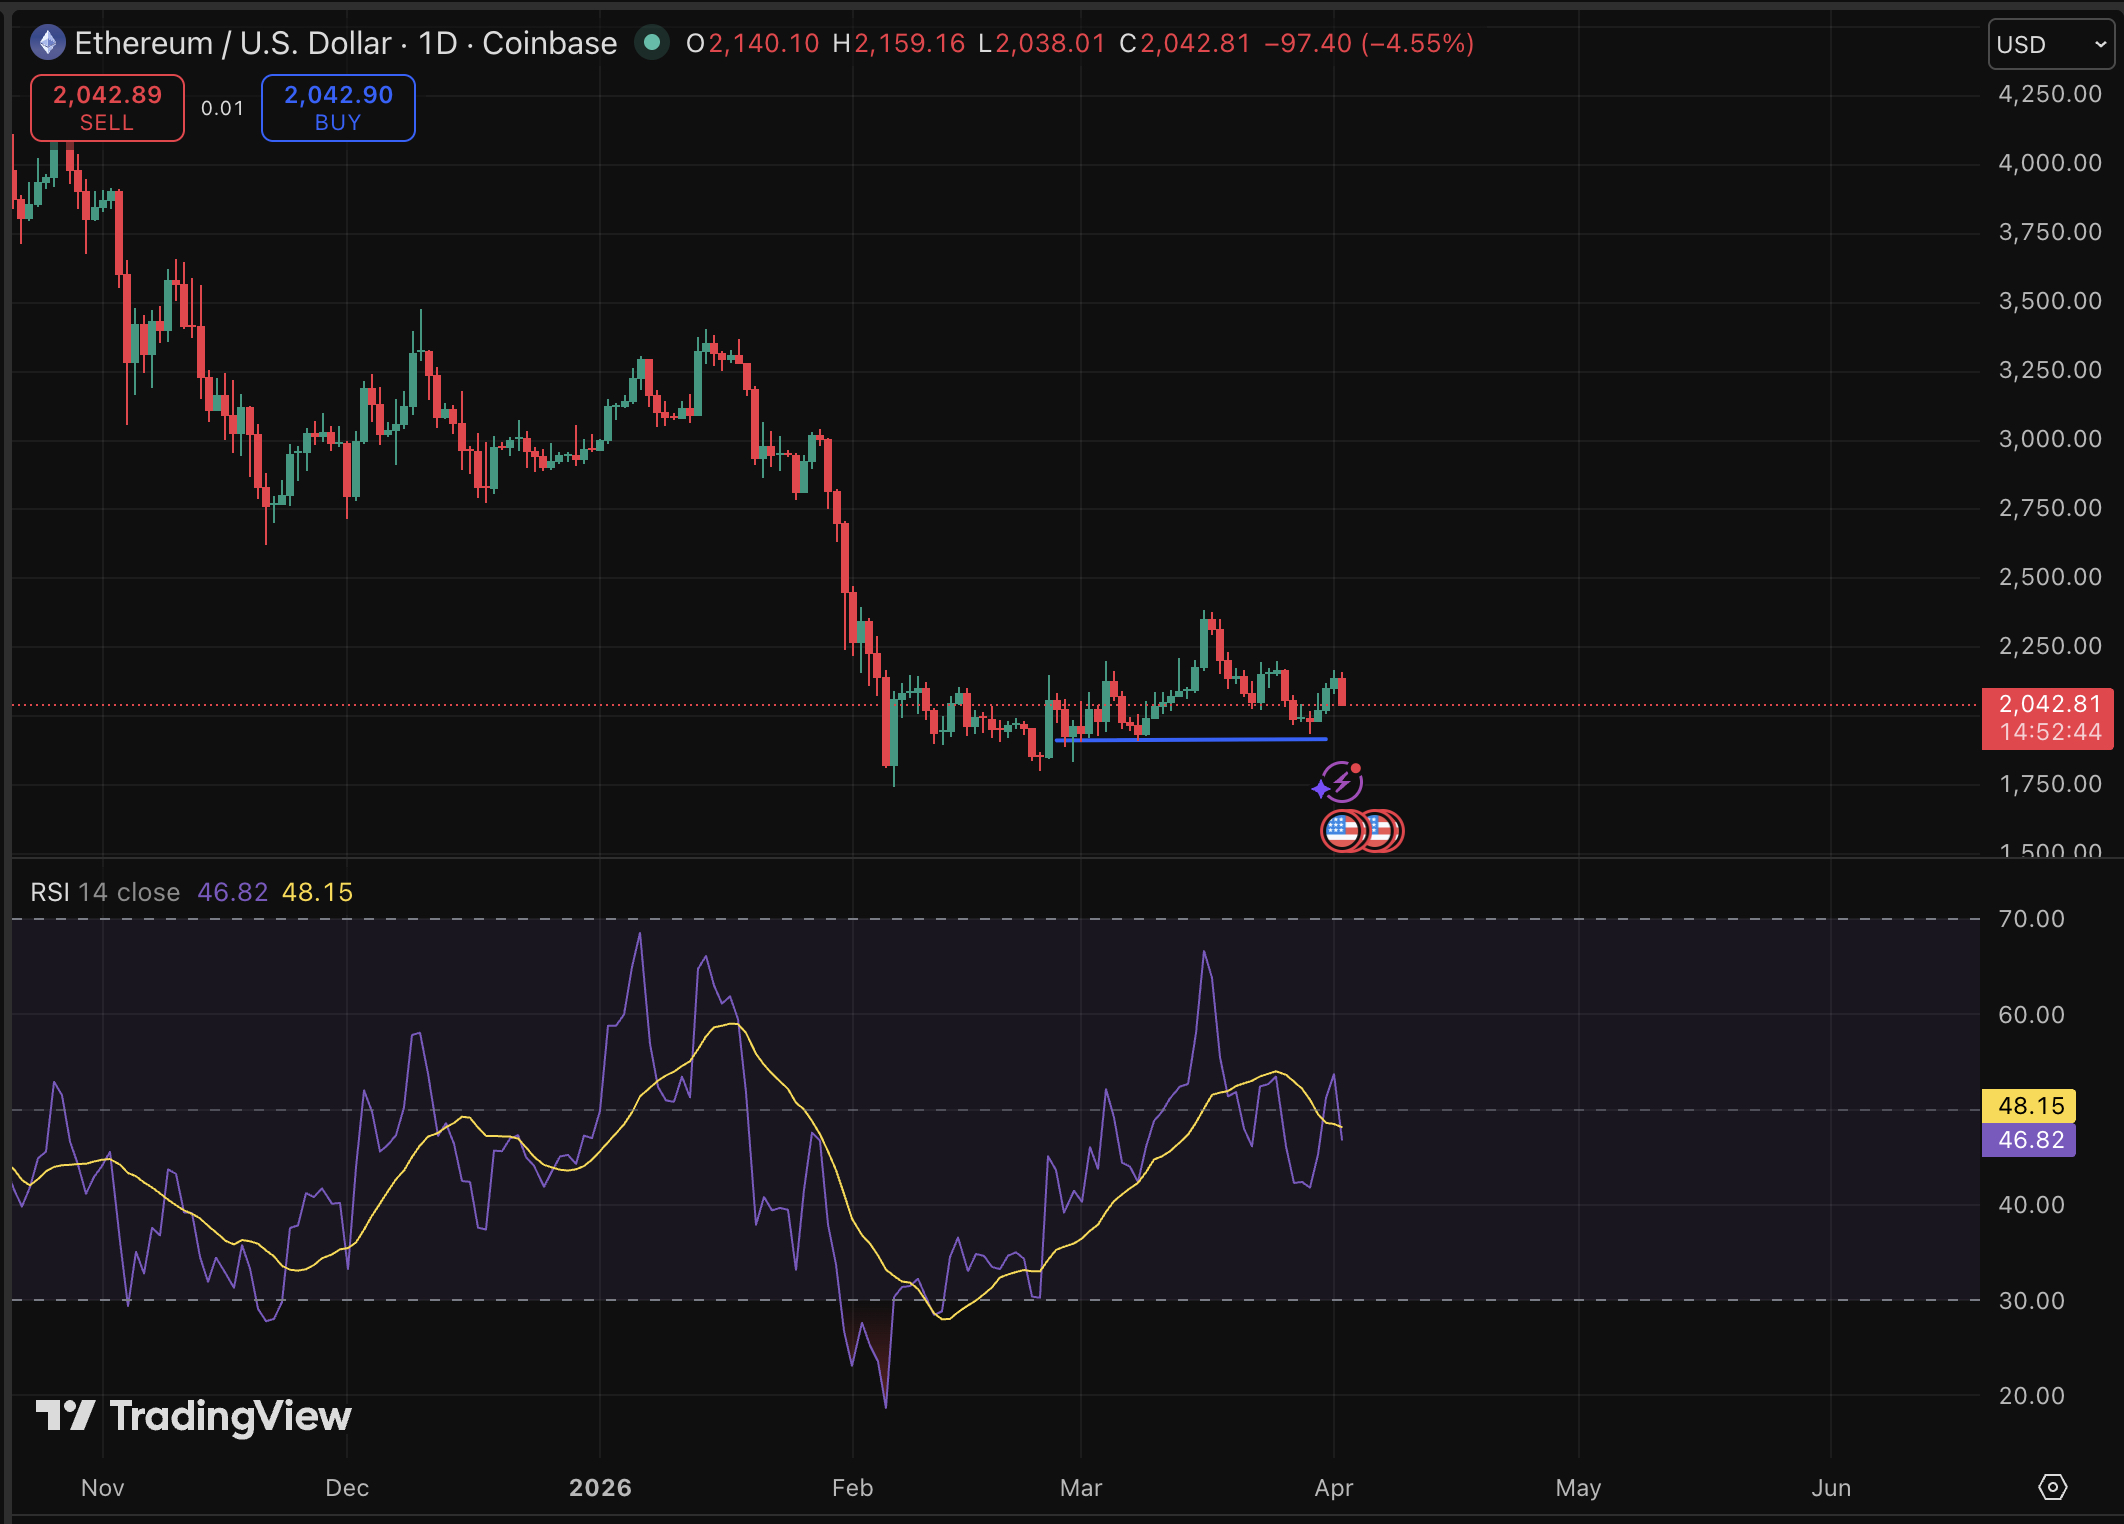
If support holds, ETH’s positioning relative to the altcoin cycle still looks constructive longer-term. Short-term, patience is the trade. $2,500 can break and wave goodbye to bears.
Discover: The best crypto to diversify your portfolio with
LiquidChain Targets Early Mover Upside as Ethereum Tests Key Levels
Ethereum’s compressed range is a reminder of the ceiling problem: even a strong recovery to $2,500 represents roughly 20% upside from current levels, a modest against the risk profile. That math is exactly why capital rotates toward earlier-stage infrastructure plays when large-caps stall.
LiquidChain is emerging as a notable infrastructure presale in this environment. The project positions itself as a Layer 3 execution environment that unifies liquidity from Bitcoin, Ethereum, and Solana. Developers deploy once and access all three ecosystems simultaneously, eliminating the fragmentation that currently costs DeFi protocols measurable TVL.
A new layer emerges. Only a few see it first.
The future is LiquidChain⟁https://t.co/vqvBcdSj94 pic.twitter.com/R7ZeZ0NPGl
— LiquidChain (@getliquidchain) March 24, 2026
The presale has raised $638K at a current token price of $0.01445, with a Unified Liquidity Layer and Verifiable Settlement architecture as its technical core. It also offers 1700% APY staking rewards as bonus for early buyers.
For traders watching ETH consolidate with limited short-term upside, exploring LiquidChain’s presale terms may be worth adding to the research queue.
This article is not financial advice. Cryptocurrency markets are highly volatile — conduct your own research before making any investment decisions.
The post Ethereum Price Prediction: Network Activity Still Growing in This Volatile Market appeared first on Cryptonews.

Albanese's wide-ranging National Press Club address

CLARITY Act Nearing Senate Markup, Floor Vote

Daily Mail’s media witch hunt against Polanski sparks complaints


-

 Business7 days ago
Instagram, YouTube Found Responsible for Teen’s Mental Health Struggle in Historic Ruling
-

 NewsBeat6 days ago
The Story hosts event on Durham’s historic registers
-
 Tech7 days ago
Intercom’s new post-trained Fin Apex 1.0 beats GPT-5.4 and Claude Sonnet 4.6 at customer service resolutions
-

 Sports6 days ago
Sweet Sixteen Game Thread: Tide vs Michigan
-
Entertainment3 days ago
Fans slam 'heartbreaking' Barbie Dream Fest convention debacle with 'cardboard cutout' experience
-
 Entertainment5 days ago
Lana Del Rey Celebrates Her Husband’s 51st Birthday In New Post
-
Crypto World2 days ago
Dems press CFTC, ethics board on prediction-market insider trades
-

 Crypto World14 hours ago
Gold Price Prediction: Worst Month in 17 Years fo Save Haven Rock
-

 Tech3 days ago
The Pixel 10a doesn’t have a camera bump, and it’s great
-

 Sports2 days ago
Tallest college basketball player ever, standing at 7-foot-9, entering transfer portal
-

 Tech2 days ago
EE TV is using AI to help you find something to watch
-

 Tech3 days ago
Apple will hide your email address from apps and websites, but not cops
-

 Fashion4 days ago
Amazon Sundays: Soft Spring Layers
-

 Tech2 days ago
How to back up your iPhone & iPad to your Mac before something goes wrong
-

 Tech2 days ago
Flipsnack and the shift toward motion-first business content with living visuals
-

 Fashion7 days ago
En Vogue in Brown Leather and Tailored Neutrals by Atelier Savoir, Styled by J Bolin
-

 Politics3 days ago
Should Trump Be Scared Strait?
-

 Crypto World2 days ago
U.S. rule change may open trillions in 401(k) funds to crypto
-

 Fashion7 days ago
What Are Your Favorite T-Shirts for the Weekend?
-

 Fashion6 days ago
Weekly News Update, 3.27.26 – Corporette.com
You must be logged in to post a comment Login