

Crypto World
Solana price must hold $80 support to fuel next leg higher: analyst

Solana price has held above the key $80 support zone despite mounting selling pressure, with one analyst arguing the level could determine whether the token begins a new recovery phase or enters a deeper bear market decline.
Summary
- Solana price has fallen toward the key $80 support zone after retreating from its May high near $98.
- Crypto analyst Scient said holding the $79–$80 range could keep the door open for a move toward $100–$120.
- A break below major support could trigger a deeper correction, while reclaiming $98 may revive bullish momentum.
According to data from crypto.news, Solana (SOL) price was trading near $82 on May 29 after briefly falling toward the $80 region during a broader crypto market correction.
The token remains down roughly 16% from its May high near $98 as traders continue to react to macroeconomic uncertainty, whale selling activity, and renewed geopolitical tensions in the Middle East.
Solana’s ongoing drop coincided with a sharp risk-off move across digital assets after Bitcoin (BTC) slipped below $73,000 and Ethereum (ETH) briefly traded under $2,000. Concerns over potential disruptions to shipping routes through the Strait of Hormuz pushed Brent crude oil prices higher this week, reviving inflation fears and reducing demand for speculative assets.
On-chain activity has added further pressure. As reported earlier by crypto.news Memecoin launchpad Pump.fun recently transferred more than 100,000 SOL worth roughly $8.3 million to Kraken. The move followed reports that a long-term Solana whale had unstaked and sold more than $137 million worth of SOL, adding significant supply to the market during an already fragile period.
Despite those headwinds, some analysts believe Solana remains at a pivotal technical level that could determine the direction of the next major move.
Can Solana defend a multi-year support zone near $80?
According to analyst Scient, the most important area on Solana’s weekly chart remains the range between $79 and $80, which coincides with the 2024 cycle low.
“The $79-$80 is the level for SOL. Hold it and the setup remains intact. Lose it and price likely revisits the mid $20s.”
The analyst highlighted a broader multi-year structure stretching back to the previous bull cycle. Solana has attempted to break above the $210 region on three separate occasions since 2021 but has failed each time. Following the latest rejection near that level in late 2025, SOL price returned to the lower end of the range where buyers have repeatedly stepped in.
Scient argued that current price action resembles accumulation rather than a confirmed breakdown. The analyst noted that SOL continues to trade above long-term support despite months of volatility and suggested the current range could serve as the foundation for another breakout attempt if buyers maintain control.
The weekly chart also shows SOL trading near the lower boundary of a large consolidation range that has contained price action for more than a year.
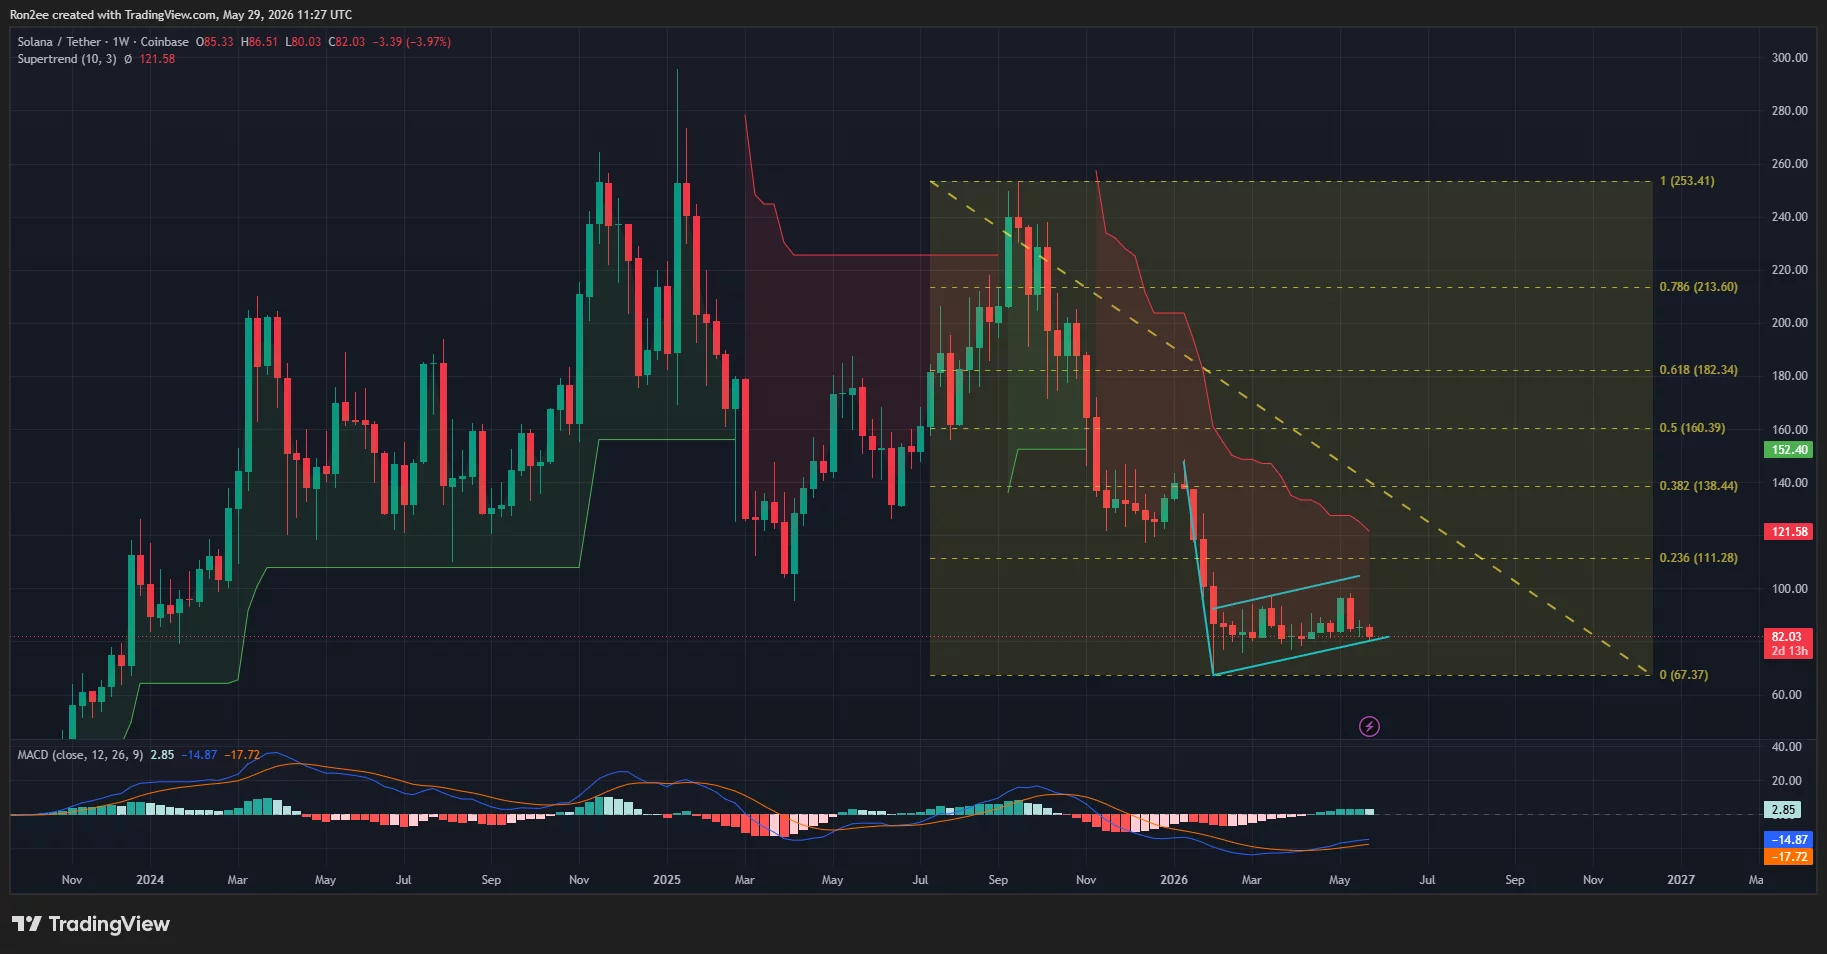
While the token remains well below the 0.236 Fibonacci retracement level near $111 and the weekly Supertrend resistance around $121, the $79-$80 support area has continued to attract buyers during repeated selloffs.
According to analysts at More Crypto Online, Solana could decline toward $62 if it fails to hold the key $72–$78 support zone. Conversely, a rebound above the May 12 high near $98 could pave the way for a move toward the $110 level.
Institutional sentiment toward Solana has remained mixed. Reports that Goldman Sachs liquidated its Solana ETF exposure earlier this year removed a notable source of institutional demand, while several asset managers continue pursuing crypto-related investment products tied to major layer-1 networks.
Traders have increasingly focused on whether fresh institutional participation emerges if market conditions stabilize during the second half of the year.
What technical risks could invalidate the bullish thesis?
The daily chart presents a more cautious picture. Solana price recently formed a bearish double-top pattern after failing twice near the $98 resistance area, first in March and again in May. The structure developed as momentum weakened across the recovery rally and sellers repeatedly defended the same overhead resistance zone.
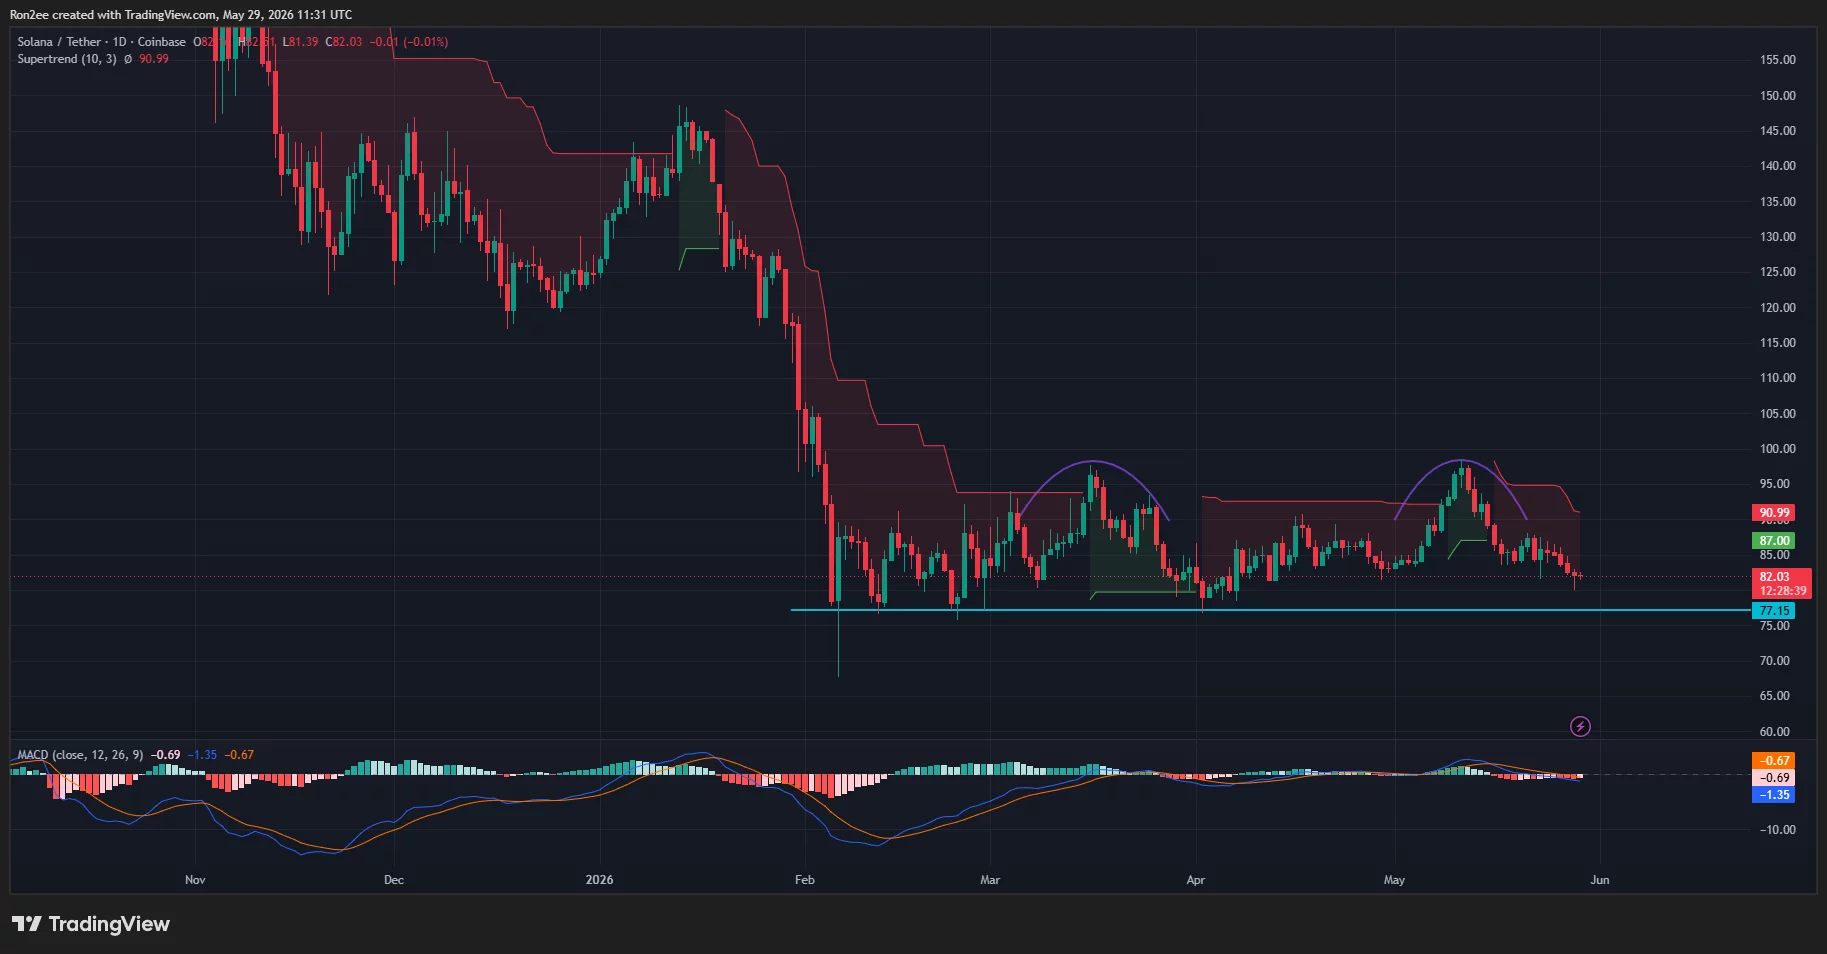
The chart shows that SOL has already fallen below several short-term support levels near $90 and $85. The daily Supertrend indicator remains bearish around $91, while the MACD has crossed lower and continues to trend below its signal line.
A separate longer-term chart structure also warrants attention. The weekly timeframe shows SOL trading inside what appears to be a bearish flag formation following its collapse from the 2025 highs.
Technical analysis treats such formations as continuation patterns, with breakdowns often producing another leg lower in the direction of the previous trend.
Derivatives positioning remains defensive as well. Open interest across Solana perpetual futures has declined during the recent correction, suggesting traders have reduced leveraged long exposure rather than adding new bullish bets.
Funding rates on several major exchanges have remained negative, showing that short sellers continue to dominate positioning.
CoinGlass liquidation data highlights another important battleground around current prices. A large cluster of leveraged positions sits near the $80 level, making it one of the most significant liquidity zones on the chart. Additional liquidation pools are concentrated around $84, $85, and $86, where short sellers could face pressure if price stages a recovery.
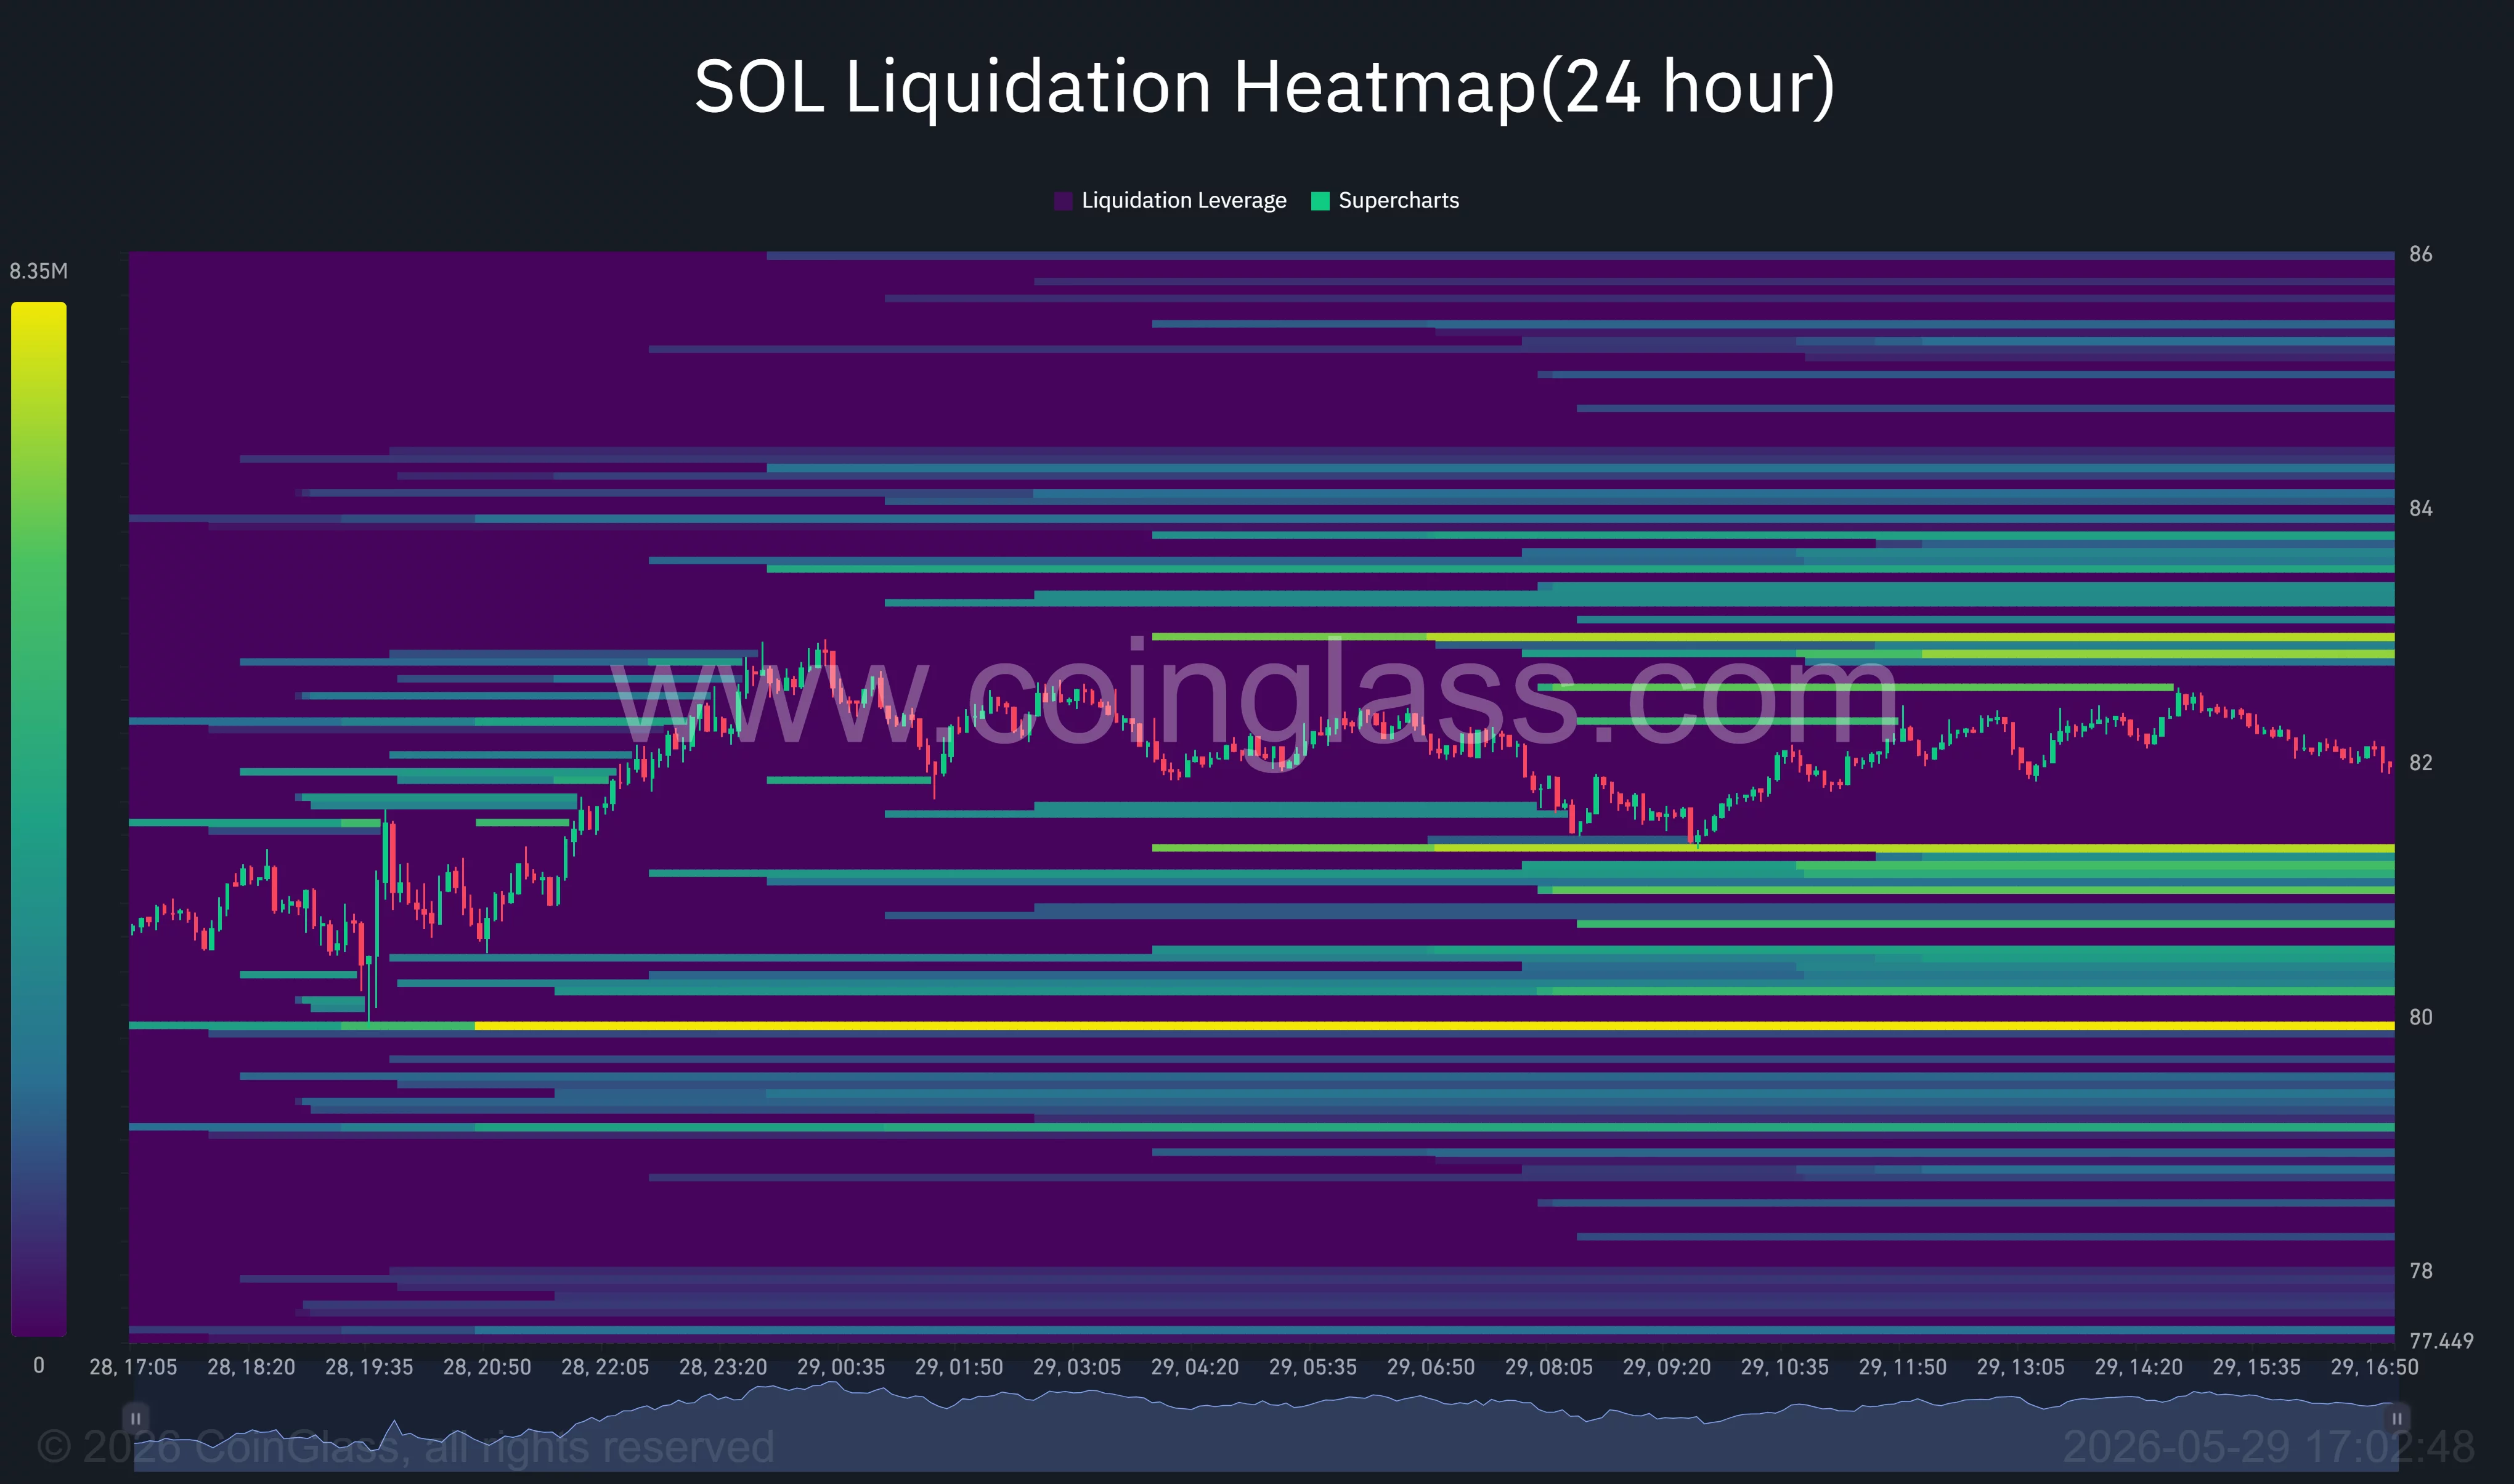
The heatmap suggests volatility could increase sharply if SOL breaks away from its current range. A move below $80 could trigger another wave of long liquidations and expose support near the $75-$77 region. Conversely, a recovery above $84 may force short-covering activity and create room for a move toward the $88 resistance cluster.
Macro conditions remain another source of uncertainty. Elevated oil prices have complicated expectations for Federal Reserve rate cuts later this year, particularly after recent inflation data showed price pressures remain stubbornly above target.
Higher borrowing costs and tighter financial conditions have historically weighed on high-beta cryptocurrencies such as Solana.
For now, traders appear focused on a single level. While daily charts continue to show a bearish double-top structure and weekly charts hint at a larger bearish flag, Scient’s thesis remains valid as long as the $79-$80 support zone survives.
Holding that area could allow buyers to target a recovery toward $100 and potentially $120, where volume profile data shows relatively limited resistance.
A decisive break beneath support, however, would invalidate the accumulation narrative and shift attention toward deeper downside targets that some analysts believe could extend well below the current trading range.
Disclosure: This article does not represent investment advice. The content and materials featured on this page are for educational purposes only.

Crypto World
SHRMiner launches free cloud mining service for BTC, XRP, ETH holders, offering daily earnings of up to $17,700+

Disclosure: This article does not represent investment advice. The content and materials featured on this page are for educational purposes only.
SHRMiner introduces a free mining service enabling BTC, XRP, and ETH holders to earn passive crypto income.
Summary
- SHRMiner promotes free cloud mining for BTC, XRP, and ETH, claiming easy passive crypto income without hardware.
- The cloud mining platform targets beginners with mobile access and simplified crypto mining via rented computing power.
- SHRMiner highlights large-scale global mining farms and renewable energy use while offering “free” crypto mining services.
As cryptocurrency gains increasing global popularity, more and more investors are looking for ways to generate steady passive income without the need for expensive equipment or specialized skills.
SHRMiner’s new free mining service enables holders of BTC, XRP, and ETH to easily earn passive income without requiring costly hardware or technical expertise.
In the rapidly evolving world of cryptocurrency, ease of use and high returns are paramount. For those seeking an accessible way to earn a steady income with minimal hassle, cloud mining stands out as a highly attractive option. This article delves into the concept of cloud mining and—using the leading brand SHRMiner as an example — explains how it can help generate daily earnings of $7,900 or even more.
The appeal of cloud mining
Cloud mining has long been favored by cryptocurrency enthusiasts for its ease of use and convenience. Unlike traditional mining, it eliminates the need for expensive hardware, specialized technical expertise, or constant monitoring. Cloud mining simplifies the process, enabling anyone — regardless of experience level — to participate in the cryptocurrency revolution. Instead of investing in costly mining equipment and managing complex systems, users can simply rent mining capacity from remote data centers and earn a share of the profits.
Recently, SHRMiner, a UK-based cloud mining platform, officially launched a new “free cloud mining service.” This service is designed for holders of mainstream cryptocurrencies such as BTC, XRP, DOGE, LTC, and EHT, providing users with a new opportunity to participate in cryptocurrency mining without any entry barriers.
At the same time, SHRMiner has launched a new mobile app that enables users to manage their mining activities anytime, anywhere, effectively ushering in the “era of mobile mining.”
SHRMiner: The perfect blend of laziness and profit
SHRMiner takes the simplicity of cloud mining to the next level, making it an ideal choice for beginners. Its user-friendly interface ensures that even those new to cryptocurrency can get started with ease. For SHRMiner, simplicity is not a drawback but a pathway to success.
As a pioneer in cloud mining, SHRMiner operates over 150 mining farms worldwide — equipped with more than 600,000 mining units powered entirely by renewable energy—and has earned the trust and support of over 5 million users thanks to its stable returns and robust security.

How can SHRMiner become a source of passive income?
Start earning mining rewards in just three simple steps:
1. Register an account
By visiting the official SHRMiner website,users can register for a free account in less than two minutes and receive a $15 sign-up bonus; this bonus allows them to quickly experience the platform’s services and earn a daily return of $0.60 from a complimentary trial contract.
2. Select a cloud mining plan
Choose a cloud mining plan that suits particular needs and budget. The platform offers flexible plans ranging from $100 to $200,000 to meet the investment goals of different users.
3. Start earning returns
After purchasing a contract, earnings are automatically settled within 24 hours without requiring additional management or action; users can withdraw their earnings to their cryptocurrency wallet addresses at any time or reinvest the profits to benefit from the compounding effect.
The primary advantage of this model is that it significantly lowers the barrier to entry. Users do not need to research specific mining hardware models or hashrate configurations, nor do they need to set up their own system environments; simply by registering an account, depositing assets, and selecting a mining plan, they can start earning returns.
SHRMiner Platform Advantages:
- Supports daily automatic settlement
- No additional electricity or maintenance costs required
- Utilizes advanced ASIC mining hardware, powered by renewable energy sources, including hydropower, wind power, and solar power
- Supports mining for multiple currencies: earn mainstream cryptocurrencies such as BTC, XRP, ETH, DOGE, USDC, USDT, SOL, LTC, and BCH.
- Equipped with SSL encryption and DDoS protection, a real-time earnings dashboard for easy monitoring of mining performance
- 100% remote access, fully accessible via the SHRMiner application or browser without hardware requirements, and 24/7 online technical support
- Affiliate Program: The Affiliate Program allows users to earn up to 4.5% commission by referring friends, with the opportunity to earn an additional bonus of up to 30,000.
Examples of common contracts:
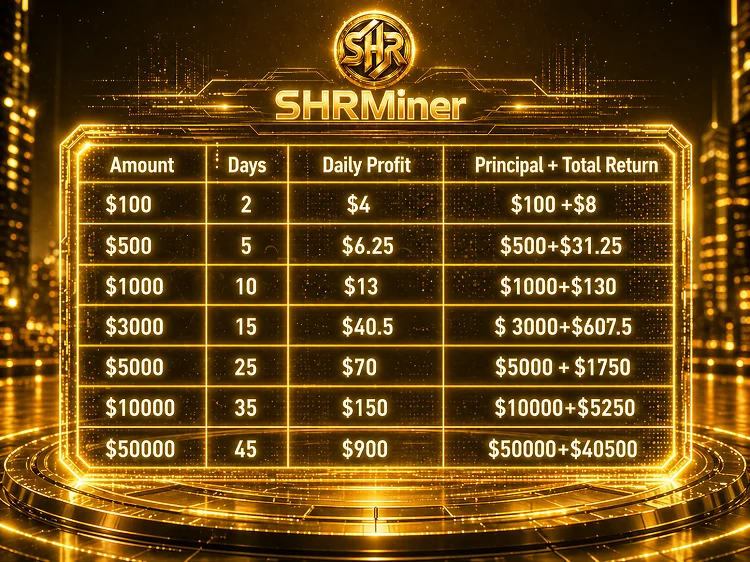
After purchasing a contract, earnings will be automatically credited to a specified account within 24 hours. Upon contract expiration, the principal will be returned in full. Users may withdraw the principal or reinvest it to benefit from compound returns; please click here for more details regarding the mining contract.
Unimaginable money-making opportunities
What sets SHRMiner apart is its extraordinary daily passive income; users have the opportunity to earn $7,900 or even more each day, turning the dream of online wealth into reality. Imagine generating substantial income without the need for ongoing investment or complex setups — that is exactly what SHRMiner offers.
Safety and Sustainability
In the mining sector, trust and security are paramount; SHRMiner fully recognizes this and prioritizes user safety above all else. Committed to transparency and legitimacy, SHRMiner ensures investment is protected, allowing users to focus on profitability. All mining facilities utilize clean energy, making this a carbon-consciouscloud mining operation. Renewable energy protects the environment from pollution while providing a powerful energy source.
In short
For those who are looking for ways to generate passive income, cloud mining could be a choice worth exploring. When approached correctly, these opportunities allow investors to effortlessly build cryptocurrency wealth on “autopilot” with minimal time investment. At the very least, they are far less time-consuming than any form of active trading. Passive income is the ultimate goal for every investor and trader, and with SHRMiner, maximizing passive income potential is easier than ever.
To learn more about SHRMiner, visit the official website.
Disclosure: This content is provided by a third party. Neither crypto.news nor the author of this article endorses any product mentioned on this page. Users should conduct their own research before taking any action related to the company.
Kraken has outlined a broad set of product and partnership updates for June 2026, spanning retail trading tools, “earn” features denominated in crypto, and new infrastructure links for payments and stablecoins. The announcements arrive as exchanges continue to compete on usability, distribution, and regulated access to higher-risk trading products.
Bitcoin-denominated rewards move in-house
One of Kraken’s headline offerings is Bitcoin Vault, described as a way for long-term BTC holders to earn BTC-denominated rewards directly from their Kraken accounts. The announcement positions the product as designed to avoid external wallet usage and to require no DeFi knowledge, with a stated 1-day lockup period.
For market participants, “earn” products that settle in the same asset they advertise can be attractive because they reduce day-to-day operational friction. At the same time, investors typically need to evaluate how rewards are sourced and how staking or custody terms affect liquidity and risk. Kraken’s framing suggests a tighter integration with the exchange account experience, which may broaden participation among users who do not want to navigate separate protocols.
Kraken Prop expands access to funded trading
Kraken also introduced Kraken Prop, characterized in the update as a funded trading program. According to the details shared in the announcement, participants access wallets after an evaluation process, with capital of up to $200,000 available. The profit split is described as up to 90% of eligible profits, and the program includes 60-plus crypto trading pairs, including BTC and ETH.
The program’s structure is notable in how it mirrors a broader trend across crypto trading education and “pro” funding models. These programs are often marketed to traders who want exposure to larger size without directly funding the full risk capital. For the exchange, they can also increase trading activity density if funded participants become repeat users.
As always, prospective traders typically need to review evaluation rules, eligibility criteria, withdrawal mechanics, and any restrictions on trading strategy, since these factors determine whether the product functions as a path to consistent returns or as a short-term contest with performance filters.
Spot margin and trading availability for US users
On the US trading side, Kraken said that Spot Margin is now available on Kraken Pro for CFTC-regulated spot margin trading to US retail traders. Separately, Kraken referenced additional spot margin availability through six new pairs for US spot margin traders.
The shift matters because margin offerings can change how retail participants construct portfolios, manage exposure, and respond to volatility. While spot margin does not introduce derivatives in the same way perps do, it still increases leverage and liquidation risk. Market observers generally look for how exchanges operationalize risk controls, including margin requirements, liquidation processes, and product eligibility by jurisdiction.
Perpetual futures, CFTC framing, and regulatory segmentation
Kraken also said it is set to launch what it describes as its first CFTC-regulated perpetual futures for US traders. The announcement does not provide trading terms, dates beyond “set to launch,” or additional specification details in the email text provided, but it signals continued expansion of regulated derivatives access.
For exchanges, regulated perpetual offerings can be a balancing act. They require compliance scaffolding and clear risk disclosures, while still competing with offshore venues that often offer broader product flexibility. For traders, the availability of regulated perps can impact execution quality, reporting expectations, and how institutions or compliance-conscious users evaluate venue selection.
Payments and stablecoin infrastructure partnership
Beyond trading, Kraken highlighted a partnership with Tempo focused on global payments and stablecoin infrastructure. The update also stated that USDT0 deposits and withdrawals are now available on Tempo, and that Tempo supports those transfers.
Stablecoin settlement and payment rails are increasingly important for exchanges, particularly where user demand includes faster cross-border movement and more predictable operational workflows. Still, users generally need to distinguish between stablecoin availability, network routes, settlement timelines, and withdrawal finality, since those operational details can vary by infrastructure provider and jurisdiction.
Additional retail features: staking and “Auto Earn”
Kraken’s June update package also includes further staking and earn-style product additions. The email references HYPE staking and Auto Earn as a way to put idle HYPE to work, alongside AVAX staking and Auto Earn for AVAX holders.
These features reflect a pattern common across large exchanges: integrating staking or reward logic into the main account experience rather than forcing users to interact with external staking contracts. The practical value is typically convenience, but the key for users is understanding lockups, reward frequency, and any conditions that affect how assets can be moved or sold.
Tokenized IPO access and other product additions
Kraken also referenced access to the SpaceX IPO via xStocks. In addition, it listed other product and listing-related items, including new asset listings and additional features tied to deposits and withdrawals across supported networks.
Tokenized IPO access is an area where marketing claims can outpace details, so investors usually look for disclosures around underlying issuers, instrument structure, custody, redemption or transferability, and regulatory constraints. The email text provided notes availability, but it does not include instrument terms in a way that would allow full verification of those mechanics.
What these updates signal for the market
Taken together, Kraken’s June 2026 announcements point to three strategic priorities for the exchange and, by extension, the broader market.
- Account-based “earn” products. Bitcoin Vault and Auto Earn features aim to keep rewards within the exchange workflow, reducing friction for users who prefer not to interact with separate protocols.
- Growing regulated trading depth. Spot margin availability and planned CFTC-regulated perpetual futures suggest Kraken is continuing to broaden the range of regulated trading tools available to US retail participants.
- Infrastructure partnerships tied to stablecoin payments. The Tempo collaboration indicates continuing investment in settlement and cross-border payment functionality, which can influence how quickly and reliably users move assets.
For users, the immediate relevance is practical: new products can alter trading options, liquidity planning, and how returns are realized. For the industry, the bigger takeaway is that exchange competition is increasingly about integration quality, regulatory scope, and how well products match user expectations for convenience and speed.


Crypto’s market structure bill cleared committee with votes to spare and a calendar working against it.
Summary
- The CLARITY Act cleared the Senate Banking Committee 15-9, but floor support still depends on unresolved disputes.
- The bill must merge Banking and Agriculture Committee text before any Senate floor vote can begin.
- Conflict-of-interest language, stablecoin yield rules, illicit finance provisions, and floor time remain the key risks.
- A pre-recess passage is possible but difficult, while a fall slip remains the most likely scenario.
Eleven months after the House passed it and one year after the GENIUS Act proved Congress could legislate on crypto at all, the Digital Asset Market Clarity Act stands closer to law than any market structure bill in American history, and closer to a familiar death. On May 14, 2026, the Senate Banking Committee advanced the bill by a vote of 15 to 9, with all thirteen Republicans joined by two Democrats. The crypto industry celebrated for roughly a day before the second half of the sentence sank in: both Democratic votes came with explicit warnings that committee support did not guarantee floor support, the bill still has to merge with a separate committee’s text, and the Senate calendar between now and the August recess is a traffic jam of expiring deadlines that have nothing to do with crypto.
The bill’s own advocates now describe the window in weeks. Negotiators have said the remaining disputes must be settled if the Senate is to have a chance of passing the bill in the next two months, a framing that puts the decisive period between mid-June and the recess. What follows is a map of that window: how the bill got here, what is actually in it, the procedural steps remaining, the disputes that could still kill it, the calendar it competes against, and the probability tree at the end.
How the bill reached this point
Legislative history matters here because it explains both the momentum and the fragility. The House passed its CLARITY Act in July 2025 with a bipartisan margin, handing the Senate a finished framework for dividing crypto oversight between the SEC and the CFTC. The Senate, as the Senate does, declined to take the House text and began building its own. Senators Tim Scott and Cynthia Lummis released a discussion draft in July 2025; the Banking Committee followed with a 182-page draft of its Responsible Financial Innovation Act in September; twelve Senate Democrats published their own framework days later, staking out the minority’s price.
January 2026 brought a 278-page draft with the first version of the stablecoin yield prohibition, and the Agriculture Committee, which owns the CFTC’s jurisdiction, published its companion Digital Commodity Intermediaries Act the same month. Decisive text landed on May 12: a 309-page bill containing the compromises that made the markup vote possible. Two days later the committee advanced it. The names have blurred along the way, CLARITY in the House, RFIA in Senate drafts, but correspondents covering the process have been explicit that these are the same legislation wearing different titles, and this piece uses CLARITY throughout.
One more piece of history shapes everything: the GENIUS Act precedent. Stablecoin legislation passed in July 2025 by assembling roughly the same coalition this bill needs, proving the votes exist for crypto law when the irritants are sanded off. Every actor in the current fight is consciously replaying that playbook, and every dispute below is, at bottom, an argument about which irritants must be sanded and which are load-bearing.
One refinement to that history changed the bill’s internal politics and belongs on its own line. The September 2025 Democratic framework was not an obstruction document; it was a price list, and the majority has spent eight months paying it line by line, from illicit finance to insolvency protections. Reading the bill’s drafts in sequence is watching a negotiation conducted through legislative text, with each new version longer than the last because each one bought votes with pages. The 309-page May text is 127 pages heavier than September’s draft, and nearly all the added weight is purchased consensus.
What is actually in the 309 pages
The May 12 text repays a closer read, because several of its provisions have received almost no coverage relative to their consequences. At the bill’s core remains the jurisdictional settlement: a framework deciding which digital assets fall to the CFTC as commodities, which remain securities under the SEC, and how assets move between categories as their networks decentralize. Around that core, the May text added four things. A compromise on stablecoin yield prohibits platforms from paying interest on idle stablecoin balances while permitting activity-linked rewards, language the banking lobby immediately attacked as inadequate.
The American Bankers Association argued the text fails to stop interest-like rewards in practice. A framework for DeFi trading protocols appears for the first time, sketching how decentralized front ends and protocols fit a regime built for intermediaries. An insolvency safe harbor for digital commodity transactions addresses the FTX-shaped hole in bankruptcy law, clarifying customer claims when a platform fails. A strengthened illicit finance section answers the issue Democrats have pressed hardest from the beginning.
What the text pointedly does not contain is the provision everyone is arguing about. The conflict-of-interest section restraining government officials from profiting on crypto sits outside the Banking Committee’s jurisdiction and must enter the bill later in the process. That absence is not an oversight; it is a deferred fight, and it is large enough to merit its own treatment. For the purposes of the map, it is the bill’s single most dangerous open item.
The GENIUS playbook, step by step
Because everyone in the building is consciously rerunning the stablecoin play, the play itself bears study, both for what transfers and for what does not. GENIUS succeeded on a specific sequence. The bill survived an early failed procedural vote that forced negotiators back to the table, paid the minority’s price in consumer protection and anti-evasion language through weeks of painful redrafting, picked up a bloc of Democratic votes large enough to clear cloture comfortably, and reached the President’s desk in July 2025 as the first major crypto statute in American history.
Three features of that run mattered most: the subject was narrow enough that the irritants could be enumerated and paid one by one, the industry coalition stayed unified behind a single text instead of fragmenting across preferences, and the ethics fight never fully attached. A stablecoin bill could be framed as plumbing rather than as a referendum on anyone’s portfolio. Map those features onto CLARITY and the transfer is two out of three. The irritant-payment machinery is working, as the May 12 compromises show, and the industry coalition has held.
What does not transfer is the third feature, and its absence is the whole story of the current stall. A market structure bill that decides the legal status of assets the President’s orbit holds cannot be framed as plumbing, which is why the ethics question attached to this bill and not the last one. The GENIUS playbook, faithfully executed, carries CLARITY to the doorstep of the same coalition and leaves it standing there. It is waiting on the one fight the playbook never had to win.
The vote math, read closely
Fifteen to nine sounds comfortable. The Senate floor arithmetic is anything but, and reading the committee vote correctly is the difference between optimism and analysis. Sixty votes are needed to clear a filibuster, which means roughly seven Democrats beyond unified Republican support. The two committee Democrats who voted yes attached the same caveat publicly: their support on the floor depends on further progress on outstanding issues.
Their votes are best read as an option, not a commitment, purchased by the majority with the May 12 compromises and exercisable only if the remaining disputes resolve. The September 2025 framework from twelve Senate Democrats remains the best guide to the minority’s full asking price: illicit finance enforcement with teeth, consumer protections, and the ethics provision. The illicit finance question has progressed furthest, with industry groups now running events aimed at law enforcement audiences to argue the bill strengthens rather than weakens their tools. That campaign’s existence tells you the votes it targets are not yet secured.
Two structural facts help the bill’s chances. Crypto market structure polls as bipartisan in a way most of this Congress’s agenda does not, and the GENIUS coalition exists as a proof of concept with most of the same members. Two structural facts hurt it. Election-year floor time is the scarcest commodity in Washington, and any single senator determined to extract a price can burn days the bill does not have.
What the agencies do while Congress decides
The window matters more because of what fills the vacuum if it closes, and the past year offers the preview. In the absence of statute, crypto’s legal status in America is being set by agency posture, and posture is reversible. The SEC of this administration has settled or dropped the enforcement docket of the last one, blessed waves of spot products, and governs by exemption and inaction. The CFTC claims digital commodities it has limited statutory tools to police, and the banking regulators have opened the charter gates, as the trust bank approvals of the past year show.
Markets have priced this regime as if it were permanent, and it is one election from review. That is the deep stake in the CLARITY window that day-to-day coverage misses: the bill does not create the current friendly environment, which already exists, but it is the only instrument that can make any part of it survive a change of administration. A vacuum filled by posture serves the industry right up until the posture changes. Everyone negotiating this summer knows which years the next posture would be set in.
The same logic explains why some sophisticated industry actors quietly prefer a slipped bill to a weakened one. Statute is forever, or close to it; a CLARITY Act passed with hollow definitions or a poisoned amendment would lock in flaws that posture could otherwise have papered over. The window is real, but it is a window for the right bill. The actors who remember how long securities law lasts are negotiating accordingly.
The merge nobody is watching
Before any floor vote, a procedural step with real substance has to happen: the Banking Committee’s text must be unified with the Agriculture Committee’s CFTC provisions into a single package. The two committees split crypto the way Congress splits everything, by agency, with Banking owning the SEC and illicit finance pieces and Agriculture owning the digital commodity regime that the CFTC would run. Merges of this kind are where quiet drafting fights happen, because the seam between the two texts is exactly the seam between the two agencies. Every definitional choice at that seam moves real assets between regulators.
The Agriculture side has been the less contentious throughout, with its January draft attracting bipartisan participation, but the merge consumes time even when it goes well. The floor process cannot formally begin until the unified text exists. Anyone handicapping the window should treat the merge as a two-to-four week tax on the calendar before the procedural clock even starts. That tax matters because the bill is already running against a crowded pre-recess schedule.
The calendar war
Now the traffic jam. The Senate’s pre-recess window must also accommodate, at minimum, a Foreign Intelligence Surveillance Act renewal carrying a hard deadline this month, a fight that has gone badly enough to consume extra floor time and that crypto has managed to entangle itself in through an attempted ban on central bank digital currencies inserted into the surveillance negotiations. A major housing package is competing for the same weeks, with leadership attention attached. Appropriations season looms behind both, with last autumn’s 43-day government shutdown still fresh as the example of what happens to every secondary priority when funding fights consume the chamber.
Every one of these items outranks a regulatory framework bill in deadline pressure, because none of crypto’s problems explodes on a date certain, and the Senate triages by explosion. Procedural math compounds the squeeze. A bill of this size needs floor time measured in days even with cooperation: a motion to proceed, debate, an amendment process that leadership must either open, inviting hostile amendments on ethics and consumer issues, or close, angering the very Democrats whose votes are needed, and final passage. Then the House must act on whatever the Senate produces, either swallowing the Senate text whole or forcing a conference that pushes everything past the recess.
The two-month window, examined closely, is more like four to five weeks of plausible floor access, shared with everything else. That is why the committee vote, while real progress, is only the beginning of the time problem. The bill must not merely have support; it must have support at exactly the moment floor time is available. In the Senate, those are different things.
The pressure campaign
Around the formal process, the influence machinery is running at full capacity, and its shape says a great deal about where the bill’s sponsors think the risk sits. The Blockchain Association staged an online town hall in early June aimed explicitly at law enforcement audiences, with Senator Lummis among those assuring police and prosecutors that the bill provides tough crypto powers. Industry groups do not spend June persuading constituencies they have already won, which locates the live anxiety precisely: the bad-actor and illicit finance provisions remain the gating issue for the Democratic votes that matter. On the other flank, the banking lobby keeps pressure on the yield compromise.
The banking lobby keeps pressure on the yield compromise, with the ABA urging senators to close what it calls a loophole letting exchanges pay interest-like rewards, an argument that doubles as a wedge to slow the bill if it cannot reshape it. Above the whole field hangs the White House, which has signaled it will accept broad ethics rules and reject anything reading as targeted at the President. That position simultaneously keeps the bill alive and keeps its hardest problem unsolved. The pressure campaign is therefore not noise around the bill; it is a map of which votes are still in play.
The House problem at the far end
Even a Senate triumph leaves one more chamber, and the endgame mechanics there belong on any complete map. The House passed its CLARITY in July 2025; the Senate product, after a year of drafting, differs from it in scope and detail. The yield compromise, DeFi framework, and insolvency provisions did not exist in the House text. When the Senate passes a different bill, the House faces the standard choice: swallow the Senate version whole and send it to the President, or insist on its own and force a conference that consumes months the calendar no longer contains.
The political gravity strongly favors swallowing, since the House’s crypto majority wants a law more than it wants authorship, and leadership on both sides has signaled flexibility. But the choice belongs to House leadership at a moment, late summer or fall, when every floor day is contested. The bill’s opponents understand that a conference demand is the cheapest possible way to run out the clock while voting yes on everything. The practical upshot for the map is to add two to six weeks to any Senate passage scenario before a signing ceremony, with the short end requiring the House to accept the Senate text unamended.
The probability map
Handicapping legislation invites false precision, so the honest format is scenarios with reasoning instead of decimal points. A pass-before-recess outcome requires nearly everything to break right: the merge finishing this month, the illicit finance language closing the last Democratic holdouts, an ethics compromise that survives Gillibrand’s red line and the White House’s, and leadership choosing to spend a week of jammed floor time on a bill with no deadline. Each is individually plausible. Their conjunction inside five weeks is demanding, and the FISA fight has already shown this Senate’s tendency to let deadline items eat the calendar.
The slip scenario is the modal outcome: the bill misses the recess with momentum intact and returns in the fall, where it collides with appropriations and an intensifying election season. Fall passage of bipartisan economic legislation has precedent, and the GENIUS coalition proved durable across similar delays, but every month closer to the election raises the cost of any Democrat handing the administration a signing ceremony. The ethics fight gets harder in election light, not easier. Death requires no dramatic event, only the continuation of stalemate on the conflict-of-interest section until the clock runs out, sending the whole effort into the next Congress to restart from drafts.
A reasonable distribution across the three, given everything above: the slip is more likely than the other two combined, the pre-recess pass is a real but minority chance, and death by calendar is the tail that grows with every week the ethics section stays unwritten. Readers should weight the map by one rule of thumb that has governed this bill all year. Progress has come exactly as fast as the Democratic asks have been paid, and no faster. That remains the best shorthand for the next two months.
What each scenario does to which assets
A map for traders should end with exposure, because the three scenarios do not price evenly across the asset class, and the differences are tradable. Bitcoin is the least exposed asset in every branch. Its commodity status is the one classification nobody disputes, its ETFs exist regardless, and its price has spent the year trading macro rather than legislation; CLARITY’s fate moves it least. The large non-Bitcoin majors sit at the other extreme, because the ancillary asset framework is, functionally, a law about them.
Tokens like XRP, SOL, and ADA gain a permanent statutory home in the passage scenarios and return to litigation-and-posture limbo in the death scenario, with everything that implies for exchange listings, institutional mandates, and the ETF pipeline behind the first wave. The middle of the market, DeFi tokens, gains something new in the May text and therefore has the most asymmetric exposure of all. The DeFi framework exists in no current law, so for that cohort the difference between passage and death is the difference between a defined regime and none. Stablecoins, oddly, are the calmest corner, since GENIUS already governs them, but the yield compromise inside CLARITY adjusts their competitive economics at the margin.
The bank lobby’s continued assault on that language is worth watching as a tell: the ABA fights hardest over provisions it expects to become law. Position accordingly, and date every position, because each checkpoint on this map has a window attached. The windows are the trade. For majors outside Bitcoin, the bill is not merely a policy story; it is a market-access story.
What to watch, in order
All of it reduces to a short checklist with dates attached. Watch for the unified Banking-Agriculture text, the precondition for everything, expected if the process is alive in the coming weeks. Watch the FISA endgame, because its resolution releases or consumes the floor time the bill needs. Watch for movement on the conflict-of-interest language, the single highest-information signal in the whole process; any reported framework there upgrades every scenario at once.
Watch the named Democratic holdouts on illicit finance, whose public statements will move before their votes do. Watch the recess date itself, the bright line that converts the slip scenario from possibility to fact. For crypto markets, the practical guidance is to trade the checkpoints, not the chatter. The committee vote was real progress and was priced as such; the next genuine repricing events are the merged text, an ethics deal, and cloture, in that order.
Everything between them is noise with a press release attached, and this summer will produce more press releases per week of actual progress than any stretch of the bill’s life so far. Keep the map open and the checkpoints marked. The CLARITY Act has a two-month window, but the window is not one thing. It is a sequence of gates, and the bill must pass through every one before the calendar closes.
As of June 11, 2026. Legislative status changes weekly; verify the current state of play before relying on this map. This article is information, not investment advice.
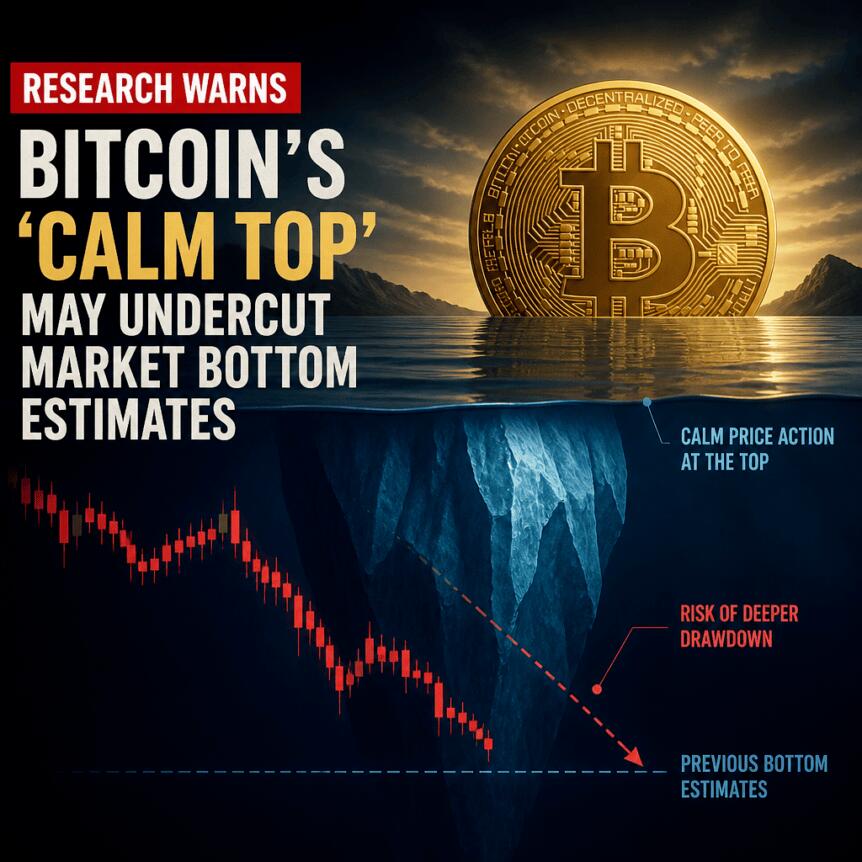
Bitcoin’s next major downside test may not have to sink as far as it did in earlier bear markets, according to a new analysis from Galaxy Digital. The firm argues that the asset’s realized-cost “floor” is currently higher than in previous cycles, implying that a cycle low could form at elevated price levels rather than through the deeper washouts seen historically.
In Galaxy’s base-case framing, the potential bottom sits between $40,000 and $46,000, with a tighter reference point tied to Bitcoin’s realized price at roughly $53,600. Galaxy head of research Alex Thorn also highlights that the current drawdown is still relatively young compared with prior cycle bottoms, while several commonly used bottoming indicators have yet to fully appear.
Key takeaways
- Galaxy Digital says Bitcoin’s “muted” cycle top could keep the network’s cost basis higher than prior bear markets, lifting the implied downside floor.
- The analysis places a base-case bottom range at $40,000 to $46,000, compared with a “washout” scenario of $30,000 to $37,000 and a shallower case near $51,000 to $54,000.
- Thorn estimates the cycle low could arrive sooner than in some prior downturns, as the current selloff is about eight months old versus 12–13 months in earlier cycles.
- CryptoQuant places BTC inside a historical value zone tied to bear-market lows, but demand indicators show a notable contraction.
Why Galaxy believes the downside floor may be higher
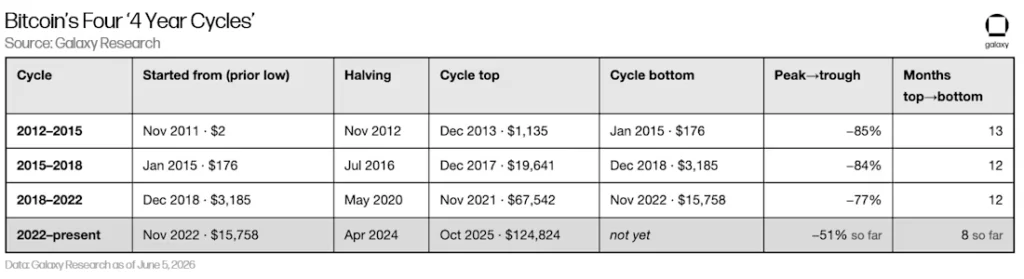
Galaxy’s research centers on a concept Thorn describes as “realized price” and the behavior of Bitcoin’s cycle from top to bottom. Thorn analyzed every Bitcoin cycle top and bottom and argues that the four-year rhythm continues to match historical timing closely, even as the magnitude of peak-to-trough declines has narrowed over recent years.
Across cycles, Galaxy notes that the drawdowns have compressed: from roughly mid-80% declines in earlier periods down to 77% in 2022 and around 51% in 2026. The implication is that the market is, so far, experiencing a less severe compression than past bear episodes.
A calmer top, fewer extreme signals
A central part of Thorn’s case is the behavior of the October 2025 cycle top. Galaxy claims that the topping environment was comparatively subdued: only two out of eleven traditional topping indicators triggered, and the Pi Cycle Top indicator reportedly failed to signal for the first time in this cycle framework.
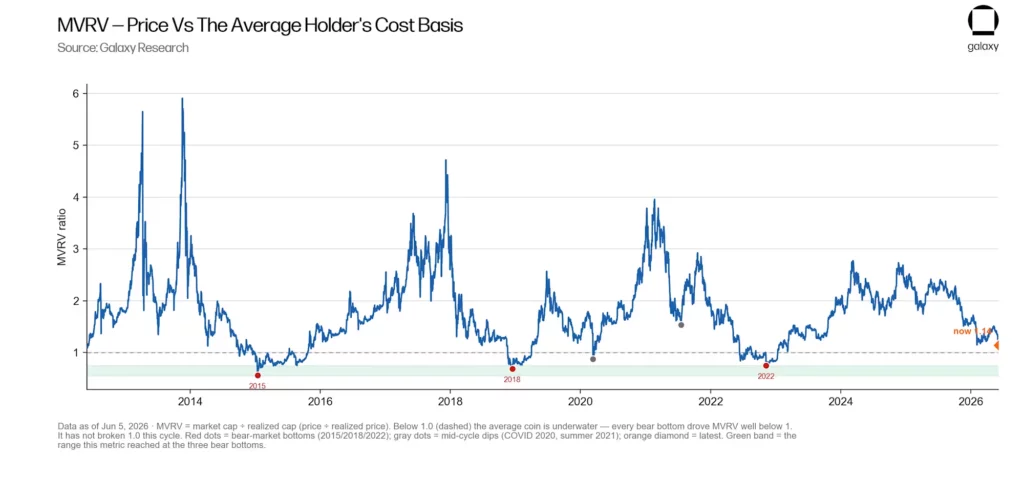
Galaxy also points to MVRV (market value versus realized value), which Thorn says peaked at 2.29—below prior cycles, which ranged from 2.93 to 5.91. Thorn argues that this “calm top” matters because it affects where long-term holders’ cost basis is anchored.
“The key insight: a calm top RAISES the floor. Because October’s top was so muted, the network’s cost basis sits at 43.7% of ATH, vs ~34%, 21%, and 17% in prior cycles.”
Bottom signals are not fully in place
Even if the floor is higher, Galaxy stresses that a bottom is not guaranteed simply because the top appeared muted. The report says several “bottoming signals” are still absent: only four of thirteen indicators have triggered so far, and most of the stronger signals have yet to appear. In other words, the analysis frames current conditions as supportive of a higher landing zone, but not as confirmation that a low is already locked in.
Cycle timing and scenario ranges for the next low
Beyond indicator counts, Galaxy also looks at when prior cycle bottoms formed relative to the market peak. According to the firm’s historical comparison, previous cycle lows typically emerged about 12 to 13 months after the peak. Thorn argues the present drawdown is roughly eight months old, leaving room—based on timing—for a bottom to form ahead of some earlier cycle patterns.
Realized price as an anchor
Thorn’s modeling uses Bitcoin’s current realized price, which Galaxy sets at $53,600. From there, Galaxy outlines three scenario ranges for where a bottom could form:
- Base-case: $40,000 to $46,000
- Washout scenario: $30,000 to $37,000
- Shallower decline case: $51,000 to $54,000
These ranges are designed to reflect different degrees of capitulation and the effect those sell-offs would have on the realized-cost distribution of holders across the network.
What could still move the “floor”
Galaxy’s most important caveat is that the cost-basis floor is reflexive—it can shift if market stress forces holders to transact at losses more broadly than expected. Thorn warns that real panic conditions could lower the implied floor by dragging down the network’s average cost as coins change hands below prior thresholds.
“The catch: the floor can move. cost basis is reflexive. in a real panic, coins change hands at a loss and drag the average down. A 10-30% cost basis decline pulls the implied floor from ~$40k back toward $28k.”
CryptoQuant: BTC near a bear-market value zone, but demand is weakening
Complementing Galaxy’s “realized price” approach, CryptoQuant’s on-chain work argues that Bitcoin is trading within a valuation zone historically associated with major bear-market lows. CryptoQuant’s framing, as reported by the firm’s research, notes that BTC recently traded around $59,000—about 9% above its realized price of $53,600.
CryptoQuant’s historical comparison suggests that prior cycle bottoms, including the November 2022 FTX-linked sell-off, tended to form at or slightly below the realized price. That pattern supports the idea that the eventual low could fall below $53,600 and overlap with Galaxy’s base projection between $46,000 and $40,000.
Demand contraction adds caution
Where CryptoQuant’s data introduces caution is in demand metrics. The firm reports a combined weekly decline of 652,000 BTC across speculative futures demand and apparent spot demand—described as the sharpest contraction since January 2022. It also says its one-year demand gauge has turned negative, indicating fewer BTC buyers than in the prior year.
This matters because the market can remain anchored near a value zone while still lacking the incremental bid needed to quickly reverse the downtrend. In practical terms, weaker demand can prolong the search for a bottom even if valuation levels look historically “cheap.”
What investors and traders should watch next
Galaxy’s analysis suggests a comparatively higher realized-cost floor and a path to a cycle low that may arrive before the deepest historical washouts—but both Galaxy and CryptoQuant emphasize that key signals are still incomplete and demand has cooled sharply. For the next leg of clarity, readers should focus on whether additional bottoming indicators trigger on the same timeframe that network valuation stabilizes, and whether BTC’s demand profile starts to recover as price tests the realized-cost bands.
Bitcoin may not have formed its cycle bottom yet, according to a new Galaxy Research report that uses market and onchain data to map possible downside zones.
Summary
- Galaxy says Bitcoin’s four-year cycle remains active, but each cycle is showing smaller price swings.
- The report places Bitcoin’s base-case bottom between $40,000 and $46,000 using onchain cycle data.
- Only four of 13 bottom indicators have triggered, suggesting Bitcoin may need more time.
Galaxy Head of Firmwide Research Alex Thorn said Bitcoin’s four-year cycle still appears active, even as the size of each move continues to shrink. The report argues that Bitcoin’s cycle structure has not disappeared, but its highs and lows have become less extreme.
“The 4-year cycle is still real, but it’s compressing,” said Galaxy Head of Firmwide Research Alex Thorn.
The report tracks Bitcoin’s path from prior lows through halvings, cycle tops, and later bottoms. Galaxy said earlier cycles saw peak-to-trough declines of 85%, 84%, and 77%, while the current drawdown has reached about 51% so far.

The current cycle is only about eight months past the October 2025 top. Galaxy said past bear-market lows have usually arrived 12 to 13 months after a cycle peak, placing the historical window closer to late 2026.
Bitcoin calm top changes bottom math
Galaxy said the October 2025 Bitcoin top was the calmest on record by several onchain measures. Only two of 11 classic top signals triggered, and both did so only slightly.
The report said Bitcoin’s MVRV ratio peaked at 2.29 in the current cycle. That compares with prior cycle tops between 2.93 and 5.91, showing less crowd euphoria at the peak.
The Pi Cycle Top signal also did not trigger during the October 2025 high. Galaxy said that was the first time the signal failed to appear during a major Bitcoin cycle top.
The calmer top matters because it placed Bitcoin’s market cost basis closer to the cycle high. Galaxy said the cost basis sat at about 43.7% of the prior all-time high, higher than in earlier cycles.
Galaxy maps Bitcoin bottom ranges
Galaxy’s base-case model places a possible Bitcoin bottom between $40,000 and $46,000. That range assumes the current cycle follows the trend of bottoms rising closer to fair value.
A harsher washout, similar to prior deep bear markets, could place the bottom between $30,000 and $37,000. A shallower outcome could hold between $51,000 and $54,000 if steady demand absorbs the decline.
“Overall, our data analysis suggests a Q4 2026 BTCUSD bottom,” said Thorn.
The report rejects the older rule that Bitcoin must fall 75% to 85% from its cycle high. Galaxy said that approach may now be outdated because it does not account for the calmer top and higher cost basis.
At press time, Bitcoin traded near $63,437 on June 12, according to crypto.news market data. That leaves spot price above Galaxy’s base-case bottom zone, but near the four-year average area that the report tracks as a key long-term support marker.
Bottom signals remain incomplete
Galaxy said only four of 13 bottom indicators have triggered during the current drawdown. The report said the strongest historical signs of a true bottom have not appeared yet.
Those missing signals include Bitcoin trading below its cost basis, holders sitting on broad unrealized losses, sustained loss-taking, and a deeper capitulation flush. Past cycle bottoms showed more of these conditions at once.
Galaxy also noted that Bitcoin had not fallen below its cost basis in this cycle. The current MVRV low has stayed near 1.14, while past bottoms pushed the ratio below 1.0.
The report also warned that the cost basis can move lower during panic selling. If coins change hands at losses, the realized price can fall and pull the estimated bottom range down.
ETF flows and market stress still matter
Galaxy’s study does not include political, regulatory, or geopolitical events in its model. It focuses on price history, timing, valuation, miner stress, trend measures, and sentiment data.
That matters because Bitcoin is also moving through a weak macro backdrop. As previously reported by crypto.news, the June crypto crash came from several pressures, including ETF outflows, U.S.-Iran tensions, a hawkish Fed, and leverage liquidations.
As previously reported, SpaceX IPO demand and broader capital rotation also thinned crypto liquidity before the selloff. That made Bitcoin more sensitive to forced selling when market pressure increased.
Bitcoin recently rebounded near $63.4K as Iran deal hopes cooled risk-off pressure, as reported earlier today. ETF outflows and options positioning still kept the $60K support area in focus.
Disclosure: This article does not represent investment advice. The content and materials featured on this page are for educational purposes only.

Set aside the ETF headlines and the courtroom drama, and the price of XRP gets made somewhere specific: on won and yen order books.
Summary
- XRP’s marginal price is heavily shaped by Korean and Japanese order books, not just Western ETF flows or Ripple headlines.
- South Korea’s spot-only crypto rules make XRP a high-beta leverage proxy for retail traders unable to use local derivatives.
- Japan’s XRP base is steadier, supported by SBI, stricter regulation, tax policy, and long-term retail familiarity.
- Traders should watch XRP/KRW volume share, won premiums, netflows, KOSPI stress, and ETF flows to read the real market.
On May 13, 2026, XRP did something on South Korean exchanges that no major Western venue has ever shown: it out-traded Bitcoin and Ethereum by combined margins of attention. Upbit, the country’s largest exchange, printed about $110.9 million in 24-hour XRP volume against Bitcoin’s $88.6 million and Ethereum’s $67 million, making the XRP/KRW pair the single busiest market on the platform. Bithumb, the second venue, showed the same pattern, with XRP behind only Tether’s stablecoin pair. The price barely moved, grinding between $1.44 and $1.46 beneath a resistance zone it had failed to break since February.
That single day was not an anomaly. It was the XRP market showing its true face. For all the attention paid to American ETF flows, SEC litigation, and Ripple’s corporate maneuvering, the marginal price of XRP gets set to a remarkable degree on Korean and Japanese order books. Understanding who actually trades this token, and why, explains more about its chart than any partnership announcement ever has.
It explains the violence of its drawdowns, the speed of its squeezes, the strange way it shrugs off news that should move it and erupts on news that should not. What follows is a tour of that market: the Korean machine, the Japanese base, the mechanics connecting them to the global price, and what any of it would take to change. The story is not only about XRP liquidity. It is about the traders whose incentives quietly write the chart most of the world reads too late.
Korea by the numbers
Start with the scale, because the scale is the story. Dunamu, the operator of Upbit, listed XRP as the platform’s most traded asset for the full year, ranking it ahead of Bitcoin and Ethereum across twelve months of order flow, not one viral afternoon. During a volume surge in July 2025, Upbit alone printed $269 million of XRP in 24 hours, the highest figure on any exchange in the world that day, with $161 million of it compressed into a single hour. In the March 2025 episode that doubled global XRP spot volume to $1.84 billion in a day, Upbit’s $452 million led every venue on earth.
Korean trading does not just favor XRP; it favors everything that moves. Altcoins make up 70% to 80% of volume on the country’s domestic exchanges, against a global average near 50%. The market runs on rotation: capital sweeps from one mid-cap name to another in days, chasing whatever is trending on the country’s hyperactive trading communities, then sweeps out again. XRP holds a special place inside that rotation as the permanent fixture, the asset Korean retail returns to in every cycle, familiar enough to be a default and volatile enough to be interesting.
The May episode showed the rotation’s other trigger: the local stock market. XRP’s surge to the top of the Korean books came as the KOSPI index slumped, and reporting at the time was blunt about the mechanism: middle-aged retail traders rotating out of weak equities and into the most familiar high-beta crypto asset available. When Korean stocks disappoint, a measurable slice of that frustration arrives on the XRP order book within days. No Ripple press release is involved at any point in the process.
The spot-only rule that explains everything
Why XRP, though? Why does a payments token with a corporate parent in San Francisco function as the national trading vehicle of South Korean retail? The deepest answer sits in Korean regulation, and it is the single most underappreciated fact in XRP market analysis. South Korea prohibits domestic crypto derivatives for retail, which means no futures, no options, and no leveraged tokens on local venues.
Access to offshore derivatives platforms is legally restricted, so Korean traders who want amplified exposure have exactly one tool available: volatility itself. A spot-only trader replicates leverage by choosing assets that move twice or three times as hard as Bitcoin, and XRP, with its deep liquidity, household familiarity, and high beta, is the closest thing the Korean rulebook allows to a leveraged Bitcoin position. Read the order book through that lens and its strangeness becomes rational. The preference for XRP over Bitcoin is not a belief about cross-border payments or a vote on Ripple’s lawsuit.
It is a structural workaround: the most liquid lottery ticket in a market where the casino only sells spot. The same logic explains the 70% to 80% altcoin share, the days-long rotation cycles, and the short holding periods that local analysis describes as a market optimized for short-horizon decisions over conviction. None of this flow is reading Ripple’s quarterly reports. Most of it would rotate into a different ticker tomorrow if a different ticker moved better.
For XRP’s global price, the consequence is a permanent, structural layer of demand that is enormous, loyal in aggregate, and utterly mercenary in the particulars. Korea will always trade XRP. Korea will not always be buying it. That distinction is why Korean volume can be bullish for liquidity and bearish for price at the same time.
The kimchi premium and the plumbing
Korean crypto markets carry a famous quirk with real consequences for XRP: prices on won pairs regularly detach from global levels, trading at a premium in manic phases and occasionally at a discount in fearful ones. It exists because Korean liquidity is partially sealed off, with capital controls and strict banking rules making arbitrage between won markets and global markets slow and legally fraught. When Korean demand surges, prices on Upbit can run several % above Binance for hours or days before the gap closes. For a token as Korea-weighted as XRP, the premium mechanics work like a feedback amplifier.
A global uptick draws Korean momentum buying, the won price runs ahead, premium-watching traders worldwide read the gap as a bullish signal and front-run the arbitrage, and the global price chases the Korean one upward. The loop runs equally well in reverse: Korean capitulation drags won pairs to a discount, the discount reads as a death signal, and global selling accelerates. Twice in the past decade, broad altcoin manias have effectively been Korean premium events exported worldwide, and XRP sat near the center both times. The kimchi premium is not a curiosity around the XRP market; it is part of the market’s transmission mechanism.
The netflow data adds a final wrinkle that volume numbers hide. During the July 2025 surge, even as Upbit led the planet in XRP volume, the exchange showed a negative net XRP flow of more than $100 million in a day, meaning tokens were leaving the venue even as trading exploded. Volume measures excitement, while netflow measures direction. Korean XRP data routinely shows the two pointing opposite ways, which is just what a rotation-driven, fast-money market should produce, and why headlines celebrating Korean volume as adoption get the story wrong.
How XRP became Korea’s coin in the first place
Korean retail’s marriage to XRP predates everything in today’s data, and the history explains the loyalty better than any present-day incentive. During the 2017 mania, South Korea briefly became the center of the crypto universe, and XRP was its favorite child. Korean won volume drove a staggering share of global XRP trading through that winter, the kimchi premium blew out to double digits, and the token’s vertical January 2018 top, the all-time high that still anchors every long-term chart, was to a remarkable degree a Korean event. Won pairs led the world up and then led it down when regulators threatened exchange closures.
An entire generation of Korean traders made and lost fortunes on XRP specifically, and markets remember their first loves. The asset that minted a country’s defining boom-and-bust story became permanent furniture in its trading culture. Entrenchment deepened through the quiet years, because while Western exchanges delisted or sidelined XRP during the SEC lawsuit, Korean venues never did. The token kept its premier placement on Upbit’s screens through the entire legal winter.
By the time American institutions returned to the asset in 2024 and 2025, Korean retail had simply never left. That is why the country’s order books today carry the depth, familiarity, and reflexes that a decade of continuous trading builds. The Korean XRP market is not a recent enthusiasm. It is an institution with a longer unbroken history than most of the asset’s Western infrastructure.
The concentration nobody prices: Upbit itself
One more fact shapes the map, because it concentrates an uncomfortable amount of XRP’s market structure in a single point of failure: Upbit’s dominance of Korean trading. Upbit handles the overwhelming majority of Korean crypto volume, operating through a real-name banking partnership that gives it privileged access to the won on-ramp. Korean regulators have spent recent years openly examining that concentration, from anti-monopoly scrutiny of the exchange’s market share to reviews of its banking arrangement. For most assets, a Korean policy shock would be a regional story.
For XRP, whose single busiest global trading pair has repeatedly been Upbit’s won market, it would be a direct hit to the token’s primary price discovery venue. A suspension, a banking partner change, or a forced market share remedy in Seoul would do more to XRP’s daily liquidity than any plausible action by the SEC. Risk runs the other direction too, and traders should hold both. Korean policy has been drifting toward expansion, not restriction, with institutional access and ETF frameworks under discussion, and Upbit’s parent has been positioning for that bigger market.
The point is not that Seoul threatens XRP. The point is that a token whose price formation leans this heavily on one venue in one jurisdiction carries a concentration risk that appears in no Western risk model, and it costs nothing to know it. Upbit is not just another exchange in XRP’s market structure. It is one of the places where the market’s center of gravity actually sits.
Japan: the other pillar, built differently
Cross the strait and the XRP market changes character completely. Japan holds one of the world’s oldest and deepest XRP retail bases, but it trades nothing like Korea, and the difference between the two books is a lesson in how regulation shapes behavior. Japanese crypto runs through exchanges licensed by the Financial Services Agency under some of the strictest consumer rules anywhere: segregated customer assets, cold storage mandates, and listing reviews that can take years. Inside that conservative perimeter, XRP achieved something unusual: institutional sponsorship.
SBI Holdings, one of Japan’s largest financial groups, has been Ripple’s most committed corporate ally for nearly a decade, running a joint venture for Asian payments, holding XRP on its own balance sheet, championing the token through the public statements of its chief executive Yoshitaka Kitao, and wiring XRP into live remittance corridors through SBI Remit. These include the Japan-to-Southeast-Asia routes where the token actually performs its original bridge function. Japanese retail absorbed that sponsorship years ago. XRP became, for a generation of Japanese savers, the respectable altcoin, the one a major financial institution had publicly blessed.
Japanese policy quietly reinforces the holding culture. Crypto gains in Japan are taxed as miscellaneous income at progressive rates that can approach the mid-fifties for high earners, a regime that punishes active trading and rewards sitting still, the exact inverse of Korea’s flat-rate deferrals and rotation-friendly structure. SBI has layered its own incentives on top over the years, at times offering XRP itself as a shareholder benefit, an arrangement with no real parallel anywhere in crypto: a blue-chip financial conglomerate handing its registered shareholders the token as a perk. Between the tax code and the corporate sponsorship, Japanese XRP sits where it lands.
The result is a holder base with the opposite metabolism to Korea’s. Japanese XRP money skews toward accumulation and long holding, moves less day to day, and shows up in the data as a stabilizing floor rather than a momentum engine. Korea supplies XRP’s velocity; Japan supplies a meaningful share of its patience. Both books are retail, both are enormous, and they pull the token in different directions: one amplifying every swing, the other quietly absorbing supply through them.
What this microstructure does to the chart
Put the pieces together and several chronic mysteries of XRP price behavior dissolve. Take the drawdown violence first. XRP routinely falls harder than its market cap peers in broad selloffs, and this spring was no exception, with the token losing roughly 17% in a single week of the June slide while breaking supports that had held for months. A market whose marginal trader is a spot-only momentum player has no natural buyer during declines.
The Korean book that supplies the bid in uptrends rotates elsewhere the moment momentum dies, taking its 70%-of-volume firepower with it, while the patient Japanese bid sits far below the action by design. Between the momentum layer and the accumulation layer lies an air pocket, and XRP falls through it with regularity. Then comes the news immunity. Corporate announcements that thrill Western holders routinely fail to move the price, while obscure local catalysts, a KOSPI slump, a Korean community rumor, or an exchange promotion, produce hundred-million-dollar volume days.
The marginal buyer does not read Ripple press releases, so Ripple press releases do not move the margin. The flow responds to what its actual drivers respond to: momentum, rotation, local market conditions, and the premium signal. The squeeze behavior follows the same logic. When XRP does catch a genuine uptrend, the same machinery that amplifies declines turns around and amplifies the rally, with Korean rotation capital piling into the most familiar name on the board and the premium loop exporting the move globally.
The token’s history of violent, late-cycle vertical rallies, the kind that triple the price in weeks after months of stagnation, is the signature of this structure. The spot-only leverage proxy works in both directions. It punishes the token when momentum disappears and rewards it when rotation comes back. That is why XRP’s chart can look dead for months and then move like a small cap when the right book wakes up.
Reading the signals correctly
For a trader or a journalist, the practical payoff of all this is a different dashboard. The standard XRP analysis toolkit, ETF flow tables, whale wallets, legal calendars, misses the market’s actual engine, and a Korea-aware toolkit looks different. Watch the XRP/KRW volume share on Upbit, not just the global total: a rising Korean share during a rally signals rotation money, the kind that leaves, while a rally on flat Korean share suggests something rarer and more durable is bidding. Watch netflow against volume, because volume spikes with negative netflows mark distribution dressed as enthusiasm.
Watch the premium: won pairs trading rich against global levels is a real-time gauge of Korean retail temperature, and its collapses have led global XRP downturns more reliably than any moving average. Watch the KOSPI too, absurd as it sounds, because the strongest single-day XRP volume event of the spring was triggered by a Korean equity selloff, not by anything that happened to Ripple. The signals also clarify what Korean volume cannot tell you. It cannot confirm institutional adoption, which lives on entirely different rails.
It cannot validate the payments thesis, since the flow is expressly speculative. It cannot anchor a long-term price target, because rotation capital prices nothing beyond the next move. This is where the full XRP price outlook must separate microstructure from fundamentals, because the book can explain the next swing without answering the long-term valuation question. The Korean book is a magnificent amplifier and a terrible oracle.
A worked example: reading one week of tape
Theory earns its keep in practice, so take the early-June slide as a worked example of the Korea-aware dashboard against the standard one. A standard reading of that week was straightforward and mostly useless: XRP fell roughly 17%, whales were selling, and support broke. A microstructure reading saw more. Korean volume share in XRP had been climbing for weeks while global price stalled under resistance, the classic signature of rotation money carrying the bid alone.
Netflows on the won venues had turned negative even on green days, meaning the loudest book in the market was distributing into its own enthusiasm. When the broad selloff arrived, the momentum layer did what the structure predicts, vanishing rather than defending. The token fell through the air pocket between the Korean bid and the Japanese one until it found the deeper levels where patience lives. Nothing about the move required whale conspiracies or news catalysts.
The order books had been describing it in advance to anyone reading the right columns. The example generalizes into the simplest possible rule for this asset: when Korean share rises and netflow falls, treat strength as borrowed. When Korean share falls while price holds, something sturdier than rotation is bidding, and that is the rarer and more valuable signal. The rule will not call tops and bottoms, but it will tell you who is on the other side of your trade, which is most of what microstructure can ever offer.
What would change the structure
Market structures this entrenched change through regulation, and two live regulatory tracks could redraw the XRP map within a couple of years. The Korean track runs toward liberalization. Seoul has spent 2025 and 2026 inching toward institutional participation in crypto, debating corporate trading accounts, spot ETF frameworks, and eventually derivatives access. Every step in that direction dilutes the spot-only distortion that makes XRP the national leverage proxy.
A Korean retail trader with access to regulated Bitcoin futures has less structural reason to express risk appetite through XRP, while Korean institutions entering spot markets would add exactly the slower, conviction-weighted flow the book currently lacks. Liberalization would likely shrink XRP’s share of Korean volume and deepen its quality at the same time, a trade long-term holders should welcome and momentum traders will mourn. The American track runs through the CLARITY Act and the ETF era. If U.S. market structure law settles XRP’s status permanently, the institutional flows that today tiptoe through ETF wrappers gain room to grow into something that rivals the Asian retail base at the margin.
The token’s price formation would then have three real engines: Korean momentum, Japanese patience, and American allocation, instead of two and a rounding error. The institutional flows that today tiptoe through ETF wrappers are still modest compared with the Asian retail base, but they are the one Western channel capable of changing the marginal buyer over time. If they deepen, XRP stops being priced mainly by Asian retail rotation and starts being priced by allocation mandates too. That would not erase Korea or Japan, but it would reduce their dominance.
Japan is also moving toward a more formal ETF regime, and XRP sits close to that conversation because of SBI’s long relationship with Ripple. A Japan ETF track would not look like Korea’s rotation market, because Japanese investors are slower-moving and more regulation-sensitive. But an approved XRP ETF in Japan would reinforce the country’s role as the patience layer rather than the momentum layer. That would deepen the book in the direction XRP has historically lacked.
Other fundamentals can still matter, but they need to create demand that survives the trading cycle. The on-chain credit system in validator voting would matter for XRP if it turns ledger activity into locked supply, yield demand, and practical use rather than another announcement cycle. That kind of utility would not replace the Korea-Japan structure immediately. It would, however, give non-speculative buyers a reason to exist beside it.
Nothing about the current chart guarantees that future. But it is the only visible path to an XRP market where the marginal price-setter holds for reasons connected to what the asset is supposed to do. Until then, the book remains the map. The first sign of change will not be a headline; it will be a shift in volume share, netflow, premium behavior, and ETF persistence.
The book does not lie
Every asset’s chart is a referendum on who owns it, and XRP’s chart has been telling the same story for years to anyone willing to look past the headlines and into the order flow. The token’s price gets made by a Korean retail machine that loves its volatility and owes it nothing, steadied by a Japanese base that bought a story its institutions endorsed a decade ago, and increasingly orbited by Western institutional money that has so far committed only modestly. The chart’s character, explosive, treacherous, indifferent to news, loyal to momentum, is not a mystery or a manipulation. It is the faithful signature of that ownership.
That means the question that matters for XRP’s next act is not the one usually asked. Not what will Ripple announce, but who will the next marginal buyer be. If the answer stays the Upbit rotation trader, the chart will keep behaving exactly as it always has, in both directions. If the regulatory tracks in Seoul and Washington deliver new kinds of buyers, the chart will start telling a new story.
The first place that change will show is not in the price at all. It will show in the books, in the share columns and the netflow tables, weeks before the headlines catch up, the way everything about this token always has. For now, XRP remains a token whose global story is often written in English but whose price is frequently negotiated in Korean won and Japanese yen. The book does not lie; the mistake is reading the wrong one.
As of June 11, 2026. Volume figures and market shares shift daily; verify current data before trading. This article is information, not investment advice.

TLDR:
- Goldman Sachs forecasts hyperscalers will direct about 98% of operating cash flow into CapEx by 2026.
- AI spending is approaching dot-com era levels as firms expand data centers and computing infrastructure.
- Big Tech capital expenditures could reach $920 billion by 2027, with upside estimates near $1.4 trillion.
- Growing concerns remain over whether AI spending can generate returns that justify rising investments.
AI spending is approaching levels last seen during the dot-com era, according to new projections from Goldman Sachs.
The firm expects hyperscalers to allocate nearly all operating cash flow toward capital expenditures by 2026. The forecast has renewed discussions about whether current AI spending can generate returns that match the scale of investment.
Hyperscalers Push AI Spending Toward Historic Highs
Goldman Sachs projects that hyperscalers will allocate about 98% of their cash flow from operations to capital expenditures in 2026. The estimate places current AI spending close to levels seen during the peak of the dot-com boom.
The discussion gained attention after market commentary shared by Global Markets Investor pointed to rising concerns around AI spending.
The post noted that major technology companies could direct almost all internally generated cash toward data centers, computing infrastructure, networking equipment, and AI hardware.
The chart accompanying the analysis tracks capital expenditure as a percentage of cash flow from operations. Historical data shows telecom companies exceeded 120% during the early 2000s infrastructure boom. Meanwhile, the broader technology, media, and telecom sector reached nearly 95% at its peak.
In contrast, hyperscalers maintained much lower spending levels for years. Between 2015 and 2018, the group invested roughly 30% to 40% of operating cash flow.
However, AI spending accelerated sharply after cloud demand expanded and artificial intelligence development intensified.
By 2023, the ratio climbed to around 55%. Goldman Sachs now expects it to reach approximately 68% in 2025 before moving toward 98% in 2026.
The projection suggests that nearly every dollar generated from operations could be redirected into infrastructure growth.
Questions Grow Around Returns on AI Spending
The current investment cycle is largely driven by demand for AI computing capacity. Companies continue expanding data centers while purchasing large volumes of GPUs and networking equipment to support advanced models.
Goldman Sachs expects Big Tech capital expenditures to approach $920 billion by 2027. Under its more aggressive scenario, spending could rise to as much as $1.4 trillion. That figure would represent growth of up to 89% compared with average 2026 projections.
At the same time, some businesses deploying artificial intelligence tools are evaluating whether AI spending is producing sufficient returns. Revenue growth remains a key focus as infrastructure costs continue increasing across the industry.
Competition among model providers has also intensified. Pricing pressure between major AI developers has fueled debate about long-term profitability. Lower prices may support adoption, yet they can also limit revenue growth if usage expansion fails to offset declining costs.
The chart shows hyperscalers moving well above historical averages and approaching the 100% threshold. Such levels indicate that almost all operating cash flow could be committed to future growth projects rather than shareholder distributions or other corporate activities.
Supporters of the investment cycle point to expanding cloud demand and broader AI adoption. Others remain focused on whether AI spending can produce revenue growth capable of supporting the scale of capital commitments now being planned.
With projections extending through 2026 and 2027, AI spending remains one of the most closely watched themes across global financial markets. Investors continue monitoring whether infrastructure demand and commercial adoption advance at a pace that matches rising capital allocation.


Sam Bankman-Fried’s bid to overturn his criminal conviction has failed. A three-judge panel of the U.S. Court of Appeals for the Second Circuit affirmed his conviction on all seven counts of fraud and conspiracy Friday, along with his 25-year prison sentence. Bankman-Fried’s defense had argued that… Read the full story at The Defiant
Crypto fraudsters are increasingly setting their sights on mass-market sporting events, and the 2026 FIFA World Cup is emerging as a high-value target. TRM Labs says it has identified multiple World Cup-related scam operations that combine fake ticketing with fixed-match betting pitches and crypto-themed promotion tactics designed to move funds from victims quickly.
In a report shared with Cointelegraph, the blockchain intelligence firm warned that scammers often prepare well before kickoff—building infrastructure weeks in advance, then scaling activity as public attention peaks. With large audiences expected to seek tickets, travel, and wagering opportunities, investigators say the risk of fraud is likely to remain elevated throughout the tournament.
Key takeaways
- TRM Labs identified World Cup-related scams including two fake ticketing sites and a fixed-match betting pitch tied to four crypto addresses.
- TRM Labs says scammers typically build operations ahead of major events, then intensify activity when demand surges.
- US authorities previously warned that threat actors were spoofing FIFA websites to collect personal information and sell fake tickets.
- FIFA cautions that tickets sold outside official channels may be invalid and subject to cancellation without notice.
- Complicated ticket availability—especially around resale—may increase opportunities for fraudulent intermediaries.
TRM Labs links crypto scams to World Cup demand
According to TRM Labs, the scammers behind World Cup-themed schemes are leveraging the same dynamics that make major tournaments profitable: concentrated interest, time-sensitive decision-making, and widespread use of online payments. The company said it identified several operations tied to the event, including two fake-ticketing websites and a fixed-match betting pitch associated with four crypto addresses.
Ari Redbord, global head of policy at TRM Labs, told Cointelegraph that criminals do not wait until the first match to strike. He said scammers often prepare infrastructure weeks in advance and then scale once the public is fully focused on the event.
Redbord also highlighted a practical advantage for compliance and investigations. Because crypto transactions are recorded on-chain, investigators and financial compliance teams can potentially intervene earlier than they might in purely traditional payment channels—before losses become harder to contain.
Why the timing and ticketing environment raise the stakes
The 2026 World Cup is being hosted across Canada, Mexico, and the United States. FIFA has said it expects attendance of about 6.5 million fans across the tournament, alongside large economic impact—creating a broad pool of demand that can be exploited by scammers offering tickets, travel, and betting opportunities.
TRM Labs’ warning aligns with broader concerns about online fraud during sporting events. Earlier in the run-up to the tournament, the FBI publicly warned that threat actors were spoofing FIFA websites. In May, the agency said these actors were attempting to collect personal information, sell counterfeit tickets and products, and potentially carry out other malicious activity.
FIFA has also issued direct guidance to fans. In its warnings, FIFA said tickets purchased outside its official website may expose buyers to fraud. It added that tickets obtained through unofficial channels may be treated as invalid and could be cancelled without notice.
Real-world ticket pressure can fuel scams
Even when official channels exist, gaps in availability can create openings for bad actors. The Council on Foreign Relations reported that several opening matches in the US and Canada were not sold out on FIFA’s platform as of Monday. In parallel, the Financial Times reported that official resale portals still showed 176,000 unsold tickets across the group stages.
These conditions matter because fraudulent actors often target moments when legitimate buyers are actively searching for options. When people feel urgency—whether due to partial sell-throughs, unclear resale timing, or uncertainty about seat availability—they are more likely to fall for impersonation sites or “limited inventory” claims.
For investors and market participants who interact with crypto rails, the key point is that these scams are not limited to one category. TRM Labs’ identification of both fake-ticketing operations and fixed-match betting pitches suggests scammers are casting a wide net across the World Cup’s commercial ecosystem rather than relying on a single entry point.
What to watch as the tournament progresses
TRM Labs’ message is that the window for fraud is not confined to kickoff week. With scammers capable of positioning infrastructure ahead of time, enforcement and consumer-protection efforts need to remain active throughout the tournament—not just at the beginning. Fans and anyone supporting compliant payments should monitor for impersonation tactics, verify ticketing channels carefully, and treat event-themed crypto promotions with skepticism.
As more attention flows to resale activity, betting chatter, and viral event content, the most important question for the rest of the tournament will be whether authorities and compliance teams can keep pace with scammers scaling operations in response to public demand.
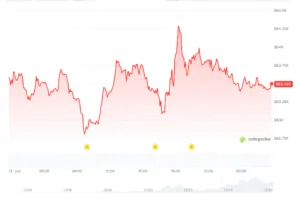
TLDR:
- Gold is stabilizing near record levels, renewing discussion about capital rotation into Bitcoin markets.
- Historical cycles show Bitcoin rallies often followed periods when gold reached new all-time highs.
- Bitcoin trades near $63,962 as investors assess whether another rotation phase is developing.
- Traders remain focused on macro conditions that could support or challenge the gold-to-Bitcoin trend.
Bitcoin is drawing renewed attention as gold stabilizes near record levels, reviving discussions about a recurring market pattern observed across previous cycles.
Market participants are assessing whether capital that previously flowed into gold could begin moving toward Bitcoin as investors seek higher-return opportunities.
Gold Rally Cools as Bitcoin Traders Watch for Capital Rotation
A recent post from crypto market commentator CryptoTice argued that gold may be approaching a transition phase after completing a major breakout.
The post suggested that Gold often absorbs investor demand during periods of uncertainty before capital gradually shifts toward Bitcoin once gold reaches new highs and enters consolidation.
The chart accompanying the post compares Bitcoin and gold on a weekly timeframe from 2015 through 2026. It identifies several periods where gold reached record highs before Bitcoin entered strong upward trends.
According to the chart, similar conditions appeared before Bitcoin’s rally toward $20,000 in 2017 and its move to nearly $69,000 in 2021.
Gold spent much of the period between 2016 and 2020 trading within a broad range before breaking above previous highs near $2,070. After that move, the metal traded sideways for an extended period. The chart marks this phase as a period where profits may have gradually shifted into Bitcoin.
A comparable structure is now being discussed after gold’s latest advance. Gold recently climbed to fresh records and remains near historically elevated levels. Market observers note that the asset has begun showing signs of stabilization following its sharp rise.
Spot gold is currently trading near $4,200 per ounce after retreating from earlier record highs. Traders continue monitoring the $4,000 level as a key area of support while geopolitical developments and U.S. economic data influence sentiment.
Bitcoin Maintains Recovery as Historical Pattern Reappears
Bitcoin’s price action is also being observed as the asset attempts to recover from recent market weakness. According to Coingecko Data, Bitcoin was trading near $63,492 as of this writing, reflecting a gain of roughly 2.5% over the past 24 hours.

Source: Coingecko
The chart identifies three major Bitcoin expansion phases. The first occurred during the 2016–2017 bull market when Bitcoin rose from below $1,000 to nearly $20,000.
The second followed gold’s 2020 peak and preceded Bitcoin’s climb toward $69,000 during the 2020–2021 cycle.
The current setup represents the third period identified by the analysis. Bitcoin has already recovered substantially from its 2022 bear market lows and has advanced through several major price levels. Supporters of the rotation theory believe another phase of capital movement could be developing.
At the same time, market participants acknowledge that historical relationships do not always repeat.
Gold and Bitcoin can move higher simultaneously, particularly when investors seek protection from economic uncertainty while also pursuing growth opportunities.
Broader market conditions remain an important factor. Interest rate expectations, liquidity conditions, regulatory developments, and global economic trends may influence whether the historical relationship between the two assets continues.
For now, traders are closely watching whether gold remains in consolidation after its latest records. If previous cycles provide a useful guide, Bitcoin could attract increased attention as investors reassess portfolio allocations.
However, future price direction will continue to depend on broader market conditions rather than historical patterns alone.

Roku exploring strategic options, including sale of company, sources say

SHRMiner launches free cloud mining service for BTC, XRP, ETH holders, offering daily earnings of up to $17,700+

Christian Pulisic sparks injury scare for USA after coming off following superb World Cup performance


![BITCOIN: CRAZY!!!! THIS IS CRAZY!!!! [trades]](https://wordupnews.com/wp-content/uploads/2026/05/1778214197_maxresdefault-80x80.jpg)

-
 Entertainment6 days ago
The Best Mystery Series of All Time Is Surging on Streaming 30 Years After It Ended
-

 NewsBeat5 days ago
Alexander Zverev wins the French Open to finally earn a 1st Grand Slam title
-

 Crypto World5 days ago
Anatomy of the June crypto crash: Fed, Iran, Saylor
-

 Crypto World1 day ago
Oppenheimer backs SpaceX as $70 billion retail frenzy builds
-

 Tech7 days ago
Suspicious Polyfill login prompts pop up on Toshiba, Muji websites
-

 Crypto World1 day ago
Markets Rally as SpaceX IPO Looms Amid Iran Tensions and Inflation Surge
-
Crypto World6 days ago
Senator Cynthia Lummis Calls CLARITY Act the Most Consequential Financial Legislation of This Generation
-
 NewsBeat5 days ago
Alexander Zverev conquers demons and outlasts Flavio Cobolli to win French Open for first major title
-
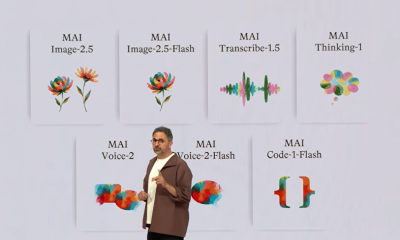
 Tech6 days ago
Microsoft unveils seven homegrown AI models in new bid for ‘long term self-sufficiency’
-

 Business5 days ago
High Stakes for Wembanyama as New York Pushes for 3-0 Lead
-

 Tech7 days ago
Hackers now exploit SolarWinds Serv-U flaw to crash servers
-
 Business6 days ago
The Pain Points Taking a Fragile Tech Rally Down a Notch
-
 Crypto World5 days ago
Eli Lilly (LLY) Stock Surges 4% Following Breakthrough Sleep Apnea Trial Results
-

 Tech5 days ago
Notion restores access to Anthropic after service disruption
-

 Crypto World6 days ago
Trump’s AI Ownership Plan Could Benefit Anthropic at OpenAI’s Expense
-
 Business6 days ago
The investment to transform historic St Helen’s ground in Swansea
-
 Sports3 days ago
Bangladesh beat Australia after 20 years in ODIs, register only their second win over six-time world champions | Cricket News
-

 Business7 days ago
Forensic Expert Floats Handyman Theory in Disappearance of Savannah Guthrie’s Mother
-

 Tech12 hours ago
This Week In Security: Microsoft On Microsoft, Register Your Domains, Linux On ARM, And FreeBSD Joins The File Cache Club
-

 Sports2 days ago
First Time Since 1971: Australia Register Historic Low In ODI Cricket
You must be logged in to post a comment Login