

Crypto World
Solana price prediction 2026-2030: beyond the ETF paradox

Solana trades near $84-$96 in late May 2026, having spent much of the year recovering from a difficult Q1 that saw the price slice from $200+ down to the low $60s before stabilizing.
Summary
- Solana’s recent advance has coincided with progress on the Alpenglow upgrade, Firedancer rollout, and more than $1.12 billion in cumulative spot ETF inflows.
- Around 30 institutions, including Goldman Sachs and Electric Capital, hold roughly $540 million in Solana ETF exposure as institutional participation continues to grow.
- Long-term projections hinge on successful deployment of Alpenglow and Firedancer, sustained ETF demand, and stronger activity across tokenized assets, decentralized exchanges, and the broader Solana ecosystem.
Five spot SOL ETFs are now trading with cumulative inflows passing $1.12 billion since launch. The most recent weekly streak pulled $39.3 million in seven days. Bank of America’s Q1 2026 13F filing revealed a $53 million crypto ETF portfolio with measured Solana exposure.
Approximately 30 institutions have built a combined $540 million Solana ETF exposure, including Electric Capital and Goldman Sachs. The catalyst stack is dense. Alpenglow consensus overhaul went live on a test cluster May 11, 2026, marking the largest technical shift in Solana’s history. The upgrade targets finality under 200 milliseconds (down from current 12.8 seconds). Firedancer (Jump Crypto’s independent validator client) has 207 validators live, targeting 1M+ TPS. Frankendancer (hybrid version) accounts for ~26% of total staked SOL.
The Alpenglow + Firedancer combination addresses Solana’s two structural weaknesses: predictability (institutional adoption prerequisite) and client diversity (decentralization concern). Delphi Digital dubbed 2026 the “Year of Solana.” Kevin Warsh, who holds SOL, was sworn in as Federal Reserve Chair on May 23, 2026.
The honest read is Solana (SOL) represents the cleanest catalyst stack among major L1s for 2026 but faces structural questions about memecoin dependency, TVL decline (TVL fell 56% from August 2025 peak), and whether the ETF flows can sustain through volatility. Standard Chartered’s $250 target is the consensus anchor. Doo Prime’s $336 is the upside case.
This piece walks through actual mechanics, the bull case ($350-$750 by 2030), the base case ($150-$280), and the bear case ($60-$120), with specific variables determining outcome.
Why Solana is at $90 right now
The current Solana price reflects recovery from a Q1 2026 capitulation plus anticipation of the densest catalyst stack in crypto.
The starting point: SOL traded above $200 through 2025, peaking around $260 in late 2024. The decline to the low $60s in Q1 2026 (approximately 75% drawdown from peak) was driven by multiple compounding factors: memecoin volume collapse reducing fee burn, TVL declining 56% from the August 2025 peak above $11.5 billion to approximately $5.5 billion, broader crypto market weakness, and specific concerns about Solana’s institutional adoption pathway.
The recovery catalysts: SOL bottomed in February-March 2026 and rallied to current $90 levels driven by specific developments. Alpenglow consensus upgrade went live on test cluster May 11, 2026. Firedancer rollout progressed to 207 validators. Spot ETF inflows showed consistent weekly accumulation. Institutional positioning grew through Q1 2026 13F filings revealing $540M combined institutional ETF exposure.
The Alpenglow upgrade specifics: the consensus overhaul targets transaction finality of approximately 150 milliseconds, down from the current 12.8 seconds. This is Solana’s largest-ever consensus change. The upgrade enables Solana to compete with traditional payment networks (Visa processes transactions in ~200ms typically) on latency. Co-founder Anatoly Yakovenko has signaled a Q3 2026 mainnet activation timeline.
The Firedancer rollout: Jump Crypto’s independent validator client addresses Solana’s historical client diversity weakness (previously dependent primarily on Agave/Solana Labs client). Frankendancer hybrid version is live with 165+ validators (~26% of staked SOL). Full Firedancer is in final pre-mainnet testing. The upgrade targets 1M+ TPS capability versus current network limits. Multi-client diversity addresses fundamental network resilience concerns institutional investors stressed.
The ETF flow dynamics: cumulative spot SOL ETF inflows passed $1.12 billion by May 2026. Bitwise and VanEck lead among issuers. Weekly inflows showed $39.3M streak in early May 2026. The flow pattern is meaningful but smaller than Bitcoin ($120B+) and Ethereum cumulative ETF inflows, reflecting Solana’s positioning as second-tier institutional allocation.
The institutional positioning: 13F filings from Q1 2026 revealed approximately 30 institutions with combined $540 million Solana ETF exposure. Goldman Sachs and Electric Capital among notable holders. The institutional base is developing but smaller than Bitcoin’s institutional holdings. Bank of America trimmed altcoin ETF exposure in Q1 2026 while maintaining its Bitcoin position, suggesting institutional allocations stay cautious on altcoins generally.
The Fed Chair dynamic: Kevin Warsh, who reportedly holds SOL, was sworn in as Federal Reserve Chair on May 23, 2026. The personal SOL ownership doesn’t directly affect monetary policy but signals broader institutional acceptance of crypto holdings at the highest levels of US financial leadership. The signaling effect is positive for the institutional adoption narrative.
The TVL question: Solana TVL at approximately $5.5 billion sits well below the August 2025 peak of $11.5B. However, SOL-denominated TVL actually hit all-time highs in Q1 2026, meaning users deployed more SOL even as dollar values dropped. The TVL decline reflects price impact more than user departure. Recovery requires either SOL price appreciation or fresh capital deployment.
The memecoin context: Solana’s fee burn has historically depended substantially on memecoin trading volume (POPCAT, BONK, WIF, and related ecosystem). Memecoin volume declined sharply in Q1 2026, reducing structural fee generation. Recovery requires either memecoin trend resurgence or alternative high-fee use cases.
What the price action signals structurally: Solana is in transition from the previous cycle’s memecoin-driven dynamics to the next phase that requires institutional-grade infrastructure (Alpenglow finality, Firedancer reliability) supporting institutional adoption (ETF flows, RWA tokenization). The current $90 price reflects partial recovery as catalysts emerge but maintains a discount versus 2024-2025 highs, reflecting uncertainty about execution.
The bull case: $350-$750 by 2030
The bull case for Solana requires successful execution across technical upgrades, institutional adoption, and broader market dynamics.
The Alpenglow deployment success: the upgrade ships on Q3 2026 schedule with full functionality. Transaction finality drops to ~150 milliseconds. Network achieves payment-network competitive performance. Institutional adoption accelerates as predictability concerns resolve. The upgrade unlocks use cases (real-time settlement, high-frequency trading, institutional payments) currently constrained by latency.
The Firedancer full rollout: complete Firedancer validator client launches on mainnet without major issues. Validator distribution achieves meaningful diversity between Agave and Firedancer clients. Network throughput scales to 1M+ TPS capability. Multi-client diversity removes single-client risk that has concerned institutional investors.
The ETF flow scaling: cumulative ETF inflows scale from current $1.12B to $5-10B+ by 2030. The growth reflects Solana achieving meaningful institutional allocation similar to how Ethereum achieved post-ETF approval. Standard Chartered’s $250 target for 2026 represents the bull case anchor. Weekly inflow sustainability above $30-50M historically correlates with multi-month uptrends.
The institutional RWA capture: Solana captures a meaningful share of real-world asset tokenization activity. The chain’s performance advantages position it for high-throughput institutional use cases (tokenized treasuries, money market funds, traditional finance products). The RWA tokenization growth (covered in your existing Tokenization piece) creates secular tailwind that Solana’s infrastructure could capture disproportionately.
The memecoin/DEX volume recovery: Solana’s fee burn mechanism benefits from high-velocity trading activity. Recovery of memecoin volume (POPCAT, BONK, WIF and successors) or alternative high-velocity use cases (prediction markets, sports betting, gaming) restores structural fee generation. The fee burn supports SOL price through reduced effective inflation.
The CLARITY Act benefits: the legislation’s deployment creates explicit non-security classification for SOL, removing residual regulatory uncertainty. The clarity expands custodian eligibility, institutional product offerings, and corporate treasury allocation possibilities. Solana benefits alongside Bitcoin and Ethereum from a cleaner regulatory framework.
The institutional Fed Chair signaling: Kevin Warsh’s SOL ownership and broader pro-crypto Fed leadership create a favorable monetary and regulatory environment for institutional crypto adoption. The signaling effect cascades through banking regulators, traditional finance, and corporate treasuries.
The competitive positioning: Solana holds its position as the leading high-performance Layer-1 versus Ethereum (broader institutional infrastructure but slower) and emerging high-performance alternatives (Sui, Aptos, Sei, others). The competitive moat from network effects, developer ecosystem, and institutional accumulation strengthens with each successful upgrade cycle.
If all bull case conditions materialize, the price targets are:
2026 year-end: $200-300
2027 year-end: $250-400
2028 year-end: $300-500
2029 year-end: $325-625
2030 year-end: $350-750
The wide range reflects substantial uncertainty about how aggressively institutional adoption scales and whether broader market dynamics support sustained altcoin appreciation. Standard Chartered’s $250 target for 2026 represents the cleaner consensus anchor for the bull case in the near term.
The base case: $150-$280 by 2030
The base case assumes successful upgrade deployment but moderate rather than big adoption growth.
The Alpenglow scenario: upgrade deploys successfully in Q3-Q4 2026 with full functionality but the institutional adoption boost is gradual rather than immediate. The technical capability improvement happens but the institutional capital that flows in represents continuation of existing patterns rather than acceleration.
The Firedancer scenario: full Firedancer deploys successfully but achieves moderate validator distribution rather than meaningful client diversity. The technical capability improvement happens but doesn’t change institutional perception of Solana’s decentralization.
The ETF flow scenario: cumulative inflows grow from $1.12B to $3-5B by end of 2026, scaling to $5-8B by 2030. The growth is meaningful but slower than the bull case trajectory. Institutional adoption follows the gradual pattern rather than rapid acceleration.
The TVL recovery: TVL recovers from current $5.5B levels to $8-12B range by 2030. The recovery reflects both SOL price appreciation and modest fresh capital deployment. The recovery doesn’t reach previous $11.5B peak in dollar terms but represents healthier ecosystem state.
The memecoin/DEX volume: memecoin activity returns to modest levels (substantially below 2024-2025 mania peaks but above current depressed levels). Alternative high-velocity use cases emerge in specific areas (prediction markets, gaming) without becoming dominant fee generators. Fee burn returns to moderate levels.
The competitive dynamics: Solana keeps position as leading high-performance Layer-1 but faces continued pressure from Ethereum institutional adoption and emerging chains. Market share stays roughly stable rather than expanding significantly.
The regulatory environment: CLARITY Act eventually passes providing modest tailwind. SEC approvals for additional crypto products provide gradual expansion. Institutional adoption barriers reduce but don’t disappear.
Base case targets:
2026 year-end: $110-180
2027 year-end: $130-220
2028 year-end: $140-240
2029 year-end: $145-260
2030 year-end: $150-280
The base case represents meaningful appreciation from current $90 levels but stays below previous cycle highs. The support comes from upgrade deployments and institutional accumulation without producing big price action.
The bear case: $60-$120 by 2030
The bear case requires either specific Solana setbacks or broader market headwinds disrupting the recovery thesis.
The Alpenglow deployment failure: upgrade encounters critical technical issues, gets delayed significantly beyond Q3 2026, or fails to achieve the targeted ~150ms finality. The institutional adoption thesis that depends on payment-network competitive performance fails to materialize.
The Firedancer deployment issues: full Firedancer encounters bugs causing forks, outages, or significant performance issues. The client diversity benefits don’t materialize. The network reliability concerns that constrained institutional adoption persist.
The ETF flow collapse: weekly inflows reverse to outflows. Bank of America trimming altcoin ETF exposure in Q1 2026 shows institutional caution. Continued institutional withdrawal removes the primary near-term price support. Cumulative ETF AUM declines from current $1.12B levels.
The TVL continued decline: TVL drops below $4 billion as DeFi activity continues migrating to Ethereum or other chains. The ecosystem health deterioration affects validator economics, developer activity, and broader adoption. Solana’s positioning as DeFi infrastructure weakens.
The memecoin failure: memecoin activity fails to recover. Alternative high-velocity use cases don’t emerge. Fee burn mechanism continues generating minimal SOL deflation. The value capture mechanism that supported previous cycle’s appreciation weakens persistently.
The competitive displacement: Ethereum’s institutional adoption captures the high-end use cases. Emerging high-performance chains (Sui, Aptos, Sei, others) capture specific developer segments. Solana’s positioning as leading high-performance Layer-1 erodes. Network effects weaken as developer attention shifts.
The regulatory setback: CLARITY Act stalls or fails. SEC reverses conditional approvals on spot SOL ETFs. International regulatory pressure (EU MiCA enforcement, specific jurisdictions) creates additional friction. Institutional adoption pathway closes.
The macro deterioration: broader crypto market weakness or recession dynamics disproportionately impact higher-beta altcoins including SOL. The risk-off rotation pulls capital from Solana to safer crypto allocations (Bitcoin) or traditional assets.
Bear case targets:
2026 year-end: $50-90
2027 year-end: $60-110
2028 year-end: $60-115
2029 year-end: $60-120
2030 year-end: $60-120
The bear case represents downside from current levels but assumes Solana retains meaningful ecosystem and institutional presence. Complete failure scenarios (price below $40) would require severe broader market disruption plus specific Solana setbacks.
The five variables that determine outcome
Five specific variables determine which scenario materializes.
Variable 1: Alpenglow mainnet deployment status and timing. The most important single near-term variable. Test cluster live since May 11, 2026. Mainnet projected Q3 2026. Successful deployment with ~150ms finality validates institutional adoption thesis. Delayed or failed deployment removes primary catalyst. Monitor: Solana Foundation announcements, test cluster performance data, validator readiness reports, and specific mainnet activation timeline.
Variable 2: Firedancer rollout progress. Currently, 207 validators live. Frankendancer hybrid at ~26% of staked SOL. Full Firedancer in pre-mainnet testing. Monitor: Firedancer validator counts,%age of stake on Firedancer vs Agave clients, network performance metrics during expanded Firedancer adoption, and specific milestone announcements from Jump Crypto.
Variable 3: Spot ETF flow trajectory. Cumulative $1.12B passed. Weekly $30-50M correlates with uptrend support. Monitor: weekly inflow/outflow data, specific institutional positions disclosed in 13F filings, ETF product expansion (additional issuers, derivatives products), and comparative flow patterns versus Bitcoin and Ethereum ETFs.
Variable 4: TVL and ecosystem activity metrics. Currently ~$5.5B (down from $11.5B peak). Monitor: TVL recovery trajectory, DeFi protocol activity, DEX volume, memecoin trading activity (POPCAT, BONK, WIF and successors), and fee revenue from network usage.
Variable 5: Institutional positioning and regulatory developments. CLARITY Act progress, SEC actions on additional SOL products, institutional 13F disclosures, corporate treasury allocations to SOL. Monitor: regulatory announcements, institutional product launches, traditional finance integration milestones, and specific regulatory clarity affecting Solana.
The variables interact significantly. Alpenglow success enables institutional adoption that drives ETF flows. Firedancer success addresses decentralization concerns, enabling broader institutional allocation. TVL recovery supports the ecosystem narrative that justifies institutional positioning. Regulatory clarity removes structural friction. Readers monitoring all five get the complete picture.
What this means for Solana holders and traders
For current SOL holders, the practical implication is the asset has the densest catalyst stack among major Layer-1 tokens for 2026 but faces meaningful execution and adoption risks. Monitoring the five variables provides a framework for evaluating whether the recovery thesis is materializing. The institutional accumulation through ETFs gives structural support that previous cycles lacked.
For potential SOL buyers, the practical implication is entry at current $90 levels reflects substantial discount versus previous cycle highs plus concentrated catalyst exposure. The risk-reward depends on assessment of Alpenglow/Firedancer execution and institutional adoption trajectory. The five variables provide objective signals to monitor.
For traders specifically, the practical implication is SOL has shown high beta to both crypto cycles and Solana-specific catalysts. The Q1 2026 collapse from $200+ to low $60s showed downside volatility. The May 2026 recovery to $90 showed catalyst-driven upside. Trading should consider both catalyst proximity and broader market dynamics.
For institutional investors evaluating SOL allocation, the practical implication is Solana offers higher-beta exposure to crypto adoption than Bitcoin or Ethereum. The technical capabilities (post-Alpenglow/Firedancer) position SOL for institutional use cases requiring high performance. The institutional infrastructure (ETFs, growing custody options) provides accessibility. The allocation depends on tolerance for higher-volatility crypto exposure.
For DeFi developers and ecosystem participants, the practical implication is Solana’s technical roadmap (Alpenglow finality, Firedancer throughput) creates substantially improved development environment for high-performance applications. The reduced TVL creates challenges but also opportunities for protocols that can capture market share during ecosystem rebuild.
The honest bottom line
Solana is between cycles. The memecoin engine that drove SOL from $20 to $260 has stopped working, TVL is down 56% from peak, and the price spent Q1 in the low $60s before clawing back to $90.
The next cycle, if there is one, has to come from somewhere different: Alpenglow getting finality to 150 milliseconds, Firedancer reaching 1M TPS, and ETF flows turning Solana into the kind of asset Goldman and Electric Capital want to hold rather than the kind retail wants to flip.
The catalyst stack is genuinely the densest among major Layer-1s: Alpenglow upgrade (Q3 2026 target), Firedancer full deployment (similar timeline), ETF accumulation (ongoing), institutional positioning (growing), and Federal Reserve Chair personal SOL ownership (signaling). Together they create multiple potential price catalysts in 2026.
The main risks are real and material: Alpenglow or Firedancer deployment delays could push catalyst timeline. ETF flows could plateau or reverse (Bank of America trimming shows institutional caution). TVL continued decline could weaken ecosystem narrative. Memecoin failure to recover removes structural fee generation. Competitive pressure from emerging chains and Ethereum institutional adoption.
The 2030 price range across scenarios is wide: $60-$750 depending on how the structural variables resolve. The base case ($150-$280) represents meaningful appreciation from current $90 levels assuming successful upgrade deployment plus moderate institutional adoption growth. The bull case ($350-$750) requires sustained execution across upgrade success, institutional adoption, and ecosystem recovery. The bear case ($60-$120) assumes execution failures or adverse market developments.
Solana is mid-cycle in a way that obscures what the next cycle looks like. Previous cycle’s memecoin-driven dynamics produced volatile boom-bust pattern. Next cycle’s institutional-driven dynamics depend on technical upgrades enabling sustainable institutional adoption. The transition is in progress but not complete.
The Alpenglow deployment is the most important catalyst variable. Q3 2026 mainnet activation with successful ~150ms finality would validate institutional adoption thesis. Delays or technical issues would extend the transition period.
The ETF flow sustainability is the most important institutional variable. Continued accumulation supports current price levels and enables higher targets. Plateau or reversal removes primary near-term support.
The TVL recovery is the most important ecosystem variable. Recovery toward $8-12B range supports the broader thesis. Continued decline below $4B threatens the ecosystem health narrative.
For 2026 specifically, expect SOL to continue elevated volatility around catalyst proximity. The $80-180 range represents the setup given current upgrade progress and institutional accumulation. The upside ($180-300) depends on successful Alpenglow deployment plus sustained ETF flows. The downside ($50-90) depends on deployment delays or institutional withdrawal.
For 2027-2030, the structural variables compound. Sustained execution across upgrades, institutional adoption, ecosystem recovery, and competitive positioning produces the bull case trajectory. Deterioration across variables produces the bear case. The base case assumes mixed outcomes producing meaningful appreciation.
The Solana story is ultimately about whether the technical capabilities and institutional positioning materialize into the sustained adoption that justifies premium valuation. The early evidence is mixed but trending positive. The catalysts are concrete. The execution is in progress.
The next 6-12 months will likely determine whether Solana achieves the institutional infrastructure status Bitcoin and Ethereum have achieved or remains a higher-beta speculative allocation.
Frequently Asked Questions
What is driving Solana’s May 2026 recovery?
SOL rallied from low $60s to $90 driven by: Alpenglow consensus upgrade live on test cluster May 11, Firedancer reaching 207 validators, cumulative spot ETF inflows passing $1.12B with weekly $39.3M streak, ~30 institutions disclosing $540M combined ETF exposure including Goldman Sachs and Electric Capital, and Federal Reserve Chair Kevin Warsh (a SOL holder) sworn in May 23.
Can Solana reach $500 by 2030?
$500 is within the bull case range ($350-$750 by 2030). Required conditions: Alpenglow successful deployment cutting finality to ~150ms, Firedancer reaching 1M+ TPS with broad validator adoption, sustained ETF inflows scaling to $5-10B+ cumulative, Solana capturing meaningful institutional RWA tokenization activity, memecoin/DEX volume recovery. The base case for 2030 is $150-$280.
What is Alpenglow and why does it matter for SOL price?
Alpenglow is Solana’s largest-ever consensus change, introducing a lightweight voting protocol called Votor that finalizes blocks with millisecond-level latency. Target finality is approximately 150-200 milliseconds, down from current 12.8 seconds. The upgrade enables Solana to compete with traditional payment networks on latency, unlocking institutional use cases that require near-instant settlement.
What is Firedancer and why does it matter?
Firedancer is Jump Crypto’s independent validator client, addressing Solana’s historical client diversity weakness. Currently 207 validators are running Firedancer or hybrid Frankendancer (representing ~26% of staked SOL). Full Firedancer targets 1M+ TPS capability. Multi-client diversity addresses fundamental network resilience concerns that institutional investors stressed.
Why did Solana TVL decline so significantly?
Solana TVL fell from August 2025 peak of $11.5 billion to approximately $5.5 billion currently (56% decline). The decline reflects price impact primarily, SOL-denominated TVL actually hit all-time highs in Q1 2026, meaning users are deploying more SOL even as dollar values dropped. The DeFi protocol activity stays relatively stable but dollar values declined with SOL price.
How do Solana ETFs compare to Bitcoin and Ethereum ETFs?
Spot Solana ETFs launched in late 2025 with five US-listed products. Cumulative inflows have passed $1.12 billion as of May 2026, with Bitwise and VanEck leading among issuers. This is meaningful but small compared to Bitcoin ETF cumulative inflows ($120B+) and Ethereum ETF flows. SOL ETFs represent second-tier institutional crypto allocation rather than primary allocation.
What are the main risks to Solana’s recovery?
Five primary risks: (1) Alpenglow deployment delays or technical issues, (2) Firedancer full rollout encountering bugs or failing to achieve client diversity, (3) ETF flow plateau or reversal as Bank of America’s altcoin ETF trimming shows institutional caution, (4) TVL continued decline below $4B threatening ecosystem health narrative, (5) memecoin volume failing to recover removing structural fee generation, (6) competitive pressure from Ethereum institutional adoption and emerging high-performance chains.
Should I buy Solana given the current setup?
This piece does not provide investment advice. SOL offers concentrated exposure to specific catalyst stack (Alpenglow, Firedancer, ETF flows, institutional positioning) with identifiable timelines. The risk-reward depends on assessment of upgrade execution and institutional adoption trajectory. Current $90 represents a substantial discount versus 2024-2025 highs but elevated levels versus February-March 2026 lows. The five variables framework provides objective monitoring signals.
This article is for informational purposes and does not constitute financial or investment advice. Cryptocurrency markets are highly volatile, and price predictions are inherently speculative. The figures and analysis described reflect data available as of late May 2026. Always do your own research and consult with qualified financial professionals before making investment decisions.
Disclosure: This article does not represent investment advice. The content and materials featured on this page are for educational purposes only.


🎧 Listen to Interview 💻 Watch Video MoneyGram does not need an introduction. The company moves money across roughly 200 countries and territories, some 20,000 corridors, and about 500,000 retail locations, and it has done so for more than 80 years. What has changed is where the plumbing runs…. Read the full story at The Defiant
On-chain analytics firm Glassnode said XRP holders continue to realize more losses than profits, as a key indicator dropped to its lowest level since August 2022. The decline points to intensifying selling pressure as more holders move coins at a loss.
According to the firm’s June 25 update, the 90-day simple moving average of XRP’s Realized Profit-to-Loss Ratio fell to 0.33 from 0.38 on June 9. The metric compares realized profits with realized losses from coins moved on-chain and helps measure the market’s overall profitability.
Realized Profit-to-Loss Ratio Signals Deepening Capitulation
A reading above 1 indicates that realized profits exceed realized losses, while a value below 1 shows that losses dominate. At the current level, the ratio implies that only 33 cents of profit is realized for every one dollar of realized losses.
Glassnode noted that the ratio reached about 50 during XRP’s 2025 market peak, reflecting a period when profit-taking significantly outweighed loss-making sales. The sharp decline since then points to a major shift in market conditions, with more holders exiting their positions at a loss.
Based on these readings, the analytics firm said the market is showing signs of intense capitulation among participants moving coins on-chain. It added that the continued weakness in the ratio suggests capitulation pressure has become more pronounced in recent weeks.
Transaction Fees Decline Alongside Holder Profitability
Separate data shared by the firm on June 9 also showed a steep reduction in activity on the XRP Ledger. The 90-day average of total transaction fees dropped from 5,900 XRP in February 2025 to about 500 XRP, representing a decline of roughly 91.5%.
Together, Glassnode’s charts suggest that weakening network activity has accompanied the deterioration in holder profitability. The realized profit-to-loss ratio climbed sharply during the 2025 rally before falling steadily through late 2025 and into 2026. Total transaction fees followed a similar downward path after the speculative peak.
The weak on-chain readings have prompted mixed interpretations among market participants. Some market participants on X said such low readings could indicate sellers are becoming exhausted. Others pointed to XRP remaining above the $1 level despite the weak profitability data.
The post XRP Selling Pressure Intensifies as Profit-to-Loss Ratio Reaches Multi-Year Low appeared first on CryptoPotato.
Key takeaways:
- SOL’s rebound to $72 shows bullish futures and airdrop hopes, but falling TVL and low DEX volumes point to fragile onchain demand.
- Tokenized stocks spark hype on Solana, yet Pump.fun dependence and Hyperliquid competition threaten sustained SOL momentum.
Solana native token SOL jumped to $72 on Friday, distancing itself from the $64 lows the prior day. Part of traders’ optimism stemmed from the stellar growth of tokenized stock trading, fueled by the AI sector. However, increasing competition in decentralized application networks could limit SOL’s short-term upside.

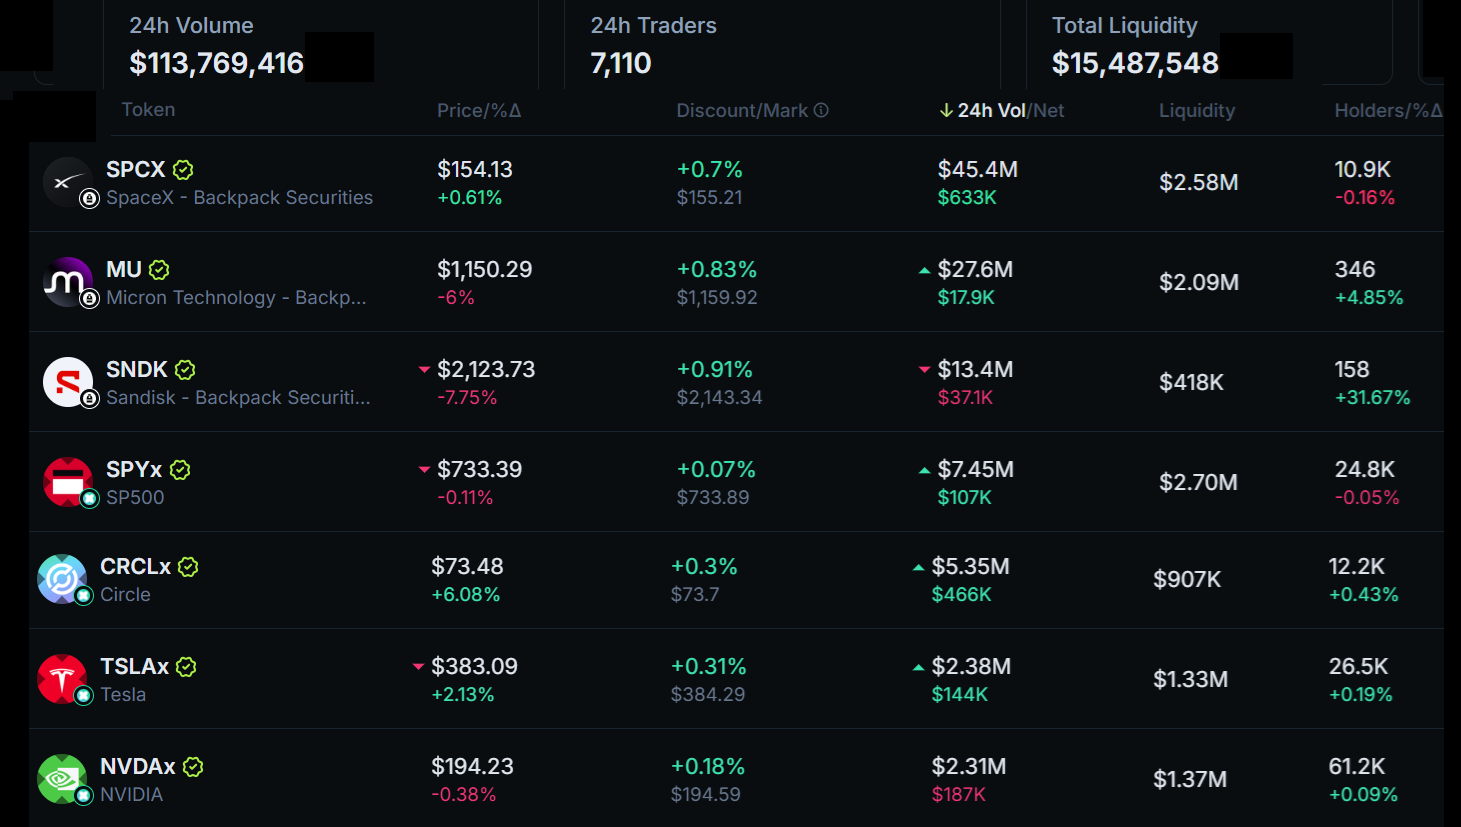
Solana tokenized stocks 24-hour volumes, USD. Source: Jupiter Aggregator
Tokenized stocks on Solana traded over $113 million in 24 hours, according to Jupiter Aggregator data. However, the relatively thin liquidity in the automated market-making pools raised concerns, especially as multiple issuers compete for similar products. Still, some of those tokens launched only recently, which might explain the low number of holders in most cases.
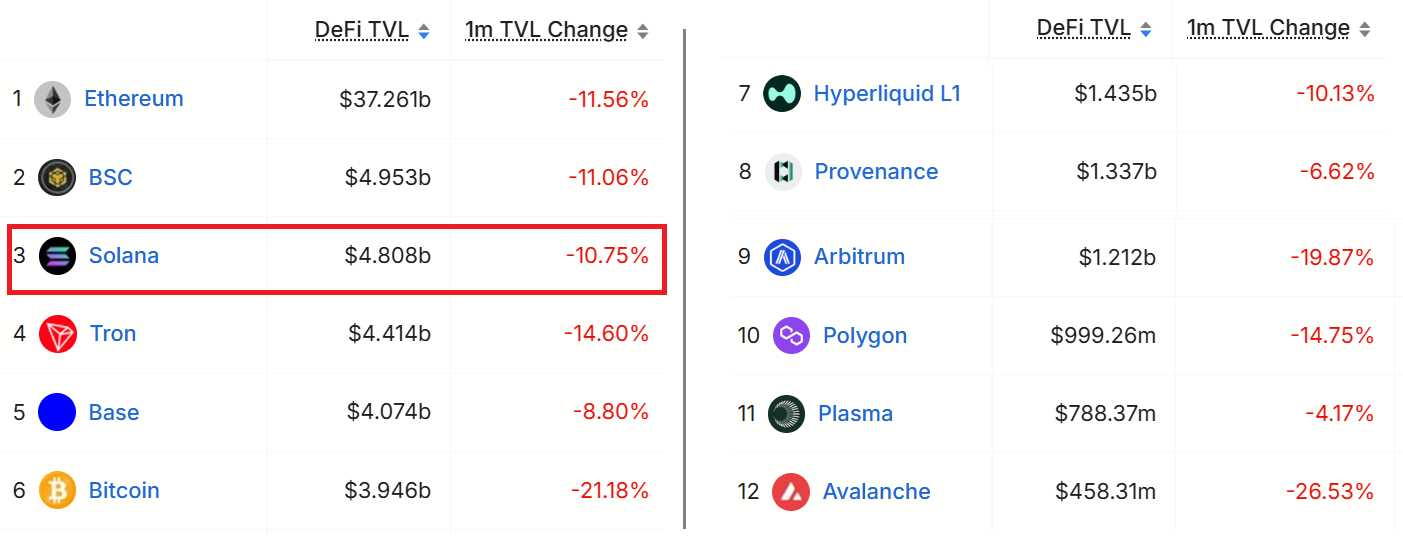
Blockchains ranked by DeFi Total Value Locked (TVL), USD. Source: DefiLlama
The Total Value Locked (TVL) on the Solana network dropped 11% over the past month, while the Ethereum layer-2 Base reduced the gap. Negative highlights on Solana TVL include a 19% decline in Kamino, a 20% trim by Binance Staked SOL, and a 17% decline in Raydium. The tokenization platform xStocks, on the other hand, posted 31% growth in TVL.
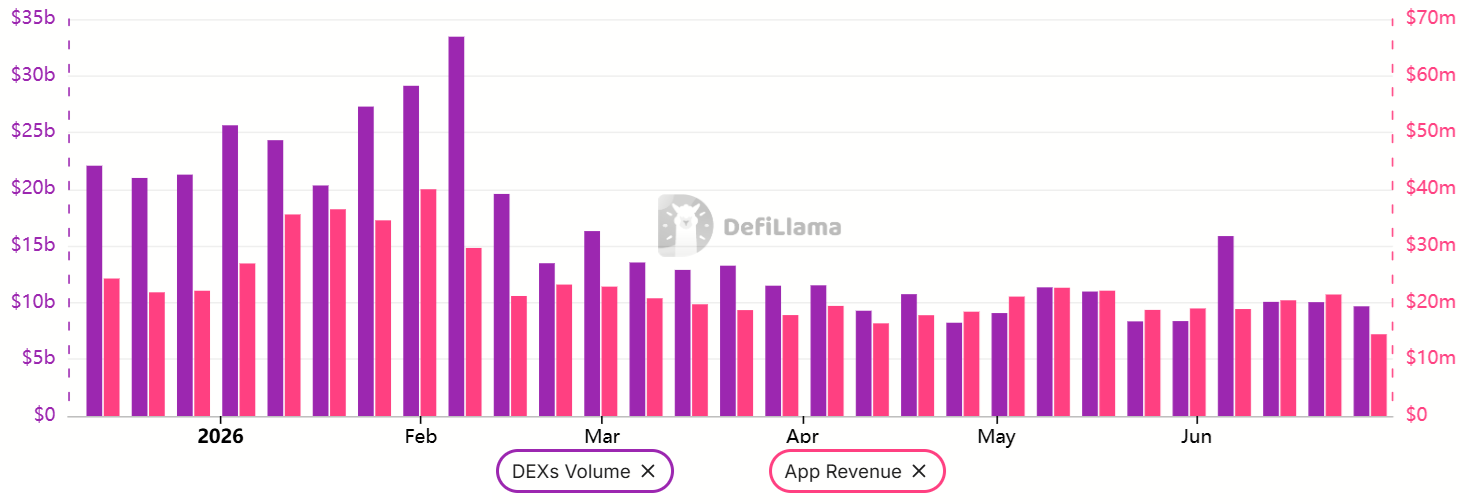
Solana weekly DEX volumes & DApps revenue, USD. Source: DefiLlama
Decentralized exchange (DEX) volumes on Solana fell to $10 billion per week from $30 billion in early February, coinciding with a downtrend in decentralized application (DApp) revenues. Thus, regardless of the successful launch of tokenized tech stocks and equity indexes, demand for SOL on blockchain processing remains subdued.
Solana’s dependence on Pump.fun and increased competition in tokenized launches
More concerningly, 30% of DApp revenue on Solana came from the token launch platform Pump.fun, which depends heavily on memecoin activity. A CoinGecko report revealed that 80% of the 18.7 million tokens launched in less than 48 hours, while 55% of the addresses involved lost up to $1,000 according to Dune data.
SOL perpetual futures annualized funding rate. Source: Laevitas
Demand for bullish leverage on SOL futures increased on Friday, pushing the funding rate to its highest level in June. The current 10% level is far from displaying excessive confidence, as the 6% to 12% range is typically deemed neutral. Still, the 14% gains since the $64 low on Thursday managed to reverse the bearishness marked by negative funding rates.
Related: Solana grabs 95% of tokenized equity as traders debate if SOL bottom is in
Part of SOL investors’ optimism stems from anticipation of airdrops on the network, although the timing of those tokens’ launch remains uncertain. Highlights include OnRe reinsurance with $200 million in TVL, Bulk perpetual DEX with an aggregate open interest of $325 million, and Loopscale lending platform at $79 million in TVL.
It might be premature to claim that SOL is bound to reclaim the $80 mark, last seen on June 1, given increased competition in tokenized stock trading from Hyperliquid and centralized exchanges on competing blockchains. OKX, for instance, formed a strategic partnership with the NYSE parent company using Ethereum-based systems.
This Friday, we examine Ethereum, Ripple, Cardano, Binance Coin, and Hyperliquid in greater detail.
Ethereum (ETH
This week, Ethereum crashed by 8% as most of the market turned red and key support levels were broken. For ETH, the price has settled at the $1,500 support, which appears to be holding at the time of this post. The current resistance is at $1,800.
The last time this cryptocurrency was at this price level was early 2025. Back then, ETH bounced there, triggering a sustained rally that set a new record price. However, it’s unlikely this will be repeated here.
Looking ahead, Ethereum shows a lot of weakness, and sellers may try to break below $1,500 and turn this level into a key resistance. If successful, then the next major support will be found around $1,000.

Ripple (XRP)
XRP fell by 9% this week and is inches away from losing the support at $1. This is a psychological level that will determine the price action of this cryptocurrency in the weeks and months to come.
If $1 turns into resistance, then the price will likely spend most of the year under this level, with the next key support found at 80 cents. Since sellers have the upper hand, it would take a miracle to stop them at $1.
Looking ahead, XRP is found at a critical junction. Considering the existing downtrend, a price under $1 is very likely as bears continue to dominate. Such a scenario would only prolong the bear market with lower lows.

Cardano (ADA)
This week, ADA closed 12% lower and lost its key support at $0.15. The price failed to hold there, and this level is now acting as a resistance. The last time the price was this low was late 2020.
The recent weakness displayed by Cardano is quite concerning since the downtrend has been accelerating and picking up speed, including in terms of sell volume. Nothing seems able to stop this.
Looking ahead, with buyers gone, the price will be forced to go lower until it finds them, most likely around 10 cents. Best to stay away from ADA until it finally forms a bottom. This appears quite a distance away right now.

Binance Coin (BNB)
Binance Coin remained bearish this week after it lost 2% of its valuation. While that is not significant, the bigger worry is the loss of support at $580, which is now acting as a resistance.
Buyers failed to reclaim that support level, and, being on the defensive, they have likely retreated to the next support at $500. Because of this, the BNB price may slowly grind lower towards that in the weeks to come.
Looking ahead, this cryptocurrency remains in a clear bearish trend with lower highs and lower lows, even if it moved sideways for almost six months in the first part of 2026. Best to be patient on BNB until it finds a bottom as well.

Hype (HYPE)
After a great performance for most of 2026, HYPE appears to struggle now, being unable to make higher highs. The price topped just under $76, and since then, a correction has started with key resistance levels at $76 and $66.
Because of this, the price closed the week 5% lower and also recently tested the support at $60. While that has held to date, it’s likely that the correction will push this cryptocurrency lower, or even to $52, which is the bottom of this ascending channel.
Looking ahead, as long as HYPE can stay above $52, buyers have the advantage. However, any price under $52 would turn the chart bearish and send this into a deeper and sharper correction.

The post Crypto Price Analysis Jun-26: ETH, XRP, ADA, BNB, and HYPE appeared first on CryptoPotato.
Crypto infrastructure company BitGo Holdings laid off about 15% of its staff on Thursday as its CEO pledged to focus the company on areas including trading, stablecoins and artificial intelligence.
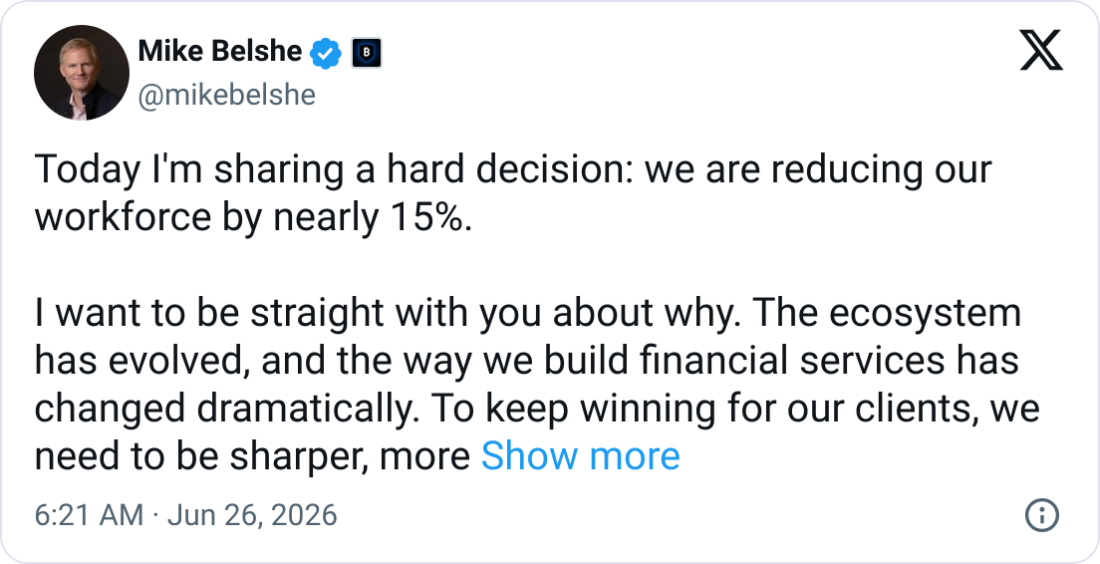
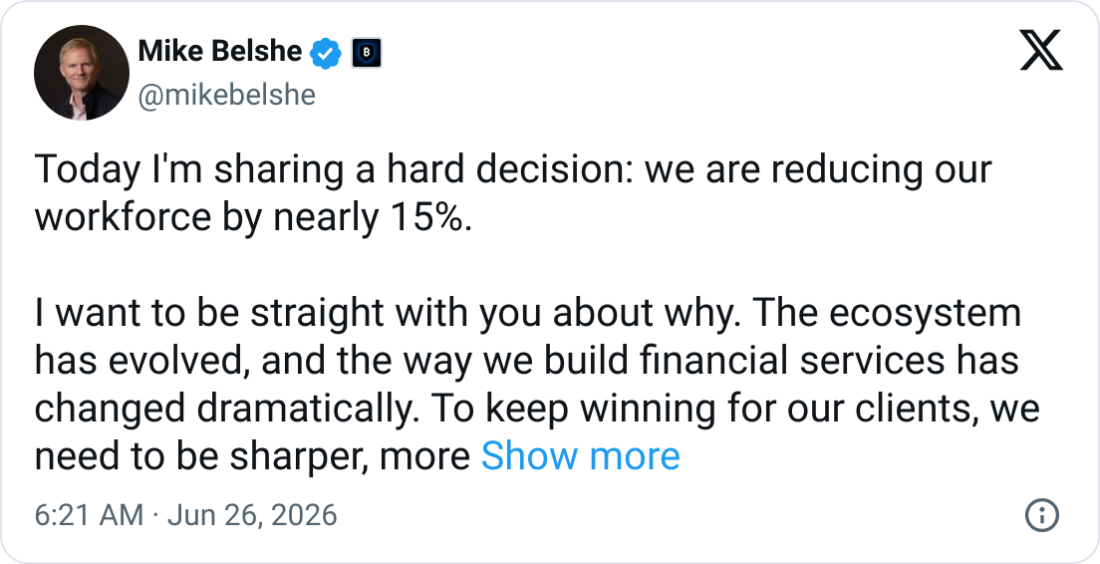
“Today I’m sharing a hard decision: we are reducing our workforce by nearly 15%,” BitGo co-founder and CEO Mike Belshe posted to X on Thursday. “The ecosystem has evolved, and the way we build financial services has changed dramatically.”
“We need to be sharper, more focused, and concentrate our people and energy on the areas that matter most: security, trading, stablecoins, settlement, and AI-powered infrastructure,” he added.
The layoffs add to the thousands of jobs lost in the crypto industry so far in 2026, with many companies citing efficiency gains from AI and a wide crypto market slump as the reason for the cuts.
Source: Mike Belshe
BitGo did not confirm the number of staff affected in the layoffs. Its 2025 annual report published in March disclosed it had 603 full-time employees as of Dec. 31, 2025, meaning the layoffs could have impacted about 90 staff.
Belshe said the layoffs were “a one-time action” and BitGo does not “anticipate further reductions.” The company is still hiring for 51 roles across various regions, according to its job board.
BitGo did not immediately respond to a request for comment.
Related: Blockworks acquires Messari in crypto data consolidation push
Shares in BitGo (BTGO) closed Thursday down 4.67% at $4.80, extending a nearly 73% slide from its public debut at $18 on Jan. 22.
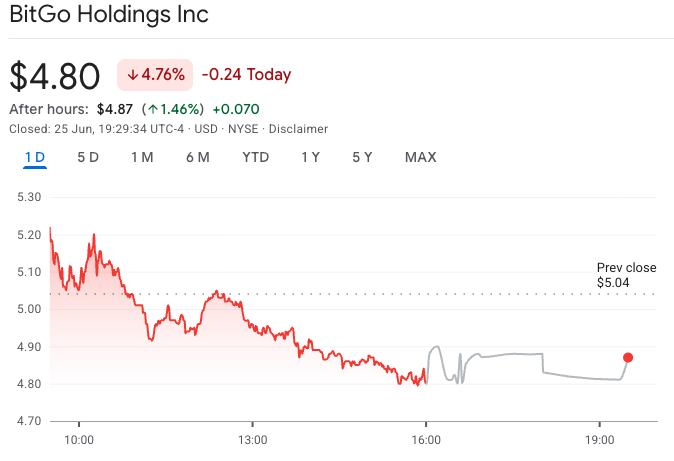
Shares in BitGo on Thursday slid more than 4.5% after the company announced it cut 15% of its staff. Source: Google Finance
Crypto companies have so far cut more than 5,000 jobs this year, with Block Inc. undertaking the biggest round of layoffs by cutting 4,000 staff or about half its workforce in February.
Robinhood cut 10% of its workforce on June 16, while in May, crypto exchange Kraken cut 150 staff, data company Dune cut 25% of its workforce and Coinbase cut 700 employees, or about 14% of its workforce.
Earlier this year, Gemini laid off 200 employees and Crypto.com also laid off about 180 staff, with both citing the rising use of AI.
So far this year, the wider US technology sector has seen over 121,500 layoffs from over 200 companies, according to Layoffs.fyi.
Magazine: Guide to the top and emerging global crypto hubs: Mid-2026

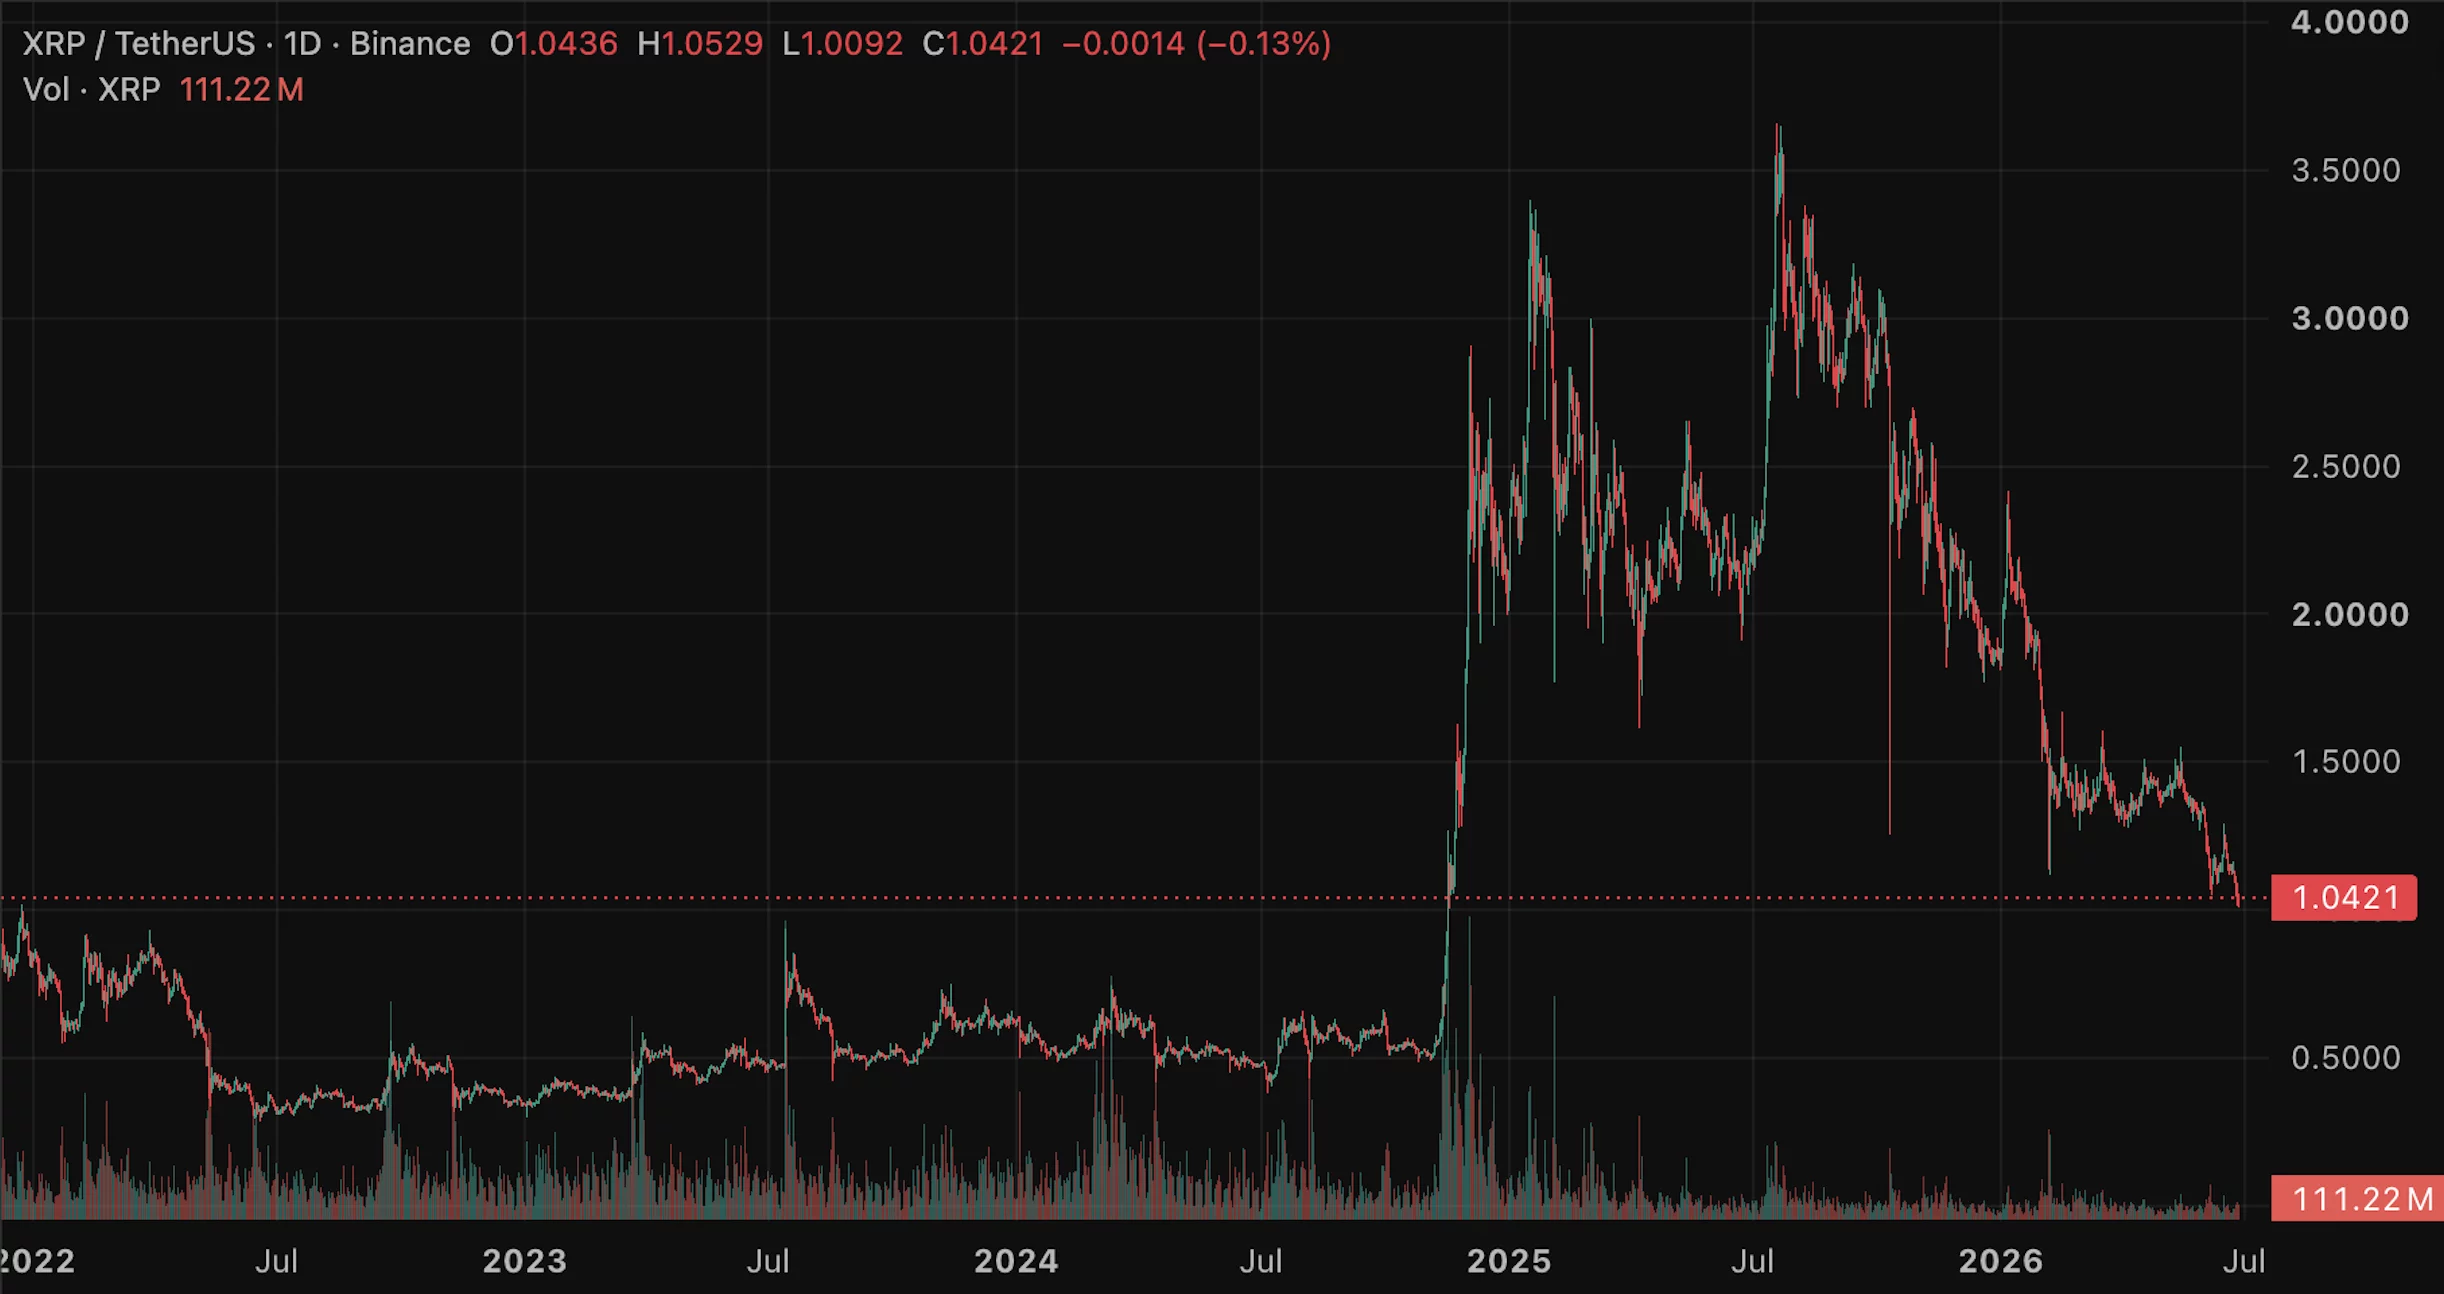
XRP has fallen to a 20-month low near $1.05, down more than 70% from its 2025 high, in a year-long downtrend. The $1 is the line that matters now. Below it, the charts point to $0.85 and then $0.70. Yet institutions keep buying the dip, and one Senate vote could change everything.
Summary
- XRP trades near $1.05, a 20-month low, down more than 70% from its $3.66 July 2025 high, in a clean year-long downtrend of lower highs and lower lows.
- The $1 psychological level is the line that matters; below it, technical support sits at $0.85 and then near $0.70, while overhead resistance begins at $1.12 and $1.27.
- A paradox defines XRP: seven spot ETFs have drawn roughly $1.4 billion in cumulative inflows, and whale wallets have hit record counts, accumulating even as the price falls.
- The CLARITY Act is the swing catalyst, with passage potentially codifying XRP’s commodity status and unlocking billions in projected ETF inflows, while failure would remove a key support.
- Whether XRP holds $1 or slides toward $0.70 depends on Bitcoin’s direction, the CLARITY Act vote, and whether the institutional accumulation outweighs the relentless downtrend.
XRP is trading near $1.05, a 20-month low, and the round number just beneath it has become the line that defines the entire debate about where the token goes next.
After reaching a high of $3.66 in July 2025, XRP has spent the better part of a year grinding steadily lower, carving out a textbook downtrend of lower highs and lower lows that has erased more than 70% of its value from the peak. The price now sits just above the psychological $1 level, and the question that matters for the rest of 2026 is simple to state and hard to answer: Can XRP hold the $1, or is it heading toward the next support levels at $0.85 and then $0.70 that the charts identify below it?
What makes the question genuinely interesting, rather than a one-way bearish story, is a striking contradiction running underneath the falling price. Even as XRP has bled lower, institutions have been buying it, with billions flowing into newly launched exchange-traded funds and large holders accumulating at a record pace, and a single piece of legislation working its way through the Senate could, if it passes, change the token’s trajectory overnight. This piece works through that tension to build an honest prediction.
The reason to frame XRP’s outlook around the $1 line and the contradiction beneath it is that those two things, the technical battle at a key level and the clash between a bearish chart and bullish accumulation, are what will actually decide the price.
A list of multi-year targets, the staple of most prediction pages, obscures more than it reveals, because XRP’s near-term path depends on whether the $1 holds, whether the institutional buying is the leading edge of a reversal or a value trap, and whether the regulatory catalyst lands.
What follows traces the year-long descent that brought XRP here, maps the levels that matter on both sides, examines the paradox of institutions buying into weakness, weighs the CLARITY Act as the swing factor, lays out the bear case for a slide toward $0.70, and translates all of it into concrete bull, base, and bear scenarios anchored to the $1 line.
A year of lower lows
To understand XRP’s predicament, you have to see the shape of its decline, because the chart tells a clear and sobering story. XRP reached its high of $3.66 in July 2025, a level that capped an enormous run and marked the peak of its enthusiasm. From there, the descent began, and it has been remarkably persistent: rather than a single crash followed by recovery, XRP has traced a clean series of lower highs and lower lows for almost a full year, the textbook signature of a sustained downtrend.
Each attempt to rally has been sold into, each bounce has failed at a lower level than the last, and the price has ground inexorably downward, trading below its key moving averages and giving back the vast majority of its gains. By June 2026, XRP had reached a 20-month low near $1.05, with technical analysts describing the chart as an asset still searching for a bottom rather than building toward a breakout.
The most recent leg lower came as the broader crypto market sold off, with Bitcoin crashing toward $60,000 and dragging the major altcoins down with it. XRP, like most large-cap tokens, remains highly correlated with Bitcoin during major market moves, so Bitcoin’s slide to a 20-month low of its own pulled XRP to its lows as well.
The result is a token down roughly 40% year-to-date and more than 70% from its 2025 peak, sitting in oversold territory but with no clear sign that the selling has exhausted itself. The year-long downtrend is the dominant fact of XRP’s chart, and any bullish case has to contend with the reality that, on price action alone, XRP has done nothing but fall for a year, which is exactly why the defense of the $1 level has become so important. It is the line where the year-long decline either pauses or accelerates.
The levels: $1.04, $1, and $0.70
The technical map around XRP is worth laying out precisely, because the levels define the battlefield for the rest of the year. The immediate line in the sand is the area around $1.04, which technical analysts have flagged as the key support holding up the current price, with the round $1 level just beneath it carrying additional psychological weight as a number that tends to attract both defensive buying and, if broken, fresh selling.
Below the $1, the chart identifies the next meaningful support near $0.85, and below that a more significant level near $0.70, with some bearish models pointing even lower toward the fifties in a deeper breakdown. These are the downside markers that matter: holding the $1 keeps XRP in its current range, while losing it opens the door to the $0.85 and $0.70 levels in succession.
On the upside, the resistance is just as clearly defined and just as important. The immediate ceiling sits in the area around $1.11-$1.12, the zone that has repeatedly capped rallies and turned them back, and reclaiming it decisively is the first thing bulls would need to see to suggest the downtrend is weakening.
Above that, heavier resistance waits at $1.27 and then at $1.60, where multiple rejections have piled up historically. The structure this creates is a token boxed between a $1.12 ceiling and a $1 floor, with the year-long downtrend pressing down from above and the psychological $1 level holding up from below.
The prediction, in technical terms, comes down to which of those gives way first: a break above a $1.12 would signal the downtrend may be ending, while a break below the $1 would signal it is accelerating toward $0.70. Everything else, the accumulation and the regulation, feeds into which way that break resolves.
The paradox: institutions buy as the price falls
Here is the contradiction that keeps XRP’s story from being a simple bearish chart, and it is genuinely striking. Even as XRP has fallen to 20-month lows, institutional and large-holder demand has been growing, not shrinking.
Seven spot XRP exchange-traded funds, launched over the prior months, have collectively drawn roughly $1.4 billion in cumulative inflows, holding over 800 million XRP, and crucially, those inflows have continued even during weeks when the price was falling and when larger cryptocurrencies were seeing outflows.
https://x.com/cryptodotnews/status/2066151671189623092
The funds have, in effect, been absorbing XRP into long-term institutional vehicles throughout the decline, a pattern of demand that runs directly counter to the bearish price action. On-chain data tells the same story, with the number of large holder wallets reaching record levels and tens of millions of XRP moving off exchanges, both classic signals of accumulation instead of distribution.
The interpretation of this paradox is the crux of the bull case. One reading is that sophisticated, long-term buyers see current prices as a value zone and are quietly accumulating ahead of catalysts they expect to materialize, in which case the falling price is a gift to patient institutions and the eventual reversal could be sharp once the selling pressure exhausts.
The other reading, the bearish one, is that the accumulation is premature, a value trap in which buyers are catching a falling knife while the downtrend has further to run, and that inflows into funds do not guarantee a price floor if broader selling overwhelms them.
Both readings are plausible, and the resolution depends on the same levels and catalysts discussed throughout. What the paradox does show is that XRP is not simply abandoned; there is real, persistent demand beneath the falling price, which is exactly why a catalyst that shifts sentiment could move it quickly. The accumulation is the loaded spring; the question is what releases it, and whether it releases up or snaps.
The CLARITY Act wild card
The single most important catalyst hanging over XRP is a piece of legislation, and understanding it is essential to any prediction, because it is close to a binary event with large consequences either way.
The CLARITY Act is a crypto market-structure bill that would, among other things, codify the classification of tokens like XRP as commodities under the jurisdiction of the commodities regulator, providing the legal certainty that has long been the gatekeeper for institutional capital.
For XRP specifically, which spent years under a regulatory cloud before its legal status was resolved, formal codification of commodity status would remove the last major source of regulatory uncertainty and, in the view of many analysts, open the floodgates for institutional allocation.
One prominent bank has projected that passage and the resulting clarity could drive several billion dollars of additional inflows into XRP exchange-traded funds, a demand shock that would dwarf current flows.
The catch is that the passage is truly uncertain. The bill has cleared key committee hurdles and reached the Senate calendar, but it faces a contested floor vote, a tight legislative calendar, and disputes that have nothing to do with XRP, and prediction markets have priced its chances at roughly a coin flip.
This makes the CLARITY Act a wild card in the truest sense: if it passes, XRP gains a powerful fundamental catalyst that could combine with the existing accumulation to drive a significant move higher, validating the institutional buying and likely breaking the $1.12 resistance. If it fails or stalls, a key pillar of the bullish case is removed, the accumulation looks more like a trap, and the downward pressure on the price intensifies.
Because the vote is expected to resolve within the year and the outcome is close to even, the CLARITY Act introduces a large, two-sided risk that sits at the center of XRP’s outlook, and any honest prediction has to treat it as the swing factor it is instead of assuming either outcome.
The bear case for $0.70
Fairness and honesty require giving the bearish case its full weight, because it is more than just the year-long downtrend, and it points concretely toward the $0.70 level. The foundation of the bear case is the chart itself: a token in a clean, year-long downtrend, below all its major moving averages, with every rally sold into, is an asset whose path of least resistance is down until proven otherwise, and the technical structure of this kind tends to persist longer than bulls expect.
If XRP loses the $1 level, there is little meaningful support until $0.85 and then $0.70, so a breakdown could move quickly through those levels, especially in a weak overall market.
Several fundamental forces reinforce the bearish technical picture. XRP’s high correlation with Bitcoin means that if Bitcoin continues lower toward or below $50,000, as some traders expect, XRP would likely be dragged down with it regardless of its own developments.
Ripple’s growing emphasis on its dollar stablecoin, which increasingly handles the cross-border settlement role XRP was meant to play, raises a structural question about the token’s core demand source, with the stablecoin arguably cannibalizing XRP’s primary use case.
The large amount of XRP held in escrow and released on a schedule adds a persistent overhang of new supply. Competition from other networks for the cross-border and tokenization business continues to pressure XRP’s long-term thesis. And if the CLARITY Act fails, the regulatory catalyst the bulls are counting on evaporates.
Stack these together: a bearish chart, Bitcoin risk, stablecoin cannibalization, supply overhang, competition, and regulatory uncertainty, and the case for a slide toward $0.70 is coherent and serious. It is not the only possible outcome, but it is a real one, and anyone weighing XRP should take it seriously instead of assuming the accumulation guarantees a floor.
The bull, base, and bear cases for 2026
Tying the scenarios to the $1 line, the accumulation, and the CLARITY Act makes them concrete. These are conditional ranges, not predictions, and each depends on which forces prevail.
- Bull case: XRP holds the $1 level, the CLARITY Act passes and codifies commodity status, the projected wave of institutional ETF inflows materializes, and the existing accumulation releases upward as the catalyst validates the patient buyers. XRP breaks the $1.12 and $1.27 resistance and recovers toward the $1.60 and beyond, with the most bullish bank targets pointing far higher over the year if inflows accelerate and Bitcoin stabilizes.
- Base case: XRP defends the $1 but cannot break decisively higher, chopping in a range between roughly $1 and $1.25 as continued ETF accumulation offsets the downtrend, and the market waits on the CLARITY Act vote and Bitcoin’s direction. In this scenario, XRP grinds sideways near current levels, with the eventual break deferred to the resolution of the catalysts later in the year.
- Bear case: XRP loses the $1 level, the CLARITY Act stalls or fails, Bitcoin drags the market lower, and the year-long downtrend reasserts itself. With little support beneath the $1, XRP slides toward $0.85 and then $0.70, with the accumulation revealed as premature and the bearish technical structure playing out toward the lower end of analyst ranges.
What to watch
For anyone tracking whether XRP holds $1 or heads toward $0.70, the analysis points to a focused watchlist, and the first item is the $1 level itself. Whether XRP defends the $1 and the $1.04 support beneath it, or breaks down through them, is the clearest single signal of which scenario is unfolding, because that level is where the year-long downtrend either pauses or accelerates. A reclaim of the $1.12 resistance above would be the bullish counterpart, suggesting the downtrend is weakening. Those two levels bracket the near-term decision.
The second item is the CLARITY Act vote, the swing catalyst whose roughly even odds make it the largest two-sided risk in XRP’s outlook. Passage would be a powerful bullish catalyst that could combine with the accumulation to drive a sharp move higher; failure would remove a key pillar of the bull case and intensify downward pressure. Watching the legislative calendar and the vote’s progress is essential.
The third item is the flow data, specifically whether the exchange-traded fund inflows and whale accumulation continue, which would support the value-zone interpretation, or whether they stall, which would suggest the buyers are reconsidering. The fourth is Bitcoin, given XRP’s high correlation; a stabilizing or recovering Bitcoin would relieve pressure on XRP, while a further Bitcoin decline would likely drag XRP down regardless of its own catalysts.
The honest synthesis is that XRP sits at a genuine crossroads, with persistent institutional demand and a powerful potential catalyst on one side and a relentless year-long downtrend and real structural risks on the other, balanced precisely at the $1 line. Watch the $1, watch the vote, watch the flows and Bitcoin, and resist the temptation to assume either the accumulation or the downtrend must win, because the outcome is truly unresolved.
Frequently Asked Questions
Why is the $1 level so important for XRP?
Because it is the psychological line where XRP’s year-long downtrend either pauses or accelerates. XRP currently trades just above it near $1.05, with technical support around $1.04. Round numbers like $1 tend to attract defensive buying when approached from above and trigger fresh selling if broken, so the $1 carries weight beyond its technical significance. Below it, the chart shows little meaningful support until $0.85 and then $0.70, which is why holding or losing $1 is the central near-term question for XRP’s price.
How far has XRP fallen?
XRP reached a high of $3.66 in July 2025 and has since traced a clean year-long downtrend of lower highs and lower lows, falling to a 20-month low near $1.05 by June 2026. That is a decline of more than 70% from the peak and roughly 40% year-to-date. The most recent leg lower came as Bitcoin crashed toward $60,000 and dragged the major altcoins down with it. Technical analysts describe the chart as an asset still searching for a bottom instead of building toward a breakout.
Why are institutions buying XRP if the price is falling?
That is the paradox at the heart of XRP’s story. Seven spot exchange-traded funds have drawn roughly $1.4 billion in cumulative inflows, continuing even as the price fell and even when larger cryptocurrencies saw outflows, and on-chain data shows record numbers of large-holder wallets and tens of millions of XRP moving off exchanges. One reading is that long-term buyers see current prices as a value zone and are accumulating ahead of catalysts; the bearish reading is that the buying is premature, a value trap while the downtrend continues. Both are plausible, and the catalysts will decide which is right.
What is the CLARITY Act and why does it matter for XRP?
The CLARITY Act is a crypto market-structure bill that would codify the classification of tokens like XRP as commodities, providing the legal certainty that gatekeeps institutional capital. For XRP, which spent years under a regulatory cloud, formal codification would remove the last major source of uncertainty, and one prominent bank has projected it could drive several billion dollars of additional ETF inflows. But the passage is uncertain, with a contested floor vote, a tight calendar, and prediction markets pricing roughly even odds. That makes it a two-sided wild card: passage is a powerful bullish catalyst, while failure removes a key pillar of the bull case.
Could XRP fall to $0.70?
It is a real possibility in the bear scenario. If XRP loses the $1 level, the chart shows little support until $0.85 and then $0.70, so a breakdown could move quickly. The bear case is reinforced by XRP’s high correlation with a falling Bitcoin, Ripple’s stablecoin increasingly handling the settlement role XRP was meant to play, the persistent supply released from escrow, competition, and the risk that the CLARITY Act fails. This is not the only outcome, and the bull case in which XRP holds $1 and recovers is equally coherent, but $0.70 is a serious downside risk instead of a remote one.
What would it take for XRP to recover?
The clearest bullish path runs through holding the $1 level, reclaiming the $1.12 resistance, and the CLARITY Act passing to codify commodity status and unlock the projected wave of institutional inflows. If that catalyst lands and combines with the existing accumulation, the patient institutional buying could be validated and release upward, driving XRP through its overhead resistance toward the $1.60 egion and beyond. A stabilizing Bitcoin would help by relieving the correlation-driven pressure. The recovery case is coherent and supported by real accumulation, but it depends heavily on the CLARITY Act vote and on Bitcoin, neither of which is yet resolved.
This article is information, not investment advice. The scenarios described are conditional ranges that depend on unresolved questions, not predictions, and XRP is highly volatile. Prices, flows, holdings, and the status of legislation reflect reporting available as of June 26, 2026, and can change quickly. Nothing here is a recommendation to buy or sell. Verify current data from primary sources and consider your own circumstances before making any decision.

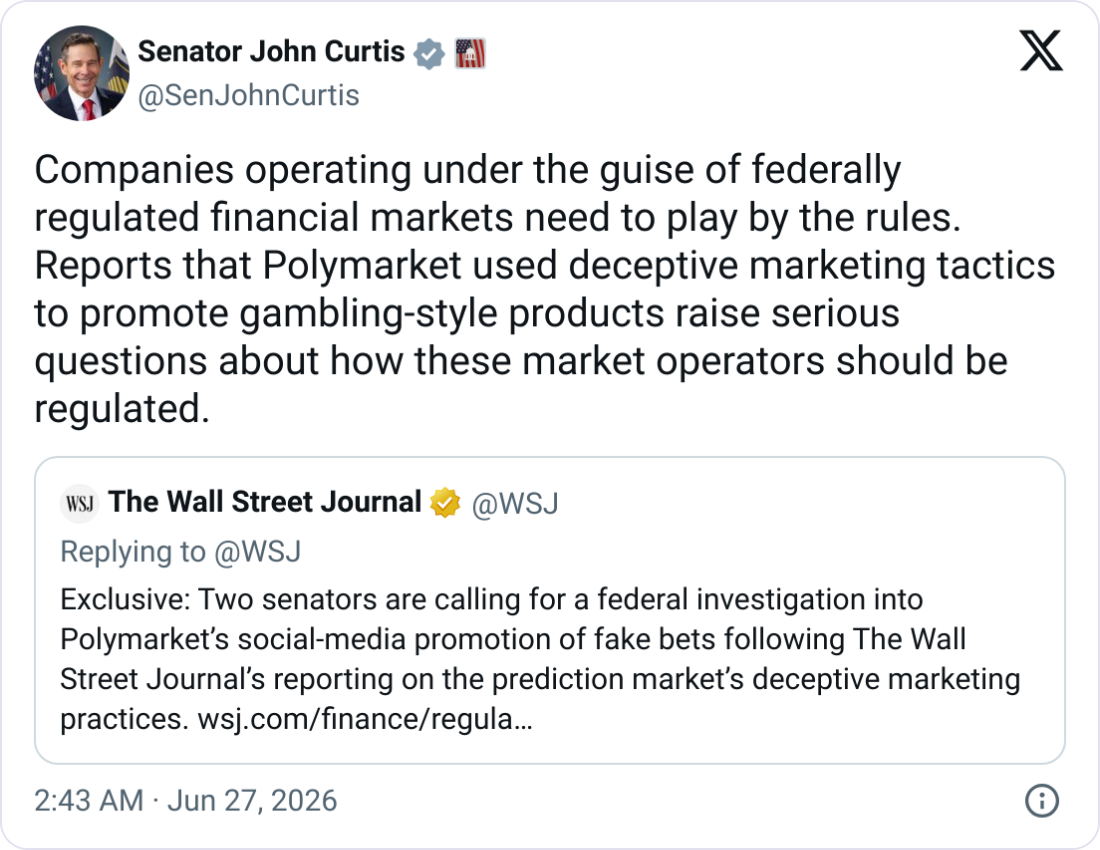
A bipartisan pair of US senators has called on the Commodity Futures Trading Commission to investigate the prediction market platform Polymarket after it reportedly paid social media influencers to make videos of fake bets.
Republican Senator John Curtis and Democratic Senator Adam Schiff sent a letter to CFTC Chair Mike Selig on Thursday, saying they were concerned Polymarket “used deceptive marketing tactics to promote gambling-style products to US audiences.”
“If accurate, these allegations are deeply troubling and demand immediate scrutiny from the Commodity Futures Trading Commission,” they wrote.
The letter comes after The Wall Street Journal reported on June 20 that Polymarket paid influencers to film fake trades on websites resembling its platform and that many creators didn’t disclose that Polymarket paid them.
The Journal said it reviewed over 1,100 videos and found that 70% featured fake bets amounting to nearly $2 million.
In response to the report, a Polymarket spokesperson told Cointelegraph earlier this week that it was “conducting a comprehensive audit of active promotional content to ensure it complies with our standards, as well as applicable regulatory and legal disclosure requirements.”
The letter also came ahead of reports in the Journal and CNBC on Friday that the CFTC was investigating Polymarket.
CNBC reported, citing a person familiar with the inquiry, that the CFTC has an ongoing and extensive investigation into Polymarket, but the timeline for when the investigation began was not shared.
Polymarket declined to comment on the letter or on the reported CFTC investigation.
Prediction markets have recently exploded in popularity and have seen billions of dollars in volume each month, with Senators Curtis and Schiff expressing their concerns about the CFTC’s ability to regulate the platforms.
Source: John Curtis
“The CFTC has repeatedly asserted regulatory authority over prediction markets and event contracts,” the senators wrote. “Yet with content creators routinely portraying prediction markets as ‘free money,’ there is little basis for treating them differently from gambling.”
“These contracts are not in the public interest and should not be treated as derivative products with hedging value,” they added. “We remain concerned that the Commission is neither enforcing the law appropriately, nor is equipped to serve as a federal gambling regulator.”
Related: US senators push to end CFTC ‘assault’ on state oversight of prediction markets
The CFTC has claimed it has authority over prediction markets as the platforms are registered with the agency and operate under federal commodities law.
The regulator has sued nine US states that have filed legal action against prediction markets to accuse the platforms of offering unlicensed sports betting via event contracts.
Senators Curtis and Schiff asked Selig to give written responses to a list of questions by July 10, which asked if the CFTC was investigating Polymarket, if the reported advertising was legal and if it has the resources to police prediction markets, among others.
Magazine: Should users be allowed to bet on war and death in prediction markets?
[PRESS RELEASE – Palo Alto, United States, June 26th, 2026]
Toss users can now contribute real-world data to train AI and get paid for it, in a first-of-its-kind model launching in Korea ahead of global expansion.
Poseidon, the data infrastructure built to source and license real-world data for AI, today announced a partnership with Toss, the mobile financial platform operated by Viva Republica, to let everyday users contribute to AI training and be paid for what they provide. It is Toss’s first move into AI data, and it opens that market to its roughly 30 million users.
Frontier AI has run out of internet to scrape. The next generation of models depends on real-world data, the kind that captures how people actually speak, move, and react, which does not exist on the open web and has never had a clean way to be sourced, licensed, or paid for. Poseidon is building the infrastructure to change that, and Toss brings the reach to do it at scale.
Through the partnership, Poseidon’s contributor app, Numo, launches inside the Toss app. Toss users can help build Korean-language training data across voice, image, and video, and receive payment tied directly to what they contribute. Poseidon provides the infrastructure that tracks each contribution and its value, while Toss provides the user base and the financial experience that turns participation into payment. Together they offer a working answer to a question the AI industry has struggled with, which is how to compensate the people whose data makes models better.
Every contribution made through Numo is registered on DATA, the AI data network that Poseidon refines data for. DATA gives each record a verifiable provenance trail through Trace, its public audit layer, so a buyer can see where a piece of training data came from and a contributor can see that their work was counted and paid. DATA Foundation, which launched this week from the rebrand of Story, is building this layer alongside integration partners including the human data marketplace Kled, and Poseidon is one of the largest sources of refined data flowing into it.

What Numo collects is first-person data, recorded by real people in real environments, which is among the hardest and most valuable categories to obtain. It is the raw material for physical intelligence, the AI that has to operate in the physical world across robotics, autonomous vehicles, and other applications. Demand from global AI labs for this kind of data is climbing, and Korea is positioned to supply it, with its dense real-life data and Toss’s user base. Poseidon and Toss intend to prove the model in Korea, then expand to global markets.
Changhoon Seo, Executive Director of New Business at Toss, said: “As the AI industry grows, demand for high-quality data is rising just as fast. Toss plans to build an environment where users can take part in the data economy more easily and naturally, and to expand a structure in which the value they contribute is rewarded transparently.”
SY Lee, Chief Strategy Officer and Chairman of Poseidon, said: “Korea is one of the few markets where the strategic importance of AI data, a mature financial system, and world-class mobile experience all exist at once. Toss is the right partner to turn user-contributed AI data from an early idea into a standard the rest of the world can adopt.” Lee previously founded the web-novel platform Radish and sold it to Kakao Entertainment, co-founded Story, the IP infrastructure that recently rebranded as DATA Foundation, and was named a Young Global Leader by the World Economic Forum this year.
About Poseidon
Poseidon is the data infrastructure for AI, built to source, refine, and license the real-world data that frontier models need and the open internet cannot supply. Incubated by the team behind The DATA Network, Poseidon bridges the gap between data supply and AI demand by enabling access to high-quality, IP-safe, and composable training datasets. Poseidon raised a $15 million seed round led by Andreessen Horowitz (a16z). Poseidon’s contributor app, Numo, has recorded more than 711,000 data registrations worldwide and is available and is now available on the Toss app.
The post Toss Brings 30 Million Users Into the AI Data Economy in Partnership With Poseidon appeared first on CryptoPotato.
Crypto World
NOWPayments Expands Its Ecosystem with Crypto Tax Readiness Toolkits for Global Businesses
[PRESS RELEASE – Amsterdam, Netherlands, June 26th, 2026]
As crypto adoption accelerates worldwide, accepting digital assets is becoming easier for businesses. Staying compliant across different jurisdictions, however, remains a major challenge.
To help address this, NOWPayments and KoinX co-created Crypto Tax Educational Assets – practical, jurisdiction-specific resources designed for businesses exploring or already accepting crypto. Free access available NOW!
Rather than theoretical research, the educational assets provide actionable guidance on tax and accounting considerations, reporting expectations, and key regulatory factors businesses should evaluate when working with crypto.
The company says the initiative is particularly relevant for merchants, platforms and global businesses operating across multiple regions where regulatory expectations can vary significantly.
“At KoinX Books, we’re focused on simplifying crypto accounting and financial compliance for businesses operating in the digital asset space,” said Punit Agarwal, Founder of KoinX. “Our collaboration with NOWPayments is another step toward building a more connected and efficient infrastructure for Web3 businesses globally. As crypto adoption grows across regions like Spain and Europe, businesses need financial systems that are transparent, scalable and audit-ready.”
The collaboration reflects a shared goal between NOWPayments and KoinX – making crypto adoption more operationally accessible for businesses.
NOWPayments says payments alone are no longer enough to support business adoption of crypto.
Successful participation in the digital asset economy increasingly requires operational confidence, educational support and infrastructure that helps businesses understand how to work with crypto responsibly across jurisdictions.
“We believe businesses need more than payment tools to succeed with crypto,” said Kate Lifshits, CEO of NOWPayments. “Our ecosystem is evolving to support businesses at multiple stages of their crypto journey – from payment acceptance to operational and compliance readiness. These assets are part of that broader mission.”
Businesses planning to accept cryptocurrency but uncertain about crypto compliance requirements in their target markets can access a free Crypto Tax Checklist for Spain, the EU, UAE, LATAM, and other key regions.
About NOWPayments
NOWPayments is a global crypto payment gateway that enables businesses to accept payments and send payouts in cryptocurrencies. The platform supports 350+ cryptocurrencies and 30+ stablecoins, while offering enterprise-ready tools such as invoices, payment widgets, subscriptions, payment buttons, donation tools, point-of-sale solutions, plug-ins, and fiat payment options. Businesses can also benefit from zero-fee payouts with settlement speeds of up to 1 second, helping streamline operations and scale crypto payments efficiently.
The post NOWPayments Expands Its Ecosystem with Crypto Tax Readiness Toolkits for Global Businesses appeared first on CryptoPotato.
Stablecoin infrastructure company StablecoinX has completed its merger with TLGY Acquisition Corp, a publicly traded special purpose acquisition company, allowing it to begin trading on Nasdaq on Friday.
StablecoinX is the first public stablecoin infrastructure company focused on supporting the Ethena ecosystem through decentralized verifier nodes and software infrastructure, and will trade under the symbol “USDE,” according to a statement on Thursday.
“We believe Ethena has emerged as one of the most important platforms powering the next generation of digital dollars,” said Edward Chen, CEO and Chairman of StablecoinX.
The Nasdaq debut is a big bet that stablecoins are becoming the plumbing of global finance, and comes despite a broader crypto bear market and Ethena’s relatively small 1.4% market share of the stablecoin market compared with those offered by its competitors, such as Tether and Circle.
Ethena’s USDe is a yield-bearing synthetic dollar-pegged stablecoin. Unlike USDt (USDT) or USDC (USDC), which are backed by actual dollars, USDe (USDE) maintains its $1 peg through a derivatives strategy.
It is backed by crypto collateral in Bitcoin and Ether and short futures positions on those same assets, enabling the long and short positions to cancel out the price volatility, helping to keep its value at approximately $1.
Ethena’s delta-neutral strategy works well in normal markets but is vulnerable during periods when futures funding rates go negative.
USDe supply falls
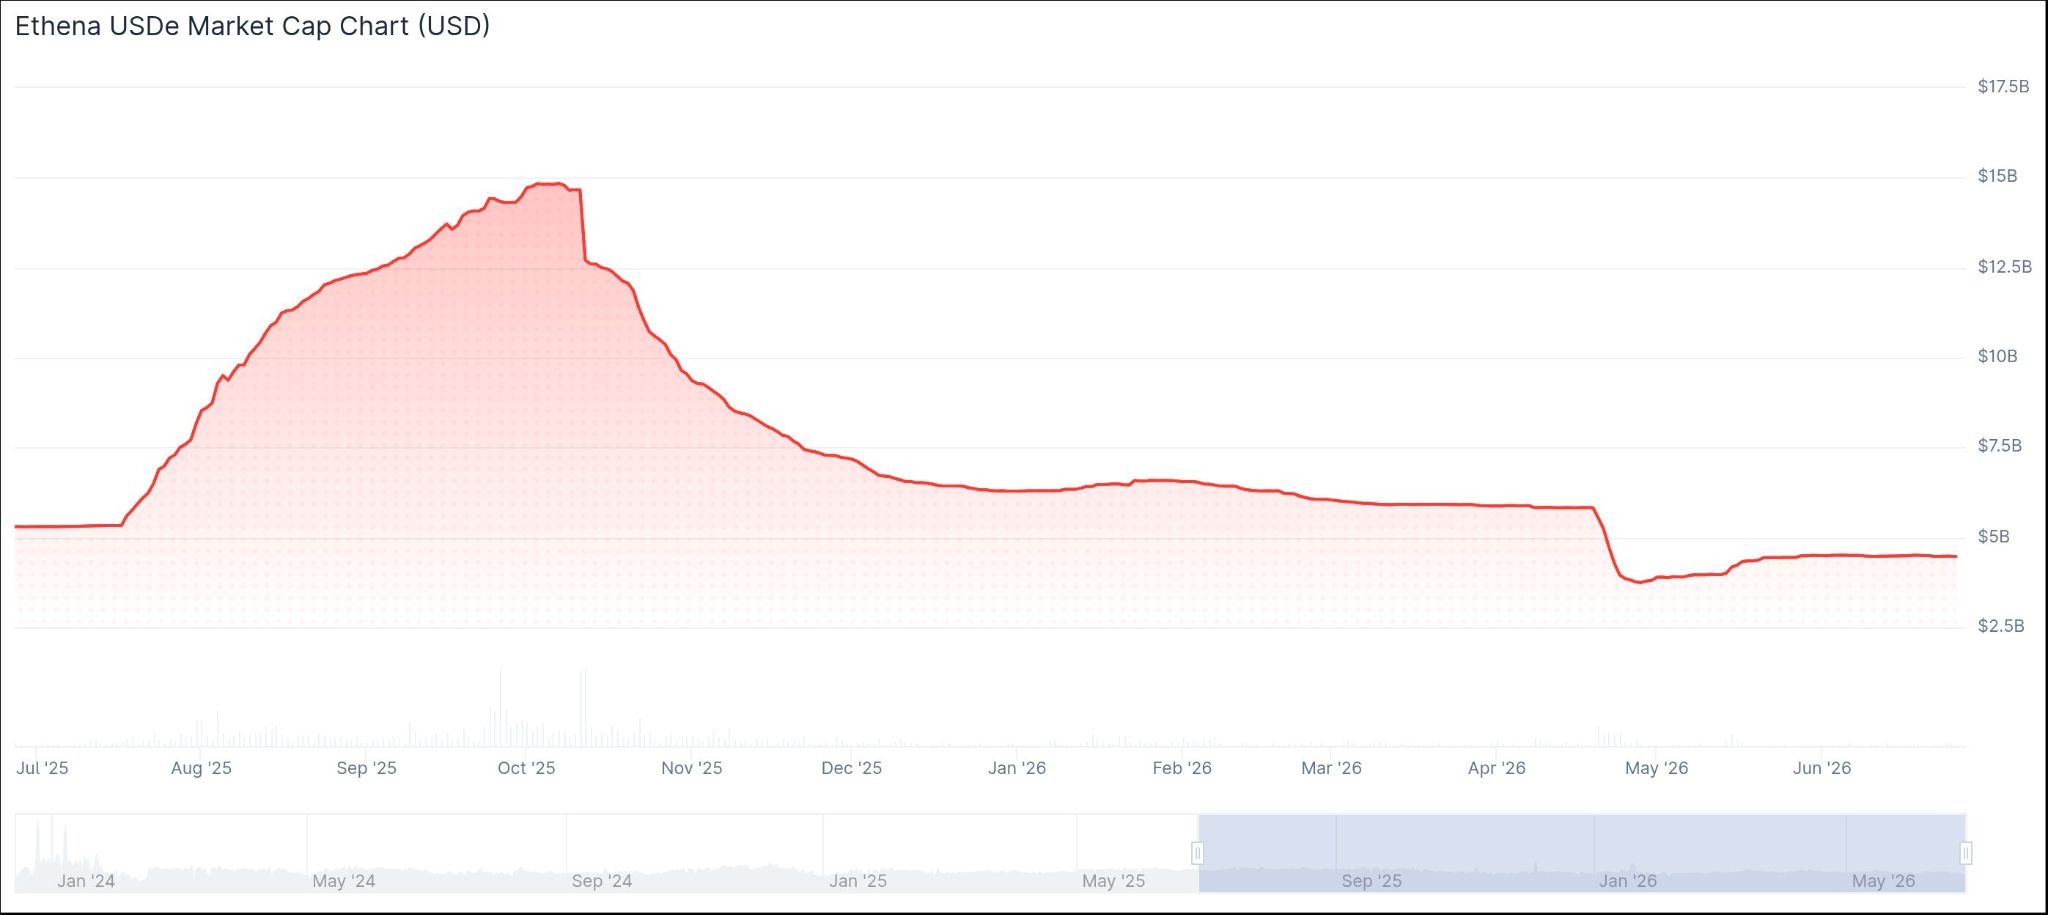
While stablecoin circulation has grown in recent years, USDe market capitalization has declined by 70% since its peak in October to around $4.5 billion today, ranking it sixth among stablecoins.

USDe supply has fallen since the bull market peak. Source: CoinGecko
StablecoinX’s treasury also holds approximately 3 billion Ethena governance tokens (ENA), or around 20% of the total supply, valued at approximately $275 million. The company announced a $360 million capital raise to purchase ENA on Sunday.
However, the asset is currently trading at $0.08, down 94% from its April 2024 all-time high.
Related: Yield-bearing stablecoins surge as Washington fights over yield
The company has three business lines: a decentralized verifier node (DVN) serving as a cross-chain message verifier for the Ethena ecosystem, a middleware software stack called “Stablecoin Harness” and distribution services, which are currently in development.
The company says the three businesses reinforce one another, though the broader crypto bear market presents a challenging backdrop for its Nasdaq debut.
Crypto SPACs and crypto treasuries have had a tough time this year as the broader market has tanked 52%, with $2.3 trillion leaving the space since October and crypto falling out of favor among investors.
Pre-merger TLGY fell 6.93% on Thursday on OTC markets to end the day trading at $9.40, according to Google Finance data.
Magazine: AI is banking the unbanked in Africa… faster than crypto
Donald Trump threatens 100% tariffs on European countries over digital services tax

MoneyGram CEO on rolling out MGUSD to its 60 million users, globally

BREAKING: WWE Signing Blockbuster New Star – May Be Involved With Roman Reigns Soon


![Get Money (feat. Junior M.A.F.I.A.) [2007 Remaster]](https://wordupnews.com/wp-content/uploads/2026/06/1782528327_maxresdefault-80x80.jpg)
-

 Entertainment6 days ago
Renter of Home in Anne Heche Crash Denies Settlement With Son
-
 Sports3 days ago
Two goals and an assist by sheer aura: Cristiano Ronaldo just entered the World Cup chat
-

 Tech5 days ago
Microsoft accidentally kills epic Outlook email threads
-

 Business6 days ago
Soccer-U.S. defends Iran World Cup travel restrictions, says discussions ongoing
-

 Fashion10 hours ago
Weekend Open Thread: Staud – Corporette.com
-

 Politics21 hours ago
The House | Manchesterism won’t survive the painful trade-offs unless it gets citizens on board
-

 Politics7 days ago
Andy Burnham and the meaning of Makerfield
-

 Politics1 day ago
Potential 2028er World Cup attendee leaderboard
-

 Tech1 day ago
A Look At A Gaggle Of Transputer Boards
-

 Business20 hours ago
Asia stock markets slide as tech shares slump
-
Crypto World3 days ago
Bitcoin (BTC) Dips Below $62K, Ethereum (ETH) Plunges 6% Daily: Market Watch
-

 Crypto World3 days ago
Securitize Wraps Roubini's SEC-Registered ETF as Dubai VARA Digital Security
-
 Crypto World1 day ago
Dell (DELL) Shares Tumble Over 5% Following Analyst Downgrade to Hold
-
Business3 days ago
Entergy settles forward sale agreements, raises $672 million in cash proceeds
-
 Crypto World7 days ago
Can Charles Hoskinson Really Rescue Cardano?
-
 Business7 days ago
Wall Street Week Ahead: Investors see Micron earnings as pulse check of AI rally momentum
-

 Sports7 hours ago
FIH Pro League: India defeat Pakistan 7-1, register biggest win of campaign | Other Sports News
-

 Crypto World10 hours ago
RTX holders must register wallets before token distribution begins
-
 Crypto World13 hours ago
Hyperliquid Named on Singapore MAS Investor Alert Register
-

 Crypto World7 days ago
Jake Chervinsky accuses CME of protecting derivatives monopoly
You must be logged in to post a comment Login