

Crypto World
S&P, Nasdaq hit records as BTC stalls at $75,000, 40% off October peak
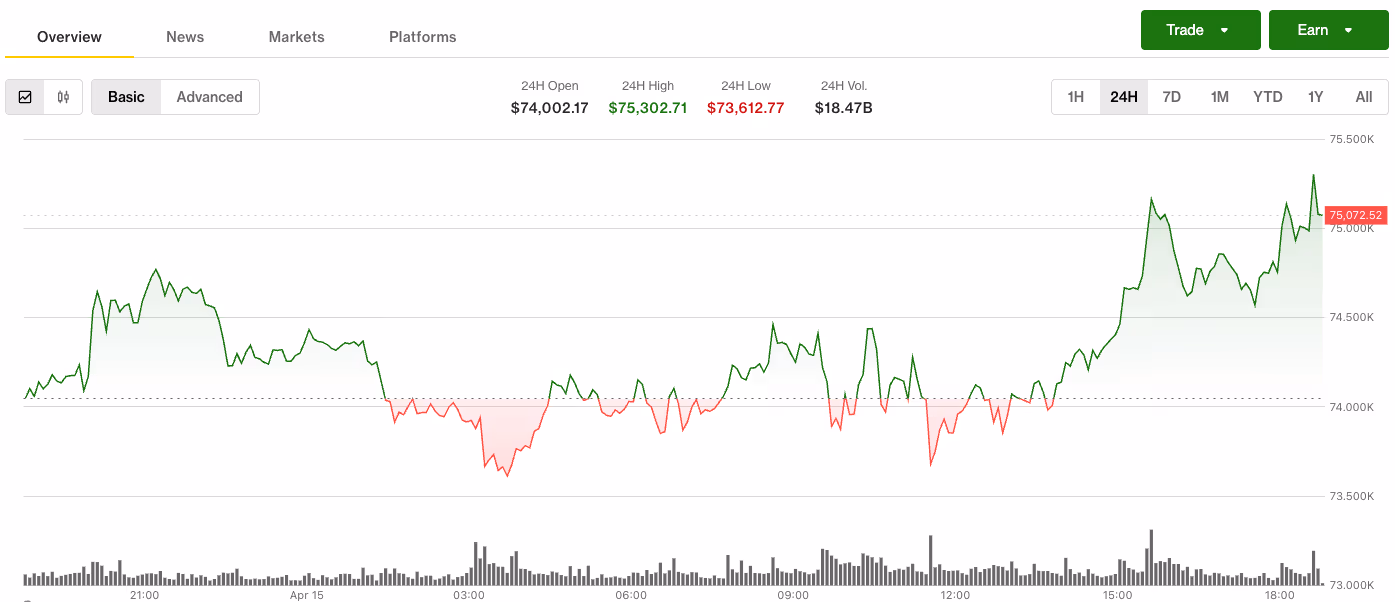
The tone in bitcoin has been more positive of late, but the rally from the February lows has been rather meek, with any attempts to return to $80,000 quickly getting shot down.
U.S. stocks, though, continue their remarkable run in the face of the Iran war, with the Nasdaq gaining 1.6% for its 11th consecutive daily advance and closing at a new record high above 24,000. The S&P 500 added 0.8% and also touched a new record above 7,000.
Bitcoin made another push to break above $75,000 on Wednesday, but the move stalled once again at a threshold that has repeatedly capped gains in recent months.

Trading recently around $75,134, bitcoin was higher by 1.45% over the past 24 hours, according to CoinDesk data.
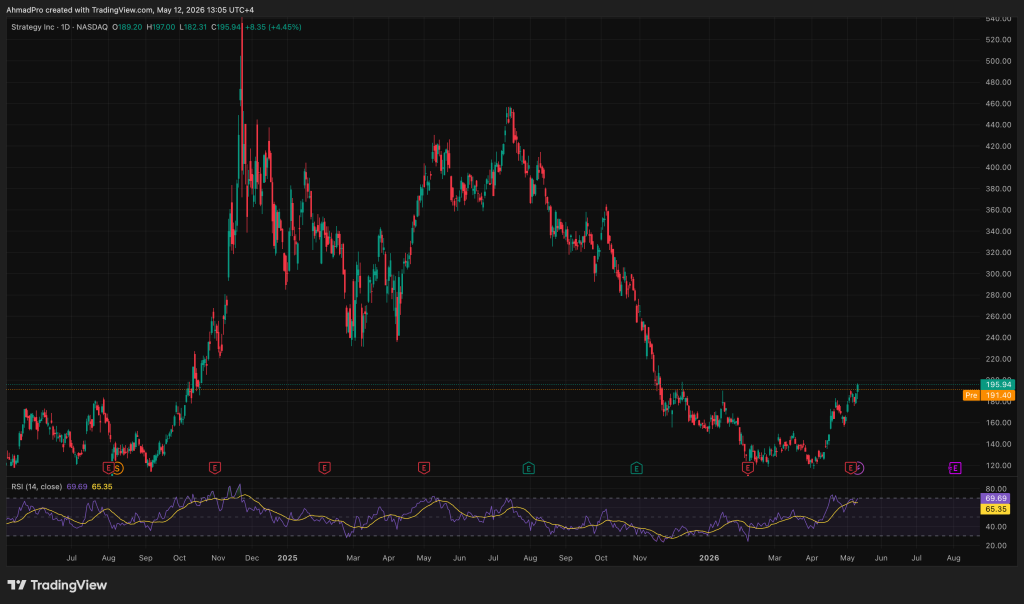
Crypto-linked stocks moved higher alongside the broader risk-on tone. Coinbase (COIN) rose 6.2%, Robinhood (HOOD) jumped more than 10%, and bitcoin treasury firm Strategy (MSTR) gained 4.4%.
While equities have fully recovered and pushed into new highs, bitcoin is still playing catch-up after its sharp February drop to $60,000.
“Since yesterday we’ve rejected from the top end of this two-month range,” said Jasper de Maere, trader at Wintermute. “It feels like the flow picture, which looked encouraging yesterday, is already being questioned.”
For now, he pointed to $72,000 as the key level to watch. Holding above it would keep the breakout narrative intact, allowing for further attempts at the range highs.
A break lower, however, could see bitcoin slip back into consolidation as volatility compresses, he added.


Fundamental Background
The key event for XRP in May remains the fate of the CLARITY Act, which is expected to establish XRP’s status as a digital commodity at the federal level. According to CoinMarketCap, the Senate Banking Committee has scheduled consideration of the bill for 14 May 2026. According to estimates by 24/7 Wall St., if the vote does not take place before the start of the May recess on 21 May, consideration of the bill could be delayed. Against this backdrop, institutional interest remains steady: according to SoSoValue, net inflows into spot XRP ETFs totalled $34.21 million during the first ten days of May.
Technical Picture
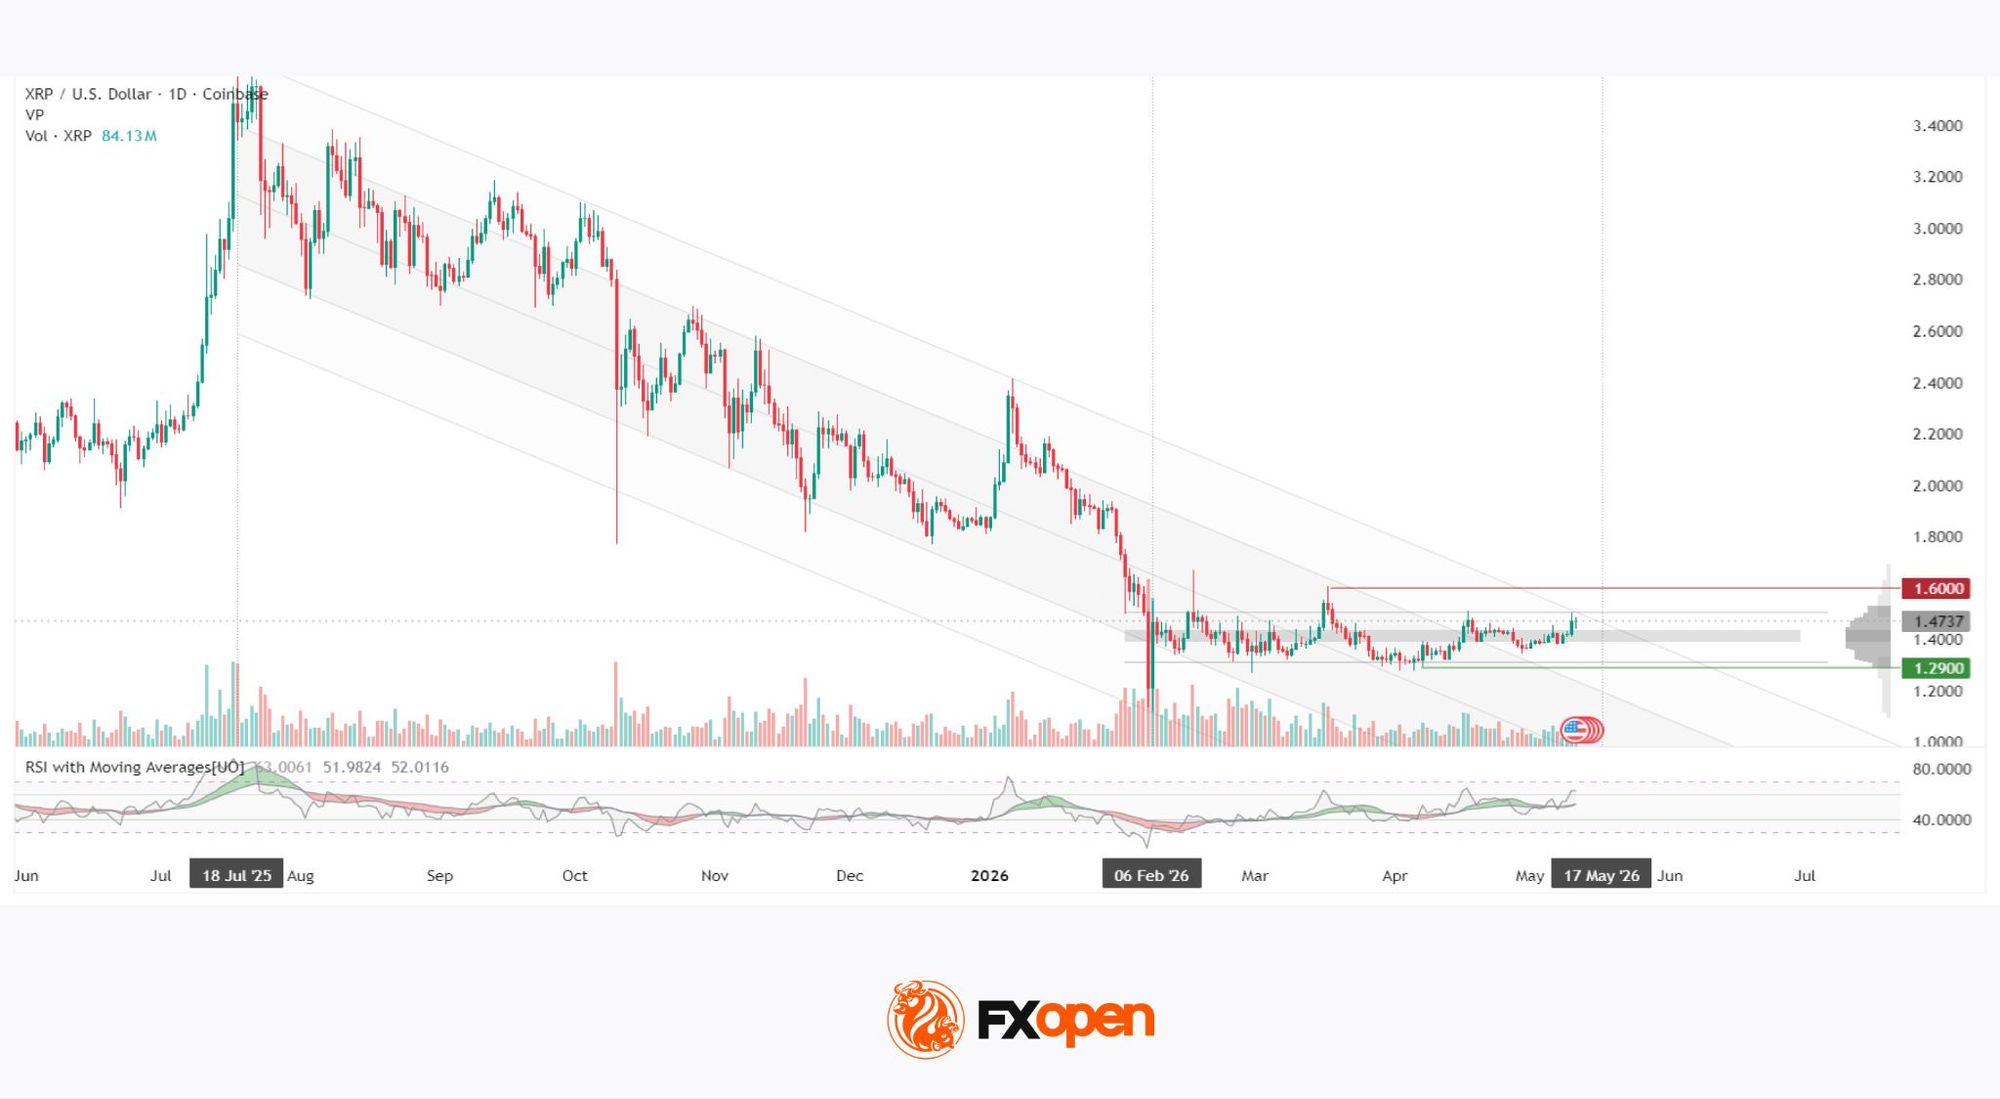
Since July 2025, XRP has formed a descending channel from the peak near $3.6. The move culminated in accelerated selling pressure in early February 2026, with the price falling towards the $1.12 area, after which the asset entered a sideways consolidation phase. The horizontal volume profile formed during this period covers the range between the lower boundary at $1.30 and the upper boundary at $1.50. The point of control (POC) is located between $1.39 and $1.44.
The price is currently trading above the POC zone but below the upper boundary of the profile and is preparing to test the channel boundary. The POC area acts as the nearest support zone during pullbacks. The key support and resistance levels within the horizontal volume range are $1.29 and $1.60 respectively. The RSI + MAs indicator shows readings of 62, 51 and 51 — the main indicator line remains in positive territory and noticeably above the moving averages, indicating continued buyer interest, although the averages themselves remain neutral.
Key Takeaways
In the short term, the direction of XRP/USD will largely depend on regulatory developments in the coming weeks: consideration of the CLARITY Act in the coming days could become the catalyst for a breakout from the current range in either direction. The volume profile and the $1.29 level form the lower support zone, while $1.60 remains the nearest resistance above the current market profile range.
FXOpen offers the world’s most popular cryptocurrency CFDs*, including Bitcoin and Ethereum. Floating spreads, 1:2 leverage — at your service (additional fees may apply). Open your trading account now or learn more about crypto CFD trading with FXOpen.
*Important: At FXOpen UK, Cryptocurrency trading via CFDs is only available to our Professional clients. They are not available for trading by Retail clients. To find out more information about how this may affect you, please get in touch with our team.
This article represents the opinion of the Companies operating under the FXOpen brand only. It is not to be construed as an offer, solicitation, or recommendation with respect to products and services provided by the Companies operating under the FXOpen brand, nor is it to be considered financial advice.


Artificial intelligence (AI) has become both the most effective weapon and the strongest shield in cryptocurrency fraud.
The cost of running a crypto scam keeps tumbling as AI accelerates the trend. However, exchanges are turning to the same technology to strengthen their defenses.
Inside the AI vs AI Arms Race Reshaping Crypto Security
Binance Research recently highlighted that AI tools exploit smart contracts about twice as efficiently as they detect vulnerabilities. Attacks cost as little as $1.22 per contract, down 22% month-on-month, with advanced models succeeding 72.2% of the time.
“The barrier to entry for scam perpetrators is falling fast, with AI accelerating the drop. What once required technical expertise can now be executed for next to nothing and at scale,” Binance noted.
Follow us on X to get the latest news as it happens
The problem extends beyond code. Chainalysis reports that scammers are using deepfakes, face-swap tools, and language models to power romance and investment scams.
Notably, AI-driven operations earn an average of $3.2 million each, roughly 4.5 times as much as traditional crypto scams.
“Today, 76% of AI-driven scams fall within the highest quartile for both scale and severity, and in 2025 alone, crypto-related fraud reached $17 billion – a 30% year-on-year increase. Without a proportionate response, the impact is likely to worsen,” the blog added.
Binance Builds an AI-Powered Counter-Offensive
Nonetheless, crypto platforms are pushing back with their own AI deployments. Binance said that it has rolled out over 100 AI models and 24 dedicated initiatives.
In the first quarter of 2026, the exchange stopped 22.9 million scam attempts, safeguarding roughly $1.98 billion in user funds.
“Cumulatively, $10.53 billion in user losses were prevented from the beginning of 2025 through Q1 2026 for more than 5.4 million users. We also blacklisted over 36,000 malicious addresses and issued more than 9,600 real-time warnings daily to help users stay ahead of emerging threats,” it added.
The exchange also disclosed that AI-driven decisioning now handles 57% of fraud controls, helping cut card fraud rates by 60% to 70% relative to industry benchmarks.
AI cuts both ways. It can be turned into a weapon by bad actors, but it can also harden the systems they target. The winners in this arms race will be whoever scales the technology fastest.
Subscribe to our YouTube channel to watch leaders and journalists provide expert insights
The post AI Is Now Both the Weapon and the Shield in Crypto’s Fraud War appeared first on BeInCrypto.
Crypto World
NBA Star’s Bitcoin Venture Just Paused Its Accumulation Plan: Is Corporate Treasury Model Breaking Down?

Bitcoin Society, the investment vehicle backed by former NBA star Tony Parker and entrepreneur Éric Larchevêque, has halted its Bitcoin treasury accumulation program after BTC dropped more than 20% in Q1 2026, with Larchevêque citing market conditions that had turned structurally unfavorable for raising capital to buy BTC reserves.
The decision marks a direct departure from the MicroStrategy accumulation model, aggressive balance-sheet Bitcoin loading regardless of price, that Bitcoin Society had been following since entering the market in late 2024.
The pause is described as a strategic hold rather than a liquidation of existing holdings, but the distinction matters less than what the decision signals: a high-profile corporate adopter has decided the current BTC price environment does not justify the capital-raising mechanics the treasury model depends on.

Whether that is a one-firm reassessment or an early indicator of broader corporate treasury cooling is the question the market now has to answer.
Discover: The best pre-launch token sales
The Treasury Arbitrage That Powered the Model Has Eroded, and Bitcoin Society’s Pause Reflects That
The MicroStrategy model worked because of a specific structural arbitrage: companies could raise capital at elevated equity valuations, then deploy those proceeds into Bitcoin trading at a price below what treasury advocates argued was its intrinsic asset value.
That premium-to-NAV gap created a flywheel; higher stock multiples meant a cheaper cost of capital, which meant more BTC per dollar raised, which supported the equity premium further. The mechanism was self-reinforcing until it wasn’t.
By late 2025, MicroStrategy’s own stock had declined 51% year-over-year, and the company was compelled to raise $1.44 billion in additional liquidity to address debt-service concerns in what analysts called a low-premium environment.
The arbitrage advantage that made the treasury model compelling had evaporated.
Standard Chartered’s analysis estimated that with Bitcoin trading below $90,000, approximately 50% of Bitcoin treasury companies would face viability challenges, a threshold Bitcoin Society Q1 2026 decision appears to have been stress-tested against.
Larchevêque’s explanation was precise: “Market conditions have turned against the objective of raising capital to accumulate Bitcoin reserves.”
That framing is not a rejection of Bitcoin as an asset. It is a rejection of the financing mechanism, and that distinction is analytically important.
The Bitcoin treasury thesis and the treasury company financing model are not the same thing, and Bitcoin Society pause reflects a failure of the latter, not necessarily a conviction change on the former.
The pause is not accompanied by publicly stated conditions for resumption, which leaves the program’s future contingent on whether equity market conditions recover enough to make the capital-raise economics viable again.
Discover: The best crypto to diversify your portfolio with
The post NBA Star’s Bitcoin Venture Just Paused Its Accumulation Plan: Is Corporate Treasury Model Breaking Down? appeared first on Cryptonews.

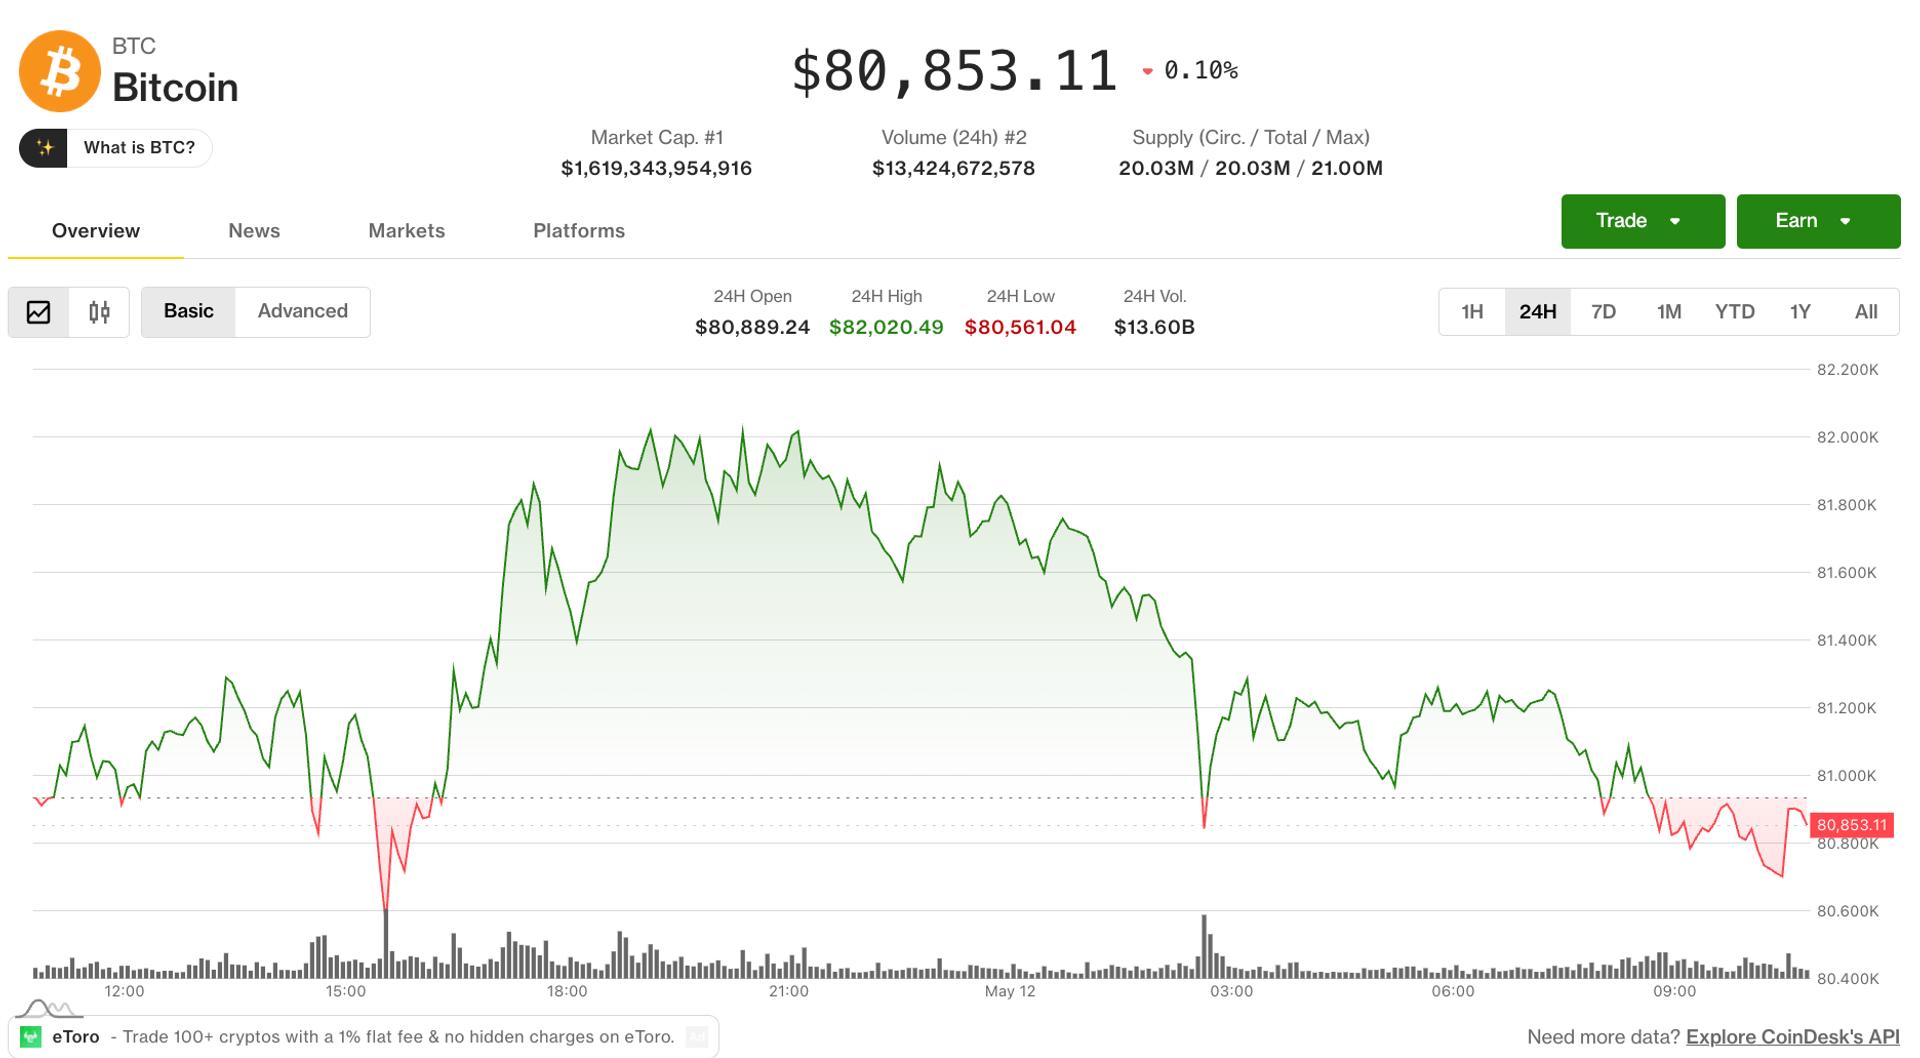
The broader crypto market ticked lower on Tuesday with bitcoin falling 1% since midnight UTC to $80,800 and ether (ETH) losing 2% to $2,290.
U.S. equity futures also dropped after U.S. President Donald Trump said the ceasefire with Iran was “on massive life support,” leading to a spike in Brent crude oil to $107 per barrel and a 0.4% rise in the U.S Dollar Index (DXY).
Bitcoin, however, remains above Bitmine (BMNR) Chairman Tom Lee’s line in the sand at $76,000, which he said would confirm the end of a bull market if bitcoin can hold above that level at the end of the month.
The altcoin market is mixed with the majority of tokens underperforming the two largest cryptocurrencies, while a small corner of the market, including , curve (CRV) and toncoin (TON), bucked the bearish price action with upside moves between 5% and 10% in the past 24 hours.
Derivatives positioning
- Market-wide notional open interest (OI) in crypto futures rose to $125 billion even as volumes fell 6% to $174 million. The moves suggest reduced short-term speculation and gradual trader positioning.
- ZEC’s OI crashed over 10% to 1.90 million tokens from the 4.5-month high of 2.48 million tokens last week. At the same time, the token’s price dropped to $550 from $642. The combination suggests unwinding of bullish bets rather than fresh capital flows deployed for shorts or bearish plays.
- SUI, CORE, and HBAR were among the other major OI decliners. Open interest in Canton’s CC token, meanwhile, jumped more than 10%, with positive funding rates and a positive 24-hour OI-adjusted cumulative volume delta signaling stronger buyer dominance.
- ETH and XMR are other notable OI gainers, though their CVDs are negative, a sign that sellers are leading the price action with market orders rather than passive limit orders.
- The relentless decline in bitcoin’s 30-day implied volatility index, BVIV, has stalled this month, stabilizing near 40%. But there are no signs of a renewed upswing, which points to continued market calm, an environment favorable for further bullish price action.
- Wall Street’s volatility gauge, the VIX, which measures the 30-day implied volatility of the S&P 500 index, has jumped more than 10% this week to nearly 19 points. Though still below the recent highs above 30, the minor upswing warrants attention.
- On Deribit, the 24-hour volume ranking featured BTC calls at strikes of $80,000, $82,000, and $84,000. The calls are bets that the price of bitcoin will rally. It also included puts, or bets on a drop, at strikes of $65,000 and $74,000.
Token talk
- All CoinDesk benchmarks are in the red since midnight UTC, with the DeFi Select Index (DFX) leading the losses with a 2.7% move, followed by the CoinDesk Computing Select Index (CPUS) down by 2.3%.
- JUP, MON and SEI are among the day’s worst-performing altcoins, tumbling by between 5.6% and 6.3% due to a persistent lack of liquidity.
- is one of the best-performing altcoins, adding 4.1% to notch a three-day winning streak.
- CRO’s rally can be attributed to a governance proposal that, if passed, would change the project’s tokenomics by replacing inflation-driven staking rewards with a system in which yields are fully funded by actual protocol revenue.
- CoinMarketCap’s “Altcoin Season” indicator is at 50/100, the highest level since late March as sentiment across the sector shows signs of improvement.


U.S. spot XRP exchange-traded funds have pulled in their largest daily inflow in roughly four months.
Summary
- U.S. spot XRP ETFs recorded $25.8 million in daily inflows, the highest level since January.
- Franklin Templeton, Bitwise, and Grayscale all posted positive XRP ETF flows, according to SoSoValue data.
According to SoSoValue data, spot XRP ETFs listed in the U.S. recorded combined net inflows of $25.8 million on May 11, the strongest single day of inflows since Jan. 5.
Franklin Templeton’s XRPZ accounted for the largest share with $13.6 million in new capital, while the Bitwise XRP ETF added $7.6 million and Grayscale’s GXRP attracted $4.6 million.
Institutional demand has been building across several crypto ETF products in recent weeks as money continues moving into regulated digital asset vehicles.
Bitcoin ETFs have now recorded seven consecutive weeks of positive flows, bringing in more than $3.4 billion during that period, while Solana ETFs saw $26.6 million in daily inflows, their highest level since February.
Ether ETFs moved in the opposite direction, posting roughly $16.9 million in net outflows on the same day, according to SoSoValue data.
At the same time, Ripple has continued expanding its institutional finance business through brokerage, custody, and tokenized asset initiatives tied to the XRP Ledger ecosystem.
Last week, Ripple said it completed a pilot cross-border payment transaction backed by tokenized U.S. Treasuries alongside JPMorgan Chase, Mastercard, and Ondo Finance. The transaction used infrastructure connected to XRPL and formed part of Ripple’s push into institutional settlement services.
Days earlier, Ripple’s prime brokerage arm secured up to $200 million in financing from asset manager Neuberger Berman to expand margin lending and multi-asset trading services for institutional clients. The credit facility would support trading activity across crypto, equities, fixed income, and foreign exchange markets through Ripple Prime.
At the time of publication, XRP was trading at $1.46, up 0.4% over the previous 24 hours.

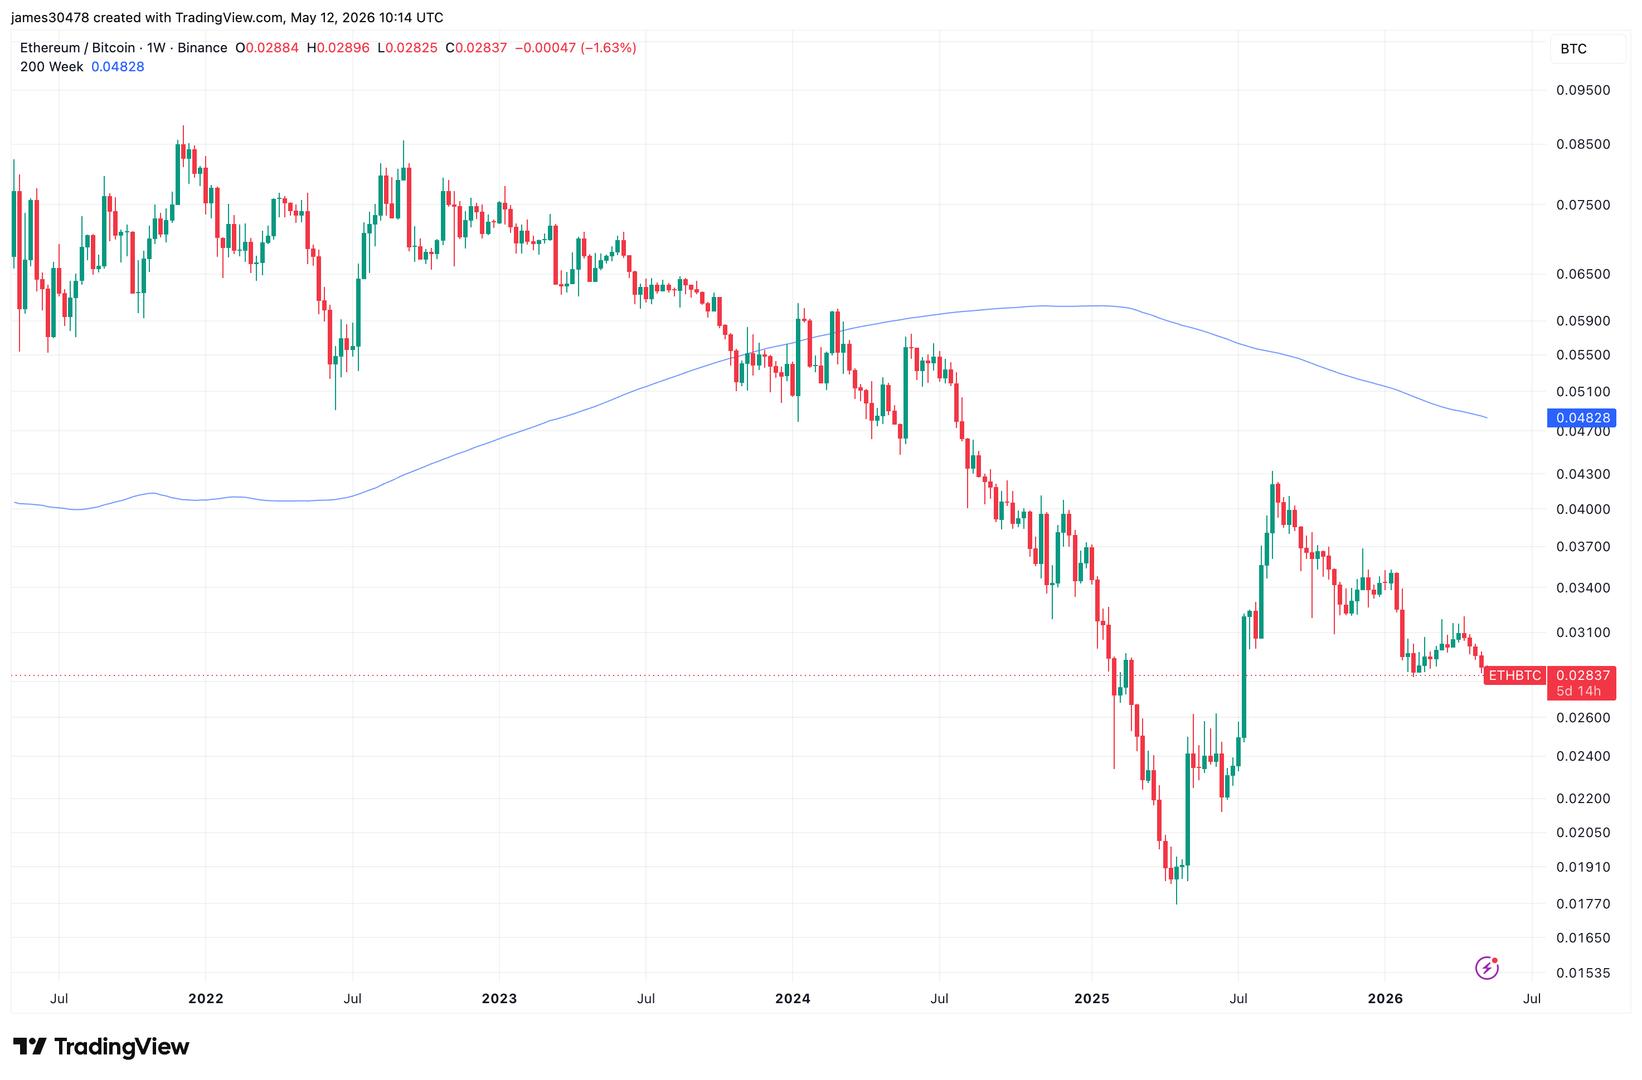
One widely watched indicator for assessing whether the crypto market is in a bullish or bearish phase is the ether-to-bitcoin (ETH/BTC) ratio.
On Tuesday, the ratio fell to 0.02835, its lowest level in 10 months and the weakest reading since July 2025. The decline comes as ether dropped more than 2% on Tuesday, compared with bitcoin’s decline of just over 1%. The ETH/BTC ratio is now down more than 35% from its August high of 0.04324.
The ETH/BTC ratio measures ether’s relative performance against bitcoin across crypto exchanges and is considered a key gauge of market risk appetite. A rising ratio typically signals that investors are rotating capital into ether and other higher risk crypto assets, reflecting stronger risk sentiment. Conversely, a falling ratio suggests investors are favoring bitcoin’s relative stability and defensive characteristics.
The pair peaked above 0.08 in December 2021 before entering a prolonged multi year downtrend. Much of the weakness through 2024 and into 2025 was driven by bitcoin’s outperformance following the launch and success of U.S. spot bitcoin ETFs in January 2024, which attracted significant institutional inflows.
The ratio eventually bottomed at 0.01770 in April 2025 during the market turmoil surrounding President Trump’s “Liberation Day” tariff announcements. It then rebounded sharply, gaining roughly 135% later in 2025 before reversing course again. Despite that recovery, the ratio has since fallen another 35% from its recent highs.
Technically, the ETH/BTC ratio remains substantially below its 200 week moving average, currently at 0.04828, reinforcing the view that ether remains in a long term bear market relative to bitcoin.
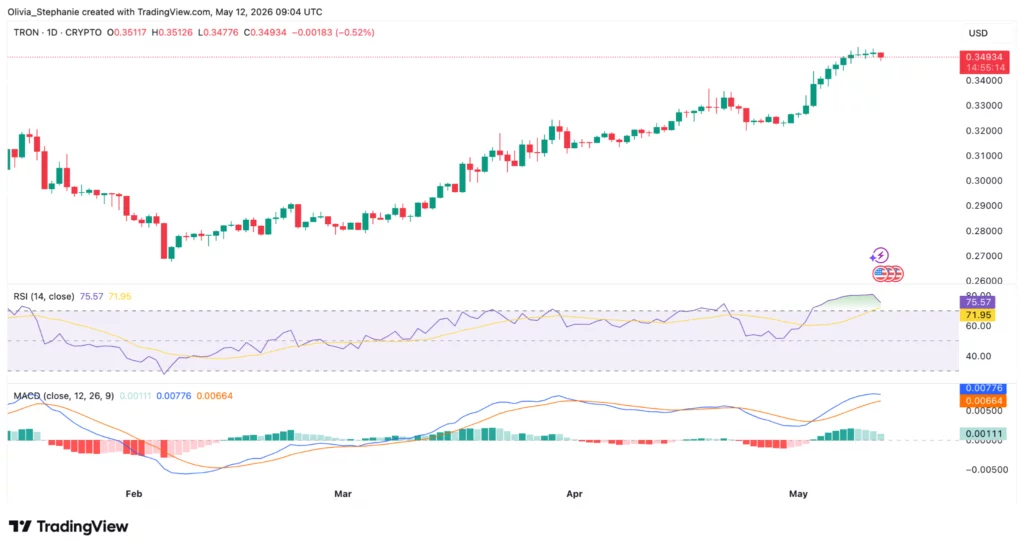
TRON traded near $0.349 after a steady three-month rally, with live market data showing a small intraday decline.
Summary
- TRON traded near $0.349 as RSI moved above 75, showing strong but stretched momentum.
- Santiment said crowd FUD may support TRX as skeptical traders keep doubting the rally.
- TRON’s USDT role remains a major growth driver, but scrutiny over illicit flows persists.
Crypto.news price data also placed TRON (TRX) near $0.351, with a 24-hour range of $0.349241 to $0.352492. The same data showed a market cap above $33 billion and 24-hour volume near $447 million.
Meanwhile, Santiment said TRON has gained about 26% over the past three months, while crowd discussion remains mixed. The analytics firm linked part of the rally to persistent doubt around the project and its founder, Justin Sun.
The firm said many traders still view TRON as “too risky” or “too controversial” compared with newer crypto themes such as AI and DeFi. It also argued that markets often move against crowd expectations when sentiment becomes too one-sided.
TRX chart shows strong momentum
TradingView chart shows TRX in a clear uptrend from early February lows near $0.27 toward the $0.35 area. Price action has formed higher lows and higher highs through March, April, and early May.
The RSI reading sits at near 76, above the 70 level often used to mark overbought conditions. That suggests strong buying pressure, but it also shows the rally may be stretched in the short term.
At the same time, the MACD line sits at 0.00777, above the signal line at 0.00664. That setup still supports bullish momentum, while the histogram remains positive at 0.00112.

However, the latest candles show TRX pausing near the recent high. If buyers keep price above the $0.34 to $0.345 area, the trend may stay supported. A move below that zone would point to a deeper cool-off after the recent climb.
USDT activity remains central to Tron
TRON’s role in stablecoin transfers remains one of its largest market drivers. Earlier crypto.news coverage said TRON had extended its USDT lead over Ethereum, with rising active addresses and record weekly transaction volumes linked to stablecoin use.
That same stablecoin activity has also drawn scrutiny. Crypto.news previously reported that Tether froze USDT across Ethereum and Tron addresses, while a Tether-backed crime unit later froze more than $300 million in illicit assets.
Moreover, TRON has also gained wider market visibility. As crypto.news reported, Moscow Exchange plans to add a TRX index from May 13, using pricing data from Binance, Bybit, OKX, and Bitget for professional investors.
Disclosure: This article does not represent investment advice. The content and materials featured on this page are for educational purposes only.

Key Takeaways
- Shares of Advanced Micro Devices peaked at $469.22 during Monday’s trading session, finishing 0.79% higher at $458.79
- According to GF Securities projections, the server CPU sector may expand from $26 billion in 2025 to $135 billion by decade’s end, representing 38% compound annual growth
- AMD’s data center CPU division is projected to experience 73% expansion in 2026, while CEO Lisa Su has doubled the company’s long-term growth forecast to 35%
- Major Wall Street firms Goldman Sachs and Bernstein elevated their ratings to Buy after the chipmaker delivered results exceeding expectations across all metrics
- Prominent investor Stone Fox Capital projects shares could climb to $600, with company revenues potentially crossing $100 billion next year
Shares of Advanced Micro Devices finished Monday’s trading at $458.79, gaining 0.79%, after establishing a fresh 52-week peak of $469.22 earlier in the session. The upward momentum reflects Wall Street’s growing interest in CPU manufacturers and data center equipment providers amid the expanding AI infrastructure landscape.
Advanced Micro Devices, Inc., AMD
What’s fueling this rally? A powerful combination of impressive quarterly results and mounting evidence that the next wave of artificial intelligence investment will flow heavily through server processors — extending beyond GPU-only strategies.
The semiconductor giant exceeded Wall Street projections across earnings, revenue, and forward guidance in its most recent quarterly disclosure. Chief Executive Lisa Su highlighted AI agents as creating “tremendous demand” throughout the entire AI adoption spectrum.
Su dramatically revised the company’s long-term server CPU market projections upward — jumping from an 18% growth forecast issued in November to a 35% compound annual growth rate, with the addressable market potentially expanding to $120 billion by 2030. AMD is actively increasing wafer procurement and back-end production capabilities to address anticipated demand levels.
According to Su, the data-center business unit has evolved into the “primary driver” of the company’s revenue expansion and profit growth, with inference workloads and agentic AI applications accelerating demand for high-performance processors and accelerators.
Wall Street Analysts Raise Ratings
Both Goldman Sachs and Bernstein elevated Advanced Micro Devices to Buy recommendations following the quarterly report, emphasizing robust CPU demand linked to AI computing requirements.
JPMorgan characterized the results as demonstrating a “structural inflection” across both server processor and data-center accelerator segments.
Wedbush’s Matt Bryson increased his price objective to $450 with an Outperform designation, highlighting improved unit volumes and favorable pricing dynamics associated with compute infrastructure supporting agentic AI.
Citi’s Atif Malik elevated his target to $358 while maintaining a Neutral stance, expressing optimism regarding AMD’s CPU market opportunity.
The prevailing Wall Street consensus reflects a Strong Buy recommendation, comprising 27 Buy ratings alongside 8 Hold ratings. The mean 12-month price objective stands at $442.94.
The Optimistic Outlook
Analytical firm GF Securities identified AMD, Intel, and Qualcomm as well-positioned to capitalize on an emerging server CPU supercycle. The research house forecasts 73% revenue growth for AMD’s server CPU business in 2026.
Mizuho’s Jordan Klein suggested to CNBC that the semiconductor sector’s momentum might represent a “changing of the guard in AI,” with capital flowing toward AMD, Intel, Micron, and Corning.
Prominent investor Stone Fox Capital, ranked among the top 4% of equity analysts on TipRanks, describes the CPU market opportunity as “huge” and anticipates AMD’s server processor revenue expanding tenfold by 2030.
Stone Fox projects the company could achieve $100 billion in aggregate revenue next year — surpassing consensus analyst projections of $75 billion for 2027 — and potentially exceeding $175 billion by decade’s end.
This revenue trajectory, according to Stone Fox’s analysis, supports a valuation of $600 per share when applying a 20x price-to-earnings multiple.
Cautionary Voices Emerge
BTIG’s Jonathan Krinsky sounded a cautionary note, drawing parallels between the current semiconductor rally and the late-1990s technology bubble. He cautioned the sector might experience a correction ranging from 25% to 30% following aggressive valuation expansion.
Bank of America projects the data-center CPU market expanding from $27 billion in 2025 to $60 billion by 2030, a notably more restrained forecast compared to GF Securities’ $135 billion estimate.
Intel’s CEO Lip-Bu Tan reinforced AMD’s optimistic CPU outlook during his company’s recent quarterly call, validating the perspective that server processors represent a significant growth catalyst throughout the semiconductor industry.

Crypto World
The Senate Just Dropped a 309-Page Crypto Bill at Midnight: Will the CLARITY Act Finally Give Institutions the Green Light?

The Senate Banking Committee dropped the full 309-page text of the CLARITY Act just after midnight on Tuesday, May 11, 2026, ahead of a Thursday committee hearing that could advance the most comprehensive crypto market structure legislation the U.S. has attempted.
The headline provision: a 1:1 reserve mandate requiring all payment stablecoin issuers to hold high-quality liquid assets against every token in circulation.
The tension at the center of this bill is real; it asks stablecoin issuers, DeFi developers, institutional custodians, and traditional banks to accept a single regulatory framework that serves none of them perfectly.
JUST IN: — Watcher.Guru (@WatcherGuru) May 12, 2026
 US Senate Banking Committee releases crypto Clarity Act draft bill. pic.twitter.com/M9dqecVonb
The second major structural element draws a hard jurisdictional line between the SEC and CFTC, assigning oversight based on whether a token functions as a security with ongoing management-led profit expectations or as a digital commodity within a decentralized protocol.
That division has been missing from U.S. law since Bitcoin’s creation, and its absence has been the single largest barrier to institutional custody approvals at regulated fiduciaries. The bill does not resolve every gray zone, but it creates the statutory floor that compliance teams have said they need before allocation committees will act.
Discover: The best pre-launch token sales
What the 1:1 Reserve Mandate Actually Requires – and Who It Pressures
The CLARITY Act restricts qualifying reserve assets to short-duration U.S. Treasuries under 90 days, overnight repurchase agreements, and central bank deposits. That is a tighter composition requirement than current market practice.
Tether’s USDT reserve disclosures have historically included corporate paper, money market funds, and secured loans, none of which would qualify under this framework. Circle’s USDC, by contrast, has already shifted toward short-duration Treasuries and cash, positioning it closer to compliance than its largest competitor.
On stablecoin yield, the bill’s language is deliberately constrained. It permits interest or yield payments only when made “solely in connection with the holding of payment stablecoins” or structured to be economically equivalent to interest on a bank deposit.
Going live now for Brian’s AMA.https://t.co/5Q2vS9hBwN
— Coinbase
 (@coinbase) May 11, 2026
Coinbase CEO Brian Armstrong, whose company was at the center of that negotiation, said publicly on Monday that “not everyone got everything they wanted, but they got the must-haves.” Armstrong confirmed Coinbase is working with at least five of the largest global banks and framed the outcome as workable: “We want it to be win-win and work with the banks.”
The American Bankers Association is not satisfied. The group escalated its lobbying over the weekend, warning senators that yield-bearing stablecoins could drain insured deposits and destabilize mortgage funding.

Research from Galaxy pushed back directly, arguing that stablecoin growth will predominantly originate offshore and that “foreign capital will flow into U.S. banking infrastructure at a rate that materially exceeds any domestic deposit migration.”
That is a contested empirical claim, but it is the framework Galaxy is asking lawmakers to adopt before Thursday’s vote on Stablecoin Regulation.
What Clarity ACT Bill Passage Means for Capital Flows, and What Stalls It
Galaxy’s research framing has direct market implications: if stablecoin growth is predominantly offshore-driven, the reserve mandate functions as an onboarding mechanism for foreign dollar demand into U.S. Treasuries, not a threat to domestic bank deposits.
That framing, if it holds in Senate debate, substantially weakens the American Bankers Association’s argument and increases the probability the yield language survives intact.
Senate Banking Committee Chairman Tim Scott called the bill “serious, good-faith work” that “puts consumers first, combats illicit finance” and “keeps the future of finance here in the United States.”
— Bitcoin Archive (@BitcoinArchive) May 10, 2026
Senator Tim Scott: “Let’s make America the crypto capital of the world.” $BTC pic.twitter.com/TguyAU7ser
The opposition, led by ranking Democrat Elizabeth Warren, is not primarily about reserves or jurisdiction, it is about the missing ethics provision.
Warren stated that Trump and his family have “raked in at least $1.4 billion in gains from crypto deals alone” in his first year, and that “this bill stunningly includes zero provisions to prevent that.”
The conflict-of-interest section is outside the Banking Committee’s jurisdiction and must be added later. Democrats, including Senator Kirsten Gillibrand, have said they will not allow the bill to move without it. Sixty yes votes are required for Senate passage, that number requires meaningful Democratic support, the same dynamic that institutional adoption narratives in the payment token space depend on for durable regulatory legitimacy.
The bill still needs to be merged with a version approved by the Senate Agriculture Committee, the ethics provision must be negotiated and inserted, and then 60 senators must vote yes.
White House adviser Patrick Witt has set July 4 as the administration’s target. Senator Gillibrand has predicted the first week of August.
If the committee votes Thursday and the ethics language lands in a form both parties can accept, that timeline is plausible. If the conflict-of-interest provision becomes the bill’s breaking point, the framework gets delayed, and every institutional allocation waiting on statutory classification waits with it.
The post The Senate Just Dropped a 309-Page Crypto Bill at Midnight: Will the CLARITY Act Finally Give Institutions the Green Light? appeared first on Cryptonews.
US authorities have unsealed an indictment against three men accused of stealing at least $6.5 million in a “violent robbery spree targeting cryptocurrency owners.”
The Justice Department said in a statement Monday that a federal grand jury indicted three men for allegedly planning to kidnap and rob four people around San Francisco and Los Angeles for their crypto.
The trio, Elijah Armstrong, Nino Chindavanh and Jayden Rucker, are alleged to have posed as delivery drivers to force their way into residences and use threats of violence to extract crypto seed phrases.
So-called wrench attacks, where crypto owners are subject to physical threats, have increased globally since 2025. French authorities charged 88 people in April with committing attacks against local crypto owners.
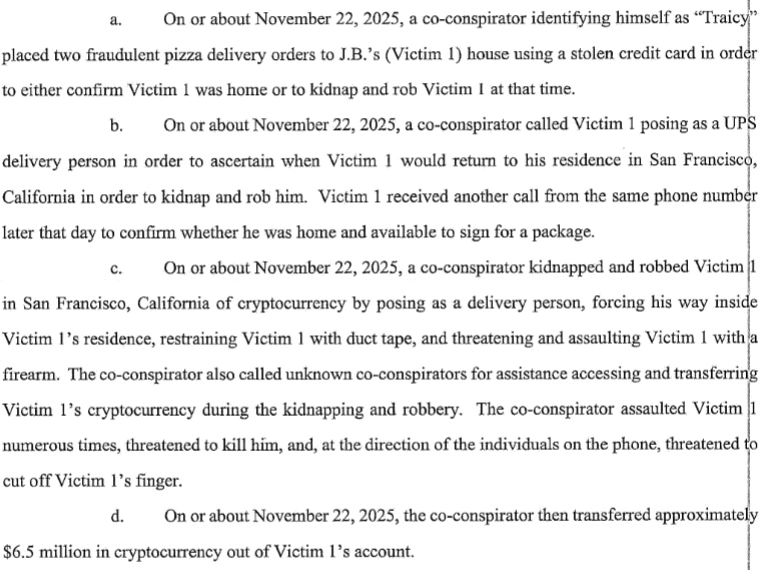
US prosecutors claimed they identified at least four people the trio targeted from Nov. 22 until Dec. 31. One of the people was allegedly forced to transfer $6.5 million in crypto to a wallet controlled by the trio, according to an unsealed indictment filed in a San Francisco federal court.

One of the victims was allegedly forced to transfer $6.5 million in crypto to the attackers. Source: PACER
“These individuals, as alleged, terrorized their victims in the hopes of stealing vast sums of cryptocurrency,” Craig Missakian, the US Attorney for the Northern District of California, said in a statement Monday. “The scheme was not only sophisticated, it was brazen, violent, and dangerous.”
Related: Law enforcement freezes $41M connected to $150M crypto Ponzi collapse

Source: FBI San Francisco
The three men were arrested in December last year and face charges of conspiracy to commit robbery, conspiracy to commit kidnapping, attempted robbery, and attempted kidnapping.
Armstrong and Rucker are scheduled to appear in court on Tuesday. Chindavanh is scheduled to appear in court on June 26.
Blockchain intelligence company TRM Labs reported in May last year that wrench attacks have been on the rise because of the ease with which bad actors can gather personal data online, the perceived pseudonymity of crypto transactions and the public visibility of wealth in the crypto sector.
Magazine: Guide to the top and emerging global crypto hubs — Mid-2026
Jeremy Loeliger: IBL isn’t chasing cricket, it’s eyeing ‘sporting entertainment’ for next generation of fans | More sports News

Apple headed to South Korea to fight off US antitrust case

XRP & Clarity Act Deal Announced!
Manchester United reach agreement with Casemiro over contract clause amid transfer speculation

US brings back mandatory military draft registration

Steven Gerrard disagrees with Gary Neville over ‘shock’ Chelsea and Arsenal claim | Football


-
 Crypto World4 days ago
HarrisX Poll Found 52% of Registered Voters Support the CLARITY Act
-

 Fashion4 days ago
Weekend Open Thread: Marianne Dress
-

 Crypto World5 days ago
Upbit adds B3 Korean won pair as Base token gains Korea access
-
 NewsBeat5 days ago
NCP car park operator enters administration putting 340 UK sites at risk of closure
-

 Fashion17 hours ago
Coffee Break: Travel Steam Iron
-

 Fashion1 day ago
What to Know Before Buying a Curling Wand or Curling Iron
-

 Tech2 days ago
Auto Enthusiast Carves Functional Two-Stroke Engine from Solid Metal
-

 Politics13 hours ago
What to expect when you’re expecting a budget
-

 Politics3 days ago
Politics Home Article | Starmer Enters The Danger Zone
-
 Business3 days ago
Ignore market noise, India’s long-term story intact, say D-Street bulls Ramesh Damani and Sunil Singhania
-

 Crypto World7 days ago
UAE Free Zone Deploys Blockchain IDs to Verify Registered Firms
-

 Tech1 day ago
GM Agrees To Pay $12.75 Million To Settle California Lawsuit Over Misuse Of Customers’ Driving Data
-

 Crypto World6 days ago
BlackRock CEO Larry Fink Discusses a New Asset Class
-

 Entertainment5 days ago
Sarah Paulson Called Out For Met Gala ‘Hypocrisy’
-
 Sports6 days ago
NBA playoff winners and losers: Austin Reaves is not loving Lakers vs. Thunder matchup, but Chet Holmgren is
-

 Crypto World5 days ago
Robinhood says Wall Street is building onchain
-

 Entertainment6 days ago
Bold and Beautiful Early Spoilers May 11-15: Steffy Revolted & Liam Overjoyed!
-

 Entertainment5 days ago
General Hospital: Ric & Ava Bombshell – Ric’s Massive Secret Exposed!
-

 Tech6 days ago
Apple and Samsung are dominating smartphone sales so thoroughly that only one other company makes the top 10
-

 Politics5 days ago
Simon Cowell Says He Was ‘Horrible’ To Susan Boyle During BGT Audition
You must be logged in to post a comment Login