
Crypto World
Stablecoin Cross-Border Transfers Jump 78% Despite Bear Market


Crypto’s rougher year didn’t prevent stablecoins from pushing deeper into cross-border payment rails. According to Chainalysis’ 2026 Global Crypto Adoption Index, stablecoin transfers across countries climbed to $220.3 billion in the 12 months ending June 2026, up 77.5% from $124.2 billion in the prior 12-month period—even as total global crypto market capitalization fell 37% to $2.1 trillion.
The data suggests stablecoins are increasingly being used for practical money movement rather than purely speculative trading. Chainalysis summed it up as: “The bear market hit the price-sensitive half of crypto and left the payments half alone.”
Key takeaways
- Cross-border stablecoin flows rose 77.5% to $220.3 billion over the year to June 2026, even as total crypto market cap dropped 37%.
- Transfers remained “trade-like” rather than bursty, averaging around $3,000 per cross-border transfer.
- Activity is concentrated: the top quarter of corridors accounted for 96.1% of measurable cross-border stablecoin value.
- Regulatory frameworks are tightening across major regions, including the US (GENIUS Act) and the EU (MiCA), alongside Hong Kong’s licensing approach.
- Traditional remittance firms are expanding stablecoin options, including card and wallet products linked to USD-backed stablecoins.
Stablecoin usage accelerates even as the market contracts
Chainalysis’ adoption index frames the latest trend as a split inside crypto itself. While investors reduced exposure to price-sensitive assets during the downturn, payment-focused activity continued to expand. In its analysis, Chainalysis connects the resilience of stablecoins to real-world transaction demand—particularly cross-border transfers that resemble everyday business and personal payments.
Over the period studied, cross-border stablecoin flows rose from $124.2 billion to $220.3 billion. At the same time, Chainalysis reported that the total crypto market cap contracted by 37% to $2.1 trillion, highlighting the contrast between speculative markets and payments infrastructure.
Chainalysis also pointed to the behavioral pattern of the transfers: activity increasingly looked consistent and scheduled, routed through wallets at a steady rhythm rather than appearing in short spikes. Philip Gradwell, vice president of economics at Tether, told Chainalysis that this “signature” reflects trade and business activity, not speculation.
From corridors to everyday payments: what the on-chain data shows
Chainalysis tracked 4,708 new cross-border corridors during the reporting period, with a combined cross-border value of $2.64 billion. In this context, each corridor represents a route between an originating and receiving country.
But the index also shows strong concentration. The top quarter of corridors accounted for 96.1% of measurable cross-border stablecoin value. Chainalysis reported that the remaining three-quarters carried $8.66 billion, up from $260 million in the previous period—suggesting more routes are participating, but value is still dominated by established pathways.
Chainalysis’ observation that the typical cross-border transfer is around $3,000 aligns with common use cases described by industry participants. In practice, this scale fits supplier payments, sending money home, and moving savings away from volatile currencies—patterns that don’t depend on crypto price momentum.
Why stablecoins are gaining traction: regulation, redemption, and utility
The index links stablecoin growth to a broader shift toward formal oversight and mainstream financial integration. Chainalysis noted that key jurisdictions have moved toward regulation and licensing, which can make stablecoins easier for institutions and service providers to build with.
In the US, the GENIUS Act was signed into law in July 2025. In Europe, the MiCA framework has brought stablecoin issuers into a clearer regulatory environment. Chainalysis also referenced Hong Kong’s issuer licensing regime as part of the move toward more structured supervision.
Still, regulation isn’t the only constraint. Vincent Chok, co-founder and CEO of First Digital, told Cointelegraph that stablecoins are an additional option when traditional payment structures become fragmented—especially when businesses need to move funds between markets with different banking systems, currencies, and settlement schedules.
Chok cautioned that stablecoins don’t remove the “off-chain” steps. “Onchain settlement is fast, but it doesn’t solve the off-chain parts: converting to local currency, meeting compliance requirements, and moving funds through existing banking rails,” he said. In other words, stablecoin throughput helps, but the surrounding financial plumbing remains a gating factor.
Regional demand differs: settlement needs in Asia and dollar access elsewhere
Stablecoin demand appears to vary by region and by what problem users are trying to solve. Tianwei Liu, co-founder and CEO of StraitsX, told Cointelegraph that in Asia, fragmented currencies and uneven payment infrastructure have created sustained demand for stablecoin settlement.
Liu also suggested that this utility is broadening beyond settlement: stablecoins are increasingly used “behind payment methods people already use,” meaning they can transition from an operational tool into an everyday spending option.
Outside Asia, Liu framed stablecoins as addressing different needs, including dollar access, remittances, and hedging against inflation or capital controls—factors that are especially relevant across parts of Latin America, Africa, and the Middle East.
This distinction matters for investors and builders because it affects how stablecoin products will be adopted. If the main driver is settlement efficiency, then integrations with payment providers and wallet ecosystems become critical. If it’s dollar access and remittance reliability, then partnerships with off-ramps, local currency conversion, and distribution networks may be more important.
Traditional players expand stablecoin cards and wallets
The index’s findings come alongside visible efforts by established money-transfer companies to incorporate stablecoins into consumer workflows. Cointelegraph previously reported that Western Union launched a stablecoin wallet and a Visa-linked card across 37 markets in August, enabling users to hold and spend Western Union’s branded US dollar-backed stablecoin.
In September, MoneyGram announced a similar card initiative, initially targeting Colombia, with additional markets planned later this year. Together, these moves suggest stablecoin adoption is increasingly supported by existing distribution channels—potentially accelerating usage beyond crypto-native audiences.
While these initiatives do not directly explain Chainalysis’ corridor-level numbers on their own, they fit the broader pattern the index highlights: steady, utility-driven transfer behavior that grows even during market downturns.
For what to watch next, the key question is whether stablecoin cross-border activity will keep broadening beyond the top corridors that dominate measurable value. Chainalysis shows the long tail is growing, but concentration remains high—so investors and users should monitor how regulatory clarity, reliable redemption access, and interoperability with local financial systems evolve over the next reporting periods.

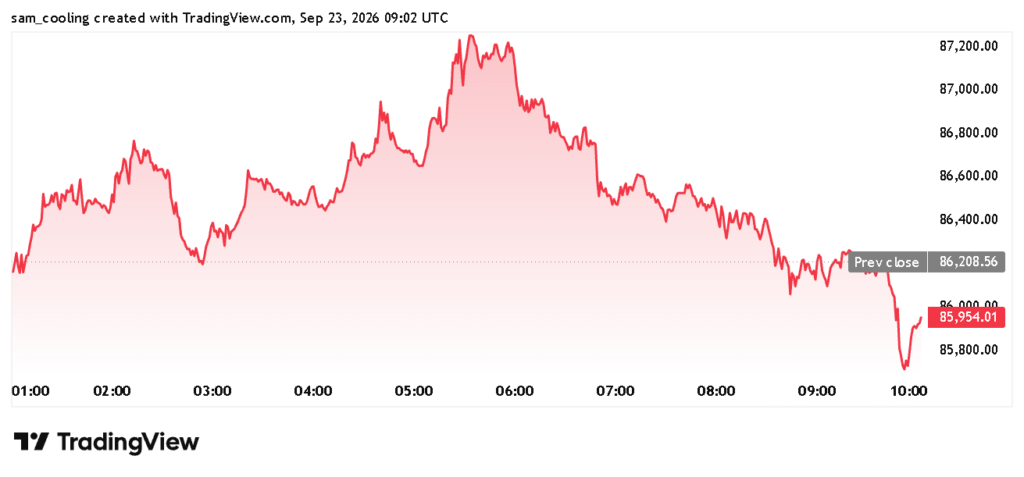
Bitcoin Price Prediction: Bitcoin (BTC) trades at $85,954, down a modest 0.3% on the day, holding the upper band of a rebound that’s had traders debating whether this is a breakout or just another consolidation trap. There’s a specific level being watched right now that could decide which one it is, more on that below.
The setup echoes an older pattern: a similar surprise breakout above $80,000 followed weeks of Fed and Senate-driven volatility, catching short-sellers off guard.
This time, the catalyst basket looks different, U.S.–Iran de-escalation chatter, renewed spot ETF demand, and a reported SEC crypto-custody rule draft, but the mechanics are familiar.
Futures open interest across BTC, ETH and SOL jumped 7.6% during the recent rally, while short-term holders moved 47,600 BTC to exchanges, a classic profit-taking signal. Recent analysis flags this exact tension between fresh demand and exit liquidity.
Macro headlines are doing heavy lifting again, and the market’s reaction function hasn’t changed much. Good news gets bought fast, then digested slowly.
Can Bitcoin Price Hit $90,000 This Week?
BTC’s 24-hour range sits between $85,720 and $87,258, a tight band that reflects indecision rather than conviction.

(Source – TradingView, BTC USD)
With an RSI of 75 near $86,550, carrying a bearish-divergence warning, meaning technically overbought territory, the kind that’s preceded pullbacks before. That data matters here.
Immediate resistance sits at $87,300–$88,000, with psychological pressure building at $90,000.
Support holds at $86,000–$86,300 first, then $85,000–$85,300, with structural footing near $82,000–$83,300 if things unravel. Bear-case scenarios put a floor further out near $80,000–$81,500.
Bull case: a close above $88,000 opens a run at $90,000–$95,000.
Base case: continued chop between $85,000 and $88,000 while ETF flows and geopolitical headlines fight for control.
Bear case: a break below $85,000 drags price toward $82,000.
Bernstein’s Chhugani still holds a $150,000 year-end target; Standard Chartered’s Kendrick trimmed his to $100,000, a wide enough gap to say forecasting confidence is low right now.
Bitcoin Hyper Targets Early Mover Upside as Bitcoin Tests Key Levels
A move from $86,000 to $90,000 is a solid 4-5% swing for existing BTC holders. But at a $1.7 trillion-plus market cap, doubling from here requires an amount of new capital that simply isn’t showing up on any credible timeline.
That mathematical ceiling is why capital increasingly rotates into earlier-stage infrastructure plays chasing asymmetric upside instead.

Bitcoin Hyper (HYPER) is positioning itself as the first Bitcoin Layer 2 with full SVM integration, aiming to execute smart contracts faster than Solana itself while settling back to Bitcoin’s base layer.
The presale has raised $33,153,929.58 at a current token price of $0.0136866, with staking rewards live at launch.
Its Decentralized Canonical Bridge targets one of Bitcoin’s oldest complaints, the lack of native programmability, without compromising base-layer security. Presale tokens carry the standard early-stage risk: no live mainnet yet, so due diligence matters. Research Bitcoin Hyper before allocating.
Gain Access to New Bitcoin Layer 2 Early Here
Key Takeaways
- BTC holds $86,388, needing a close above $88,000 to realistically challenge $90,000–$95,000 resistance zones.
- A break below $85,000 support risks a slide toward $82,000–$83,300, especially with RSI flashing overbought at 75.
- Bitcoin Hyper’s SVM-powered Layer 2 targets Bitcoin’s programmability gap, with $33.1M raised in presale funding so far.
- Watch U.S.–Iran negotiation updates and SEC custody-rule progress as near-term catalysts for BTC’s next directional move.
The post Bitcoin Recoils Below $86,000: Is Bitcoin Price Prediction Still Shooting For $90,000? appeared first on Cryptonews.

Crypto venture capitalists at Hack VC deleted a post about disagreeing with a disgruntled former employee, Hsin-Ju Chuang, who has tragically passed away. Its official X account currently has no mention of her passing.
Its deleted post read, “While our understanding of events differs materially, we do not wish to discuss the details publicly at this time out of respect for their privacy.”
That statement has been replaced by a post from another account, co-founder and Managing Partner Alexander Pack.
Hack VC told Protos, “We removed our earlier statement after seeing the tone the public conversation was taking. Some of the responses directed toward her had become increasingly hostile, and we did not want anything we had posted to contribute to further attention or negativity toward her.”
The firm initially broadcasted its disagreement after Chuang’s August 23-24 accusations of workplace pressure.
Specifically, she complained about medical emergencies, the behavior of Pack and Daniel Bulaevsky, and overtime work pressure amid serious medical symptoms.
She also accused the firm of stalling her health insurance continuation, a dispute that headed to private mediation and spilled over onto social media.
Read more: Crypto prediction markets open ‘Trump out’ bet amid death rumors
Pack, the co-founder she accused by name, posted a reply-limited condolence on Wednesday.
“We are shocked and saddened to learn the news of Hsin-Ju’s passing”, he wrote. “We have not spoken to her directly for over 10 months and we are not aware of the circumstances surrounding her death.”
Got a tip? Send us an email securely via Protos Leaks. For more informed news and investigations, follow us on X, Bluesky, and Google News, or subscribe to our YouTube channel.
President Donald Trump disclosed purchasing $50,001 to $100,000 worth of Strategy shares in July, according to a US Office of Government Ethics filing released Tuesday.
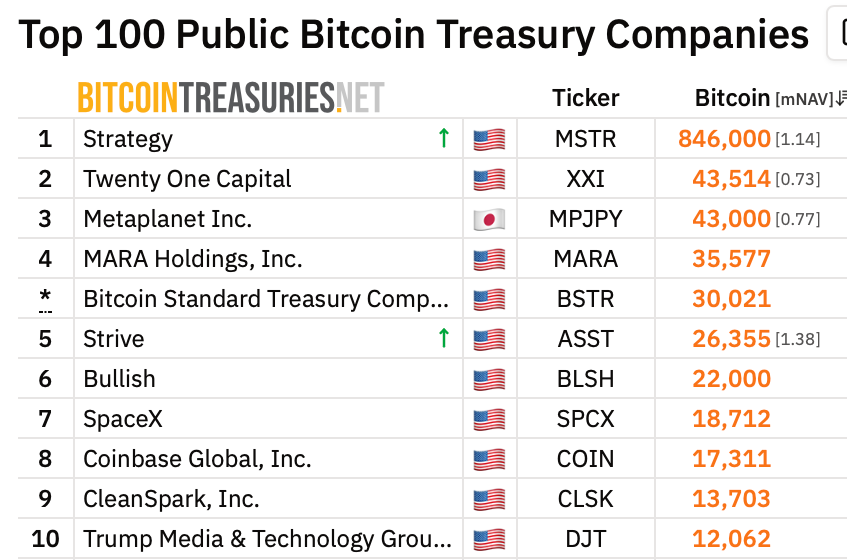
The filing shows Trump bought $50,001 to $100,000 worth of Strategy shares on July 27, following a smaller $1,001 to $15,000 purchase three days earlier. Strategy is the world’s largest publicly traded corporate Bitcoin holder, with 846,000 BTC, according to BitcoinTreasuries.net data.
Trump also disclosed transactions involving several other crypto-linked companies, including a Coinbase stock purchase and sales of Bitcoin miners MARA Holdings and CleanSpark in July. The July 27 Strategy purchase was the largest of the crypto-linked transactions identified in the filing.
Top 10 Bitcoin treasury companies. Source: BitcoinTreasuries.NET
The transaction matched Trump’s largest previously disclosed Strategy purchase, a $50,001 to $100,000 buy on Feb. 12, according to BitcoinTreasuries.NET. His accounts have also reported several smaller purchases and sales of Strategy shares this year.
The filings do not show how many Strategy shares remain in Trump’s portfolio, as transactions are reported in value ranges rather than as a running share balance.
Strategy purchase a small part of broader portfolio activity
The Strategy purchase represented a small portion of Trump’s broader portfolio activity in July. The filing shows sales of $5 million to $25 million each of Microsoft and Amazon stocks on July 20, along with several purchases and sales valued at between $1 million and $5 million.
On Tuesday, the White House told CNBC that Trump’s stock and bond portfolio is independently managed by third-party financial institutions, without input from Trump or his family.
Strategy shares have rallied nearly 30% over the past five trading days and about 37% over the past month, according to Yahoo Finance data.
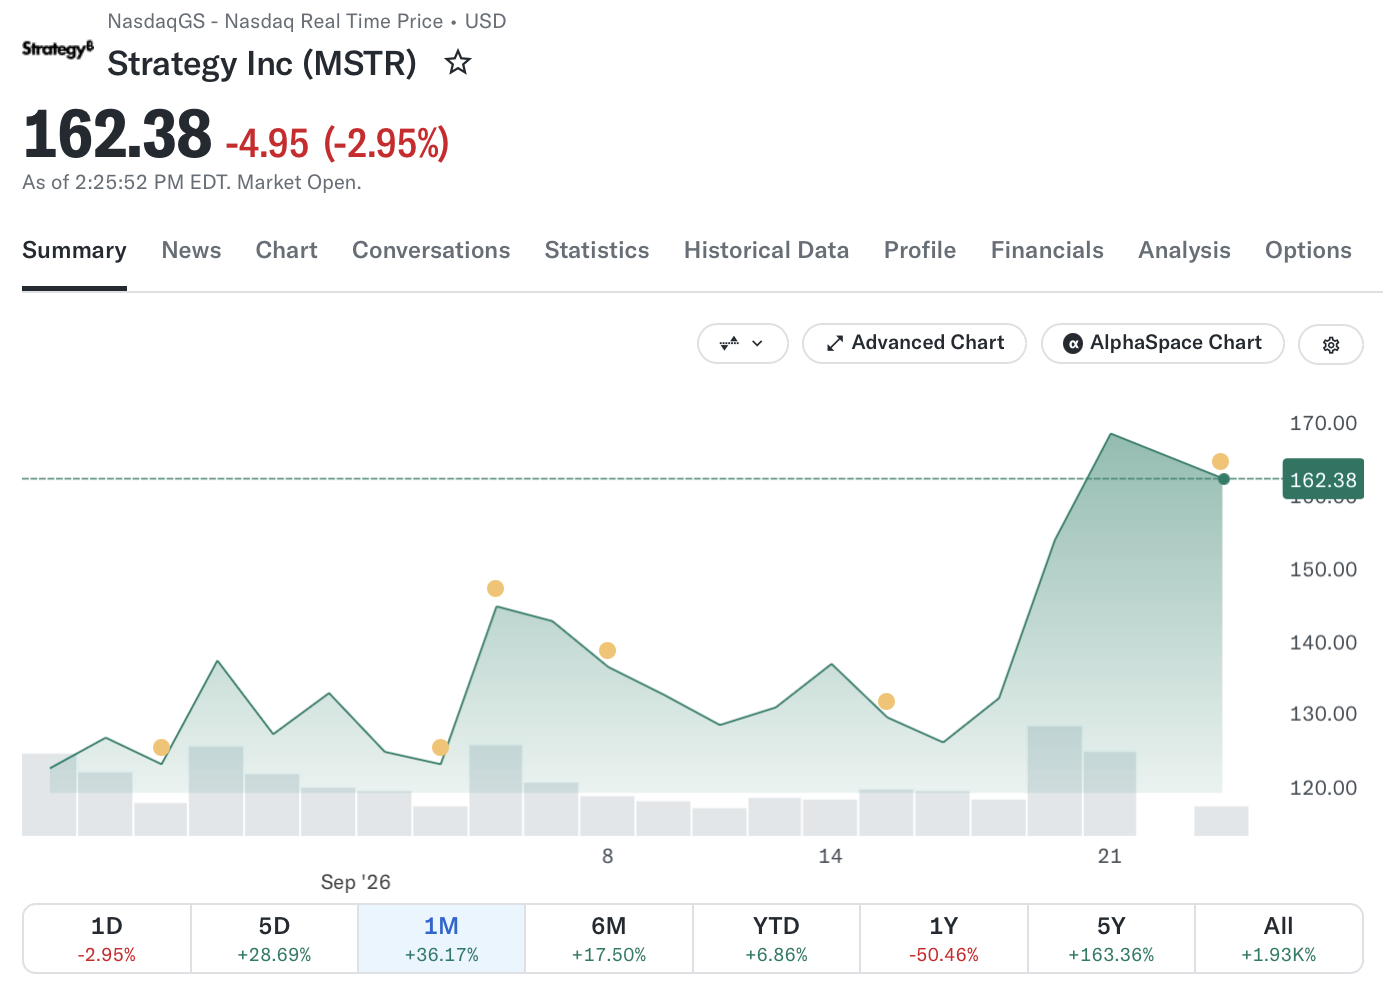
Strategy (MSTR) stock. Source: Yahoo Finance
Disclosure comes amid crypto policy push
Trump’s Strategy disclosure comes as his administration has pursued a series of policies aimed at supporting the US crypto industry, even as comprehensive market structure legislation remains stalled in Congress.
Although the Senate failed to advance the CLARITY Act on Sept. 15, federal regulators have moved ahead using their existing authority. Two days after the failed cloture vote, the Securities and Exchange Commission (SEC) cleared limited onchain trading of tokenized US stocks under a temporary exemption, while the Commodity Futures Trading Commission (CFTC) eased registration requirements for certain software providers offering access to regulated derivatives markets.
The CFTC separately sent a broader crypto market rulemaking initiative for White House review on Sept. 17. Dubbed “Regulation Crypto Asset Transactions and Regulation Crypto Asset Markets,” the initiative is still in its preliminary stages and has yet to become a formal proposal.
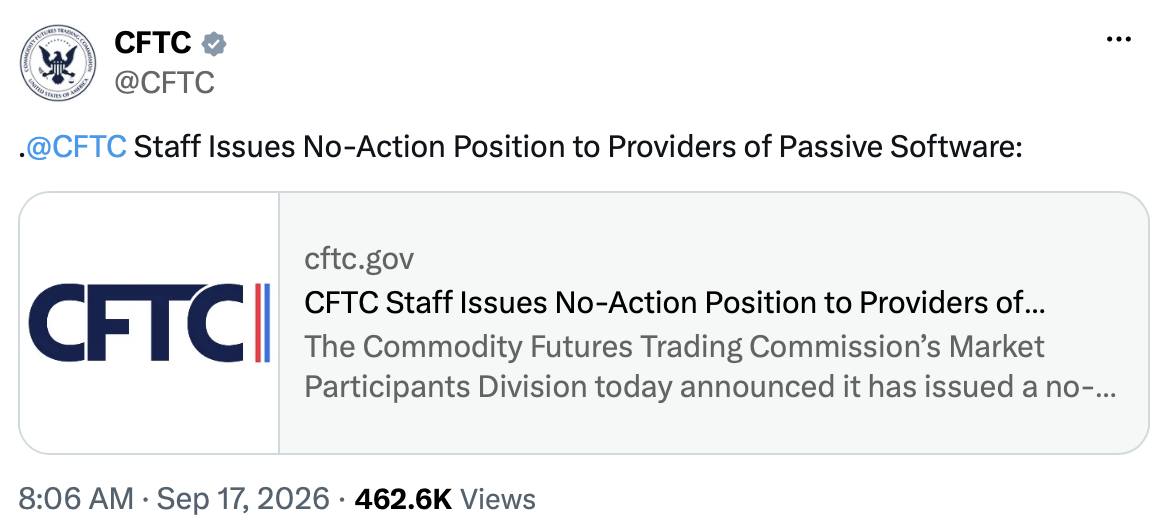
Source: CFTC
The administration’s crypto push has also extended to Bitcoin itself. Last week, the House Financial Services Committee voted 28-21 to advance legislation that would codify Trump’s Strategic Bitcoin Reserve into law and require Bitcoin placed in the reserve to be held for at least 20 years.
The US government currently holds an estimated 324,527 BTC, according to Arkham Intelligence data.
Magazine: Winners and losers of the SEC’s new tokenized stocks rules

Bitcoin has held a dense $85,000–$86,500 buyer cost range after reaching $87,392, but Bitfinex analysts have said continued ETF and corporate purchases are needed to confirm a new bull market.
Summary
- Bitcoin reached its highest price since Jan. 29 before pulling back toward a major buyer cost range.
- Bitfinex said U.S. spot Bitcoin ETFs drew $1.71 billion across Sep. 21 and 22.
- The analysts want profitable supply to stay above 75% during Bitcoin’s first correction.
- ETF investors are near break-even at $86,000, while corporate buyers’ average cost is about $80,500.
Bitfinex Alpha said in its Sep. 23 report that Bitcoin’s advance from its July 1 low of $57,803 has reached a test that separated lasting bull markets from failed recoveries in previous cycles. The analysts have identified the $85,000–$86,500 range as the largest concentration of recent buyer cost bases. Holding that area would show that buyers who entered during the rally are willing to keep their positions through a pullback.
Why Bitcoin’s $85K buyer range matters
According to Bitfinex, about 633,000 BTC last changed hands between $85,000 and $86,500, creating the largest cost range in its price distribution data. Buyers also moved roughly 2.95 million BTC into profit over four trading sessions as Bitcoin climbed. The amount of supply concentrated between $80,500 and $82,500 fell from 252,000 BTC to 170,000 BTC per $1,000 price band between Sunday and Tuesday.
For the analysts, the new concentration beneath spot price offers a more useful test than the speed of the rally itself. A drop through the range would put many recent buyers back at a loss; sustained buying above it would show that demand is continuing after the breakout.
The distinction matters because forced purchases by traders closing short positions can lift prices quickly without creating a lasting source of demand. In earlier coverage of the rally, crypto.news reported that Nansen senior research analyst Nicolai Sondergaard attributed part of Bitcoin’s move above $84,000 to a short squeeze alongside renewed ETF buying. He warned that weaker fund inflows or rising U.S. Treasury yields could leave the advance exposed to a reversal.
Bitfinex places the next price test near Bitcoin’s yearly open of $87,722. Its analysts expect a hold above the $85,000–$86,500 range to leave $90,000 in view if ETF inflows continue and futures funding stays neutral. Below the buyer range, they identify the corporate treasury cohort’s cost near $80,500 as the first support area. A sustained move below $81,300, particularly alongside ETF outflows, would challenge their reading of the breakout.
ETF and corporate purchases need to continue above cost
U.S. spot Bitcoin ETFs took in $999 million on Sep. 21 and another $714.7 million on Sep. 22, Bitfinex reported. Monday’s dollar inflow was the largest since Oct. 6, 2025, when Bitcoin reached its all-time high. Across four sessions ending Sep. 22, the funds absorbed $2.31 billion, equivalent to roughly 27,900 BTC at each day’s average price, according to the report.
The buying followed a $450.4 million ETF outflow on Sep. 15, which Bitfinex called the funds’ largest daily withdrawal since June. For U.S. investors using listed spot funds, the next flow figures will show whether purchases continue now that the aggregate ETF investor cost basis is near $86,000. Bitfinex said the ETF and corporate treasury cohorts held profitable positions at the same time this week for the first time since January.
Corporate filings provide a second measure. As reported in Strategy’s SEC filing, the company bought 950 BTC for $75.7 million during the week ending Sep. 20, lifting its holdings to 846,000 BTC. The filing also showed $174 million spent repurchasing STRC preferred shares. Strategy used existing cash for both transactions and made no sales through its stock offering programs that week.
Bitfinex also counted Strive’s purchase of 1,355 BTC between Sep. 14 and 18. Together, the two companies acquired 2,305 BTC in one week, compared with roughly 5,900 BTC acquired by all public treasuries over the preceding three months, the report said. Both purchases were executed below the analysts’ estimated $80,500 average cost for the corporate treasury cohort.
“The critical test will be whether both cohorts maintain continuous net buying above their respective cost basis,” Bitfinex said. Purchases that appear only after prices fall below investors’ average entry may support a decline, but the analysts said they would not establish the continuing demand needed for a sustained advance.
Holder data has yet to confirm a bull market
On-chain readings give Bitfinex another way to check whether the rally survives its first setback. The share of Bitcoin supply held at a profit rose from 63% on Sep. 17 to 78.2% on Sep. 22. The analysts want the measure to stay above 75% during the first correction; a fall below that line would indicate that holders newly returned to profit had sold into the move.
Bitcoin’s market value relative to its realized value, or MVRV, stood at 1.62 on Sep. 22, below its long-run average of about 1.8, according to Bitfinex. The analysts associate that average with a Bitcoin price near $95,000 at the current realized price. They said crossing and holding it alongside ETF inflows would strengthen the bull-market case, while a failed attempt would resemble earlier recoveries that ran out of demand.
Recent buyers remain in profit as well. Bitfinex put short-term holder MVRV at 1.20 against a cohort cost basis of $71,763. The report said readings of 1.3 to 1.4 would correspond to a price above $93,000, an area where recent buyers have historically become more likely to take profits.
Long-term holders offer a less settled signal. Bitfinex said the group sold coins through late August, and its aggregate position change remained negative, though selling had slowed. Its latest available long-term holder spent-output profit ratio was 0.77 on Sep. 16, meaning coins spent by that group were changing hands below their average acquisition cost. The analysts want the ratio to rise above 1.0 while Bitcoin holds its price, showing that the market can absorb sales from holders taking profits.
Bitfinex identified $87,000–$90,000 as the break-even area for buyers from January whose coins have since aged into the long-term holder group. Its report also put Bitcoin about 12% above the $76,677 True Market Mean and 63% above the $52,785 realized price as of its analysis.
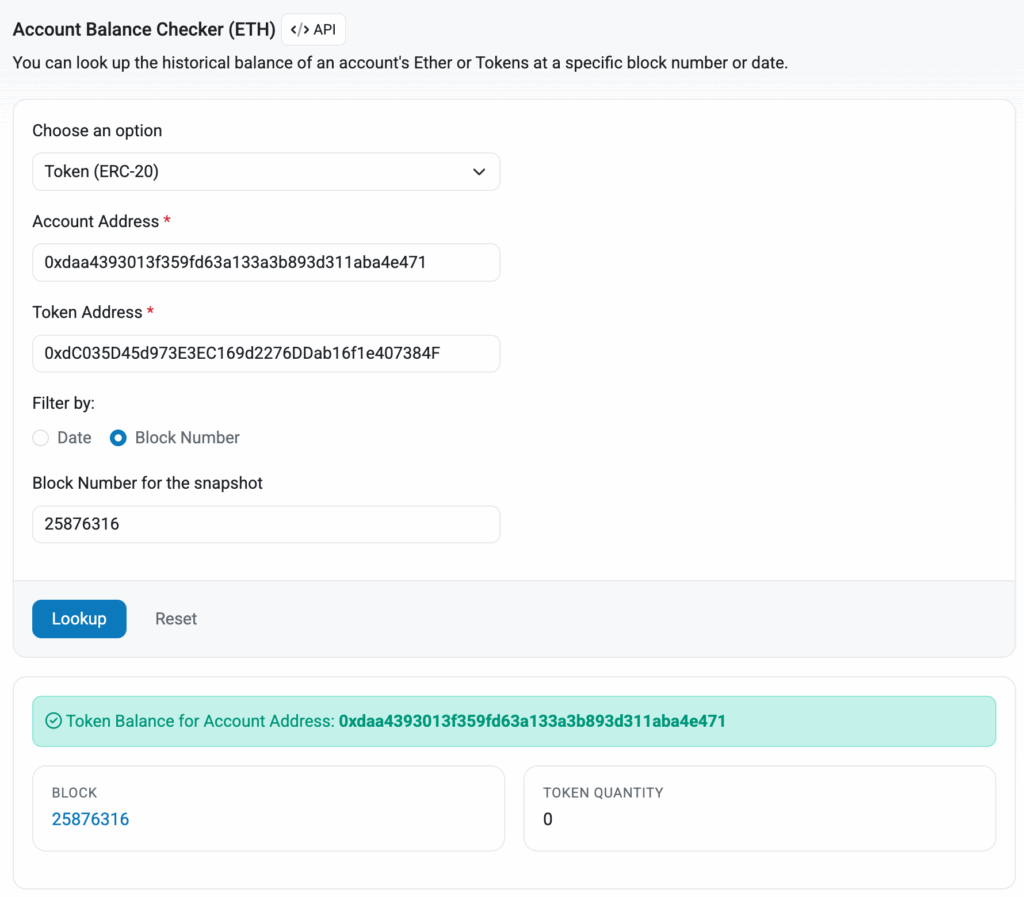
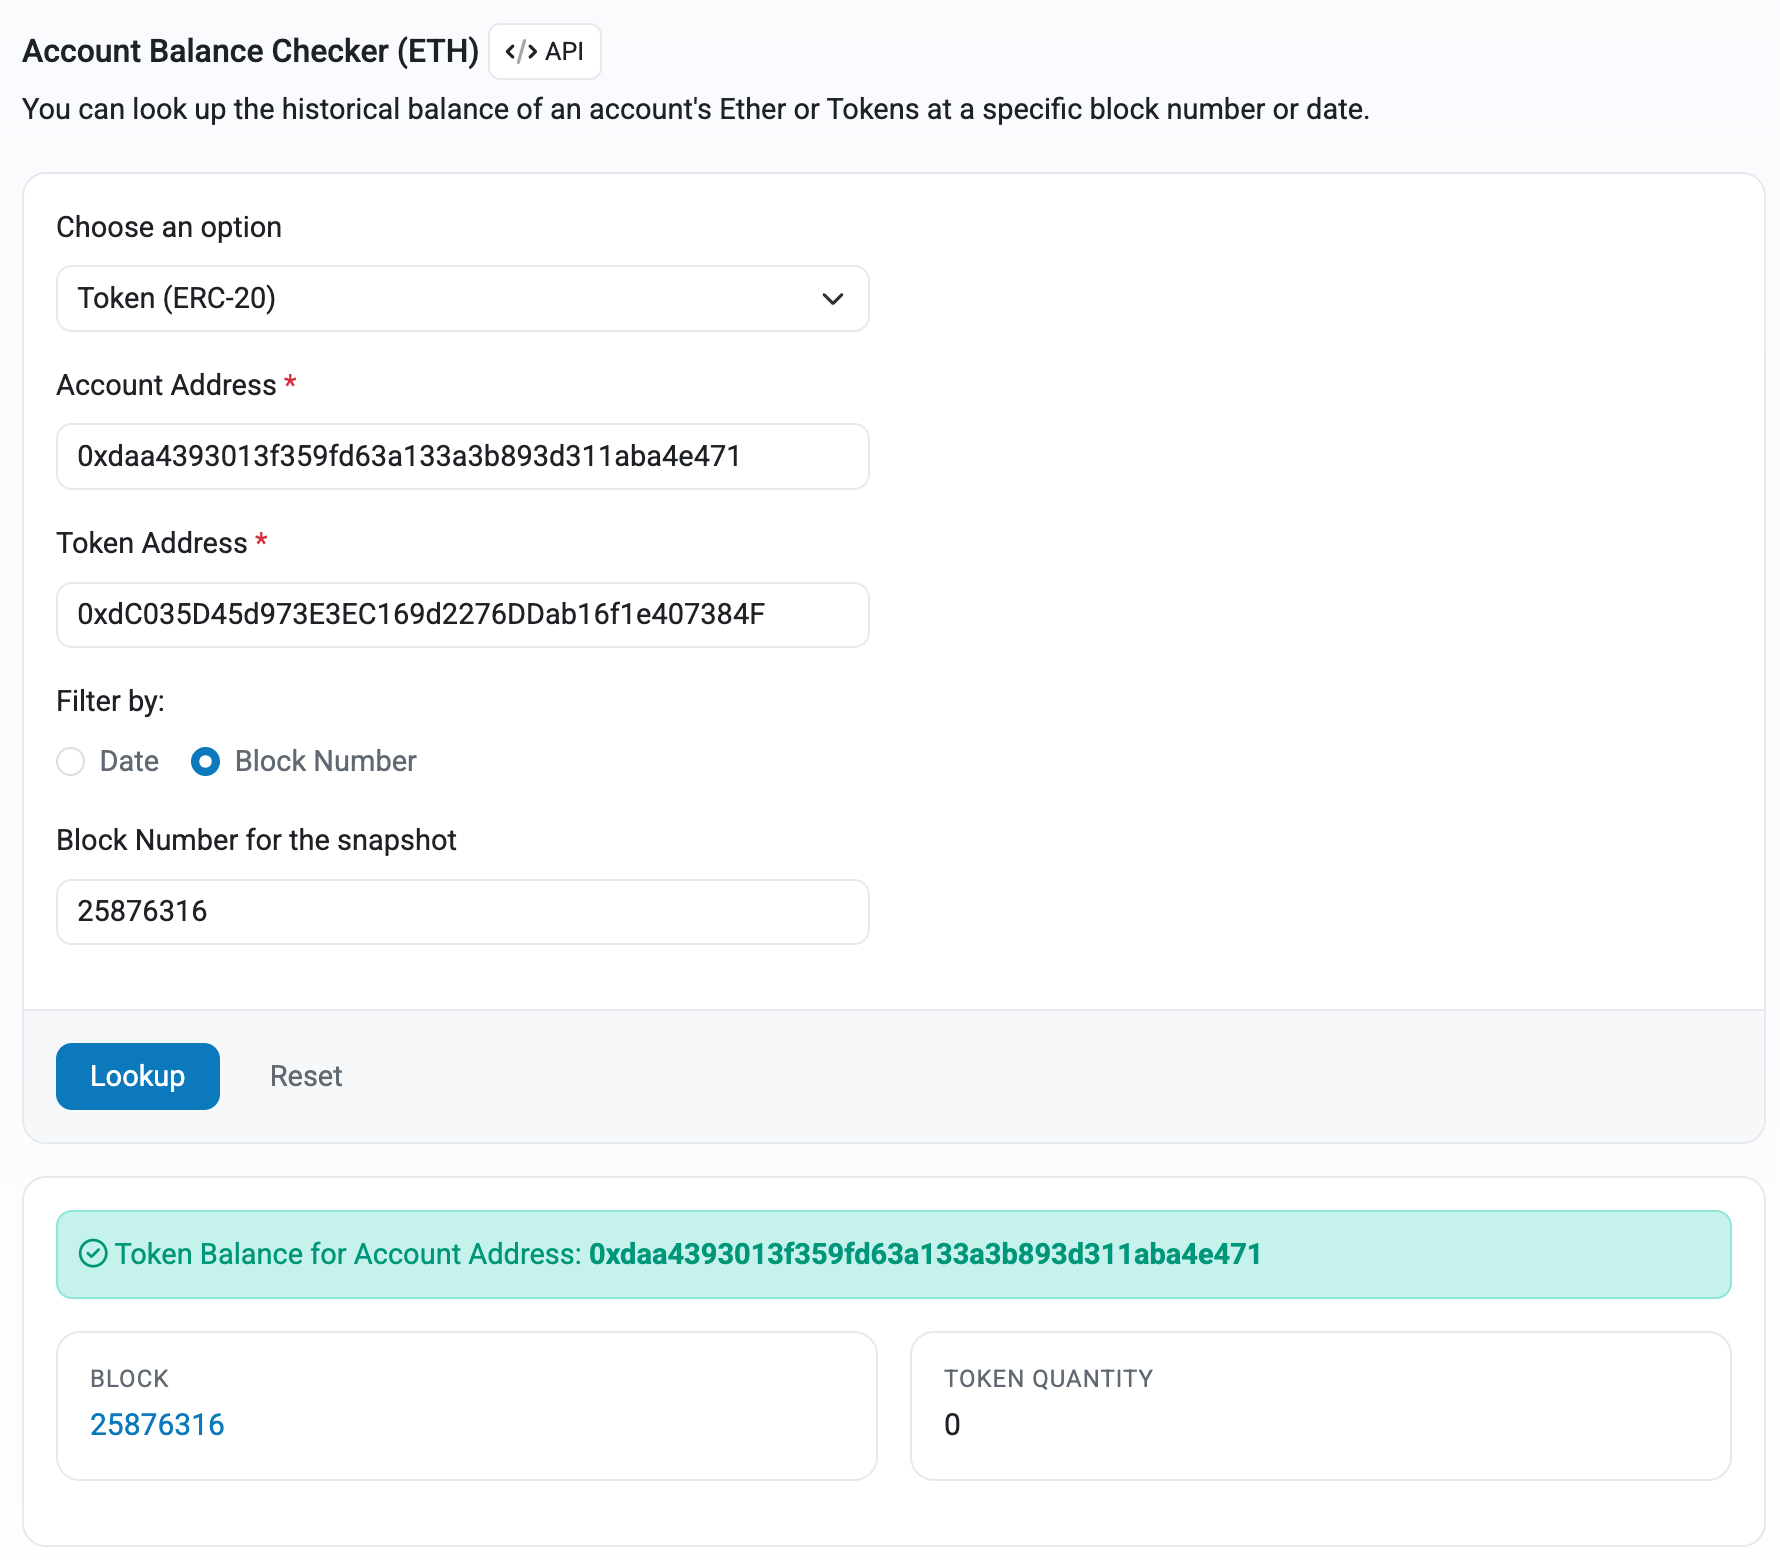
Justin Sun-owned HTX claimed in its September proof of reserves (PoR) that it held 360949.90 USDS in 0xdaa4393013f359fd63a133a3b893d311aba4e471 at a block height of 25876316.
However, that address at that block height actually contained 0 USDS.
The only transaction where this address actually received USDS was at a block height of 25889452. This was on September 2, after the PoR which is dated September 1.
This isn’t the only problem in this PoR.
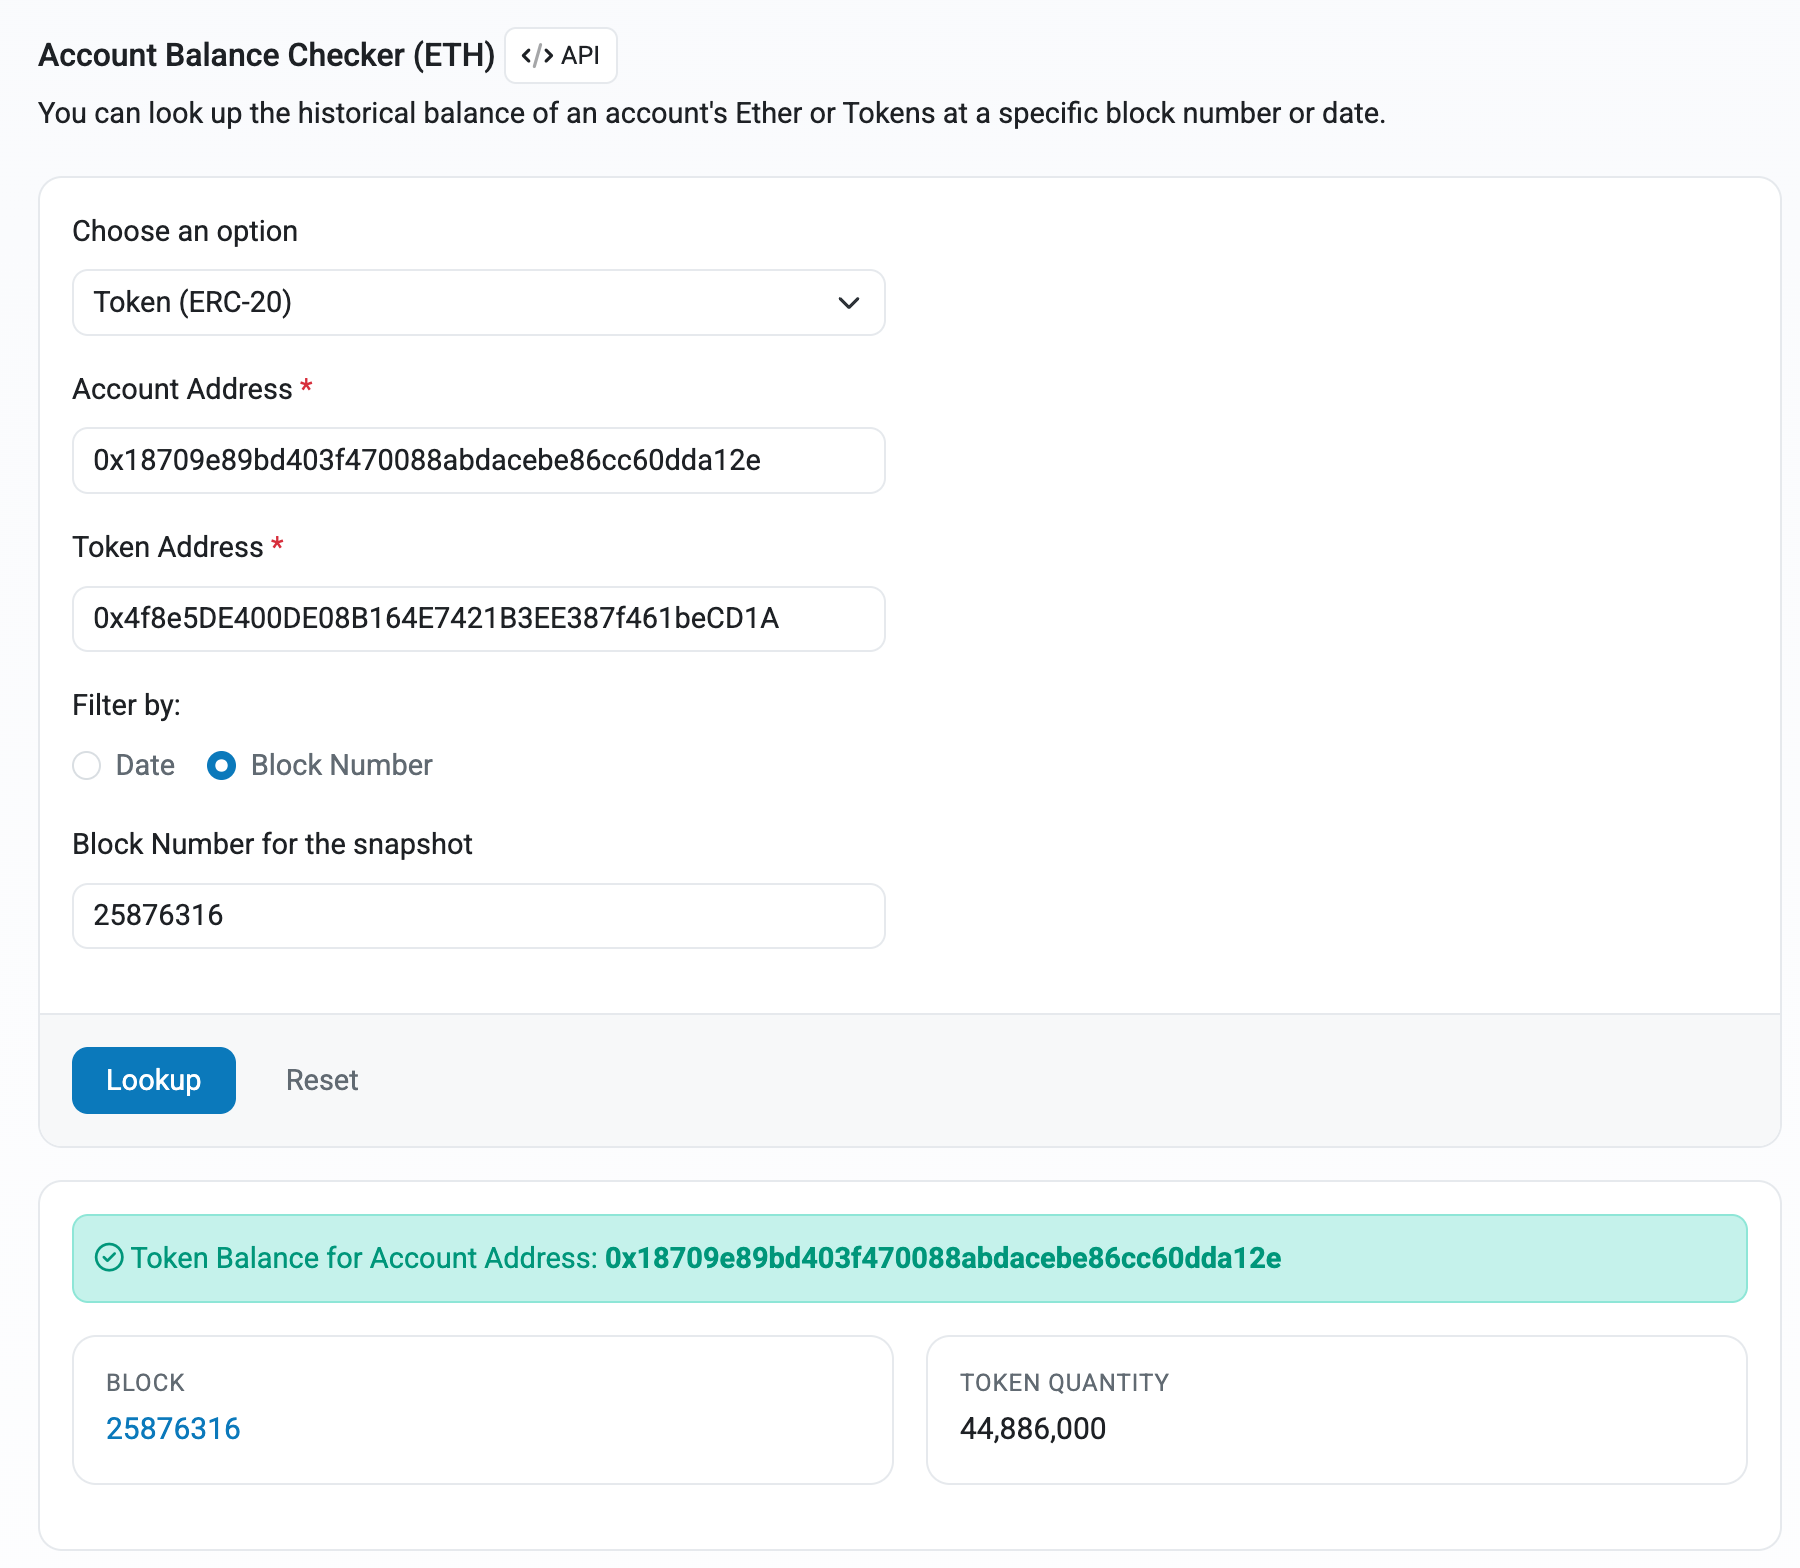
Additionally, it claims that there were 44,975,772.00 of the Sun-founded USDD in 0x18709e89bd403f470088abdacebe86cc60dda12e at a block height of 25876316.
However, this address actually had 44,886,000 USDD in that address at that block height.
Read more: Tether has publicly listed a company that partially controls USDS
These are also not the only mistakes that HTX has made in its PoR historically.
As Protos has previously reported, it previously claimed a certain amount of STEAK-USDC in its May PoR, however it didn’t have any STEAK-USDC in that address at the claimed block height.
However, it did have an equivalent amount of sUSDS in that address, suggesting it had confused its disclosures between these assets.
All of these issues raise serious concerns about HTX’s PoR process, and especially how it makes certain that all assets are matched to liabilities at all times.
Protos reached out to HTX for comment on this discrepancy, but it didn’t respond before publication.
Got a tip? Send us an email securely via Protos Leaks. For more informed news and investigations, follow us on X, Bluesky, and Google News, or subscribe to our YouTube channel.
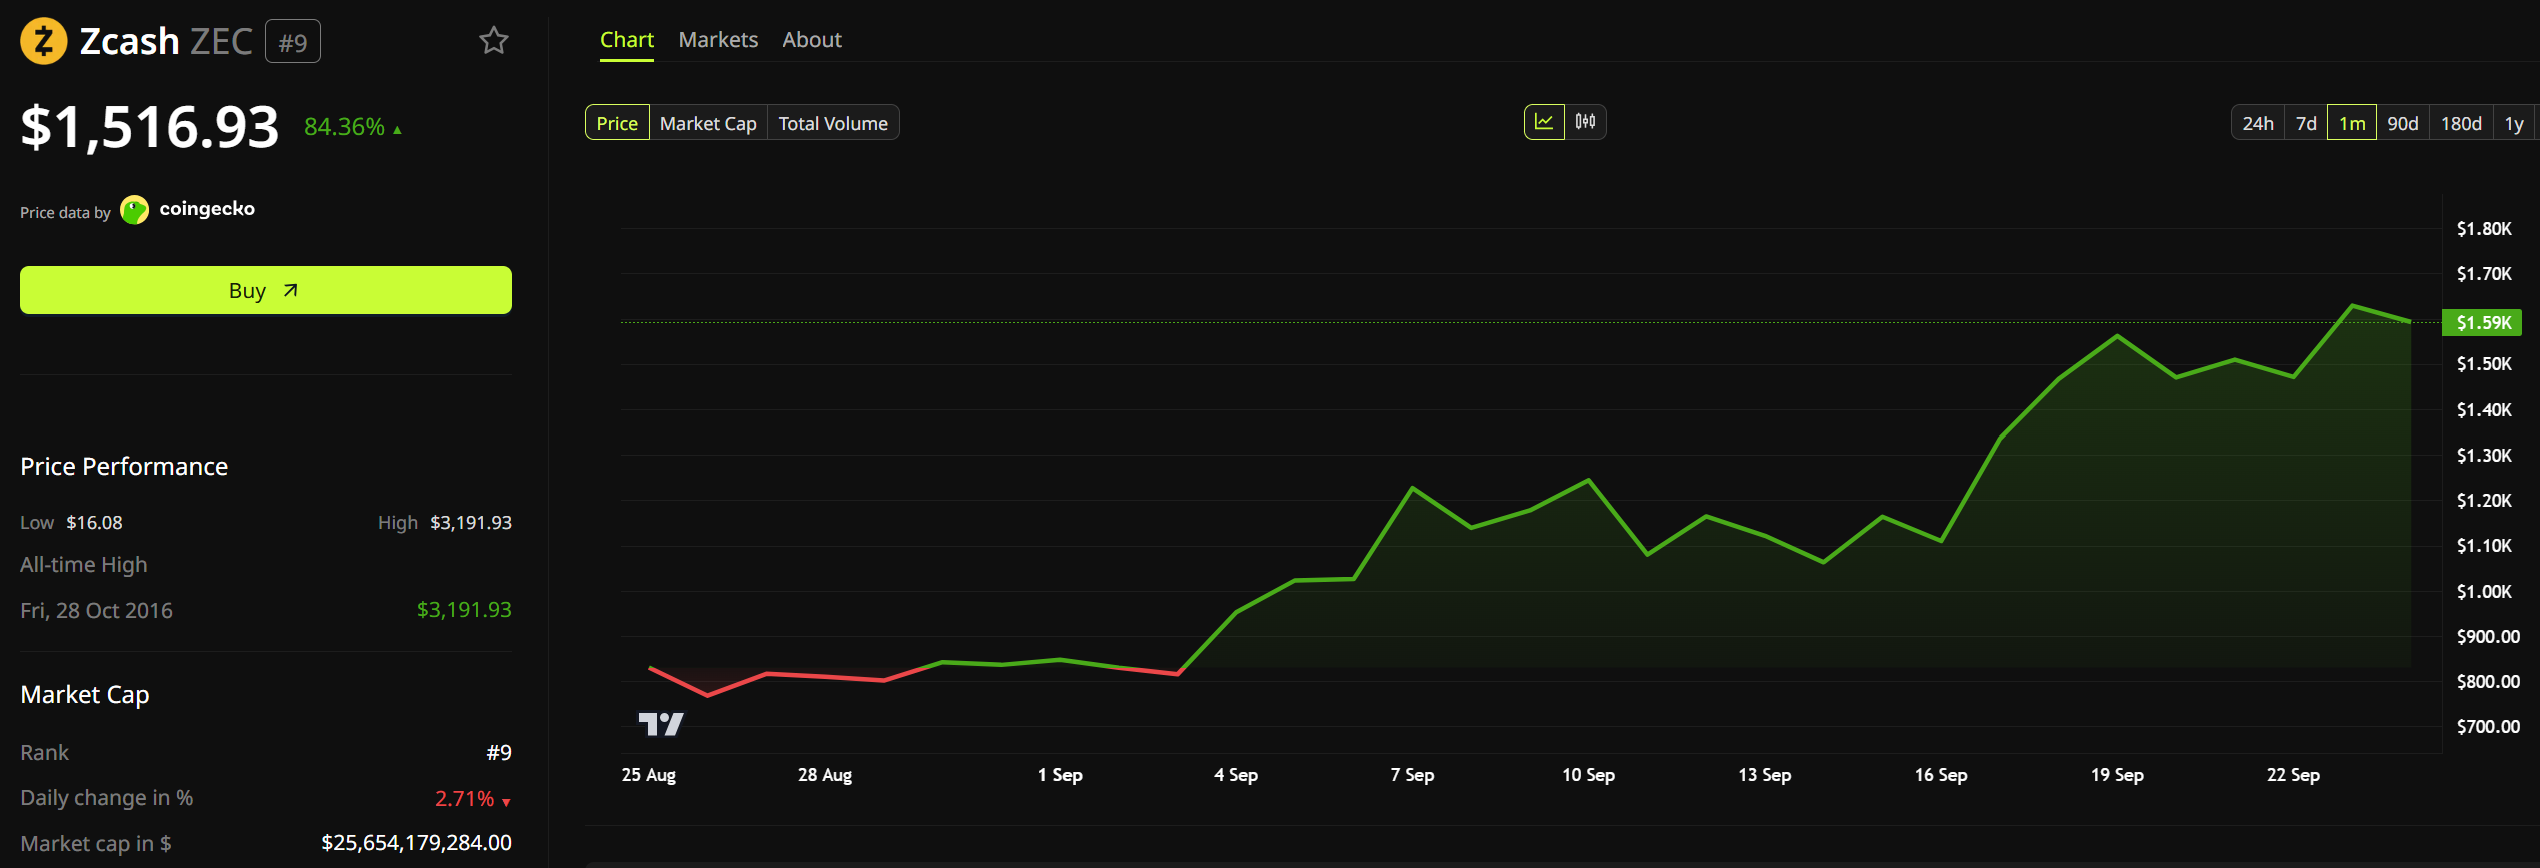
Ledger now lets Zcash (ZEC) holders keep private balances inside its own desktop app, Ledger Wallet. The update lands as ZEC trades 84% higher than a month ago.
Ledger makes hardware wallets, small devices that keep the keys to crypto funds offline. Until now, its users needed a separate third-party app to hold private ZEC.

What Changes for Zcash Holders on Ledger
Zcash offers two kinds of balance:
- A transparent balance is public, like Bitcoin.
- A private, or shielded, balance hides the amounts and addresses involved.
Ledger’s support page says one account can now hold both.
Private funds only appear if they sit in Ironwood, the new privacy pool Zcash launched in July. It replaced the old pool after researcher Taylor Hornby found a flaw there, as covered in the Ironwood upgrade.
Ledger Chief Technology Officer Charles Guillemet said the private data never leaves the user’s computer.
“Privacy here is not a server setting. To keep your shielded balance private, the scanning and the transaction building happen on your machine: your unified viewing key is stored locally and is never shared with anyone, including us,” Guillemet wrote.
A viewing key lets software read a wallet’s private history. Some simpler wallets send it to a server.
However, there are limits. Private ZEC cannot be swapped without first making it public, and the original Nano S cannot run the feature.
An older app from developer Zondax will be pulled on November 5, so its users must move their funds before then.
Where ZEC’s Rally Stands
ZEC traded at $1,516 as of this writing, down almost 3% in the last 24 hours. However, it is up 23% over seven days and over 84% in the last month, ranking ninth by market value.
Money has also flowed into Zcash funds. Zcash exchange-traded funds drew $98.2 million in the week to September 18, the largest weekly ETF inflow among 14 crypto products.

Some backers see more room to run.
ZEC hit a 24-hour high of $1,658.86 before sliding back below $1,530 at the time of writing. Ledger, meanwhile, left the choice to users, asking followers whether they hold ZEC shielded or transparent.
The post Ledger Finally Adds Private Zcash Balances: Will It Extend ZEC Rally? appeared first on BeInCrypto.

Hsin-Ju Chuang, a former partner at crypto venture firm Hack VC, was pronounced dead on Aug. 24 and recently became public after a local newspaper, Hoodline, reported the news this month and circulated on social media.
Her body was found by the California Highway Patrol inside a vehicle in the desert, according to the report.
Chuang, 37, of North Las Vegas, was pronounced dead at the scene at 9:47 p.m. local time last month, a coroner’s release said. The coroner directed further questions to the California Highway Patrol. Authorities have not announced a cause of death, revealed the results of an autopsy, or provided further details about the circumstances, Hoodline said.
The California Highway Patrol spokesperson referred CoinDesk’s request for further comment to the CHP’s Inland Division, which is handling the investigation.
Her death has drawn attention across crypto social media because Chuang, a longtime operator in the crypto industry, published a lengthy X post on Aug. 23, stating that she had rejected a settlement with Hack VC that would have required her to remain silent about her experience at the firm.
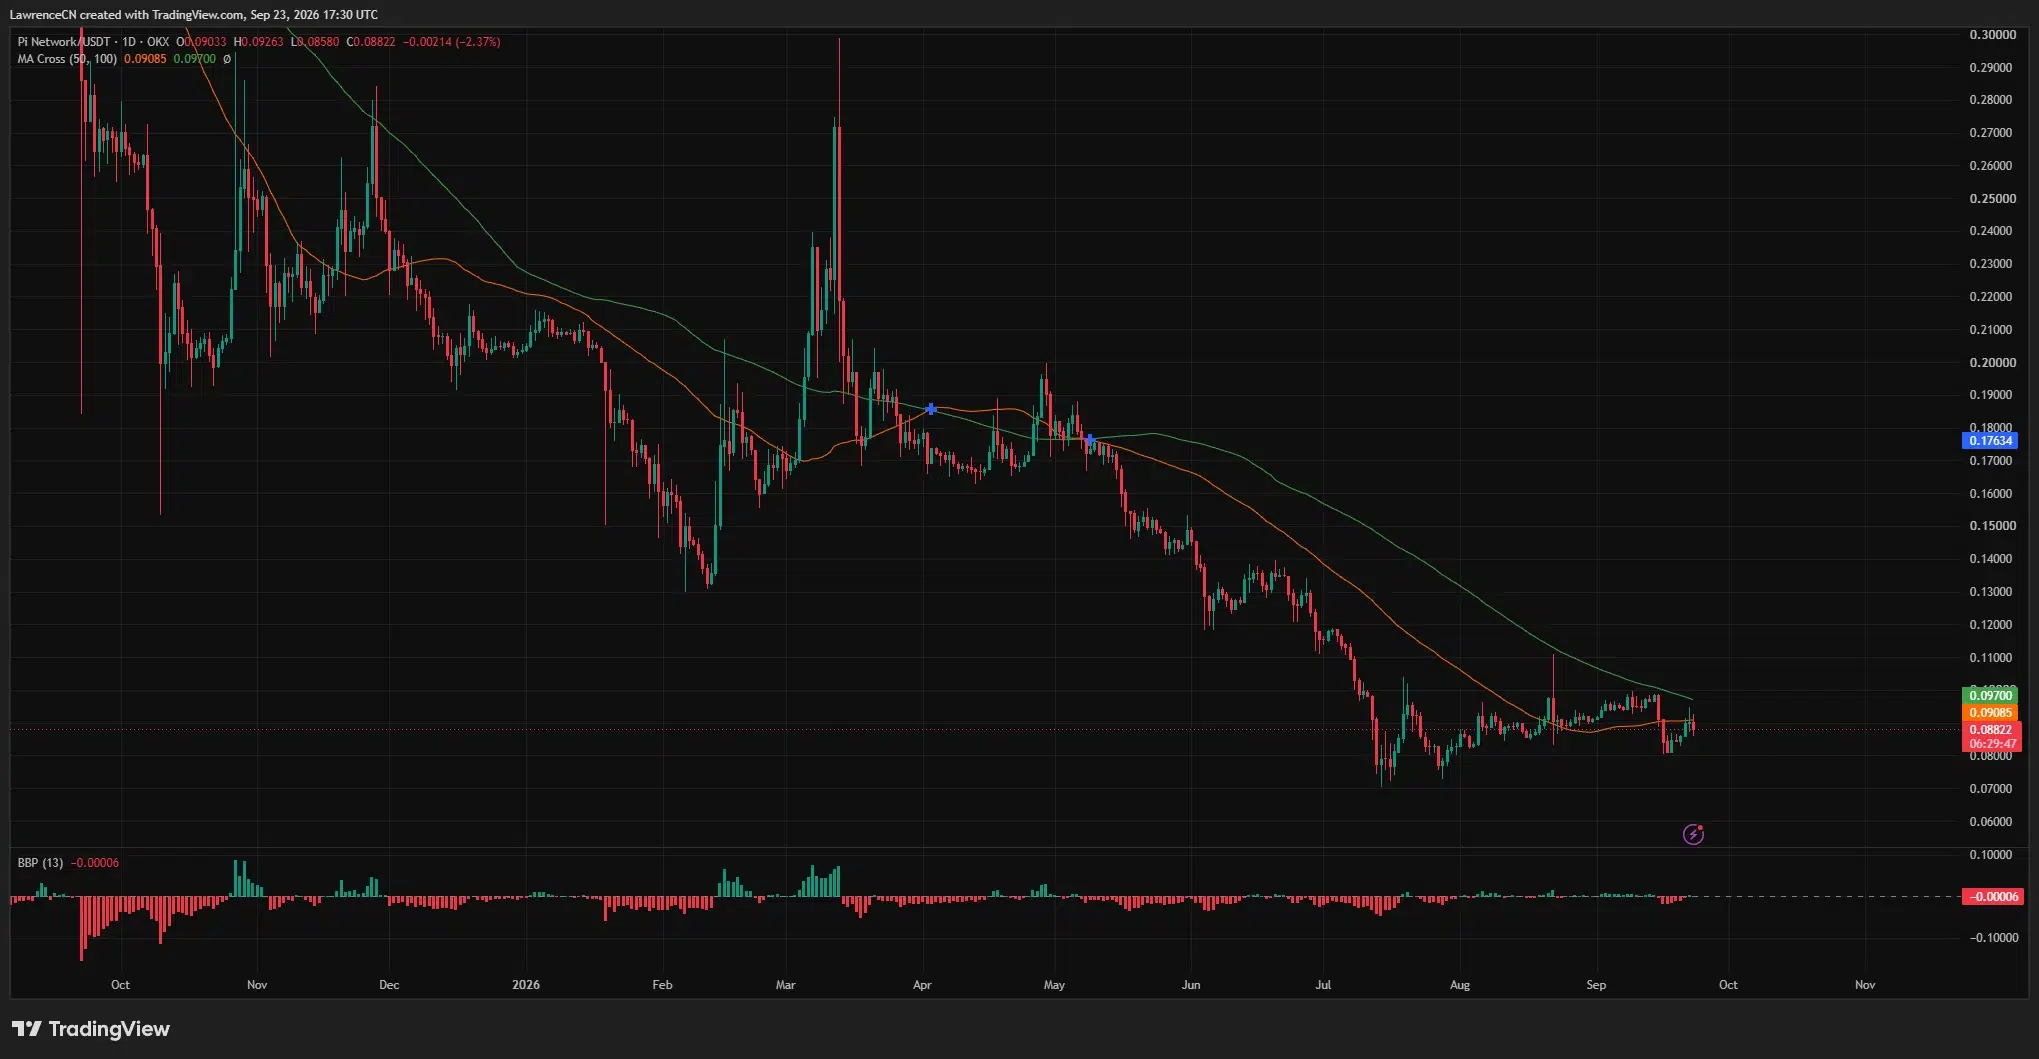
Pi Network price fell back toward $0.088 on Sep. 23 after an intraday move above $0.092 failed to hold. The pullback came as traders weighed recent network upgrades against a daily chart that still shows PI below its main moving averages.
Summary
- Pi Network price traded near $0.0882 after reaching $0.0926 earlier in the daily session.
- The daily 50-day and 100-day moving averages stood near $0.0909 and $0.0970.
- A 4-hour Supertrend level near $0.0861 remained below the price.
- Pi Network said more than 417,000 users can resume identity verification after an account review.
According to the PI/USDT daily chart, the token opened near $0.0903, reached $0.0926, and fell as low as $0.0858 before trading around $0.0882. The move left PI below $0.09 despite a rebound from the session low.
CoinGecko listed PI near $0.0883, down about 0.7% over 24 hours but up roughly 7.3% over seven days. The weekly gain gives the latest decline a different scale from the longer slide visible on the daily chart.
Pi Network price faces a test at $0.0909
The daily chart places PI below its 50-day moving average of about $0.0909 and its 100-day moving average near $0.0970. Both lines slope downward, and the shorter average remains beneath the longer one. PI would first need to recover $0.0909 to challenge the area around $0.0926, where the latest advance stalled.
A move through that range would bring $0.0970 into view. PI traded close to $0.098 during its earlier September rise before losing ground, making the 100-day average a useful level for judging whether a recovery extends beyond a brief bounce.
On the downside, the latest daily low near $0.0858 is the first level to watch. The chart then shows a recent trading area around $0.080 to $0.083. A daily close below that area would put the July lows, near $0.07, back in focus.
The daily Bear Bull Power reading was slightly negative, near −0.00006. Its small size points to limited momentum in either direction at the chart’s latest reading, even though price remains below both moving averages.
A 4-hour rebound is still holding above $0.0861
The shorter timeframe gives buyers one firmer signal. The 4-hour Supertrend line stood near $0.0861, below PI’s price of about $0.0882. PI also recovered after a sharp fall toward $0.081 earlier in the week, then reached the $0.091 to $0.092 area before pulling back again.
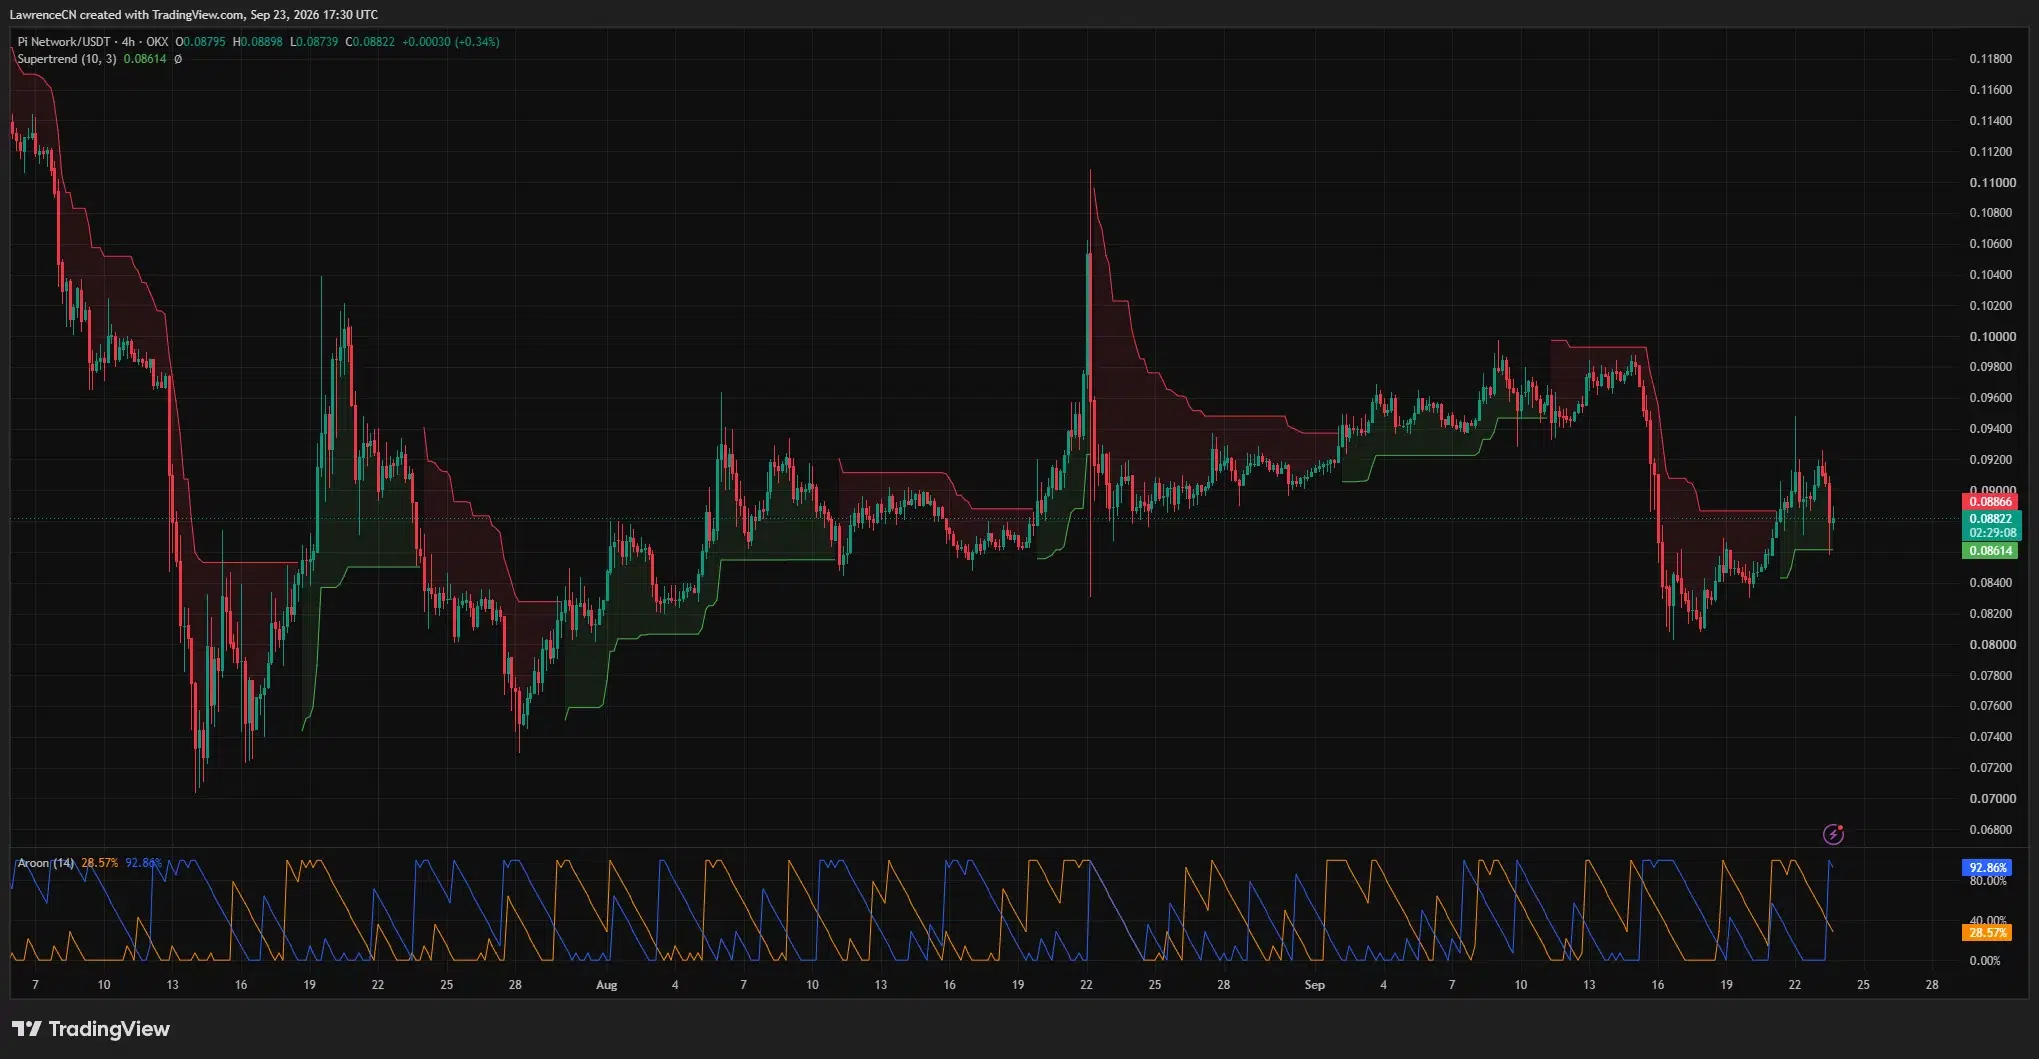
The 4-hour Aroon indicator showed its up line near 92.86% and down line near 28.57%. Those readings reflect a more recent high than low within the indicator’s lookback period. They fit the recovery from this week’s low, though the failed push past $0.092 shows that the rebound has yet to clear nearby resistance.
A sustained break below the Supertrend level around $0.0861 would weaken the short-term setup and expose the $0.083 to $0.081 area. If buyers instead regain $0.09 and close above $0.0926, the daily 100-day moving average near $0.0970 becomes the next larger test. Both paths depend on levels the charts have already shown; neither is a confirmed outcome.
KYC progress brings more users closer to migration
Pi Network said on Sep. 17 that more than 417,000 users previously flagged as possible duplicate accounts can move forward with identity verification. The team also said it planned an update to address a separate issue affecting 497,000 users who were stuck in the migration process. The second group should not be counted as already unblocked.
The project has also been moving through a series of protocol upgrades. Its node page says mainnet nodes must upgrade to Protocol v27. These changes may affect access and network use over time, but the announcements alone do not establish why PI fell during the Sep. 23 session.
Migration also does not automatically mean that newly eligible users will sell tokens. For traders, the measurable near-term question is whether demand can carry PI back above the $0.0909 to $0.0926 resistance range. The token remains more than 97% below its February 2025 peak of roughly $2.99, according to crypto.news’ account of its first year on open mainnet. At the current price, a short-term recovery would still leave that larger decline intact.
For U.S. readers tracking PI, the same chart levels provide a clearer test than the upgrade calendar: $0.0861 is the nearby 4-hour support signal, while a daily move above $0.0909 and $0.0926 would show whether buyers can sustain the rebound.
Disclosure: This article does not represent investment advice. The content and materials featured on this page are for educational purposes only.
Crypto World
Everything You Need to Know About SpaceX’s Wildlife Refuge Land Swap with the Trump Administration

If that mitigates the environmental damage the rocket can do, however, the planned launch cadence exacerbates it. In August, SpaceX founder and CEO Elon Musk told Aviation Week that he envisions daily Starship launches—carrying crew, satellites, and other cargo to space—as early as 2027. More headsnapping was his 2025 boast on X, that “In about 6 or 7 years, there will be days where Starship launches more than 24 times in 24 hours.”
Clearly, not all of those launches could come from the Texas site, but SpaceX has other launch facilities at Vandenberg Space Force Base in California, and dedicated pads at the Kennedy Space Center and the Cape Canaveral Space Force Station in Florida. A company so large, with more than a $2 trillion valuation, could always build more launchpads at more coastal sites whenever it chooses.
What precedent could the SpaceX land swap set?
The Texas base is making news at the moment, not simply for what it means for this potential development site, but for others elsewhere in the U.S. The Trump Administration is currently pursuing a similar land swap with a private land developer, involving a strip of land in Yosemite National Park for an undeveloped parcel in California so that residents in a planned private housing complex near the park will have easier access to it. Yet another land exchange is under consideration that would open up a federally designated wilderness area on Georgia’s Cumberland island to the construction of luxury homes.
Cardano’s native token has been thriving amid the latest green environment, with its valuation climbing to a peak not seen since May.
Naturally, the major ascent has drawn multiple bullish predictions from analysts, but certain elements suggest a correction could also be in the cards.
The Next Upward Move?
As of press time, ADA is worth around $0.25, up about 30% in a week. X user CW claimed that the asset is showing an accumulation signal while gradually rising.
“Accumulation is taking place at the current level. It is gathering energy for its next upward move. MACD and EMA trends are forming a bullish momentum,” they added.
For his part, Jesse Olson argued that Cardano’s cryptocurrency has flipped “ultra bullish” on the daily chart, with the price breaking above a vital zone and continuing to make higher highs and higher lows. Shortly after, the analyst estimated that ADA has a pending buy signal on the weekly chart, noting that it hasn’t been bullish on the seven-day timeframe in 14 months.
More Crypto Online also weighed in, saying the token continues to follow a specific bullish price channel and setting $0.315 as the next target to watch.
Somewhat expected, X user Sssebi, who has issued optimistic price predictions even when ADA traded at much lower levels over the past several months, couldn’t stay silent amid the rally. They simply claimed the token could do “something really crazy” without providing a specific target.
Those who want to explore additional forecasts can read our detailed article here.
Short Setup?
X user Mork differentiated themselves from the overall bullish sentiment, describing ADA as one of their favorite short setups right now. The market observer noted the asset’s strong recent performance but said they won’t rush to chase the first move away from resistance.
“I’m waiting for another move into the level. If buyers don’t step in there, I’ll take a closer look at the short,” they said.
Meanwhile, ADA’s Relative Strength Index (RSI) suggests that the asset may indeed experience a short-term correction. The ratio has risen into overbought territory above 70, meaning the price has soared too much in a short period, and it might be time to cool off. Conversely, readings below 30 are usually interpreted as buying opportunities.

The post Top Cardano Price Predictions as ADA Explodes 30% in a Week appeared first on CryptoPotato.

How the emojis and fashion choices of Germany’s far-right supporters get around the ban on Nazi symbolism

Beats 360 Reviews Find $350 Over-Ears With Swappable Cups, IPX4 and Stronger Noise Cancel

Bitcoin Recoils Below $86,000: Is Bitcoin Price Prediction Still Shooting For $90,000?




-

 Fashion5 days ago
Weekend Open Thread: Talbots – Corporette.com
-

 Tech3 days ago
Researchers escape OpenAI Codex sandbox to run commands on host
-

 Crypto World5 days ago
Circle launches Arc Studio AI agent for building onchain apps
-
 NewsBeat5 days ago
Trump says US has reached an agreement to take permanent control of Greenland’s security
-

 Crypto World3 days ago
Who Needs CLARITY Anyway? ARB Could See 70X Increase: Hodler’s Digest
-

 Crypto World5 days ago
Trading Bitcoin on Robinhood? Why 2% Spread Has Traders Worried
-
 Crypto World5 days ago
Bitcoin price breaks channel as RSI climbs to 63
-

 Crypto World6 days ago
Mortgage and refinance interest rates today, Thursday, September 17, 2026
-
 Crypto World21 hours ago
Goldman Sachs and Deutsche Bank Agree: The S&P 500 Rally Isn't Over
-

 Crypto World7 days ago
US Charges Robinhood Engineers Over Crypto Listing Trades
-

 Tech2 days ago
Google’s $899 Googlebook is a bet that you’ll buy a new laptop for Gemini
-

 Business3 days ago
Analog Devices (ADI) Bets $1.35 Billion on Chips that Let Machines Think for Themselves
-

 Crypto World3 days ago
Coinbase, Robinhood, Circle Seen as Tokenized-Stock Winners
-

 Crypto World5 days ago
Silver prices recover quickly, hitting weekly high today
-

 Crypto World5 days ago
World Money launches in 150+ countries with Stripe
-

 Tech6 days ago
GPT-6 Astra Reached the Nether in Minecraft, Lost Its Stash to a Creeper, and Farmed Potatoes for Hours
-

 Tech4 days ago
Trump suggests rebranding AI with a new name, says he’s also creating an AI Force
-
 NewsBeat5 days ago
US was ‘on brink of war’ with China over false AI report of nukes moving in Middle East
-
 Business18 hours ago
Oil Price Today (September 23): Crude oil below $100 on hopes of US-Iran talks. What did Trump say?
-
 Crypto World3 days ago
Bitcoin price holds above $81K as key catalysts line up
You must be logged in to post a comment Login