
Crypto World
STON.fi Brings Bitcoin and Ethereum to TON DeFi


STON.fi, one of the leading AMM protocols on The Open Network (TON), announced that TON-native representations of Bitcoin (BTC) and Ethereum (ETH) are now available within the ecosystem in a fully non-custodial DeFi format.
The integration gives TON users direct access to the two largest crypto assets, including the ability to swap them and provide liquidity, while maintaining full control over their funds.
BTC and ETH are represented on TON as wrapped assets issued in TON-native format, each fully backed 1:1 by the underlying tokens and managed through smart contracts. Ethereum is available as wrapped ETH (WETH), while Bitcoin is accessible via cbBTC, a Bitcoin-backed token issued by Coinbase and fully collateralized with BTC on a one-to-one basis. This structure allows both assets to be used across decentralized applications within TON ecosystem without interacting directly with their native blockchains.
Through STON.fi, users can deploy WETH and cbBTC across TON DeFi, including swapping and providing liquidity via WETH/USDt and cbBTC/USDt pools. At the same time, Omniston, STON.fi’s liquidity aggregation protocol, enables swaps to WETH and cbBTC from any TON-native token, routing liquidity across the ecosystem. Applications integrated with Omniston instantly gain access to WETH and cbBTC liquidity, enabling swaps across hundreds of TON-based dApps without additional integrations and expanding the range of available DeFi strategies within the ecosystem.
“Bringing BTC and ETH into TON DeFi is about expanding real utility, not just asset coverage,” said Slavik Baranov, CEO of STON.fi Dev. “This launch enables users to actively use Bitcoin and Ethereum inside TON ecosystem rather than holding them passively. By making these assets usable in TON-native DeFi, we’re strengthening the overall depth of the ecosystem.”
As TON continues to develop as a blockchain closely integrated with Telegram — a messenger used daily by hundreds of millions of people — access to major crypto assets directly within Telegram-native and TON-based applications has become a natural part of the ecosystem’s evolution. Bitcoin and Ethereum sit at the core of the global crypto economy, and their availability on TON allows users to access these assets directly within the apps they already use, without leaving the ecosystem, through decentralized and permissionless infrastructure.
To learn more about how WETH and cbBTC integration works on STON.fi, users can visit: https://ston.fi/eth-ton and https://ston.fi/btc-ton.
About STON.fi
STON.fi is one of the leading non-custodial swap dApps and a suite of swap-enabling protocols within The Open Network (TON) ecosystem, known for its deep liquidity, wide token coverage, and dominance in total value locked (TVL) and trading volume. With over $6.8 billion in total trading volume and more than 31 million operations, STON.fi dominates TON DeFi ecosystem in token coverage, liquidity depth, and active user participation. Backed by top investors such as CoinFund, Delphi Ventures, The Open Platform, Karatage, TON Ventures, and others, STON.fi continues to advance decentralized finance through open development and innovations such as Omniston — a decentralized liquidity aggregation protocol.

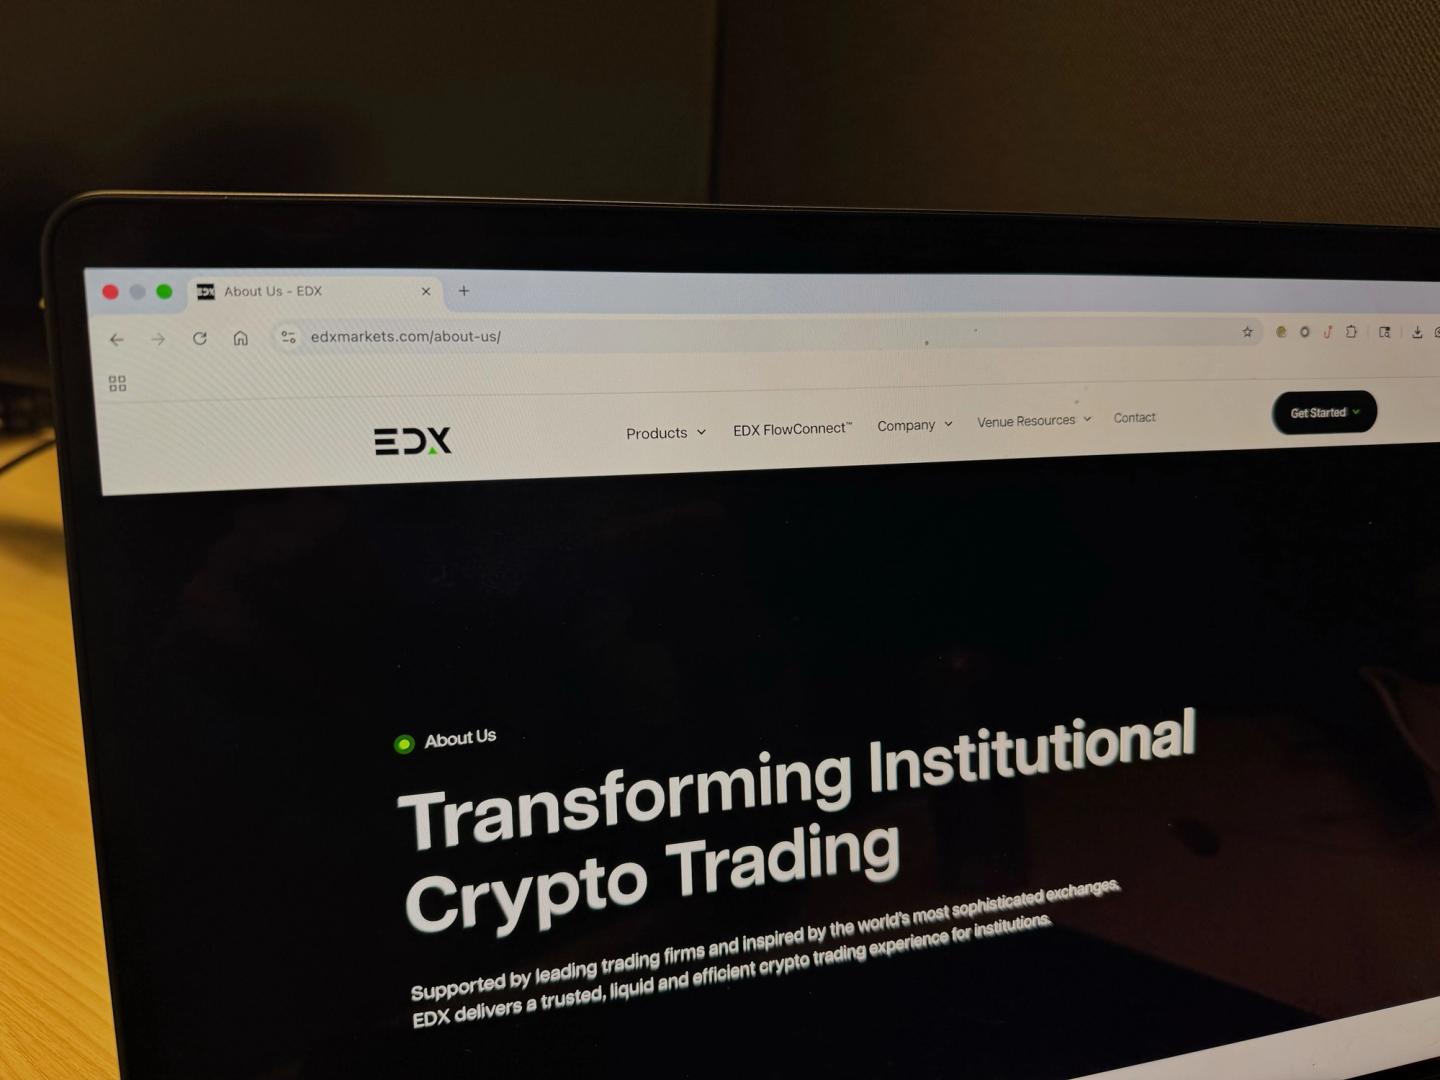

EDX Markets, the crypto exchange backed by Citadel Securities, has applied for a national trust bank charter, marking a new step in its push to serve institutional clients.
The exchange submitted its filing to the Office of the Comptroller of the Currency on Wednesday, according to documents seen by CoinDesk. The move comes about three and a half years after the firm launched.
If approved, the charter would allow EDX to offer custody, asset management and principal trading services, while continuing to run its core order-matching platform. The filing outlines a structure where custody and settlement sit within a regulated trust entity, separate from trading operations.
EDX Markets targets traditional finance firms entering digital assets. Its backers include Fidelity Digital Assets and Charles Schwab Corp, alongside Citadel Securities. The platform went live in the summer of 2023 with four cryptocurrencies: bitcoin , ether (ETH), and bitcoin cash (BHC). It has since expanded to include 17 additional tokens.
“EDX Trust is a key step in bringing traditional market structure to digital assets,” CEO Tony Acuña-Rohter told CoinDesk. “By separating custody and settlement into a regulated trust, we’re building the kind of infrastructure banks and institutional investors expect as they scale into the space.”
EDX is not alone in seeking this type of regulatory footing. Several crypto firms have applied for and received trust bank charters in recent years, using them to offer custody and other services under U.S. oversight. These approvals have become a key pathway for firms looking to attract institutional capital.
Competition for those clients has intensified. Large asset managers and trading firms want platforms that mirror the safeguards and structure of traditional markets. In practice, that can mean segregated custody, clear settlement processes and regulated entities that reduce counterparty risk. For exchanges like EDX, securing a trust charter could help bridge that gap.

Bitcoin treasury holders have faced a renewed wave of scrutiny as market stress spread through the sector. Nakamoto (NAKA), a prominent crypto treasury company, disclosed March sales that locked in losses, a signal that broader capital discipline could intensify in the coming weeks. The disclosures come on the heels of a difficult year for digital-asset treasuries, marked by a collapse in net asset value premiums and a downbeat price environment that preceded a notable market downturn in October 2025.
In its latest disclosures, Nakamoto revealed a March sale of 284 BTC for roughly $20 million, implying a sale price near $70,000 per coin. The firm also reduced its stake in Metaplanet by divesting shares at a loss. End-2025 figures show Nakamoto’s BTC treasury at 5,342 coins, with a fair value of about $467.5 million and a quarterly fair-value loss of $166.1 million, according to the company’s 10-K filing with the U.S. Securities and Exchange Commission.
The broader crypto treasury space has faced mounting headwinds. A period of deteriorating NAV premiums for digital asset treasuries persisted into the third quarter of 2025, and equity prices of related treasury vehicles declined even before the October 2025 market crash that underscored a protracted bear cycle and the ensuing downturn in crypto prices. These dynamics underscore a sector-wide struggle to manage reserves amid volatile asset prices and tightening capital conditions.
Key takeaways
- Nakamoto sold 284 BTC in March for about $20 million, a move that appears to have been executed around $70,000 per BTC and coincided with other treasury adjustments, including a loss-laden stake reduction in Metaplanet.
- The company’s year-end 2025 10-K shows 5,342 BTC valued at $467.5 million, accompanied by a $166.1 million Q4 loss on the fair value of its crypto holdings.
- The crypto treasury space experienced a notable drop in NAV premium strength during Q3 2025, a trend that predated the October market crash and helped set a challenging backdrop for treasury managers.
- MAR A, another bitcoin miner turned treasury holder, disclosed a March sale of 15,133 BTC—valued at more than $1 billion—to retire about $1 billion in convertible debt, signaling a tactical liquidity move rather than a wholesale shift away from treasury holdings.
- Industry observers warn of potential contagion risk if more treasuries respond to stress with further sales, especially amid macro pressures and regional conflicts that could weigh on BTC price action.
Nakamoto’s March dispositions and what they signify
According to Cointelegraph’s coverage of Nakamoto’s activities, the March sale of 284 BTC for roughly $20 million demonstrated a realized loss relative to prior valuation and raised questions about the persistence of losses across digital-asset treasuries. The firm also reduced its exposure to Metaplanet by offloading shares at a loss, a move that points to broader capital-allocation considerations rather than an outright pivot away from crypto reserves. The combination of these actions illustrates how treasuries are navigating a high-volatility environment where mark-to-market losses can quickly accumulate, even as some holdings remain substantially valuable on an on-paper basis.
End of year 2025 reporting reinforces the scale of Nakamoto’s holdings and the accompanying valuation pressures. The 10-K shows Nakamoto’s 5,342 BTC reserve valued at $467.5 million, with a $166.1 million loss recorded in the fourth quarter on the fair value of digital assets. That quarterly loss aligns with a period when the broader digital-asset sector faced multiple crosscurrents—ranging from wavering demand for treasuries to insurance and financing costs that increased as prices fell from their late-2025 peaks. For readers tracking treasury performance, the 10-K filing offers a concrete snapshot of how market moves translated into reported losses even when long-term holdings remained substantial.
Market context during this period was nuanced. The crypto treasury space had already seen a squeeze on premium valuations in Q3 2025, a trend that predated a broader sell-off and the October market downturn. Analysts argued that a weaker macro and continued volatility could pressure treasury portfolios further, possibly triggering more sales as treasuries attempt to rebalance risk and maintain liquidity during stressed periods. In this backdrop, Nakamoto’s March actions read as a data point in a broader recalibration across the sector rather than an isolated event.
MARA’s March BTC sale: a tactical adjustment rather than capitulation
In a parallel development, MARA—the Bitcoin mining company that also holds a substantial treasury position—disclosed a March sale of 15,133 BTC valued at more than $1 billion. The purpose was to repurchase and retire approximately $1 billion in convertible debt, a move the firm framed as a strategic, short-term liquidity measure rather than a fundamental shift in its treasury strategy. Robert Samuels, MARA’s vice president for investor relations, emphasized that the sale did not indicate a plan to liquidate the majority of its reserves and that the company may buy or sell BTC from time to time based on market conditions and capital-allocation priorities.
The March sale underscores a recurring theme among large treasury holders: the balancing act between deleveraging, maintaining liquidity, and preserving upside exposure to Bitcoin’s longer-term fundamentals. While MARA’s disclosure signals a tactical debt-management objective, it also highlights how treasury activity can be driven by corporate financing needs as much as by crypto-market cycles. For investors and watchers, such moves can be a useful barometer of corporate risk tolerances and the appetite for risk transfer during periods of volatility.
What the ongoing dynamics mean for investors and builders
From an investor perspective, the Nakamoto and MARA disclosures illustrate that even sizable treasury positions are not immune to price volatility and reallocation pressures. The March activity—especially Nakamoto’s significant BTC disposition and Metaplanet stake reduction—adds to a broader narrative about treasury strategy in a regime of rising macro and geopolitical uncertainty. The end-2025 valuations and the quarterly losses documented in the 10-K filings serve as a reminder that mark-to-market moves can erode reported profitability even when blockchain-related assets retain strategic value for the long term.
For traders and builders in the ecosystem, the implications extend beyond single-company moves. The observed NAV premium collapse in Q3 2025 suggested a broader mispricing in crypto-treasury vehicles, a dynamic that can influence funding conditions for new projects, credit lines for miners, and the willingness of traditional finance partners to engage with digital-asset treasuries. With the October 2025 price action illustrating a sharper turn in risk sentiment, observers will be watching whether the sector stabilizes or continues to reprice risk as companies navigate debt maturities, liquidity needs, and potential further sales from treasuries under strain.
In the near term, market watchers should stay alert to several indicators. First, any additional treasury actions from major holders could signal shifting risk tolerance or liquidity pressures. Second, updates to NAV premium trends and the health of associated debt instruments will help gauge the sector’s resilience. Finally, BTC price dynamics—especially around macro- and regional risks—will influence whether treasury holders can avoid a self-reinforcing cycle of losses and forced sales.
As the sector processes these developments, readers should monitor forthcoming earnings and regulatory disclosures for more clarity on how treasuries are being managed in a volatile environment. The March disclosures from Nakamoto and MARA, alongside the 10-K filings, offer concrete data points for assessing whether the current period marks a turning point or a short-lived adjustment in a longer-cycle evolution of crypto treasuries.
Readers can refer to the original reporting for deeper detail on the specific transactions: Nakamoto’s March BTC disposition and Metaplanet stake sale were covered in Cointelegraph’s coverage of the event, while the formal debt-reduction move by MARA was outlined in their SEC filings. The broader market context—DAT market pressures, NAV premium movements, and the October 2025 price shock—has been discussed across multiple industry analyses and related Cointelegraph coverage.
The story remains fluid: as treasuries recalibrate their portfolios, investors should watch how new pricing, debt-financing needs, and macro conditions shape the next round of treasury activity and potential contagion dynamics within the sector.


Paradigm is building a pro‑grade prediction market terminal, eyeing an internal MM unit and S&P‑style index product as Kalshi’s valuation jumps to $22B on surging volumes.
Summary
- Paradigm is developing a professional-grade prediction market terminal targeting institutional traders and market makers.
- The firm is also exploring an internal market-making unit and an index product bundling multiple event markets, similar to the S&P 500.
- Paradigm, already a major backer of Kalshi, led a $1 billion round valuing the platform at $11 billion.
Paradigm is building a dedicated prediction market trading terminal aimed squarely at professional traders and market makers, in one of the clearest signs yet that real‑money event markets are being treated as an emerging asset class rather than a curiosity. The project, led by Paradigm partner Arjun Balaji and initiated in late 2025, is designed to give sophisticated users Bloomberg‑style tools to trade, analyze and route liquidity across a growing ecosystem of on‑chain and regulated prediction platforms, according to a recent report in Fortune.
The San Francisco‑based crypto investment firm is simultaneously weighing the launch of an internal prediction market‑making business, while working with researchers on a “prediction market index” that would package multiple event contracts into a single, tradable structure, explicitly modeled on benchmarks such as the S&P 500. Such an index could mirror earlier experiments with volatility and DeFi indices, and follows a broader wave of venture capital interest in the sector; one recent Forbes analysis noted that prediction market startups attracted $3.7 billion in new capital and “minted young billionaires at Polymarket and Kalshi” as trading volumes exploded.
Paradigm has already begun aggregating prediction market data into a public panel, a necessary precondition for any institutional‑grade terminal product. The firm is also one of the most aggressive financiers of regulated prediction venue Kalshi: in December 2025, Kalshi announced a $1 billion Series E funding round at an $11 billion valuation, led by Paradigm and joined by Sequoia, Andreessen Horowitz, ARK Invest and others, doubling its value in under two months, as first reported by TechCrunch and corroborated by company statements.
That bet has continued to pay off. A subsequent funding round reported in March 2026 lifted Kalshi’s valuation again, to $22 billion, after a further $1 billion raise, according to coverage compiled by Yahoo Finance and The Wall Street Journal. As prediction markets move from sub‑$100 million monthly volumes in early 2024 to more than $13 billion by the end of 2025, according to research cited by Forbes, the emergence of a dedicated Paradigm‑backed terminal, internal liquidity provision and index products suggests the asset class is being refashioned into financial infrastructure, rather than treated as a sideshow to spot crypto.


Deepcoin is the first centralized exchange to integrate Polymarket event contracts, syncing quotes, liquidity and clearing so users can trade real‑world events with CEX tooling.
Summary
- Deepcoin has launched synchronized “Event Contracts” in partnership with Polymarket, becoming the first centralized exchange to plug directly into its markets.
- The integration offers real‑time quotes, shared liquidity and unified clearing, letting users trade Polymarket‑style contracts with CEX speed and tooling.
- Deepcoin says it will keep refining the product toward a more “pure and professional” event‑trading experience tied to real‑world outcomes.
Cryptocurrency exchange Deepcoin has entered a formal partnership with prediction market platform Polymarket to launch “Event Contracts,” marking the first time a centralized exchange has integrated directly with Polymarket’s real‑money event markets. Announced on April 1, the tie‑up allows Deepcoin users to access “real quotes and liquidity support synchronized with global top event markets” while trading through standard exchange accounts, according to a company statement reported by ChainCatcher.
Under the new structure, both sides have implemented “deep integration of underlying logic and clearing synchronization,” so that positions taken via Deepcoin are effectively mirrored one‑for‑one with corresponding Polymarket contracts. This design means users can “directly participate in popular contracts on Polymarket through their Deepcoin accounts, enjoying CEX trading speed” and order‑book style execution that aligns with “professional trading habits,” the exchange said.
Deepcoin framed the launch as the first step in building out a dedicated, institutional‑grade venue for real‑world event trading. The platform stated it would “continue to refine its products in the future to create a more pure and professional trading experience,” signaling plans to iterate on contract design, risk management and user analytics as volumes scale. By routing demand from a centralized venue into on‑chain prediction markets, the partnership effectively opens CEX rails into a segment historically dominated by niche DeFi interfaces and bespoke OTC flows.
The move lands just as regulated event markets and decentralized prediction protocols are drawing heightened attention from both venture capital and regulators. In March, Kalshi’s latest financing pushed its valuation to $22 billion as demand for macro and political contracts surged, according to coverage compiled by Yahoo Finance, while a recent Forbes analysis described prediction markets as “on the cusp of becoming core financial infrastructure” amid rising institutional interest. At the same time, U.S. Commodity Futures Trading Commission enforcement director David Miller has warned that insider‑trading laws apply fully to prediction markets, underscoring the compliance pressure that CEX integrations like Deepcoin’s will have to navigate.
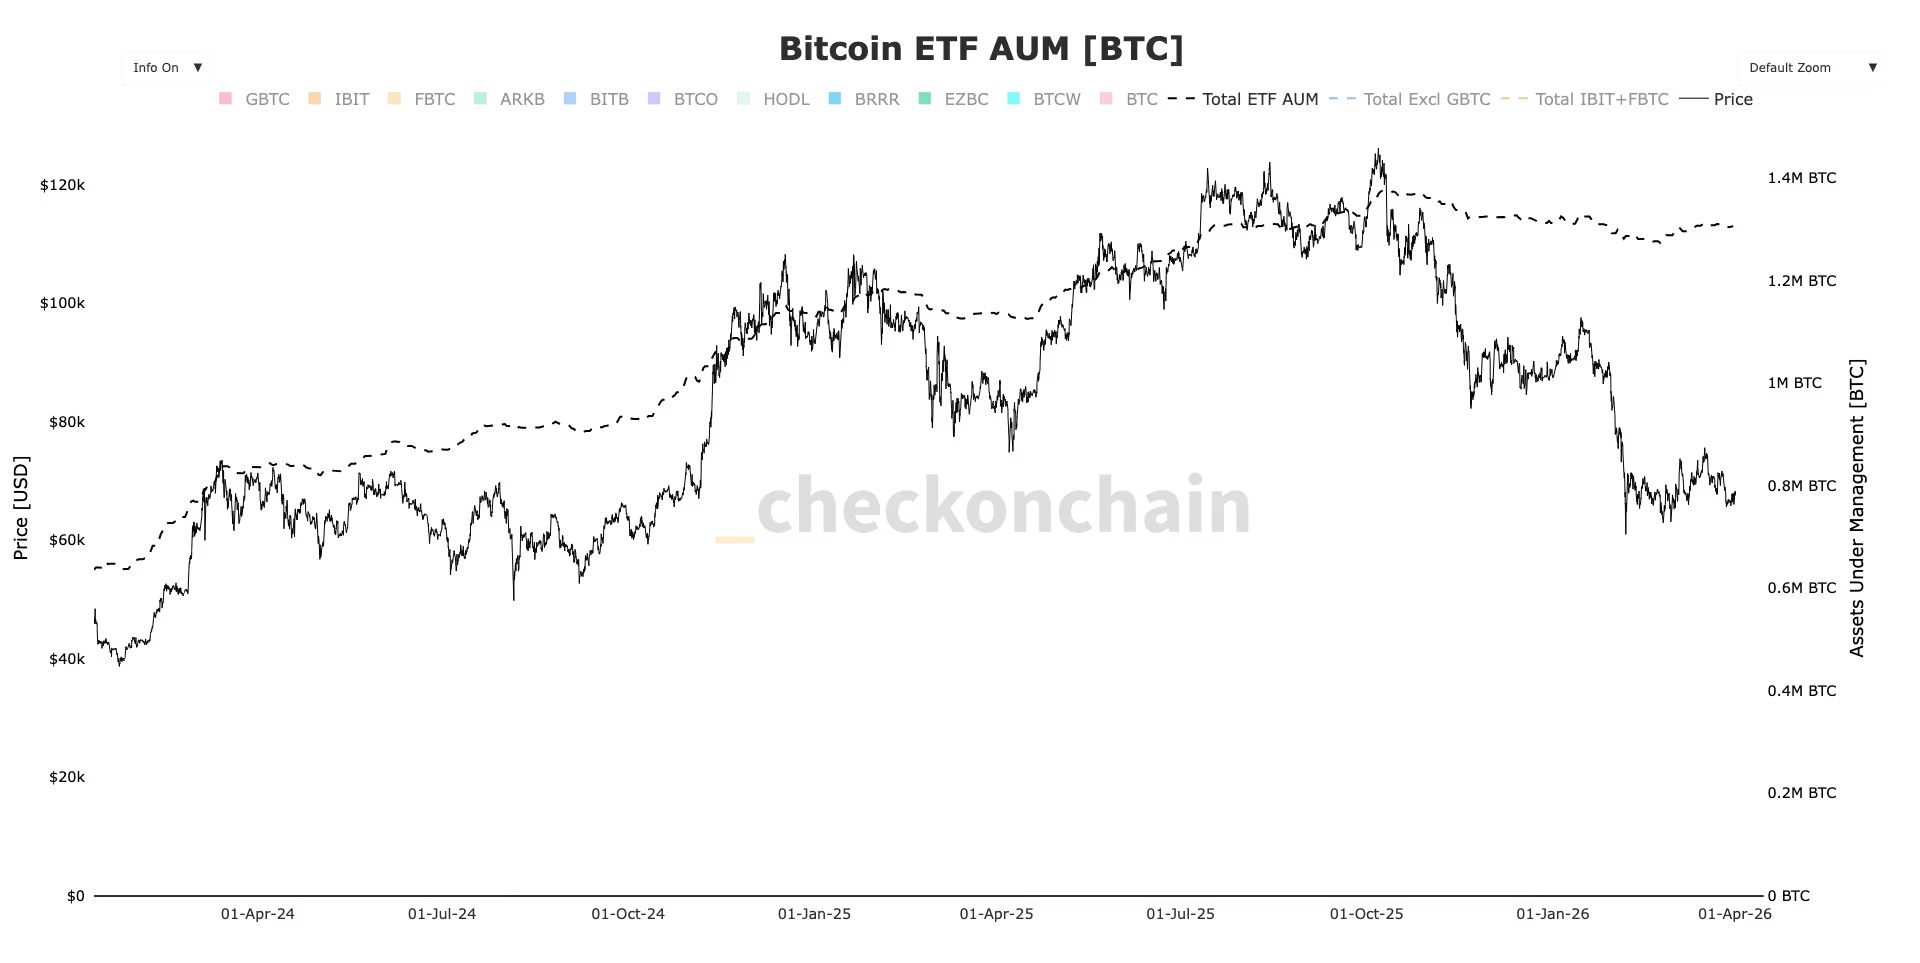
U.S.listed spot bitcoin ETFs ended March with $1.32 billion in net inflows to record their first monthly inflows since October, SoSoValue data shows.
This follows four consecutive months of net outflows, which coincided with bitcoin declining by as much as 50% from its October all time high of $126,000.
November saw $3.5 billion in outflows, followed by $1.1 billion in December, $1.6 billion in January, and $206 million in February.
March also marked bitcoin’s first positive monthly candle in six months, suggesting a potential shift in momentum.
ETF assets under management have remained relatively resilient, however. Holdings declined from 1.38 million BTC in October to a low of 1.28 million BTC, a drop of roughly 7%, and have since recovered to around 1.31 million BTC, according to CheckonChain.
ETF investors remain underwater on average, with an estimated cost basis near $84,000 compared to a current spot price of about $68,000.

Crypto World
Galaxy Digital’s (GLXY) testnet suffers hack but no client funds or information were compromised
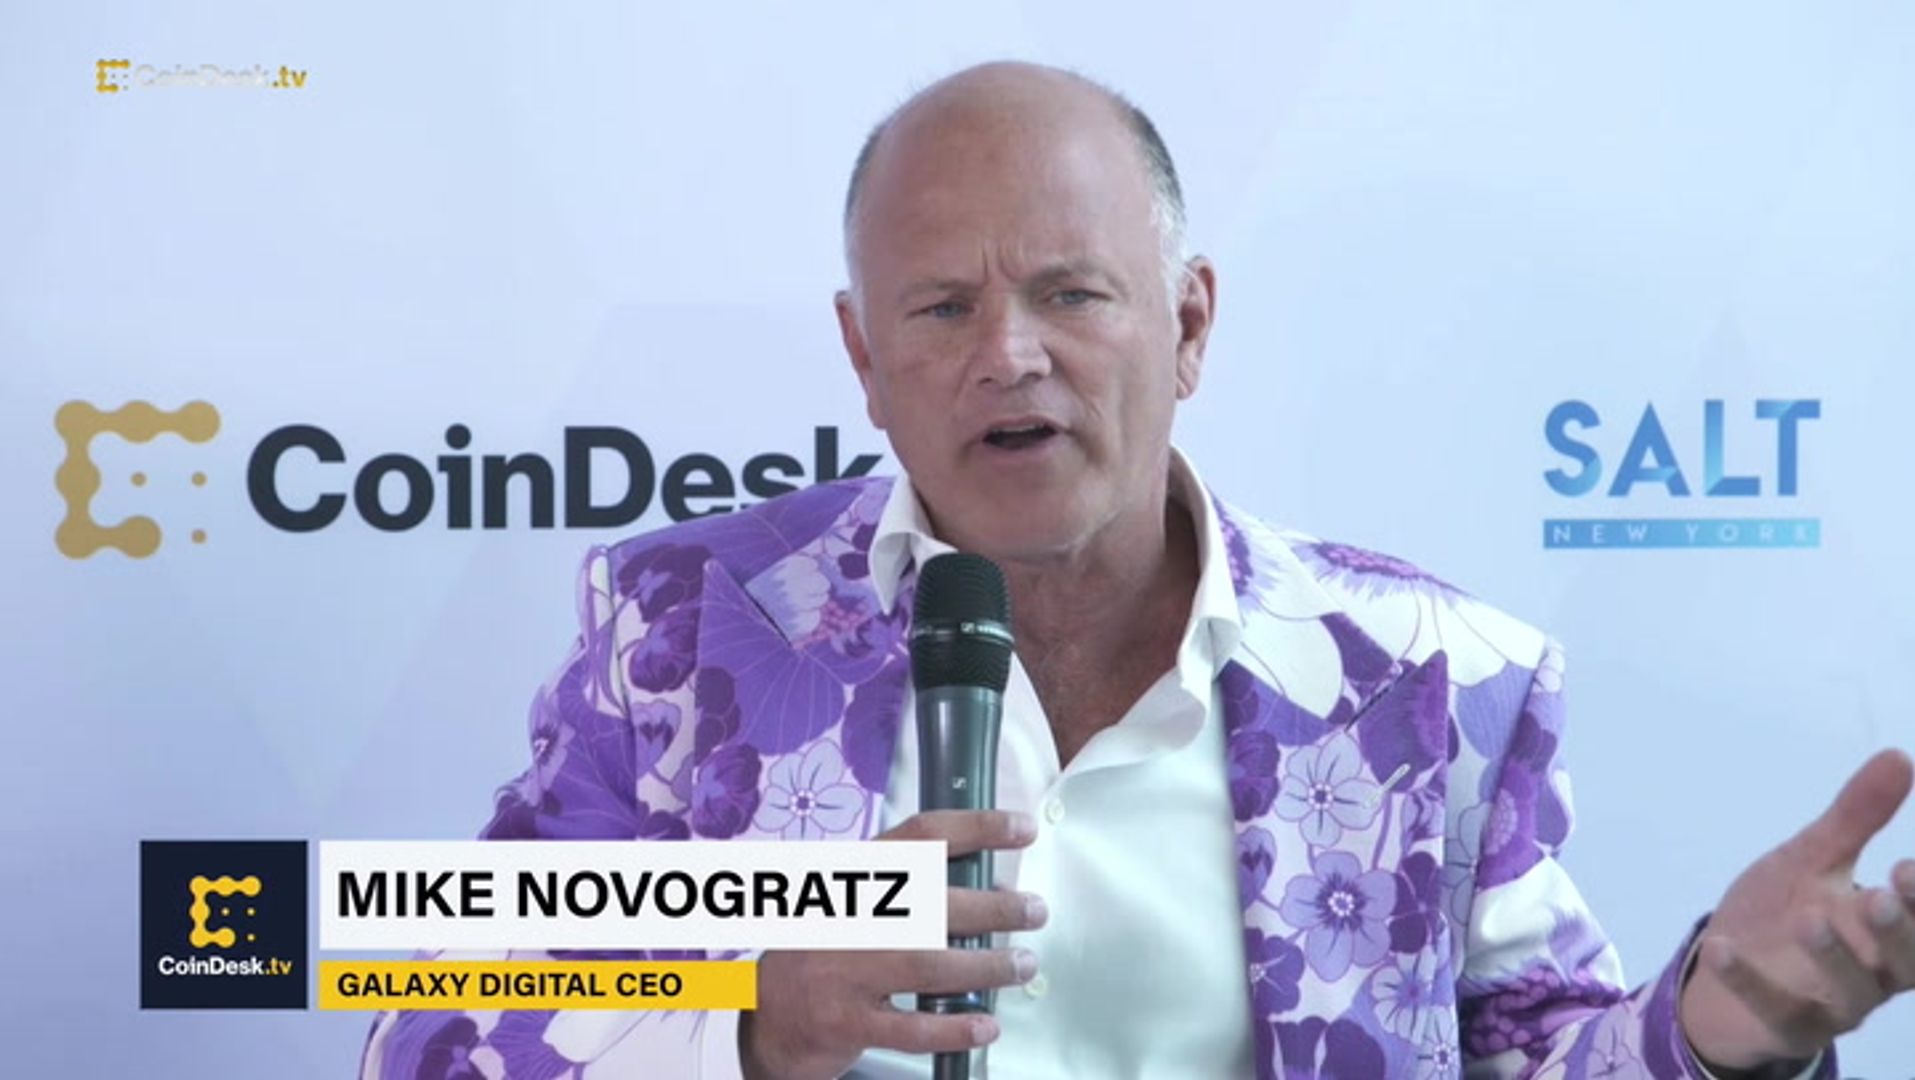

Galaxy Digital (GLXY), the digital asset financial services firm founded by Mike Novogratz, said it recently contained a cybersecurity incident involving unauthorized access to an isolated development workspace, according to a statement from a company spokesperson.
“An immaterial amount of company funds used for testing within the isolated development workspace was impacted,” the spokesperson said in emailed comments. The loss was less than $10,000, according to a person with knowledge of the matter.
The firm emphasized that the affected environment was used solely for research and development and was not connected to its core infrastructure, production systems, trading platforms or client accounts.
Galaxy said it detected the intrusion and moved quickly to contain it, secure the compromised workspace and implement additional precautionary measures across its on-chain infrastructure.
“No client funds or client account information were accessed or at risk at any point based on our review to date,” Galaxy said, adding that all platforms and services remain fully operational and secure for clients.
Hacks and exploits remain a persistent risk in the crypto industry, where the combination of open-source code, large pools of onchain liquidity and uneven security practices creates an attractive target for attackers.
Billions of dollars are lost to smart contract exploits, phishing schemes and infrastructure breaches, with industry estimates often exceeding $1–2 billion annually in recent years.
Even when incidents are contained, and client assets are not impacted, breaches can erode trust, trigger heightened regulatory scrutiny and underscore the operational risks facing firms operating in largely irreversible, always-on financial systems.
Galaxy is a diversified financial services and investment firm focused on the digital asset and blockchain sector, providing institutional clients with trading, asset management, lending, advisory and custody services.
The firm operates across several core business lines, including global markets, asset management and digital infrastructure, while also running businesses in areas like crypto mining, staking and data center operations.
Positioned as a bridge between traditional finance and crypto, Galaxy offers institutional-grade access to digital assets and related technologies, alongside investments in blockchain ventures and emerging areas such as AI-powered infrastructure.
The company said it is continuing to review the incident and will provide updates as appropriate.
Read more: Bitcoin’s quantum threat is real, but far from an existential crisis, Galaxy says
Warren Buffett, the legendary investor and chairman of Berkshire Hathaway, revealed on CNBC this week that his firm purchased approximately $17 billion in US Treasury bills at the latest auction. Is a stock market crash coming and what does it mean for Bitcoin (BTC)?
Key takeaways:
-
Berkshire held $373 billion in cash or cash equivalents as of 2025’s close, more than double the levels in 2023.
-
The firm’s rising cash reserves typically precede major stock market crashes, a bad sign for Bitcoin.
Buffett still sees better value in cash than in stocks
Buffett’s message is straightforward: Berkshire does not see the recent equity pullback as a sufficiently attractive buying opportunity.
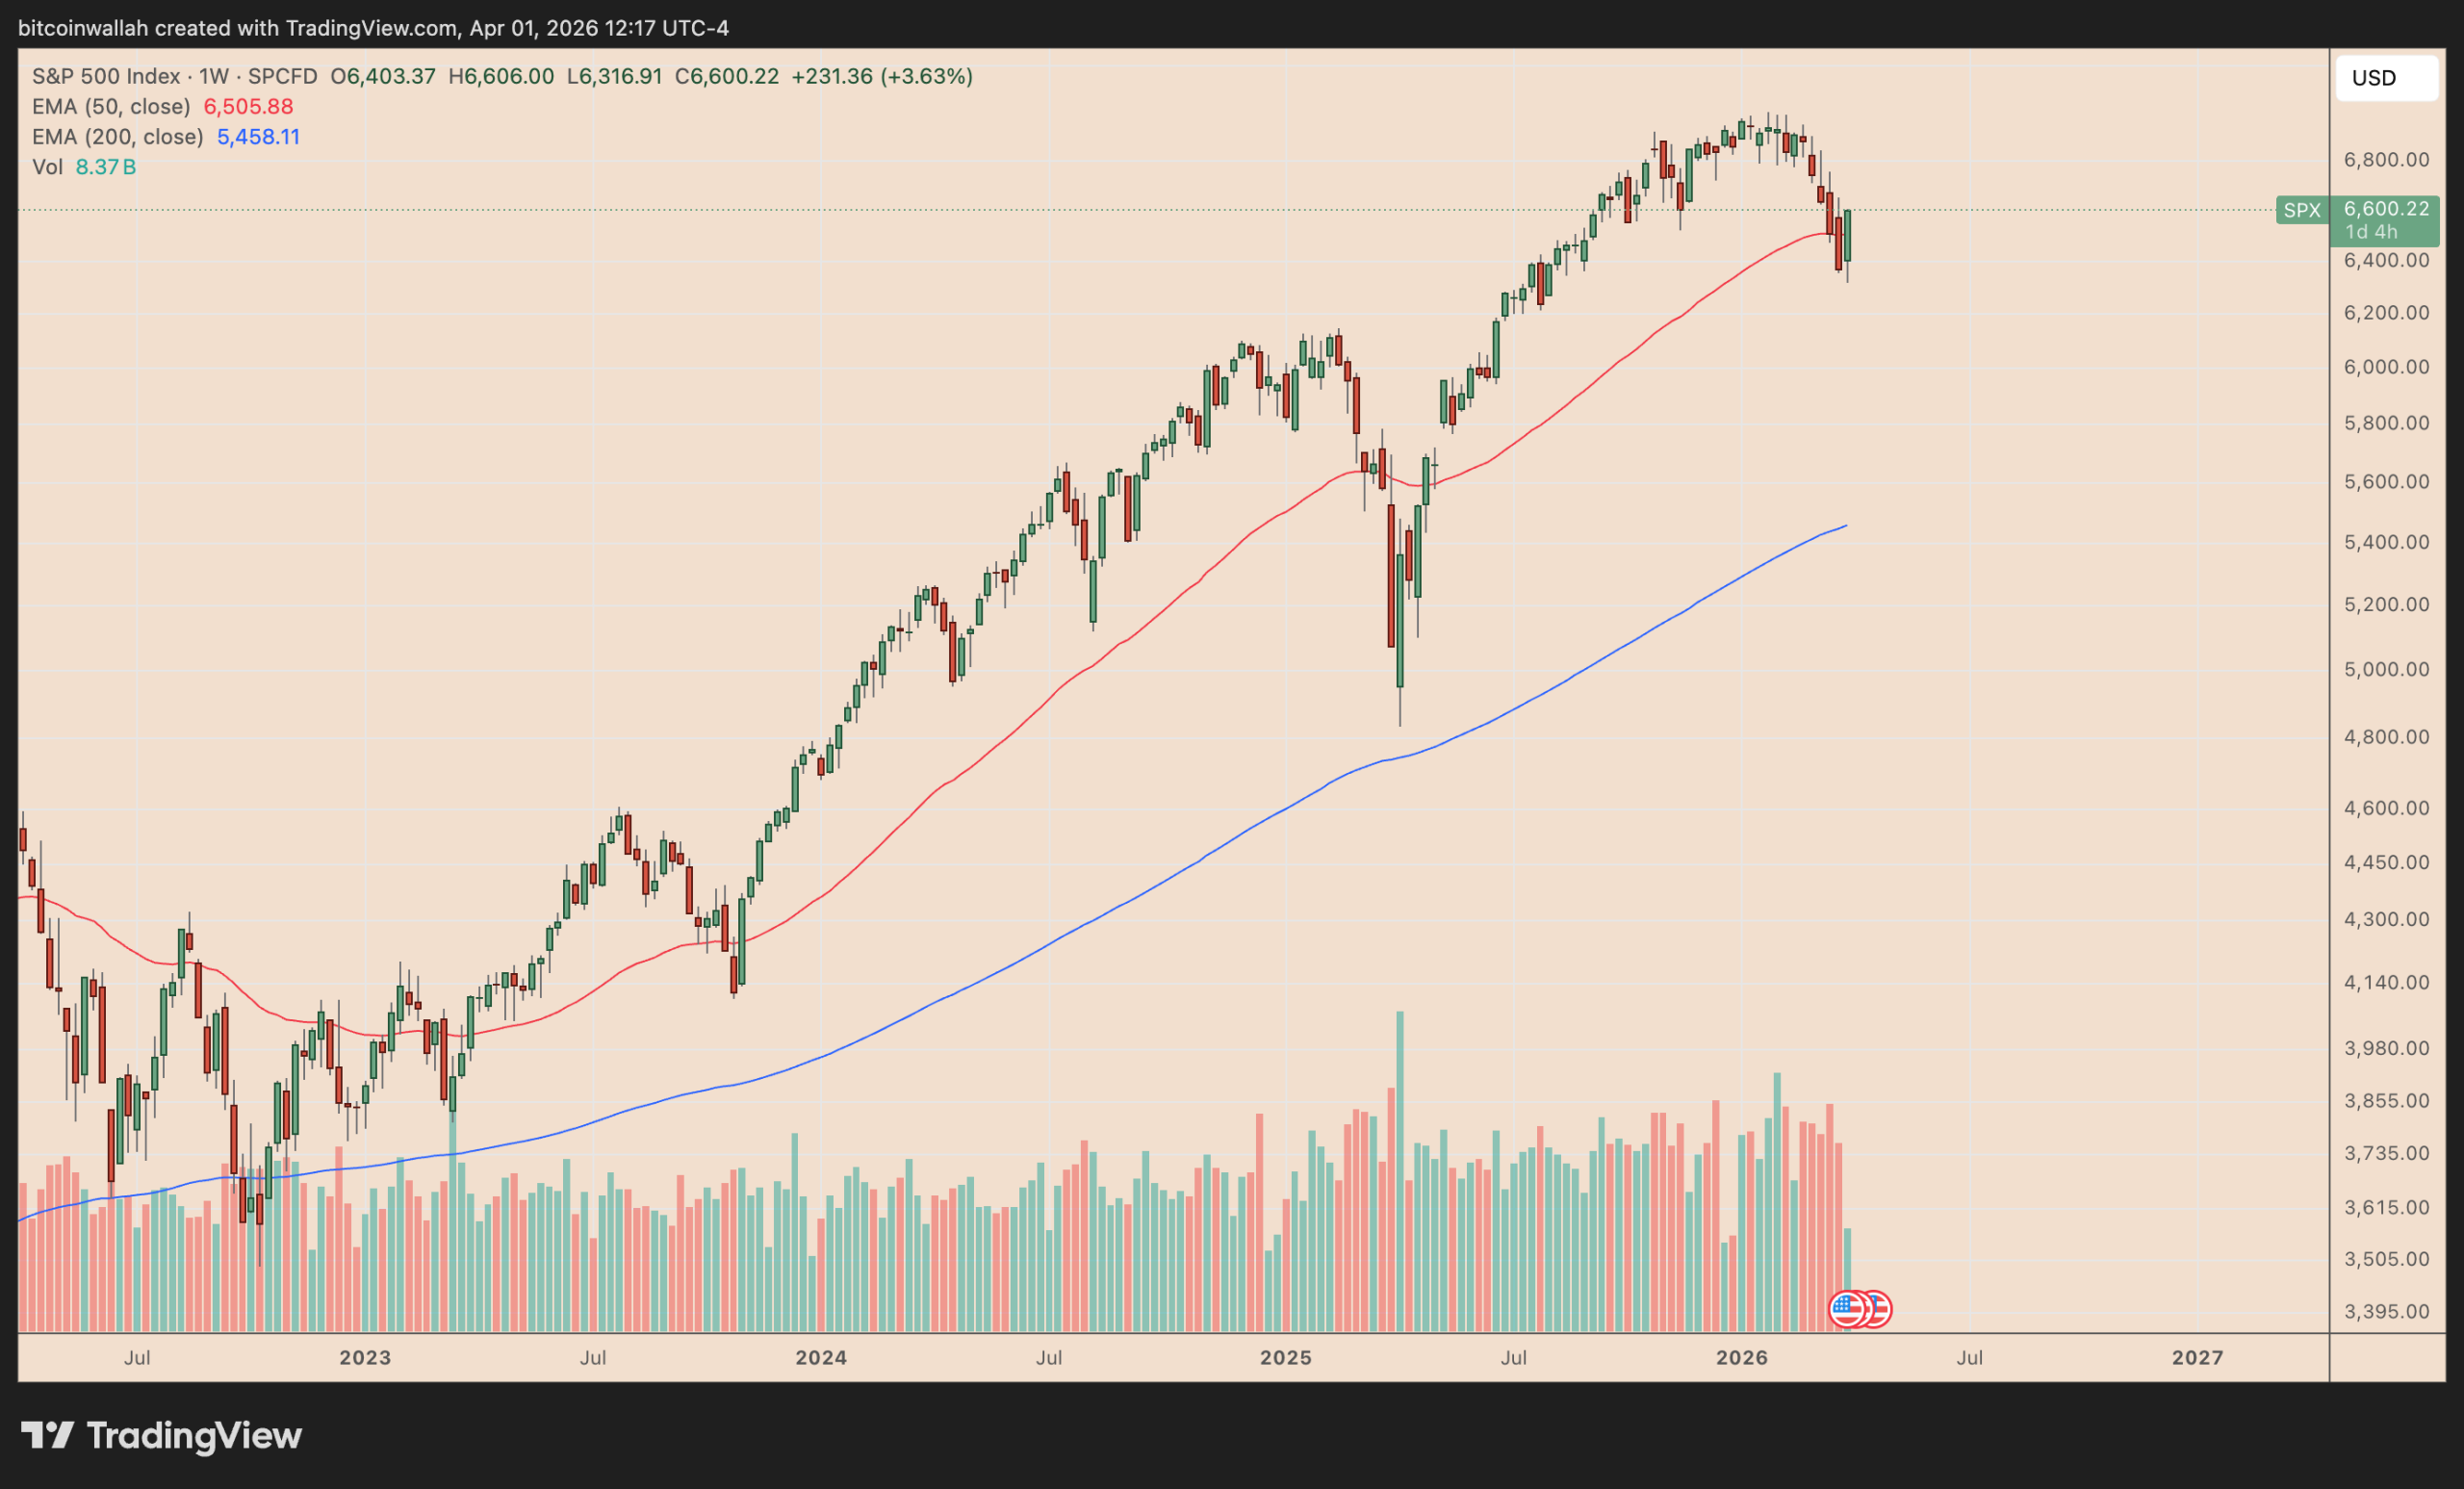
For context, the S&P 500 has fallen about 5.75% since reaching a record high in January.

Buffett said stocks are not “substantially” cheaper after the decline and described the sell-off as “nothing” compared with earlier downturns in which markets fell more than 50%.
That helps explain Berkshire’s latest Treasury-bill purchase. The company ended 2025 with about $373 billion in cash and equivalents, up from a record $334.2 billion a year earlier and more than double its level at the end of 2023.
Buffett, who famously called Bitcoin “rat poison,” typically gets into cash before major stock crashes, historical data shows.
In 1998, for instance, Buffett began trimming Berkshire’s stock exposure and raising cash, pushing the company’s cash and cash-equivalents holdings to $13.1 billion, or about 23% of total assets.

By mid-2000, that figure had climbed to nearly $15 billion, or roughly 25% of assets, before Berkshire started deploying capital into bargains as the Dot-com bubble burst.
Bitcoin’s positive correlation with stocks may hurt prices
Bitcoin has traded more like a stock than a traditional safe haven for much of the post-2020 period, often moving in the same direction as US equities, especially the tech-heavy Nasdaq.
As of Wednesday, the 20-week rolling correlation coefficient between the two markets was positive at 0.47.

If Buffett’s risk-off strategy is correct, then Bitcoin should see another crash alongside stocks. Fresh quantum-security concerns, war-driven inflation risks, and nearly 50% US recession odds are putting pressure on the BTC price.
Berkshire’s portfolio decisions have also leaned away from crypto-adjacent finance.
In the first quarter of 2025, the firm fully exited Nu Holdings, a crypto-friendly fintech company, after building its position in 2021 and 2022. It secured about $250 million in profits from these investments.
Multiple analysts predict BTC’s price to drop to as low as $30,000 in 2026.
This article is produced in accordance with Cointelegraph’s Editorial Policy and is intended for informational purposes only. It does not constitute investment advice or recommendations. All investments and trades carry risk; readers are encouraged to conduct independent research before making any decisions. Cointelegraph makes no guarantees regarding the accuracy or completeness of the information presented, including forward-looking statements, and will not be liable for any loss or damage arising from reliance on this content.

Onchain data shows more than a dozen asset types drained from the Solana perp DEX’s main vault address in a rapid burst of transactions.

TLDR
- EDX Markets has applied for a national trust bank charter with the Office of the Comptroller of the Currency.
- The charter would allow the company to offer regulated custody, asset management, and principal trading services.
- The exchange plans to separate custody and settlement functions from its trading operations.
- Chief executive Tony Acuña-Rohter said the trust charter would help serve institutional clients.
- The move follows conditional trust charter approvals granted to Circle and Ripple in December.
EDX Markets has filed for a national trust bank charter with the Office of the Comptroller of the Currency. The application would allow the crypto exchange to expand custody and settlement services under federal oversight. The move marks a direct step toward deeper integration with the US banking system.
Citadel-Backed Platform Seeks Federal Trust Status
EDX Markets submitted its application on April 1, according to public filings. The company seeks approval to operate as a national trust bank under OCC supervision. The charter would permit custody, asset management, and principal trading within a regulated structure.
The exchange stated that the new structure would separate custody and settlement from trading functions. It argued that combining brokerage, exchange, and custody roles creates conflicts and operational risk. Therefore, it aims to align its operations with traditional financial market models.
EDX Markets operates an institutional crypto platform backed by Citadel Securities and other financial firms. The company said the trust charter would strengthen safeguards for client assets. It added that federal supervision would support secure custody and settlement systems.
Chief executive Tony Acuña-Rohter said large banks will shape the next stage of digital asset adoption. He stated, “Obtaining a trust charter positions us to meet institutional demand for regulated custody.” He added that the structure supports clients requiring compliant asset management services.
The company maintained that the trust model reflects established practices in equities and derivatives markets. In those markets, exchanges, brokers, custodians, and market makers operate separately. EDX Markets said this separation limits conflicts between trade execution and asset custody.
Application Reflects Policy Shift Toward Digital Assets
The filing comes as federal regulators show greater openness to crypto firms entering the banking system. Several companies have sought national trust charters in recent months. Regulators have reviewed these applications under existing banking laws.
In December, regulators granted conditional approvals to Circle Internet Group and Ripple. Those approvals allowed both firms to pursue trust bank operations under federal supervision. The decisions placed custody and asset management within the regulatory perimeter.
EDX Markets stated that its proposed structure would reduce systemic risk across crypto platforms. It said separating custody and trading functions strengthens protections for client funds. The firm emphasized that regulated settlement systems improve operational transparency.
Founded in 2022, EDX Markets built its platform for institutional investors entering digital assets. Backers include Citadel Securities, Virtu Financial, Fidelity Digital Assets, and Hudson River Trading. The exchange designed its order-matching system to mirror traditional market infrastructure.
National trust banks can hold client assets and manage portfolios under OCC oversight. They can also provide fiduciary and custody services within federal rules. EDX Markets confirmed that it will continue operating its existing order-matching platform during the review process.


Block co-founder Jack Dorsey and the company’s lead independent director, Roelof Botha, have laid out a forward-looking vision in which artificial intelligence could fundamentally change how work is coordinated. In a blog post published this week, they describe a model where AI would take on the tasks typically handled by middle managers—tracking projects, flagging issues, assigning work, and sharing critical information faster than human processes allow.
The post comes on the heels of Block’s previously reported workforce restructuring, part of a broader wave of AI-driven cost-cutting across the tech sector. Block disclosed that it cut roughly 4,000 jobs in February, an action Dorsey attributed to the rapid pace of AI adoption and the need to stay competitive. In March, some of the employees who had been laid off were quietly rehired, illustrating a cautionary approach to the current wave of optimization. The blog authors emphasize that AI’s role in the new model is evolving, not yet fully realized, and that Block remains in the “early stages” of testing how an intelligence-centric structure could function in practice.
“We’re questioning the underlying assumption: that organizations have to be hierarchically organized with humans as the coordination mechanism. Instead, we intend to replace what the hierarchy does. Most companies using AI today are giving everyone a copilot, which makes the existing structure work slightly better without changing it. We’re after something different: a company built as an intelligence, or mini-AGI.”
Key takeaways
- Block’s leadership proposes replacing traditional hierarchical management with an intelligence-driven framework that leverages AI to coordinate work and decision-making.
- The envisioned structure redefines roles around three pillars: individual contributors, directly responsible individuals, and player-coaches who mentor while continuing to contribute technically.
- AI would enable real-time visibility into what’s being built, what’s blocked, resource allocation, and overall product performance, potentially speeding up information flow beyond conventional managerial channels.
- Despite the AI emphasis, human involvement remains central to strategic and ethical decisions, signaling a blended governance approach rather than a pure automation model.
From hierarchy to intelligence: Block’s strategic shift
The core idea articulated by Dorsey and Botha is a pivot away from the familiar pyramid where instructions travel up and down through layers of management. In a remote-first, machine-readable environment, AI would continuously build and maintain a live picture of organizational activity: what’s in development, what’s blocked, where resources are needed, and what outcomes are proving effective or failing. The authors describe the aim as moving beyond “copilot” enhancements to a more transformative design—an organization that operates as an intelligence rather than a traditional hierarchy.
They emphasize that the pattern could reshape corporate operation across sectors, not just within Block. The argument rests on a simple premise: information flow drives speed and adaptability. If AI can handle the coordination overhead more efficiently than humans, the bottlenecks created by layers of management could recede, enabling faster iteration and more responsive leadership decisions.
To illustrate the proposed shift, Block outlines a three-tier talent model. Individual contributors would be responsible for building and maintaining the operating systems that power the company’s workflows. Directly responsible individuals would tackle specific problems and be empowered to marshal any resources necessary to resolve them. Between these layers, player-coaches would assume manager-like duties—mentoring and supporting others—while continuing to contribute code and substantive work themselves. In this arrangement, the traditional gatekeeping function of middle management would be distributed and augmented by AI-enabled visibility and automation.
People still in the driver’s seat
Even as AI takes on coordination tasks, Dorsey and Botha stress that human judgment remains indispensable. They acknowledge that AI can process information at a scale and speed far beyond human capability, but key business and ethical decisions will continue to require human insight. The blog notes that while AI can present a continuously updated view of operations, it cannot substitute for the values, prudence, and accountability that guide corporate governance.
This stance sits at an important crossroads for investors and workers alike. The acceleration of AI-driven restructuring has historically raised questions about job security, morale, and the long-term viability of new organizational paradigms. Block’s own experience—balancing a major layoff with later rehiring of some affected employees—illustrates a cautious, iterative approach rather than a speculative leap into a fully automated future. The authors’ framing suggests a model where AI acts as a force multiplier for human capabilities, rather than replacing people wholesale.
Why it matters for crypto-adjacent ventures
The broader crypto and fintech sectors have watched Block (the company behind the Cash App and a notable crypto-friendly stance) as a bellwether for technology-enabled financial services. If an AI-first, intelligence-driven corporate structure gains traction, it could influence how other blockchain and payments firms think about product development cycles, regulatory compliance, and governance practices. The potential impact extends to how quickly teams can respond to security risks, how product roadmaps are validated in real time, and how cross-functional collaboration is organized in a hybrid or fully remote environment.
From an investor perspective, the shift raises questions about how governance, risk controls, and performance metrics would be managed in an AI-augmented organization. Real-time visibility into development pipelines and resource allocation could improve transparency, but it also heightens sensitivity to data quality, AI oversight, and ethical considerations in automated decision-making. As with any large-scale adoption of AI in corporate governance, the outcomes will hinge on guardrails, accountability, and the ongoing calibration of human-in-the-loop processes.
Block’s announcement aligns with a wider industry conversation about whether AI can augment, or even replace, certain managerial functions. While the blog presents a staged, experimental path toward an intelligent enterprise, observers will be watching to see whether early pilots yield tangible improvements in productivity, risk management, and employee engagement. The balance between speed and governance will be particularly telling in sectors where regulatory scrutiny and customer trust are paramount.
What to watch next
The immediate questions center on execution and governance. How quickly will Block move from a conceptual framework to concrete organizational changes? What criteria will the company use to assess the success of its AI-driven coordination model? And how will Block address potential pitfalls, such as algorithmic bias, data silos, or accountability for automated decisions?
As AI continues to redefine work patterns across the technology landscape, Block’s approach could foreshadow a broader shift in corporate design. If the model proves adaptable and beneficial, it may prompt other firms to experiment with similar intelligence-driven structures, especially in environments that prize rapid iteration and remote collaboration.
Readers should monitor Block’s forthcoming updates and pilot implementations to gauge whether the vision moves from theory to practice and how those developments influence investor confidence, employee experience, and the broader discourse around AI-enabled governance.

OpenAI closes larger than expected funding round of $122bn

RIPPLE CTO JUST CONFIRMED XRP IS SOLD?!?! (this is scary)

Spanish police find underground drug-smuggling tunnel from Morocco | World News


-

 News Videos7 days ago
Parliament publishes latest register of MPs’ financial interests
-

 Business6 days ago
Instagram, YouTube Found Responsible for Teen’s Mental Health Struggle in Historic Ruling
-
 Tech6 days ago
Intercom’s new post-trained Fin Apex 1.0 beats GPT-5.4 and Claude Sonnet 4.6 at customer service resolutions
-

 NewsBeat5 days ago
The Story hosts event on Durham’s historic registers
-

 Sports5 days ago
Sweet Sixteen Game Thread: Tide vs Michigan
-
Entertainment2 days ago
Fans slam 'heartbreaking' Barbie Dream Fest convention debacle with 'cardboard cutout' experience
-
 Entertainment4 days ago
Lana Del Rey Celebrates Her Husband’s 51st Birthday In New Post
-
Crypto World1 day ago
Dems press CFTC, ethics board on prediction-market insider trades
-

 Sports1 day ago
Tallest college basketball player ever, standing at 7-foot-9, entering transfer portal
-

 Tech3 days ago
The Pixel 10a doesn’t have a camera bump, and it’s great
-

 Entertainment7 days ago
HBO’s Harry Potter Series Will Definitely Fail For One Big Reason, And It’s Not J.K. Rowling Or Snape
-

 Crypto World2 days ago
U.S. rule change may open trillions in 401(k) funds to crypto
-

 Tech1 day ago
EE TV is using AI to help you find something to watch
-

 Tech1 day ago
How to back up your iPhone & iPad to your Mac before something goes wrong
-

 Fashion6 days ago
En Vogue in Brown Leather and Tailored Neutrals by Atelier Savoir, Styled by J Bolin
-

 Politics2 days ago
Should Trump Be Scared Strait?
-

 Tech2 days ago
Flipsnack and the shift toward motion-first business content with living visuals
-

 Fashion6 days ago
What Are Your Favorite T-Shirts for the Weekend?
-

 Fashion5 days ago
Weekly News Update, 3.27.26 – Corporette.com
-

 Tech2 days ago
Apple will hide your email address from apps and websites, but not cops
You must be logged in to post a comment Login