

Crypto World
The $1,668 line for 2026
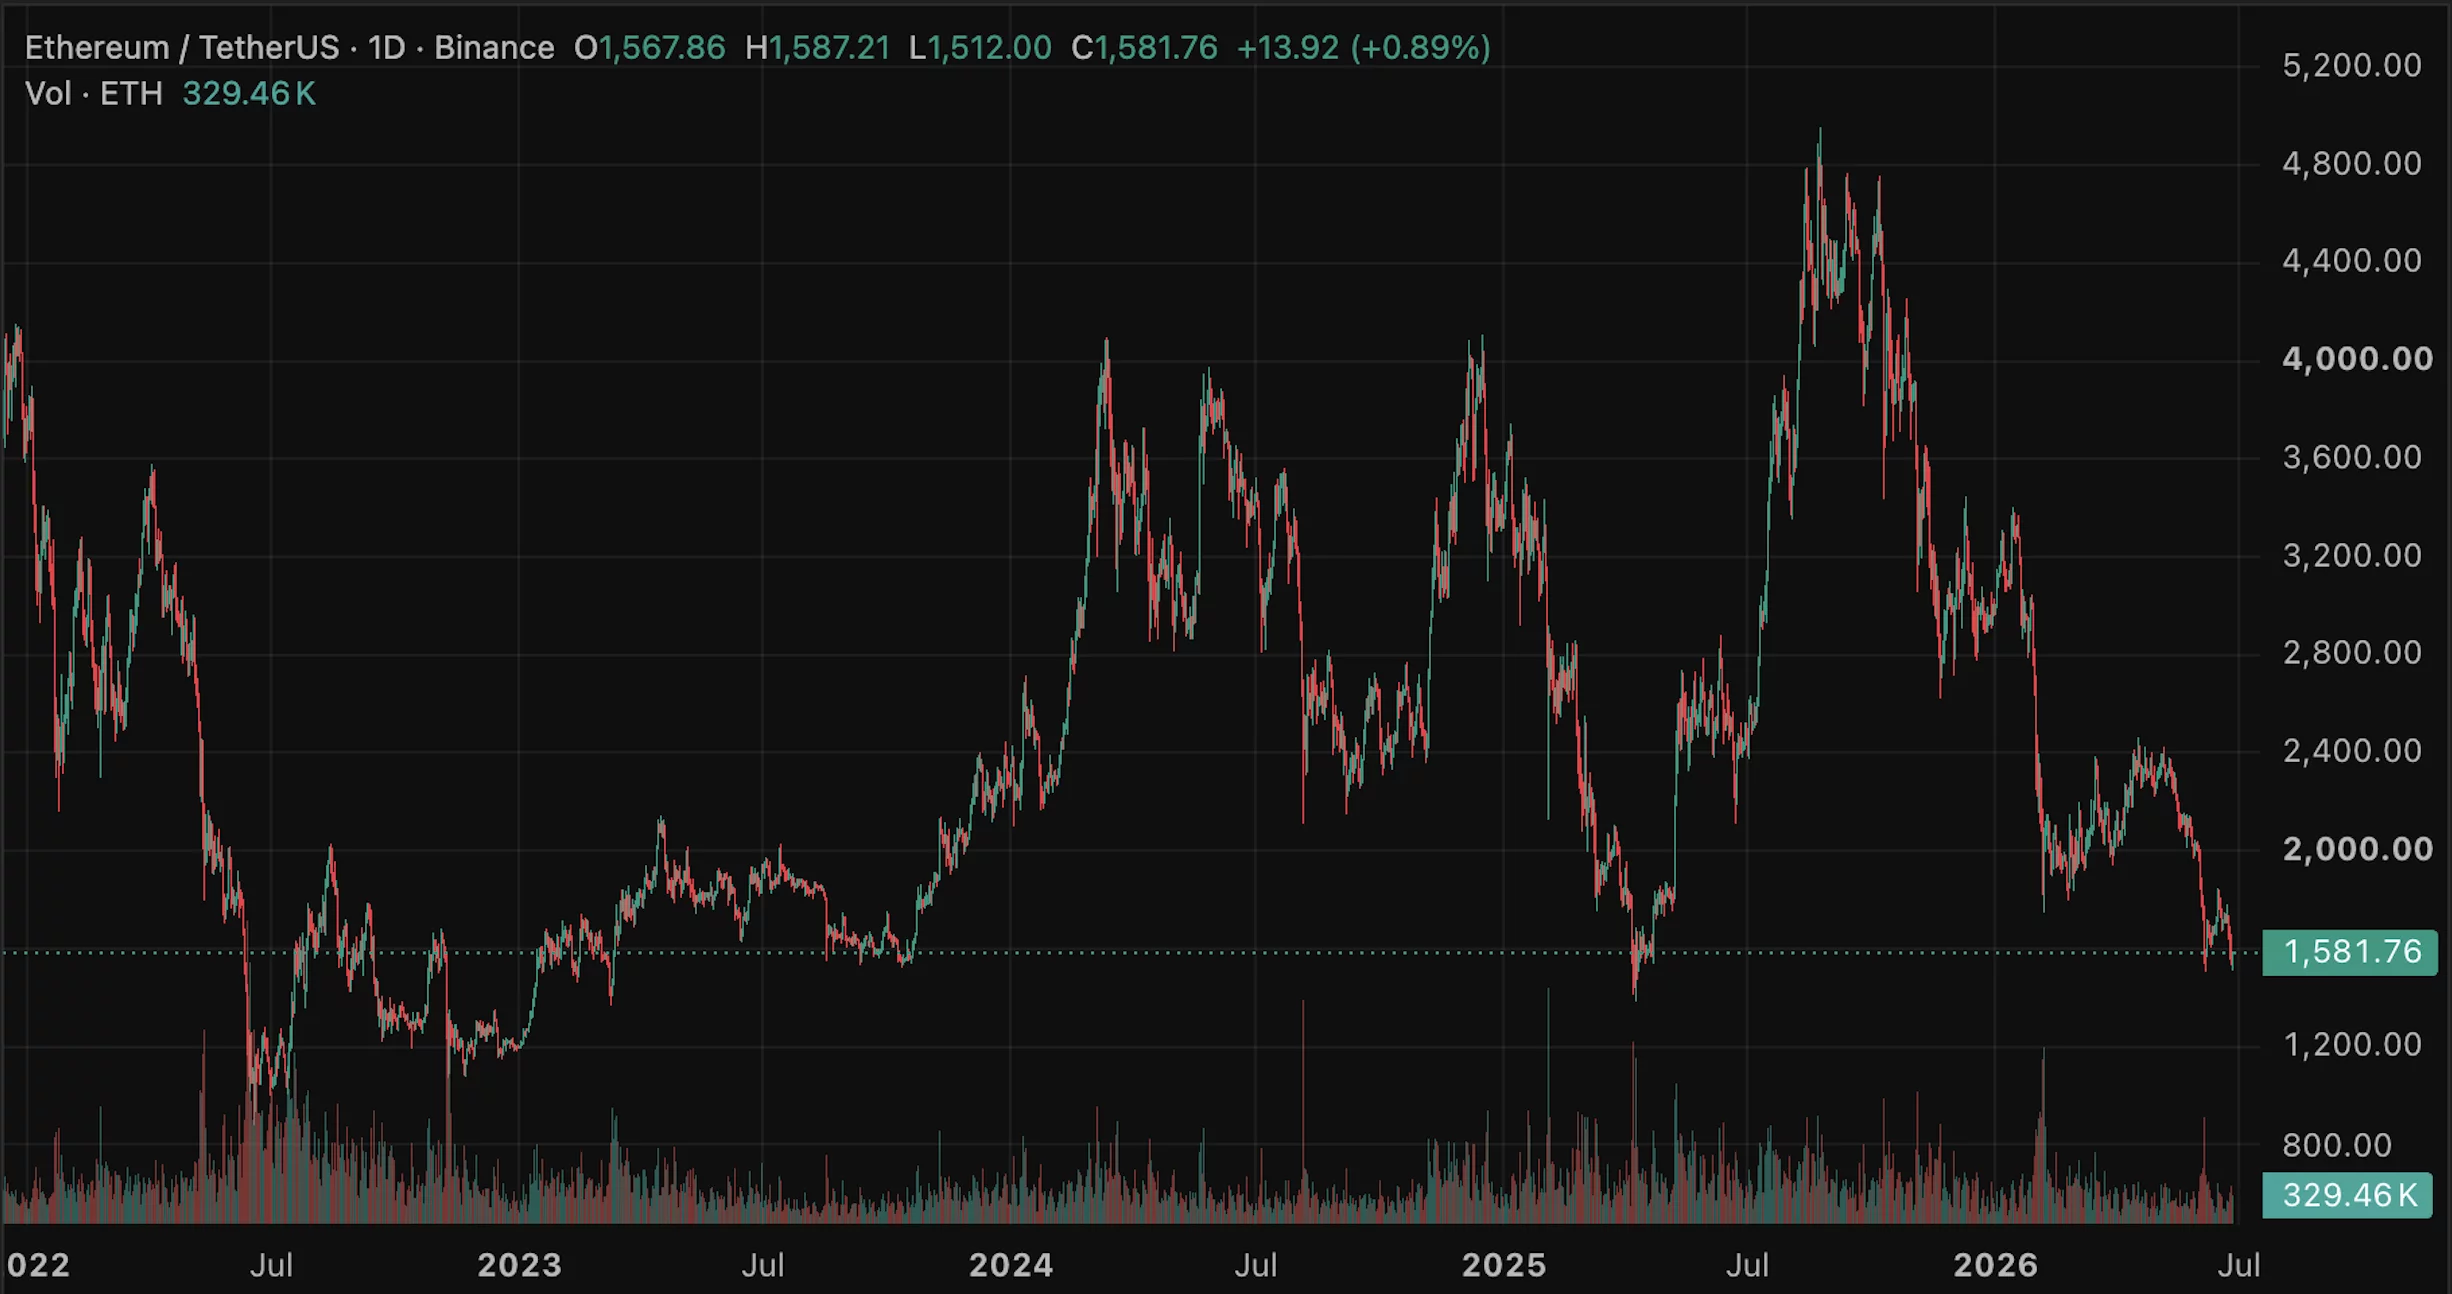
Ethereum trades around its 200-day moving average near $1,668, the line that has separated its bull markets from its bear markets for years. Above it lies a path back toward $3,000. Below it lies an accumulation zone, the charts put as low as $600. The strangest part is that Ethereum’s fundamentals have never been stronger.
Summary
- Ethereum trades around $1,650, hovering at its 200-day moving average near $1,668, a level that has historically divided its bull markets from its bear markets.
- The price is roughly 55-65% below its $4,953 August 2025 all-time high, in a year-long downtrend, even as Ethereum’s fundamentals reach record highs.
- About 35.8 million ETH, near 30% of supply, is staked, spot ETFs have drawn around $11.6 billion in cumulative inflows, and corporate treasuries hold over 6.2 million ETH, yet none of it has lifted the price.
- The $1,668 line is the pivot: holding above it keeps a recovery toward $2,300 to $3,000 alive, while losing the $1,580 to $1,600 floor opens a path toward a deep $1,039 to $603 accumulation zone.
- The catalyst that could flip the line is the Glamsterdam upgrade and a reversal in ETF and treasury flows, but until the macro tide turns, the strongest fundamentals in Ethereum’s history have not been enough.
Ethereum is trading around $1,650, which places it almost exactly on the one line that, more than any other, has historically decided whether it is in a bull market or a bear market: its 200-day moving average, currently near $1,668.
For years, this long-term trend line has acted as the dividing line for Ethereum, with sustained periods above it coinciding with recoveries and rallies, and breaks below it preceding extended downtrends.
Right now, Ethereum sits on the knife’s edge of that line, and the direction it breaks will go a long way toward determining its path through the rest of 2026. What makes the moment genuinely strange, and what separates this prediction from a simple chart reading, is the backdrop against which the line is being tested.
Ethereum’s price is down roughly 55-65% from its all-time high near $4,950 set in August 2025, and it has spent the better part of a year grinding lower, yet by almost every fundamental measure, the network has never been in better shape.
More ether is staked than ever, more institutional money has flowed into Ethereum products than ever, and corporate treasuries are accumulating it at a scale that did not exist a year ago. The result is one of the sharpest contrasts in the market: the strongest fundamentals in Ethereum’s history paired with some of its weakest price action since 2022.
This piece is organized around that contrast and around the line that sits at its center. The reason to build an Ethereum prediction this way, rather than as a list of targets, is that Ethereum’s situation is fundamentally a question about whether fundamentals will eventually matter, and the 200-day moving average is where that question gets answered in real time.
If Ethereum holds the line and reclaims the levels above it, the case that its record fundamentals will reassert themselves gains force, and a path back toward $3,000 opens. If it loses the floor beneath the line, the chart points toward a deep accumulation zone far below, and the fundamentals will have failed, for now, to matter.
What follows traces how Ethereum reached this point, why the $1,668 line carries so much weight, the genuinely record-setting fundamentals on one side of the ledger, the bearish forces that have overwhelmed them on the other, the catalysts that could tip the balance, and concrete bull, base, and bear scenarios tied to the line itself.
One line, two futures
Begin with why a single moving average deserves to anchor an entire prediction, because for Ethereum, the 200-day moving average has earned its significance. A moving average is simply the average price over a trailing period, in this case 200 days, and it smooths out short-term noise to reveal the underlying trend.
For Ethereum, the 200-day line has historically functioned as the boundary between bull and bear regimes: when the price trades and holds above it, Ethereum has tended to be in recovery or rally mode, and when it breaks decisively below it, extended downtrends have usually followed. That history is why traders treat this level with such respect, and why Ethereum, sitting right on it, near $1,668, is such a charged situation. The price is balanced precisely at the line that separates its two possible futures.
The levels around the line sharpen the stakes. Immediately below the current price, the $1,600-$1,650 area has held as the floor for 2026, the zone buyers have repeatedly defended, and a brief dip toward $1,580 during the June selloff was bought back. Above, the first resistance sits in the $1,700-$1,800 range, with a more significant barrier near $2,000 and the major structural hurdle at $3,000, where Ethereum would reclaim its long-term trend.
The asymmetry that worries bears is what lies beneath the floor. Technical analysts who map the downside warn that a decisive break below the $1,580 area and the broader monthly support could open a much deeper decline toward an accumulation zone they place between roughly $1,600, a drop of another 30-60% from current levels.

So the line is not merely a number; it is the hinge between a recovery path toward $3,000 and an abyss toward $600, which is what makes holding or losing it the central question for Ethereum in 2026.
How ETH got here
To understand why Ethereum is testing this line at all, you have to trace the decline from its peak, because the fall has been long and grinding rather than a single crash. Ethereum reached its all-time high near $4,950 in August 2025, lifted by enthusiasm around its newly launched exchange-traded funds and growing staking participation.
From that peak, the descent was relentless, with Ethereum closing out a long streak of red months, its worst such run in years, and sliding through the second half of 2025 and into 2026.
By early 2026, it had fallen below $3,000, and the weakness continued through the spring, with the price working steadily lower in a descending channel of lower highs and lower lows that defined the year.
The June selloff that brought Ethereum to its current levels near $1,600 was the latest leg of this extended downtrend, not a sudden break from an otherwise healthy trend.
The causes were a convergence of pressures rather than any single shock. Broader risk-off sentiment across crypto, driven by macroeconomic uncertainty and concerns about the path of interest rates, weighed on Ethereum as a high-risk asset. Persistent outflows from spot Ethereum exchange-traded funds removed a key source of demand and, during the worst stretches, became active selling pressure.
Selling attributed to Ethereum’s own co-founder added to the bearish narrative. And Ethereum’s tendency to amplify Bitcoin’s moves meant that as Bitcoin slid toward $60,000, Ethereum fell harder, because it typically rises faster in bull conditions and declines more sharply in risk-off periods.
The cumulative effect was a year-long erosion that has left Ethereum testing the line that separates recovery from a deeper bear market, with the price having given back the majority of its gains from the prior cycle. That is the chart context. The fundamental context, remarkably, points the other way.
Why $1,668 matters so much
It is worth dwelling on the significance of the line itself, because the entire technical case for Ethereum hinges on it, and the reasoning is not arbitrary. The 200-day moving average works as a regime indicator precisely because it filters out short-term volatility and captures the medium-to-long-term trend, which is why both technical traders and the algorithms that drive a large share of market activity pay close attention to it.
For Ethereum specifically, the historical record shows that this line has repeatedly marked the transition between bull and bear phases, so a sustained position above it tends to attract trend-following buyers and signal strength, while a decisive break below it tends to trigger trend-following selling and signal weakness. The line becomes partly self-fulfilling because so many participants treat it as meaningful that their collective behavior reinforces its importance.
Right now, the line is doing something subtle and worrying beneath the surface: even as the price hovers around it, the 200-day average itself has begun to slope downward, which technicians read as a sign of underlying long-term weakness instead of strength. A price clinging to a falling long-term average is in a more precarious position than one riding a rising average, because the trend line that is supposed to provide support is itself drifting lower.
This is why the current test is so consequential. If Ethereum can hold above the line, stabilize, and push back through the resistance levels above it, the long-term average can flatten and turn up, flipping the regime back toward recovery. If it loses the line and the floor beneath it, the falling average becomes overhead resistance, and the path of least resistance points toward the deep accumulation zone the bears identify.
The $1,668 line, in other words, is not just where the price happens to be; it is the level at which Ethereum’s medium-term fate is being decided.
The strongest fundamentals in Ethereum’s history
Here is the contrast that makes Ethereum’s situation so unusual, and it deserves to be laid out fully, because on fundamentals, the network is arguably in the best shape it has ever been.
Start with staking, the mechanism by which holders lock up ether to help secure the network and earn a yield. As of early 2026, roughly 35.8 million ether, close to 30% of the entire circulating supply, is staked, secured by around one point one million validators, with a staking yield in the range of 2.8-3.5% annually.
That staked proportion has nearly tripled since early 2023, when about 11% of supply was staked, reflecting steadily growing confidence and the popularity of liquid staking and restaking. A large and rising share of supply locked in staking reduces the ether available to sell on the open market, a structurally supportive dynamic.
The institutional picture is equally striking. Spot Ethereum exchange-traded funds have attracted roughly 11.6 billion dollars in cumulative net inflows since launching, with the largest single product holding well over $6 billion in assets, giving traditional investors regulated access to ether and, through the staking yield increasingly available, a competitive income component.
Beyond the funds, corporate treasuries have embraced ether as a reserve asset at a scale that did not exist a year earlier, collectively holding over 6.2 million ether, up from under 1 million in mid-2025, led by a treasury company that alone holds several million ether, a meaningful slice of the total supply.
Layered on top is an accelerating upgrade cadence, with major protocol improvements deployed in 2025 and a twice-yearly schedule of further upgrades designed to scale the network.
By every one of these measures, more staked, more institutional capital, more corporate adoption, more frequent upgrades, Ethereum’s fundamentals are at or near record strength. And none of it has stopped the price from falling, which is the puzzle the rest of the prediction has to confront.
The bear case: why the fundamentals have not mattered
The hard truth for Ethereum bulls is that strong fundamentals have, so far, been no match for the forces pushing the price down, and understanding why is essential to any honest prediction.
The first and most powerful force is the macro environment and Ethereum’s nature as a high-beta risk asset. Ethereum tends to amplify the broader market’s moves, so in a period of risk aversion, tightening financial conditions, and a sliding Bitcoin, Ethereum falls harder regardless of how strong its network fundamentals are, because the selling is driven by macro flows that do not care about staking ratios or upgrade schedules. When capital is fleeing risk, the quality of Ethereum’s fundamentals offers little protection.
The second force is the reversal of the very institutional demand that forms part of the bull case. The exchange-traded funds that brought billions into Ethereum have, during the downturn, seen persistent outflows, turning a source of demand into a source of selling and showing that institutional money can flee as readily as it arrived.
The third is a structural tension within Ethereum’s own design: the growth of layer-two networks, which handle transactions more cheaply by settling on Ethereum, expands the ecosystem’s usage but also reduces the fee pressure on the main chain, complicating the link between network activity and ether’s value.
The fourth is competition from other blockchains vying for the same developers, users, and capital, which caps the premium the market is willing to pay.
And the fifth is simply sentiment and narrative: with the price in a year-long downtrend and a co-founder seen selling, the story around Ethereum has soured, and narrative drives crypto prices more than fundamentals over any given stretch.
The bears’ summary is blunt: the ether trade may be structurally broken, with the token failing to capture the value its thriving network creates, and until the macro tide turns, the record fundamentals are a reason to watch instead of a reason the price must rise.
The catalysts that could flip the line
For the fundamentals to start mattering, something has to change the flow of money and the narrative, and several potential catalysts could do exactly that, which is where the bull case regains its footing.
The most specific is the network’s continued upgrade path. A major scaling upgrade expected in the first half of 2026, followed by another in the second half, is designed to deliver measurable improvements to the main chain, and a successful, well-received upgrade could refresh the narrative around Ethereum, reminding the market of the network’s technical leadership and giving institutional and retail buyers a concrete reason to re-engage.
Upgrades have historically been catalysts for Ethereum when they land well, and the twice-yearly cadence means there are regular opportunities for a positive surprise.
The second catalyst is a reversal in the institutional flows. The exchange-traded fund outflows have been a primary drag, so a durable shift back to sustained inflows, perhaps helped by the staking yield making the funds more competitive against fixed-income products, would remove that selling pressure and could turn the funds back into the demand engine the bull case envisions.
The continued accumulation by corporate treasuries is a related signal; if treasuries keep buying through the weakness and the whale wallets that have been adding to positions during the dip prove to be the leading edge of renewed institutional conviction, the resulting supply squeeze, with so much ether staked and locked, could lift the price sharply once demand returns.
The third catalyst is macro: a shift toward easier monetary policy or a broader return of risk appetite would lift high-beta assets like Ethereum, and given how much it has fallen, the rebound could be substantial. The honest framing is that Ethereum has loaded the spring, with record fundamentals and locked supply, and the catalysts above are what could release it, but each depends on forces, especially the macro backdrop, that are not yet in place.
The bull, base, and bear cases for 2026
Tying the scenarios to the line and the catalysts makes them concrete. These are conditional ranges, not predictions, and each hinges on whether Ethereum holds its pivotal level and whether the catalysts arrive.
- Bull case: Ethereum holds the $1,668 line, a well-received scaling upgrade refreshes the narrative, exchange-traded fund flows reverse back to sustained inflows, and a friendlier macro backdrop returns risk appetite. The locked supply from record staking amplifies the move as demand returns, and Ethereum recovers through resistance toward the $2,300-$3,000 zone, with the most bullish institutional targets pointing well above that over a longer horizon as the fundamentals finally reassert themselves
- Base case: Ethereum chops around the line for an extended period, holding the $1,580-$1,700 range as treasury accumulation offsets continued fund outflows, with the strong fundamentals preventing a collapse but the weak macro preventing a breakout. In this scenario, Ethereum grinds sideways near current levels, waiting for a catalyst, with direction deferred to the second half of the year.
- Bear case: Ethereum loses the $1,668 line and the $1,580 floor decisively, fund outflows continue, Bitcoin drags the market lower, and the falling long-term average becomes overhead resistance. The chart’s deep accumulation zone comes into play, and Ethereum declines toward the $1,000-$1,600 region the bears identify, with the record fundamentals failing, for this cycle, to matter against the macro tide.
What to watch
For anyone tracking whether Ethereum’s fundamentals will finally translate into price, the analysis points to a focused watchlist, and the first item is the line itself. Whether Ethereum holds the $1,668 200-day moving average and the $1,580 floor beneath it, or loses them decisively, is the single clearest signal of which scenario is unfolding, because that level marks the boundary between the recovery path and the deep-accumulation path.
A sustained reclaim of the resistance above the line would be powerfully bullish; a decisive break of the floor would be powerfully bearish. Everything else feeds into that binary.
The second item is the flow data. The exchange-traded fund outflows have been the primary drag, so a durable reversal to net inflows would be among the strongest possible signals that institutional demand is returning, while continued outflows would confirm the bearish reading. The behavior of corporate treasuries and large accumulating wallets matters alongside the funds; sustained buying through weakness supports the bull case, and any sign of treasuries slowing or selling would be a serious warning given how much of the supply-squeeze thesis rests on them.
The third item is the upgrade path and its reception, since a well-received scaling upgrade is the most concrete near-term catalyst that could refresh the narrative. And the fourth, as always, is the macro environment, because Ethereum’s high-beta nature means a shift in monetary policy or risk appetite would move it more than almost any network development.
The honest synthesis is that Ethereum is a coiled spring of record fundamentals and locked supply held down by a hostile macro tape, and the 200-day line is where the contest between the two is being decided.
Watch the line, watch the flows, and resist the temptation to assume that strong fundamentals must win quickly, because Ethereum’s entire recent history is a reminder that they have not.
Frequently Asked Questions
Why is the $1,668 level so important for Ethereum?
Because it is Ethereum’s 200-day moving average, a long-term trend line that has historically divided its bull markets from its bear markets. When Ethereum trades and holds above it, the network has tended to be in recovery or rally mode; when it breaks decisively below, extended downtrends have usually followed. Many traders and automated strategies treat the line as a regime indicator, which makes it partly self-fulfilling. With Ethereum sitting right on the line, the direction it breaks will signal whether a recovery toward $3,000 or a deeper decline toward the chart’s accumulation zone is more likely.
Why is Ethereum’s price falling when its fundamentals are so strong?
Because macro forces and Ethereum’s nature as a high-risk asset have overwhelmed the fundamentals. Ethereum amplifies the broader market’s moves, so in a period of risk aversion, tightening conditions, and a sliding Bitcoin, it falls hard regardless of staking ratios or upgrades. The exchange-traded funds that had bought billions in inflows have seen persistent outflows, turning demand into selling. Layer-two growth complicates the link between network usage and ether’s value, competition caps the premium, and a soured narrative drives sentiment. Over any given stretch, flows and narrative move crypto prices more than fundamentals, which is why record fundamentals have not lifted the price.
How strong are Ethereum’s fundamentals right now?
By most measures, the strongest in its history. Roughly thirty-five point eight million ether, near 30% of the supply, is staked, nearly triple the proportion of early 2023, which locks up supply. Spot exchange-traded funds have drawn around $11.6 billion in cumulative inflows, with the largest product holding over $6 billion. Corporate treasuries hold over 6.2 million ether, up from under 1 million in mid-2025. And the network is on an accelerating upgrade schedule. The contrast between these record fundamentals and the weak price is precisely what makes Ethereum’s current situation so unusual.
How low could Ethereum go?
If it loses the $1,668 line and the $1,580 floor decisively, technical analysts who map the downside identify a deep accumulation zone between roughly $1,600, which would be another 30-60% below current levels. This is the bear scenario, not a forecast, and it depends on continued fund outflows, a falling long-term average turning into resistance, and Bitcoin dragging the market lower. The bull scenario, in which Ethereum holds the line and recovers toward $3,000, is equally coherent. Which path unfolds depends on the line, the flows, the upgrades, and the macro environment.
What could turn Ethereum’s price around?
Several catalysts could flip the trend. A well-received scaling upgrade could refresh the narrative and give buyers a concrete reason to re-engage. A durable reversal of exchange-traded fund outflows back to sustained inflows would remove the primary drag and restore demand. Continued accumulation by corporate treasuries and large wallets, combined with the locked supply from record staking, could create a supply squeeze that lifts the price sharply once demand returns. And a shift toward easier monetary policy or renewed risk appetite would lift high-beta Ethereum substantially. Each depends on forces, especially the macro backdrop, that are not yet fully in place.
Is the “ETH trade” broken?
That is the bears’ core argument: that Ether, the token, is failing to capture the value its thriving network creates, because layer-two growth reduces main-chain fee pressure, institutional flows have reversed, and the price has fallen for a year despite record fundamentals. The bull rebuttal is that the fundamentals have built a coiled spring of locked supply and structural demand that will release once the macro tide turns and a catalyst arrives, and that the current weakness is macro-driven instead of a permanent break. The honest position is that the question is unresolved, and the 200-day line is where the market is deciding it.
This article is information, not investment advice. The scenarios described are conditional ranges that depend on unresolved questions, not predictions, and Ethereum is highly volatile. Prices, flows, staking figures, and fundamentals reflect reporting available as of June 26, 2026, and can change quickly. Nothing here is a recommendation to buy or sell. Verify current data from primary sources and consider your own circumstances before making any decision


BitGo is cutting nearly 15% of its workforce, CEO Mike Belshe announced Thursday, as the crypto custodian restructures around what it calls its highest-priority areas. Belshe posted the announcement on X, saying the company needs to be "sharper, more focused" and concentrate resources on five… Read the full story at The Defiant


StablecoinX Inc. (Nasdaq: USDE) began trading on the Nasdaq Capital Market Friday after closing its merger with SPAC TLGY Acquisition Corp., becoming the first publicly listed company structured around holding Ethena's governance token and building infrastructure for the Ethena ecosystem. The… Read the full story at The Defiant


Atomic settlement means both sides of a deal are complete at the same instant or neither does, removing the centuries-old danger that one party pays and the other fails to deliver. This guide explains payment-versus-payment, why blockchains make it natural, and how banks are now testing it for cross-border trades.
Summary
- Atomic settlement means both sides of a transaction complete at the exact same moment or neither does, removing the risk that one party pays and the other fails to deliver.
- It targets settlement risk, the danger that has haunted finance for decades, most famously when a bank’s collapse left counterparties paid on one leg but not the other.
- Payment-versus-payment (PvP) applies this to currency trades and delivery-versus-payment (DvP) to securities, ensuring the two legs are linked and simultaneous.
- Blockchains and smart contracts make atomic settlement natural, because a single transaction can be programmed to either execute both legs together or fail entirely.
- The shift promises to compress settlement from days toward instant, and bank-backed projects are now testing it for cross-border foreign exchange.
Atomic settlement is a way of completing a transaction so that both sides happen at the same instant or neither happens at all, with no possibility that one party fulfills its obligation while the other fails to fulfill theirs. The word “atomic” captures the essential property: the transaction is indivisible, an all-or-nothing event that cannot be split into a completed half and an uncompleted half. This may sound like an obscure technicality, but it addresses one of the oldest and most dangerous problems in finance, the risk that arises in the gap between agreeing to a trade and actually settling it, during which one party can pay or deliver while the other defaults, leaving the first party out of pocket.
Atomic settlement closes that gap entirely by binding the two sides of a transaction together so they succeed or fail as a single unit. Blockchains, as it happens, are unusually well suited to delivering this property, which is why atomic settlement has become a central promise of tokenized finance.
This guide explains what atomic settlement is, the settlement risk it eliminates, how it applies to payments and securities, why blockchains make it natural, and how banks are now testing it in the real world.
The reason this matters is that settlement risk, though invisible to most people, is a genuine systemic danger that has caused real crises, and the financial industry has spent decades and enormous resources trying to manage it. Atomic settlement offers something the traditional system has never quite achieved: the complete elimination of that risk, not its mitigation but its removal, by making it structurally impossible for one leg of a trade to settle without the other.
Combined with the ability to compress settlement times from days to near-instant, the implications for capital efficiency and financial stability are significant. This guide covers the meaning of atomicity, the nature of settlement risk and the famous failure that named it, the payment-versus-payment and delivery-versus-payment models, a concrete worked example, why blockchains make atomic settlement natural, the move from multi-day to instant settlement, the real-world bank projects now testing it, and the genuine hurdles that remain.
What atomic settlement means
Begin with the core property, because everything else follows from it. A transaction is atomic when it is indivisible: it either completes in full, with both sides fulfilling their obligations simultaneously, or it does not happen at all, with neither side committed. There is no in-between state in which one party has paid and the other has not.
The term is borrowed from computing, where an atomic operation is one that cannot be interrupted partway through, and it carries the same meaning in finance: an atomic settlement cannot be left half-done. If anything would prevent both legs from completing together, the entire transaction reverts, returning both parties to where they started as if nothing had happened.
This all-or-nothing quality is what makes atomic settlement powerful. In an ordinary transaction split across time, there is always a window during which one party has performed and is waiting for the other to perform, and in that window the first party is exposed to the risk that the second fails.
Atomic settlement abolishes that window by making the two performances a single, simultaneous, inseparable event. Neither party can find itself having given value without receiving it, because the giving and receiving are bound together and happen at once or not at all.
The significance is that a risk which traditional finance has always had to manage, monitor, and price, the risk lurking in the gap between the legs of a trade, simply ceases to exist under atomic settlement, because the gap itself is gone. Understanding that the entire benefit flows from this one structural property, indivisibility, is the key to understanding why atomic settlement matters.
The problem it solves: settlement risk
To appreciate atomic settlement, you have to understand the danger it removes, which is called settlement risk, and there is no better illustration than the event that gave one form of it its name. In 1974, a German bank named Herstatt was shut down by regulators in the middle of a business day. Earlier that day, counterparties had paid the bank in German marks as their side of foreign-exchange trades, expecting to receive United States dollars in return once the New York business day began. But the bank was closed before it made those dollar payments, so the counterparties had handed over their marks and received nothing back. They had performed their leg of the trade and were left exposed when the bank failed to perform its leg. This specific danger, where one party pays and the other fails before reciprocating, became known as Herstatt risk, a permanent reminder of what settlement risk can do.
Settlement risk, in general, is the risk that arises in any transaction where the two sides do not settle simultaneously. Whenever there is a gap between when one party performs and when the other does, the party that goes first is exposed to the possibility that the counterparty defaults, becomes insolvent, or simply fails to deliver in that interval. This is sometimes called principal risk, because the party can lose the entire principal amount it advanced, not merely the profit on the trade.
Across the global financial system, where trillions of dollars in currencies, securities, and other assets change hands daily, settlement risk is a pervasive and serious concern, and managing it requires extensive infrastructure, collateral, monitoring, and trust. Atomic settlement is so significant precisely because it does not merely reduce this risk through better management; it eliminates it structurally, by ensuring the two legs settle together so that neither party is ever exposed to the other’s potential failure. The problem that closed Herstatt and has haunted finance ever since simply cannot occur when settlement is atomic.
Payment-versus-Payment and Delivery-versus-Payment
The principle of atomic settlement shows up in finance under two main labels, depending on what is being exchanged, and knowing the difference clarifies the concept. When the exchange is one currency for another, as in a foreign-exchange trade, the atomic version is called payment-versus-payment, often abbreviated PvP.
Under PvP, the payment in one currency and the payment in the other currency are linked so that both happen simultaneously or neither does, ensuring that no party can pay in one currency without receiving the other. This is the direct answer to Herstatt risk: under true PvP, the situation that destroyed Herstatt’s counterparties, paying marks and not receiving dollars, becomes impossible, because the two payments are bound together.
When the exchange is an asset for a payment, as when securities are bought or sold, the atomic version is called delivery-versus-payment, abbreviated DvP. Under DvP, the delivery of the security and the payment for it are linked so that the asset changes hands at the same instant as the money, ensuring that no party delivers a security without receiving payment, and no party pays without receiving the security.
Both PvP and DvP are expressions of the same atomic principle applied to different kinds of trades, and both aim to eliminate the settlement risk that lives in the gap between the legs. The traditional financial system has built elaborate infrastructure to approximate these protections, such as specialized settlement institutions that hold both legs and release them together, but these systems are complex, do not cover every currency or market, and still leave gaps. Atomic settlement on a blockchain offers a way to achieve PvP and DvP more directly and more universally, which is a large part of why the technology has drawn such intense institutional interest.
A worked example: an FX trade with and without atomicity
To make settlement risk and its atomic solution concrete, walk through a single foreign-exchange trade both ways. Suppose a bank in Europe agrees to sell ten million euros to a bank in Asia in exchange for the equivalent in dollars. Under the traditional, non-atomic process, the two payments may not happen at the same moment, because the banks operate in different time zones and through different payment systems.
The European bank might send its euros during its business day, expecting the dollars to arrive later when the other party’s systems process the payment. In the interval between sending the euros and receiving the dollars, the European bank is exposed: if the Asian bank fails, defaults, or is shut down in that window, the European bank has paid ten million euros and may receive nothing, losing the entire principal. This is exactly the Herstatt scenario, and it is a real risk that institutions must monitor and manage on every such trade.
Now run the same trade with atomic settlement. The euro payment and the dollar payment are bound together into a single, indivisible transaction, structured so that both transfers execute at the same instant or neither executes at all. If for any reason the dollar leg cannot complete, the euro leg does not complete either, and both banks remain exactly where they started, with no exposure and no loss.
The European bank can never find itself having sent euros without receiving dollars, because the protocol makes that outcome structurally impossible. The risk window that existed in the traditional version is gone, not managed or reduced but eliminated, because the two legs are no longer separated in time. That is the difference atomicity makes: it converts a trade with an unavoidable risk window into a trade with no risk window at all, which is why the financial industry regards atomic settlement as a genuine advance rather than an incremental improvement.
Why blockchains make atomic settlement natural
Atomic settlement is not new as a concept, but blockchains make it dramatically easier to achieve, and understanding why reveals the deep fit between the technology and the problem. A blockchain transaction is, by its nature, atomic at the level of the ledger: it either executes completely and is recorded, or it fails and changes nothing. Smart contracts, the programmable agreements that run on many blockchains, extend this property to complex, multi-step transactions.
A smart contract can be written so that it performs two transfers, say, moving one asset from party A to party B and another asset from party B to party A, as a single operation that either completes both transfers together or reverts entirely, leaving both parties untouched. This is atomic settlement expressed directly in code, with the all-or-nothing guarantee enforced by the blockchain itself rather than by an external institution.
This is a profound fit, because the property that finance has always struggled to guarantee, that two legs of a trade settle together or not at all, is something a blockchain provides almost for free, as a basic feature of how it works. The earliest crypto version of this idea was the atomic swap, a way for two parties to exchange different cryptocurrencies such that the swap either completes for both or fails for both, with no possibility of one party absconding with the other’s coins.
The same principle now underpins the tokenization of traditional assets: if currencies and securities are represented as tokens on a blockchain, then trades between them can be settled atomically by smart contracts, achieving true PvP and DvP without the elaborate intermediary infrastructure the traditional system requires. The blockchain becomes the neutral venue where both legs settle simultaneously and trustlessly. This is why atomic settlement is so central to the institutional interest in tokenization: the technology delivers, as a native capability, the settlement guarantee that traditional finance has spent decades and fortunes trying to approximate.
From multi-day to instant settlement
Closely tied to atomic settlement is the compression of settlement time, and the two together explain much of the institutional excitement. In traditional markets, settlement often does not happen immediately after a trade is agreed; instead, it occurs after a delay, commonly a couple of business days for many securities, a convention referred to by labels like T plus two, meaning trade date plus two days.
This delay exists for historical and operational reasons, because the traditional system needs time to coordinate the many parties, records, and transfers involved in settling a trade. But the delay is costly: during the gap between trade and settlement, capital is tied up, positions carry risk, and the settlement exposure discussed above persists for longer. Shortening the cycle has been a long-running goal of market reform, with markets gradually moving from longer cycles to shorter ones over the years.
Atomic settlement on a blockchain points toward the logical endpoint of this trend: instant settlement, sometimes called T plus zero, where the trade settles the moment it is executed. Because a smart contract can bind and complete both legs simultaneously, there is no operational reason for a multi-day delay; the settlement can happen at the instant of the trade.
This collapses the settlement window from days to seconds, which has large benefits. Capital is freed immediately rather than tied up for days, settlement risk persists for moments instead of days, and the entire system becomes more efficient and less exposed. The combination of atomicity, which removes the risk in the gap between legs, and instant settlement, which removes the gap in time, is what makes blockchain-based settlement so attractive to institutions.
Together, they promise a financial system where trades settle instantly and with no settlement risk, a meaningful improvement over a status quo built around multi-day cycles and the risks they carry.
The real-world push: bank projects and tokenization
This is not merely theoretical, because banks and market infrastructures are actively testing atomic settlement, which signals that the technology is moving from concept toward production. A notable recent example is a bank-backed initiative bringing together a large group of international banks to study faster cross-border foreign-exchange settlement using atomic, payment-versus-payment swaps of compliant stablecoins, aiming to replace the multi-day settlement that currency trades often still require with simultaneous, same-instant settlement.
The design deliberately works with existing bank standards and messaging infrastructure instead of asking banks to abandon their systems, layering atomic settlement onto the rails they already use. The scale of such efforts, involving banks representing trillions of dollars in assets, shows that the institutional world takes atomic settlement seriously as a practical goal, not just a research curiosity.
The broader context is the tokenization of real-world assets, which is the larger movement that atomic settlement enables. As currencies, government bonds, equities, and funds are increasingly represented as tokens on blockchains, the trades between them can be settled atomically, achieving the simultaneous, risk-free settlement that has long been the ideal.
Major financial institutions and market infrastructures have been running pilots and building platforms for tokenized assets precisely because the settlement properties are so attractive, and the tokenized-asset sector has grown substantially as a result. The convergence of tokenized assets and atomic settlement is, in many ways, the heart of the institutional crypto thesis: not speculative tokens, but the use of blockchain technology to settle real financial transactions instantly and without settlement risk.
The bank projects testing it today are the early, concrete steps toward that future, and their progress is a useful signal of how quickly atomic settlement is moving from promise to practice.
Risks and open questions
For all its promise, atomic settlement carries real hurdles and risks that an informed reader should weigh instead of accepting the idealized vision. The first is a liquidity requirement: atomic settlement demands that both legs of a trade be available to settle at the same instant, which means the necessary assets or funds must actually be present on the settlement venue simultaneously. In a world where value is fragmented across many blockchains and traditional systems, ensuring that both legs are present and ready at the same moment is a genuine operational challenge, and a trade cannot settle atomically if one side’s liquidity is not there when needed.
Other open questions are significant. Legal finality is one: for atomic settlement to be trusted by institutions, the law must recognize a blockchain settlement as final and irreversible in the same way it recognizes traditional settlement, and the legal frameworks for this are still developing in many jurisdictions.
Fragmentation is another, because if assets are tokenized across many incompatible blockchains, achieving atomic settlement between them requires interoperability that does not always exist, and bridging between chains can reintroduce the very risks atomic settlement was meant to remove.
There are also operational demands, since instant, around-the-clock settlement requires institutions to manage liquidity continuously instead of within business-day cycles, a real change to how treasury operations work. And the technology itself must be secure, because a flaw in a settlement smart contract could undermine the guarantees the whole system relies on.
None of these hurdles is necessarily fatal, and the active bank projects suggest they are being worked through, but they are real, and atomic settlement should be understood as a powerful approach still maturing instead of a finished solution. As with any emerging financial technology, the gap between a successful pilot and universal adoption can be wide, and the risks in that gap are worth respecting.
Frequently Asked Questions
What is atomic settlement in simple terms?
Atomic settlement is a way of completing a transaction so that both sides happen at the same instant or neither happens at all. The word “atomic” means indivisible: the transaction cannot be left half-done, with one party having paid and the other not. If anything would stop both legs from completing together, the whole transaction reverts and both parties end up where they started. This removes the risk that one party performs while the other fails, which is the core danger in any trade where the two sides do not settle simultaneously.
What is settlement risk?
Settlement risk is the danger that arises in the gap between agreeing to a trade and actually settling it, during which one party can pay or deliver while the other defaults, leaving the first party exposed. It is sometimes called principal risk, because the exposed party can lose the entire amount it advanced. The classic example is Herstatt risk, named after a German bank shut down in 1974 after its counterparties had paid it in marks but before it paid them dollars, leaving them with nothing. Atomic settlement eliminates this risk by binding the two legs together.
What is the difference between PvP and DvP?
Both are forms of atomic settlement applied to different trades.
Payment-versus-payment, or PvP, applies to currency exchanges, linking the payment in one currency to the payment in the other so both happen together or neither does, which directly prevents Herstatt-style losses.
Delivery-versus-payment, or DvP, applies to securities, linking the delivery of the asset to the payment for it so the security and the money change hands at the same instant. Both express the same atomic principle, ensuring no party gives value without simultaneously receiving what they were promised.
Why are blockchains good at atomic settlement?
Because a blockchain transaction is naturally atomic: it either executes completely or fails and changes nothing. Smart contracts extend this to complex trades, allowing two transfers to be bound into a single operation that either completes both together or reverts entirely. This gives, as a native feature, the all-or-nothing settlement guarantee that traditional finance has spent decades trying to approximate with elaborate intermediary infrastructure. When currencies and securities are tokenized on a blockchain, trades between them can settle atomically through smart contracts, achieving true PvP and DvP directly.
What is the difference between T+2 and T+0 settlement?
T plus two means a trade settles two business days after it is agreed, a common convention in traditional markets that exists because the legacy system needs time to coordinate the many parties and records involved. During that delay, capital is tied up and settlement risk persists. T plus zero, or instant settlement, means the trade settles the moment it is executed, which atomic settlement on a blockchain makes possible because a smart contract can complete both legs simultaneously. Moving from T plus two to T plus zero frees capital immediately and shrinks the risk window from days to seconds.
Is atomic settlement actually being used?
It is being actively tested and piloted instead of universally deployed. Bank-backed initiatives have brought together large groups of international banks to study faster cross-border foreign-exchange settlement using atomic, payment-versus-payment swaps, working with existing bank standards instead of replacing them. The broader tokenization of real-world assets, which has grown substantially, relies on atomic settlement as a core benefit, and major institutions have run pilots and built platforms around it. So atomic settlement is moving from concept toward practice, though real hurdles around liquidity, legal finality, interoperability, and operations remain to be worked through.
This article is educational information, not financial or investment advice. The technology and the projects described are still developing, and details reflect reporting available as of June 26, 2026, which can change quickly. Verify current information from primary sources before relying on anything described here.
Why are American billionaires able to live tax-free? It’s becuase they dont hold any real cash. Rather, they hold billions of dollars in stock, and the country doesn’t tax unrealized gains.
But what if it did? South Korea is planning to do it. The Netherlands also tried to push it. Some US lawmakers are debating versions of their own. The target of these tax initiatives is wealth like Elon Musk’s.
He became the first trillionaire on June 12, with a fortune built almost entirely on unsold stock. Move him to Seoul, or change US law, and the bill arrives. But the key question is how big would it be?
The Tax Laws Spreading Across The World
The latest flashpoint arrived in Seoul. This week, lawmakers and labor groups proposed folding unrealized gains on stocks and real estate into income tax.
In the Netherlands, the Lower House of the Dutch Parliament passed the Box 3 Actual Return Act on February 12, taxing annual paper gains on stocks, bonds, and crypto at a flat 36%. The law targets a 2028 start and still needs Senate approval.
Backlash was swift. On February 25, the finance minister said the measure could not proceed as written and would require amendments. The FT reported earlier this month that the coalition under Prime Minister Rob Jetten is preparing a round of concessions.
US Lawmakers Target the “Buy, Borrow, Die” Playbook
In the United States, Senator Ron Wyden has introduced the Billionaires Income Tax. The bill, with more than 20 cosponsors, would tax tradable assets, such as stocks, annually at market value.
“The purpose of this bill is to require billionaires to pay taxes annually by eliminating the ability of high income and high net worth taxpayers to use tax planning strategies such as ‘buy, borrow, die’ to defer paying taxes indefinitely,” the bill reads.
The bill does not set a new tax rate. Instead, it changes when the ultra-wealthy pay. Tradable assets, such as stocks, would be marked to market each year and taxed as long-term capital gains.
This means the existing top rate of up to 23.8% (the 20% long-term capital gains rate plus the 3.8% net investment income tax) applies annually rather than only at sale.
Meanwhile, gains on nontradable assets like real estate and private businesses would be taxed at the normal capital gains rate plus a “deferral recapture” interest charge, with the combined total capped at 49% of the gain.
Representatives Steve Cohen and Don Beyer introduced an identical House companion, making this the first Congress with a bicameral Billionaires Income Tax.
Notably, the numbers show a coordinated push. In March, Senator Elizabeth Warren reintroduced the Ultra-Millionaire Tax Act.
Follow us on X to get the latest news as it happens
Warren’s plan sets a 2% annual tax on every dollar of net worth above $50 million. The rate rises to 3% on every dollar of net worth above $1 billion (a 1% surtax on top of the 2% base).
Separately, California voters will decide on a wealth tax this November after the measure qualified for the ballot. The California Billionaire Tax Act would impose a single 5% tax on residents with a net worth exceeding $1 billion.
The Billionaire Tax Now Coalition has since written to Governor Gavin Newsom, indicating it is open to compromise. The group said it would back a lower 2% rate in place of the 5% it first sought.
A $945 Billion Fortune the Tax Code Barely Touches
Meanwhile, Musk’s wealth milestone has put the “Tax The Rich” narrative back in focus. He hit the trillion mark when SpaceX (SPCX) listed on the Nasdaq on June 12.
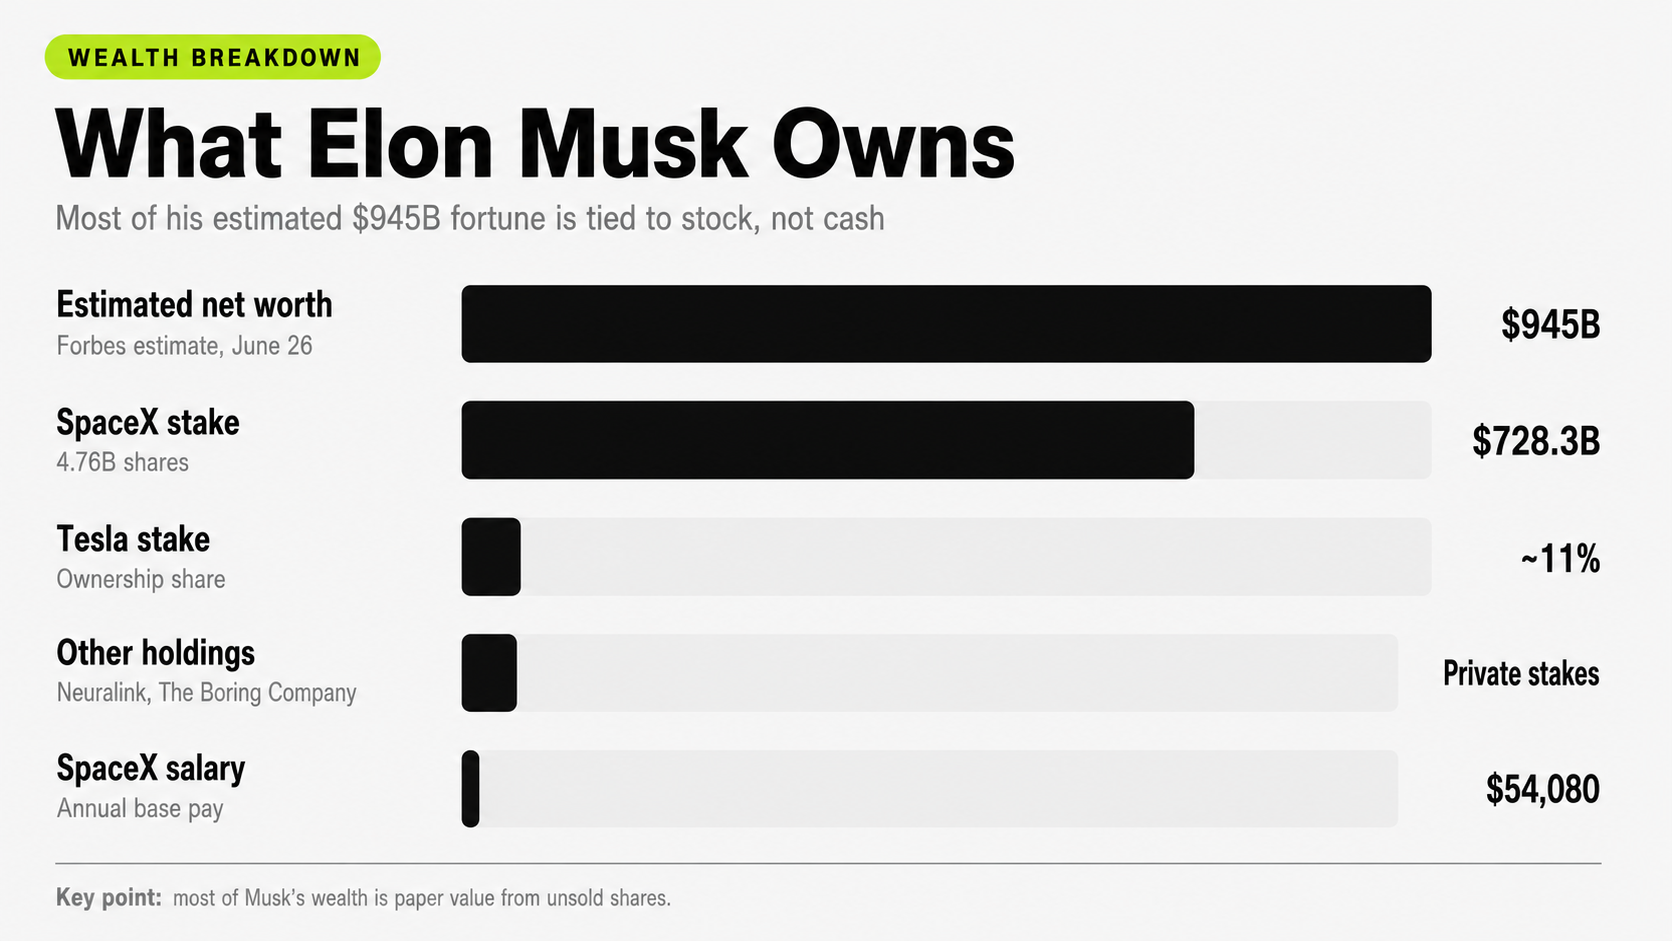
A tech selloff then pulled the stock down 24% from its June 16 high. By June 26, Forbes valued him at about $945 billion.
He still leads the ranking by a wide margin, with Larry Page second at nearly $281.6 billion. The bigger story for tax policy is what happens to that fortune each year.
Even after the slide, SpaceX drives the majority of its fortune. Musk’s base salary at SpaceX remains at $54,080 per year, unchanged since 2019.
However, his stake runs to about 4.76 billion shares. According to Bloomberg, that excludes roughly 1.3 billion unvested restricted shares tied to performance and other conditions, as well as 237,530 shares pledged as collateral for debt.
He also holds 350,000 exercisable options. At the recent price near $153, the stake is worth about $728.3 billion.

A June 2026 Form 4 filing puts his Tesla stake at roughly 11%. That figure leaves out 424 million restricted shares from his 2025 CEO award, which vest only if performance and other conditions are met. Musk also holds stakes in his startups, Neuralink and The Boring Company.
Tesla has never paid a dividend, so nearly all of its return is paper appreciation. Current US law taxes that only at sale. So a fortune of nearly $945 billion does not yield a comparatively high tax bill.
Past filings show the pattern. ProPublica reported that he paid $455 million on $1.52 billion of income from 2014 through 2018, and no federal income tax in 2018. Measured against his wealth growth, ProPublica put his true tax rate near 3%.
The defining feature is how little of this is cash. His wealth is stock he has not sold, not money in the bank.
What Musk Would Owe If These Taxes Applied to Him
The answer depends entirely on which kind of tax applies. Wealth taxes hit his total net worth. Unrealized-gain taxes hit only the yearly increase.
Start with Warren’s wealth tax, applied to his roughly $945 billion. The 2% rate covers the band between $50 million and $1 billion. The 3% rate covers every dollar above $1 billion. Together, they produce about $28.3 billion a year.
Wyden’s bill works differently, taxing the gain rather than the stock of wealth. Assuming a negligible cost basis, roughly his entire fortune could be treated as an unrealized gain.
Year one is the outlier. With no prior mark, the first assessment captures his entire built-up gain. At 23.8%, that catch-up amounts to about $220 billion, which the bill allows him to pay over five years.
After that, his basis resets, so each year, taxes only that year’s new gain. A $100 billion increase in revenue would cost about $24 billion. A flat year brings almost nothing, and a down year books a loss he can carry back.
California’s measure is a single levy, not an annual one. A 5% tax on his net worth would come to about $47 billion. The 2% compromise floated by backers would still take about $19 billion.

The figures above are hypothetical. Musk lives in Texas, and none of these proposals is law. They show what each plan would collect if it were to reach its fortune.
What That Money Could Do
The sums are easier to grasp in relation to global needs. The UN World Food Programme estimates that ending world hunger by 2030 would cost about $93 billion a year. Its entire 2026 plan to feed 110 million people costs $13 billion.
Warren’s tax on Musk alone, about $28.3 billion a year, would more than double that annual budget. It would also cover roughly 30% of the yearly cost to end world hunger, from one person.
Wyden’s $220 billion first-year catch-up would fund the global hunger goal for more than two years. California’s $47 billion would cover about half of a single year.
Bring it home, and the gap holds. The National Alliance to End Homelessness put a number on it in 2025.
It suggested that about $9.6 billion would be enough to provide a Housing First placement to households who used a US shelter in a single year. Warren’s yearly tax on Musk alone would cover the figure with room to spare.
The Bill Could Vanish as Fast as It Appears
The numbers carry a catch, and the past month exposed it. Most of Musk’s wealth is in stock he cannot sell quickly, and its value can swing by hundreds of billions in a single day. The stock is already down 24% from its June 16 high.
That volatility cuts both ways. A tax on paper gains only collects when the paper shows a gain. In a down year, Musk would post unrealized losses instead, owe nothing on them, and could carry them forward to offset gains in other years. The same swing that creates a huge bill in one year can erase it the next.
Liquidity is the other limit. A large annual bill could force him to sell shares to cover it, but his SpaceX lockup currently prevents him from doing so.
Mobility adds a third. California has already lost billionaires before its deadline, and the Dutch plan raised emigration concerns.
For now, the gap holds. It is real enough to rank him first in the world, yet untaxed until the day he chooses to sell.
Subscribe to our YouTube channel to watch leaders and journalists provide expert insights
The post How Much Tax Would Elon Musk Pay If This US Bill Passes? appeared first on BeInCrypto.


Securitize, the tokenization platform behind BlackRock's BUIDL fund, will begin trading on the New York Stock Exchange on July 2 under the ticker SECZ after a SPAC merger that closed with more than $400 million in cash. Securitize CEO Carlos Domingo confirmed the terms Friday morning on his… Read the full story at The Defiant
Crypto World
Bipartisan Senators Ask CFTC Chair Whether Agency Is Investigating Polymarket's Fake-Bet Campaign


— title: Bipartisan Senators Ask CFTC Chair Whether Agency Is Investigating Polymarket's Fake-Bet Campaign excerpt: Senators Adam Schiff and John Curtis sent a letter to CFTC Chair Michael Selig Thursday asking whether the agency is investigating Polymarket's paid influencer scheme, putting the… Read the full story at The Defiant


Kraken's xStocks platform is letting eligible customers in the European Economic Area and select global markets submit non-binding interest in the Bending Spoons IPO, the platform's second pre-IPO tokenized equity offering and its first for a non-US tech company filing for Nasdaq. Bending Spoons,… Read the full story at The Defiant
Crypto analytics firm CryptoQuant is urging MicroStrategy-linked holding company Strategy to slow down its Bitcoin accumulation, arguing that its dividend financing cushion has narrowed sharply. The warning arrives as investors increasingly scrutinize how Strategy’s cash flows, preferred-share obligations, and debt actions combine to fund new purchases.
Meanwhile, other crypto-industry developments underline how quickly market structure and traditional finance integration are moving—ranging from CBOE’s consideration of perpetual-style Bitcoin and Ether futures to new research efforts connecting stablecoins with cross-border FX settlement. Zcash mining company Fortitude is also preparing to reach public markets via a Nasdaq merger.
Key takeaways
- CryptoQuant says Strategy’s dividend coverage has fallen to about 14 months from roughly seven years, arguing the current pace of Bitcoin buying may be harder to sustain.
- Strategy’s dividend burden rose after large issuances of STRC preferred shares with an 11.5% yield, and CryptoQuant points to additional pressure from repurchasing 2029 senior notes.
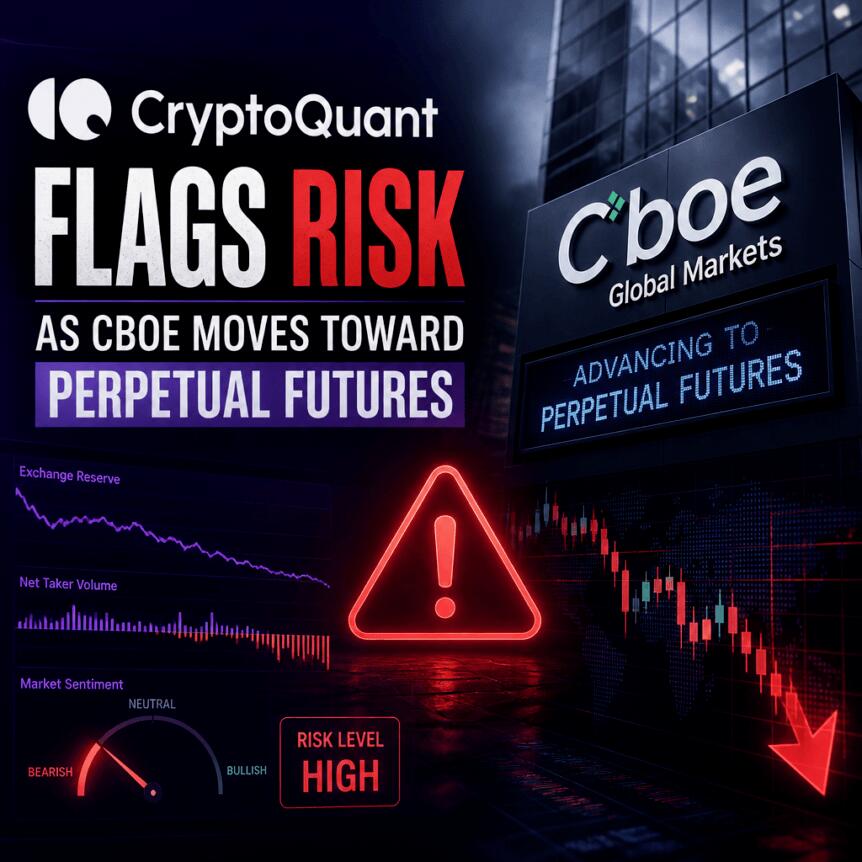
- CBOE is reportedly exploring whether continuous Bitcoin and Ether futures could be converted into perpetual contracts—following broader regulatory momentum for perpetual futures.
- Chainlink is joining a banking working group to study stablecoin-based FX settlement between euro and won, using blockchain settlement concepts rather than launching a payment network.
- Fortitude Mining Holdings is pursuing a Nasdaq listing through an all-stock merger with HeartSciences, with the combined entity expected to trade under the Fortitude name.
CryptoQuant warns Strategy’s dividend coverage has tightened
In a thread posted earlier this week, CryptoQuant argued that Strategy’s aggressive Bitcoin buying has become increasingly difficult to sustain, urging the company to pause additional acquisitions and rebuild its cash reserves. The catalyst, according to CryptoQuant, is a steep deterioration in dividend coverage—down to roughly 14 months from about seven years.
CryptoQuant CEO Ki Young Ju said Strategy’s cash position has weakened as annual dividend obligations rose to approximately $1.2 billion following large issuances of STRC preferred shares carrying an 11.5% yield. CryptoQuant also notes that Strategy’s cash reserve rebounded to around $1.4 billion after recent MicroStrategy (MSTR) share sales, but that reserve remains down 38% year-to-date after the company repurchased $1.5 billion of its 2029 senior notes.
Beyond the cash trajectory, CryptoQuant highlighted a potential constraint in Strategy’s ability to fund itself through preferred-share issuance. It pointed out that STRC preferred shares recently traded as much as 17.5% below their $100 par value, which it said could limit the company’s capacity to raise fresh capital through additional preferred stock sales.
The core implication for investors is straightforward: even if Strategy is not facing an immediate liquidity crisis, the financing model supporting Bitcoin purchases is under a tighter margin. Dividend obligations tied to preferred equity can become a more immediate drag when reserves shrink and refinancing flexibility declines. Investors watching Strategy’s next purchases may therefore focus less on headline accumulation targets and more on whether cash buffers and dividend coverage stabilize.
CBOE weighs converting continuous futures into perpetual contracts
In a separate market-structure shift, the Chicago Board Options Exchange (CBOE) is reportedly considering a plan to convert its continuous Bitcoin and Ether futures into perpetual futures. The potential move was described in a Wall Street Journal report, and it would mark a notable evolution for a venue that already launched continuous contracts last December, with ten-year extensions.
Perpetual futures differ from traditional futures mainly because they do not have an expiration date. That structure allows traders to carry leveraged exposure indefinitely, which is one reason perpetual products have gained broad traction across derivatives venues over the years, including on crypto-native platforms.
The idea also fits with recent regulatory momentum in the United States. According to the reporting around the CFTC’s actions, the regulator approved crypto perpetual futures for Kalshi and outlined a framework that other registered exchanges could follow. If CBOE moves forward, it would be joining an expanding list of efforts to bring perpetual-style mechanics into more traditional exchange ecosystems.
For traders, the key variable is how perpetual contracts may change hedging and risk management compared with dated or continuous futures. For exchanges, it is a question of product demand, margin mechanics, and regulatory compatibility—especially as perpetual formats become more common in both centralized and decentralized derivatives markets.
Chainlink joins banks to test stablecoin FX settlement concepts
Chainlink has joined a cross-border banking initiative aimed at exploring whether regulated euro- and won-backed stablecoins can support real-time foreign exchange settlement. The project, known as Project Pangea, brings together European and South Korean institutions to evaluate blockchain-based settlement approaches, including atomic swap concepts.
Project Pangea is described as a working group rather than a launch of a live payment network. The participants include South Korean digital asset infrastructure company FairSquareLab, the Unified Korea Alliance (UniKA), Qivalis, and Chainlink. The collaboration is focused on wholesale financial market mechanics—where FX is one of the largest trading arenas globally—rather than on retail transfers.
The broader significance is that banks and market infrastructure groups are continuing to experiment with stablecoins and tokenized settlement rails to reduce friction in cross-border transactions. The initiative aligns with growing interest in how tokenized deposits and stablecoins could modernize settlement workflows, potentially lowering latency and improving composability across counterparties.
Still, Project Pangea is exploratory. What remains uncertain is whether the group’s findings translate into operational products, which jurisdictions and regulatory frameworks would govern any real-world deployments, and how atomic-swap settlement might be integrated into existing market infrastructure.
Zcash miner Fortitude targets Nasdaq via merger with HeartSciences
Fortitude Mining Holdings, a Zcash miner, is set to pursue a Nasdaq listing through an all-stock merger with medical technology company HeartSciences. The plan is designed to secure a Nasdaq presence without going through a traditional initial public offering, and HeartSciences shareholders are expected to retain a minority stake in the combined company.
After the transaction, the merged entity will operate under the Fortitude name and is expected to trade on Nasdaq under the ticker TUDE, pending regulatory approval. The merger announcement also appeared to move HeartSciences’ shares sharply higher, with reports noting gains as large as 91% on Tuesday.
The deal is particularly notable because it connects two businesses from different sectors—healthcare and crypto mining—under a single public-market wrapper. Prior to the merger, HeartSciences was reportedly unprofitable, posting a net loss of $8.77 million in fiscal 2025 despite continuing to advance its product roadmap.
For the crypto side, investors will likely look beyond the listing mechanics and ask how mining economics, funding plans, and market conditions will factor into the combined company’s strategy once it reaches public markets.
Next, market participants should watch whether Strategy’s dividend coverage stabilizes alongside any changes in Bitcoin purchase pacing, whether CBOE’s perpetual-futures consideration turns into a formal product filing, and how Project Pangea’s technical work progresses toward any regulated settlement trials.
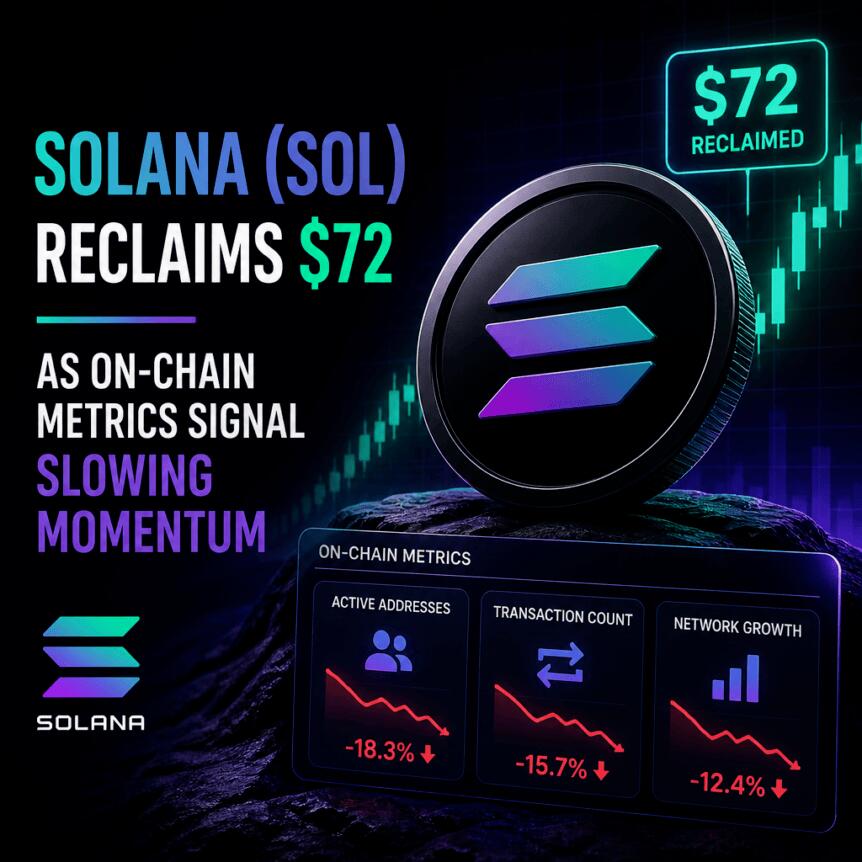
Solana’s native token SOL rebounded sharply this week, climbing to around $72 on Friday after falling to about $64 the day before. Traders pointed to renewed optimism around tokenized assets on the network—particularly tokenized stock products—while market data also highlighted a more fragile foundation for sustained momentum: Solana’s onchain liquidity and DEX activity have been cooling.
The result is a mixed near-term picture for investors. Futures positioning has turned more bullish, but DeFi metrics—especially Total Value Locked (TVL) and decentralized exchange volumes—show that demand for SOL-linked onchain activity remains uneven.
Key takeaways
- SOL’s move back to ~$72 comes as tokenized stocks on Solana posted more than $113 million in 24-hour volume, per Jupiter Aggregator data.
- Still, Solana TVL fell 11% over the past month, including declines across major protocols such as Kamino, Raydium, and Binance Staked SOL.
- DEX volumes on Solana have dropped to about $10 billion per week from roughly $30 billion in early February, alongside weaker decentralized application revenues.
- Solana’s DApp economy appears concentrated: Cointelegraph cited that Pump.fun accounts for about 30% of Solana DApp revenue, tying activity to memecoin dynamics.
- While SOL futures funding rose to around 10% (highest in June), the level remains within a range often described as closer to neutral than “overheated.”
Tokenized stocks lift activity, but liquidity remains a question
One of the clearest drivers behind SOL’s optimism is activity tied to tokenized equities trading on Solana. According to Jupiter Aggregator, tokenized stock instruments traded for more than $113 million over 24 hours. For traders watching for catalysts to sustain an “altcoin season” narrative on Solana, these volumes offer a tangible signal that new demand is showing up where it matters: in spot liquidity and swap flow on Solana’s venues.
However, the story isn’t uniformly bullish. The same data segment raised concerns about liquidity depth inside automated market-maker pools, especially as multiple issuers compete for similar exposure. Thin liquidity can make price discovery more volatile and can reduce the stickiness of trading demand if users find spreads widen or exits become harder during fast moves.
There’s also a timing wrinkle: many tokenized instruments launched recently, which can correspond with low holder counts. That doesn’t automatically invalidate the trend, but it does mean investors should watch whether participation broadens beyond the initial launch cycle.
TVL and DEX volumes point to softer baseline demand
Outside of the tokenized equities narrative, broader Solana DeFi conditions have weakened. DefiLlama data referenced in the report shows Solana’s TVL declined 11% over the past month. At the same time, Ethereum’s layer-2 network Base has reduced the gap between the two ecosystems, putting more competitive pressure on Solana’s standing as a high-throughput DeFi hub.
Looking at protocol-level declines, the report cited a 19% TVL drop in Kamino, a 20% trim by Binance Staked SOL, and a 17% decline by Raydium. Not every protocol moved in the same direction: xStocks reportedly grew TVL by 31%, aligning with the upbeat headlines around tokenized products.
Still, the DEX picture is the part that may temper expectations. Solana decentralized exchange volumes fell to around $10 billion per week from $30 billion in early February, and the downtrend coincided with declining DApp revenues. In practical terms, tokenization can create bursts of activity, but if overall exchange throughput remains muted, SOL demand tied to transaction processing may struggle to sustain a strong rally on its own.
Pump.fun concentration and leverage positioning add volatility
The next issue for readers is concentration risk in Solana’s DApp revenue. Cointelegraph cited that Pump.fun accounts for roughly 30% of Solana DApp revenue. That matters because Pump.fun’s output is closely tied to memecoin cycles, which can be intense but also short-lived.
CoinGecko’s research, referenced in the report, indicated that 80% of tokens launched on Pump.fun within less than 48 hours, based on a sample of 18.7 million tokens. Dune data cited alongside it suggested that 55% of involved addresses lost up to $1,000. The combination of rapid launches and high loss rates is not necessarily a direct bearish signal for SOL—but it does underline that a large share of onchain revenue may be driven by speculative dynamics rather than steady, utility-driven retention.
Meanwhile, derivatives markets have shifted more optimistic. The report referenced a funding-rate gauge from Laevitas, noting that bullish leverage demand increased on Friday and that the funding rate reached its highest level in June. The current funding rate of about 10% was described as not “excessive,” since a 6% to 12% band is often treated as neutral. Still, the report highlighted that SOL’s recovery—up roughly 14% from the $64 low—helped reverse earlier bearishness reflected in negative funding rates.
For traders, this implies a more supportive short-term backdrop: funding turning positive can reflect demand to stay long. But when tokenization narratives are active while baseline DeFi usage cools, leverage can also amplify drawdowns if liquidity thins again or if tokenized trading interest fades.
Airdrop hopes and new tokenized infrastructure may matter—competition is real
Some of SOL’s momentum is linked to expectations around potential network airdrops, though the timing and specific launch schedule remain uncertain. The report pointed to various projects and metrics that traders may associate with an “ecosystem runway,” including OnRe reinsurance (with $200 million in TVL), Bulk perpetual DEX (aggregate open interest of $325 million), and Loopscale lending platform (TVL of $79 million).
Even so, the report urged caution about assuming SOL must reclaim the $80 level seen on June 1. The reason is competition—not just from within Solana’s own tokenization ecosystem, but also from other venues and centralized platforms. The report specifically noted increased competition in tokenized stock trading from Hyperliquid and from centralized exchanges on competing chains.
One example cited was a strategic partnership between OKX and the NYSE parent company, reportedly using Ethereum-based systems. For investors, this is a reminder that the “tokenized equities” narrative isn’t exclusive to Solana. If liquidity and user attention fragment across networks and regulated rails, SOL’s tokenization volumes could remain high at times while still failing to translate into durable onchain strength.
What to watch next is whether Solana can convert tokenized-equities volume into broader, repeatable onchain activity—measured through sustained TVL and DEX throughput—while futures funding stays positive without turning extreme. If SOL’s rally holds alongside improving liquidity depth in tokenized pools, the current optimism may solidify; if DEX volumes and revenues keep slipping, the market may treat tokenized stock flows as temporary.
Bitcoin options traders remain heavily positioned for downside protection, with both crypto-native and exchange-traded fund investors showing elevated demand for downside hedges, according to new research by Anchorage Digital’s head of research, David Lawant.
The report analyzed options activity across Deribit, BlackRock’s iShares Bitcoin Trust (IBIT) and Strategy (MSTR), saying the three markets together provide a broader view of crypto-native, institutional and retail investor sentiment than any single options market alone.
Both Deribit and IBIT options markets showed elevated put skew, indicating traders are paying a premium for downside protection rather than positioning for further gains. The report found defensive positioning ranked in the 82nd percentile of IBIT’s history and the 84th percentile of Deribit’s five-year history.
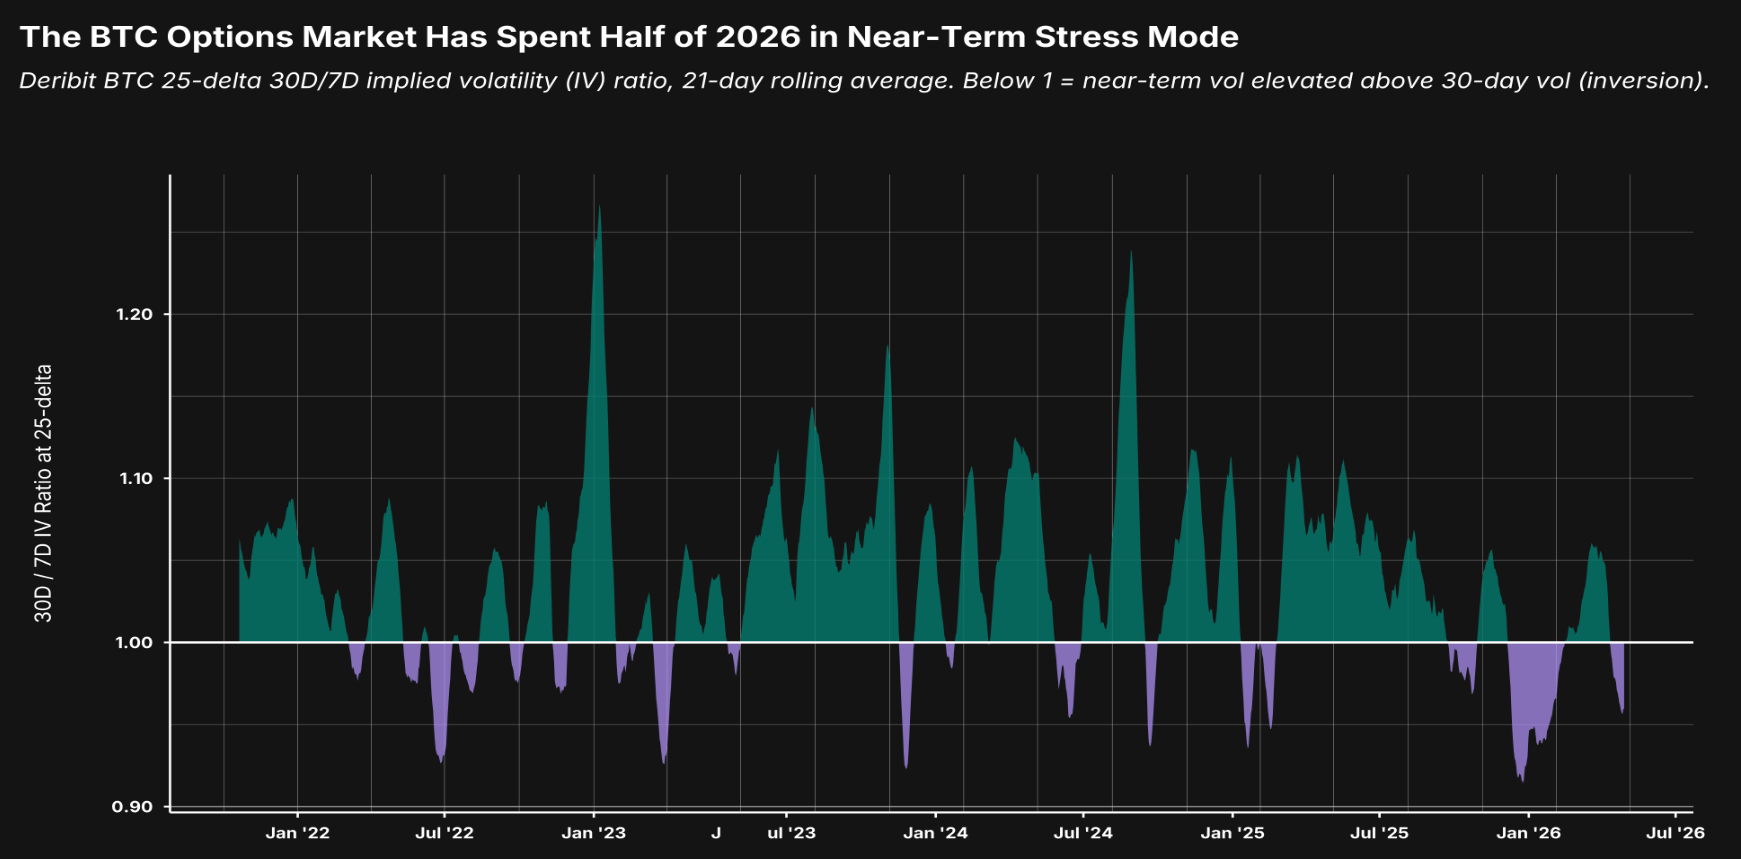
Anchorage also found that Bitcoin (BTC) options markets have spent nearly half of 2026 pricing higher implied volatility over the next week than over the next month, an unusual inversion that has historically been episodic and short-lived. The report attributed the pattern to a succession of macroeconomic, geopolitical and crypto-specific catalysts that have kept traders focused on near-term risks.
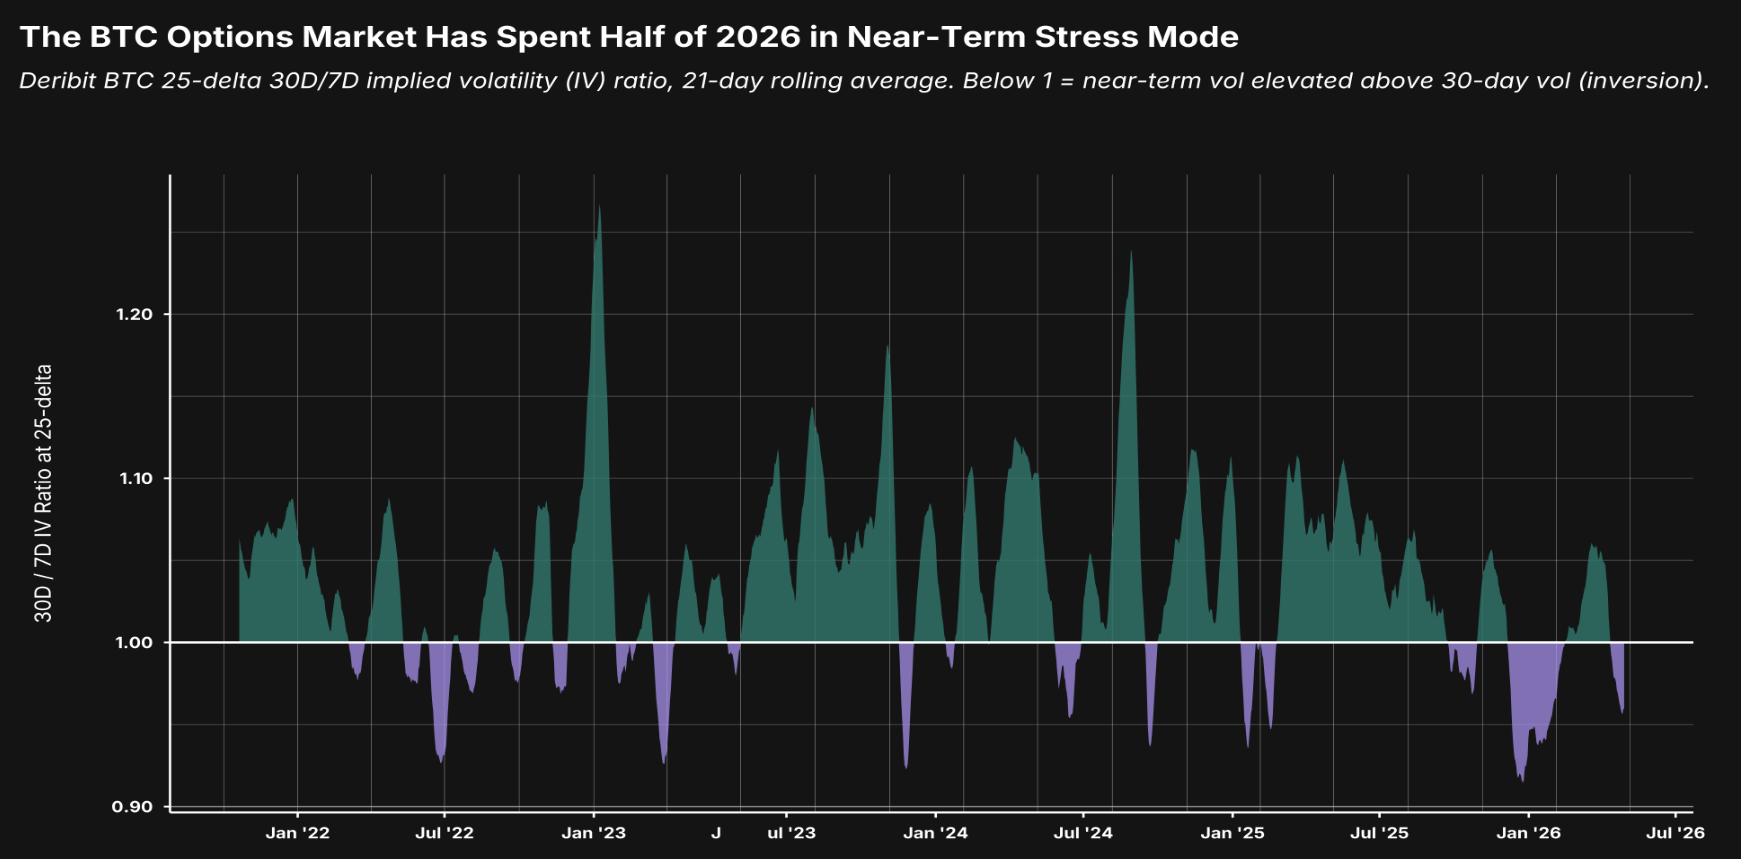
Bitcoin options 30-day/7-day implied volatility ratio. Source: Anchorage Digital report
Taken together, the findings suggest options traders remain focused on managing near-term risks rather than positioning for a clear directional move. Lawant said he is watching for one-month implied volatility to once again exceed one-week implied volatility, a shift he said would indicate markets are becoming more comfortable looking beyond immediate risks.
Related: Bitcoin price is down over 40% since STRC launched: Is Strategy ‘fine’?
Options market not signaling Strategy crisis
The analysis from Anchorage Digital also suggests investors remain cautious but are not pricing a severe downside scenario for Strategy despite recent weakness in the company’s preferred and common shares.
Strategy’s perpetual preferred stock, STRC, fell as low as $82.53 on June 22, or about 17% below its $100 par value, before partially recovering after the company disclosed it had increased its fiat reserves to $1.3 billion. As of Thursday, it was trading around $77, roughly 23% below par.
The weakness has extended beyond STRC. Strategy’s common shares (MSTR) were down about 78% over the past year and traded around $87 on Thursday, according to Yahoo Finance data.
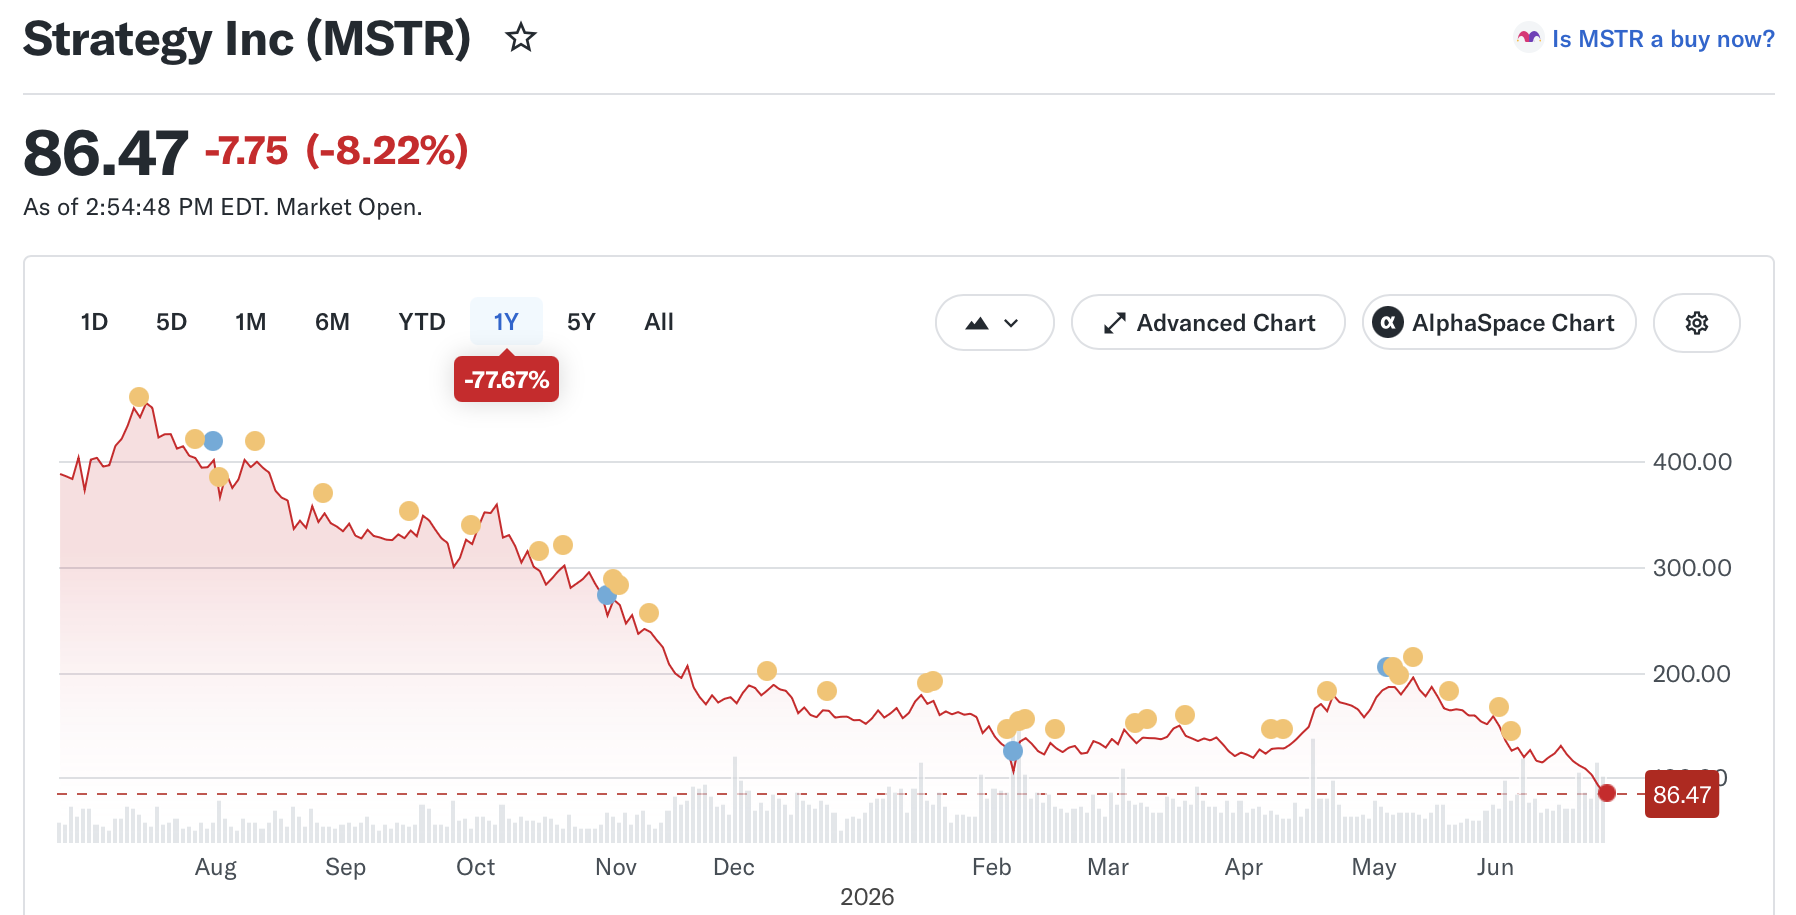
Strategy stock. Source: Yahoo Finance
Despite the sell-off, Anchorage found that Strategy’s options market remains well below stress levels seen during previous market corrections. While traders continue to hedge against downside risk, put skew has not reached levels typically associated with fears of forced deleveraging or a broader crisis, according to the report.
Strategy, led by Executive Chairman Michael Saylor, pioneered the corporate Bitcoin treasury model in 2020 and remains the world’s largest corporate holder of Bitcoin, with 847,363 BTC on its balance sheet.
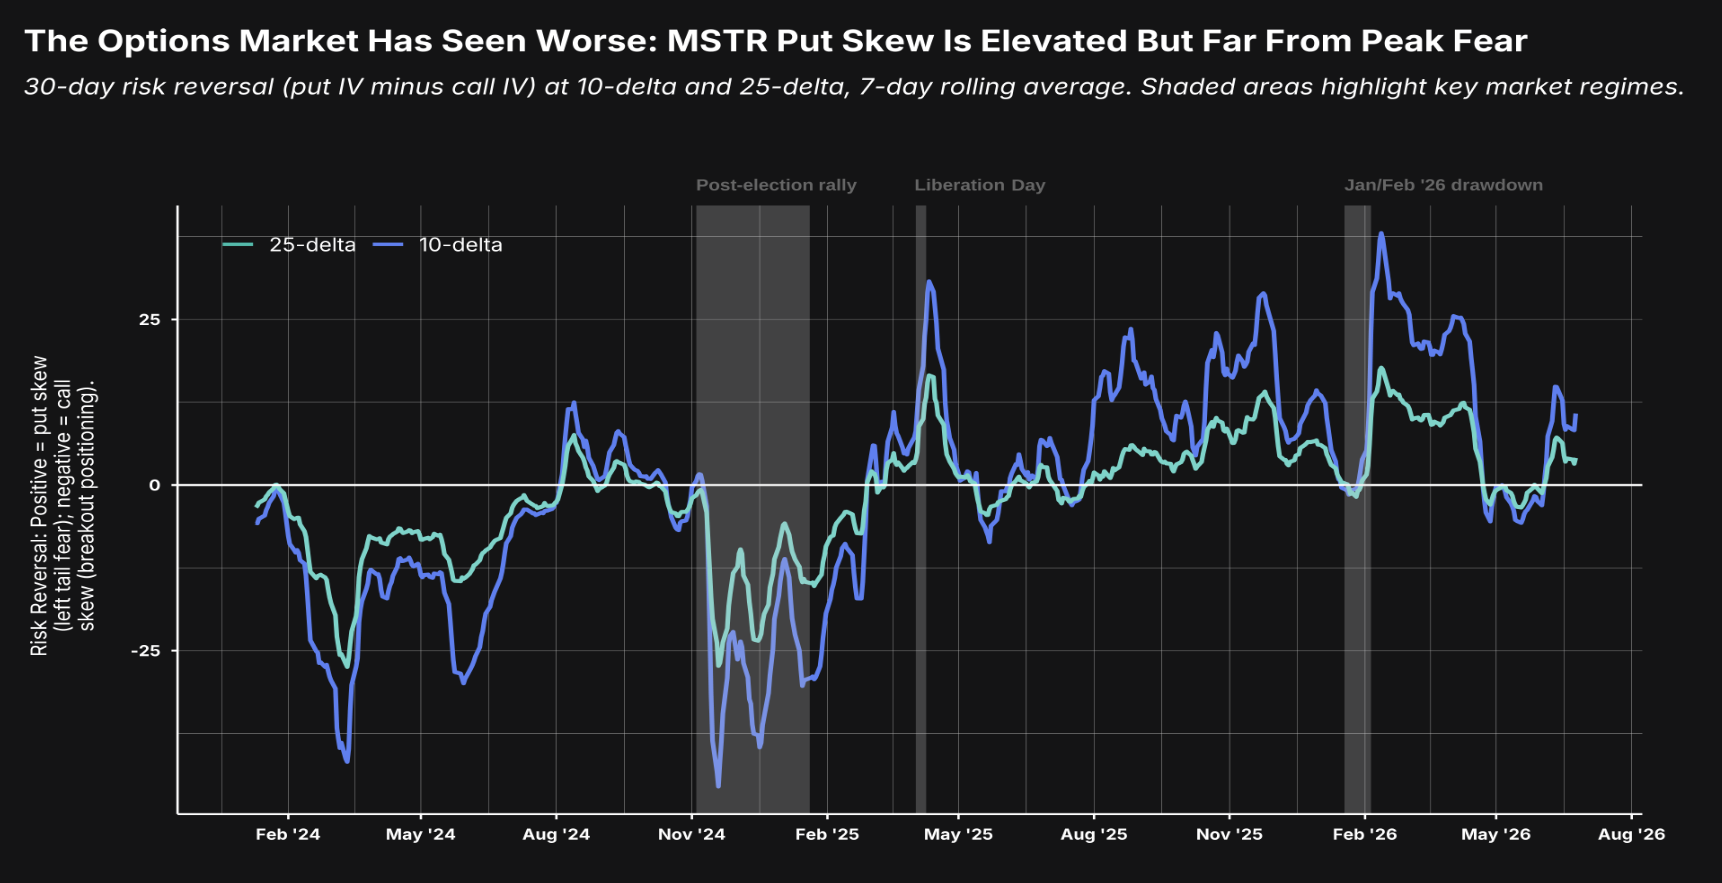
30-day risk reversals in Strategy (MSTR) options markets. Source: Anchorage Digital report
Magazine: Bitcoin decouples from tech stocks, Ether eyes ‘selling wave’: Market Moves

Corgi, the buzzy Y Combinator-backed insurance tech startup, says it didn’t steal an open source product

Former York Knight Kris Brining’s inspirational career move

Hints and All Four Answers for Saturday’s Puzzle #1112, June 27, 2026


-

 Entertainment6 days ago
Renter of Home in Anne Heche Crash Denies Settlement With Son
-
 Sports3 days ago
Two goals and an assist by sheer aura: Cristiano Ronaldo just entered the World Cup chat
-

 Tech5 days ago
Microsoft accidentally kills epic Outlook email threads
-

 Fashion12 hours ago
Weekend Open Thread: Staud – Corporette.com
-

 Business6 days ago
Soccer-U.S. defends Iran World Cup travel restrictions, says discussions ongoing
-

 Politics23 hours ago
The House | Manchesterism won’t survive the painful trade-offs unless it gets citizens on board
-

 Politics7 days ago
Andy Burnham and the meaning of Makerfield
-

 Politics1 day ago
Potential 2028er World Cup attendee leaderboard
-

 Business22 hours ago
Asia stock markets slide as tech shares slump
-

 Tech1 day ago
A Look At A Gaggle Of Transputer Boards
-
Crypto World3 days ago
Bitcoin (BTC) Dips Below $62K, Ethereum (ETH) Plunges 6% Daily: Market Watch
-

 Crypto World3 days ago
Securitize Wraps Roubini's SEC-Registered ETF as Dubai VARA Digital Security
-
 Crypto World1 day ago
Dell (DELL) Shares Tumble Over 5% Following Analyst Downgrade to Hold
-
Business3 days ago
Entergy settles forward sale agreements, raises $672 million in cash proceeds
-
 Crypto World7 days ago
Can Charles Hoskinson Really Rescue Cardano?
-

 Sports9 hours ago
FIH Pro League: India defeat Pakistan 7-1, register biggest win of campaign | Other Sports News
-

 Crypto World13 hours ago
RTX holders must register wallets before token distribution begins
-
 Crypto World15 hours ago
Hyperliquid Named on Singapore MAS Investor Alert Register
-

 Crypto World7 days ago
Jake Chervinsky accuses CME of protecting derivatives monopoly
-

 Sports2 days ago
India vs Bangladesh LIVE Score, Women’s T20 World Cup: Bangladesh Opt To Bat; India Enter ‘Do-Or-Die’ Stage As Semi-Final Race Heats Up
You must be logged in to post a comment Login