

Crypto World
Top Energy Executive Warns of Critical Oil Inventory Tightness and Imminent Price Spike

ExxonMobil’s senior vice president has warned that oil inventory tightness will reach critical levels within weeks, setting the stage for a sharp price surge unless physical supply rebounds soon.
Neil Chapman, the company’s senior vice president, told a Bernstein investor conference that markets sit only weeks away from rarely seen stockpile levels. He projected Brent crude could spike to $150 or $160 per barrel.
Oil Inventory Tightness Hits Critical Stage
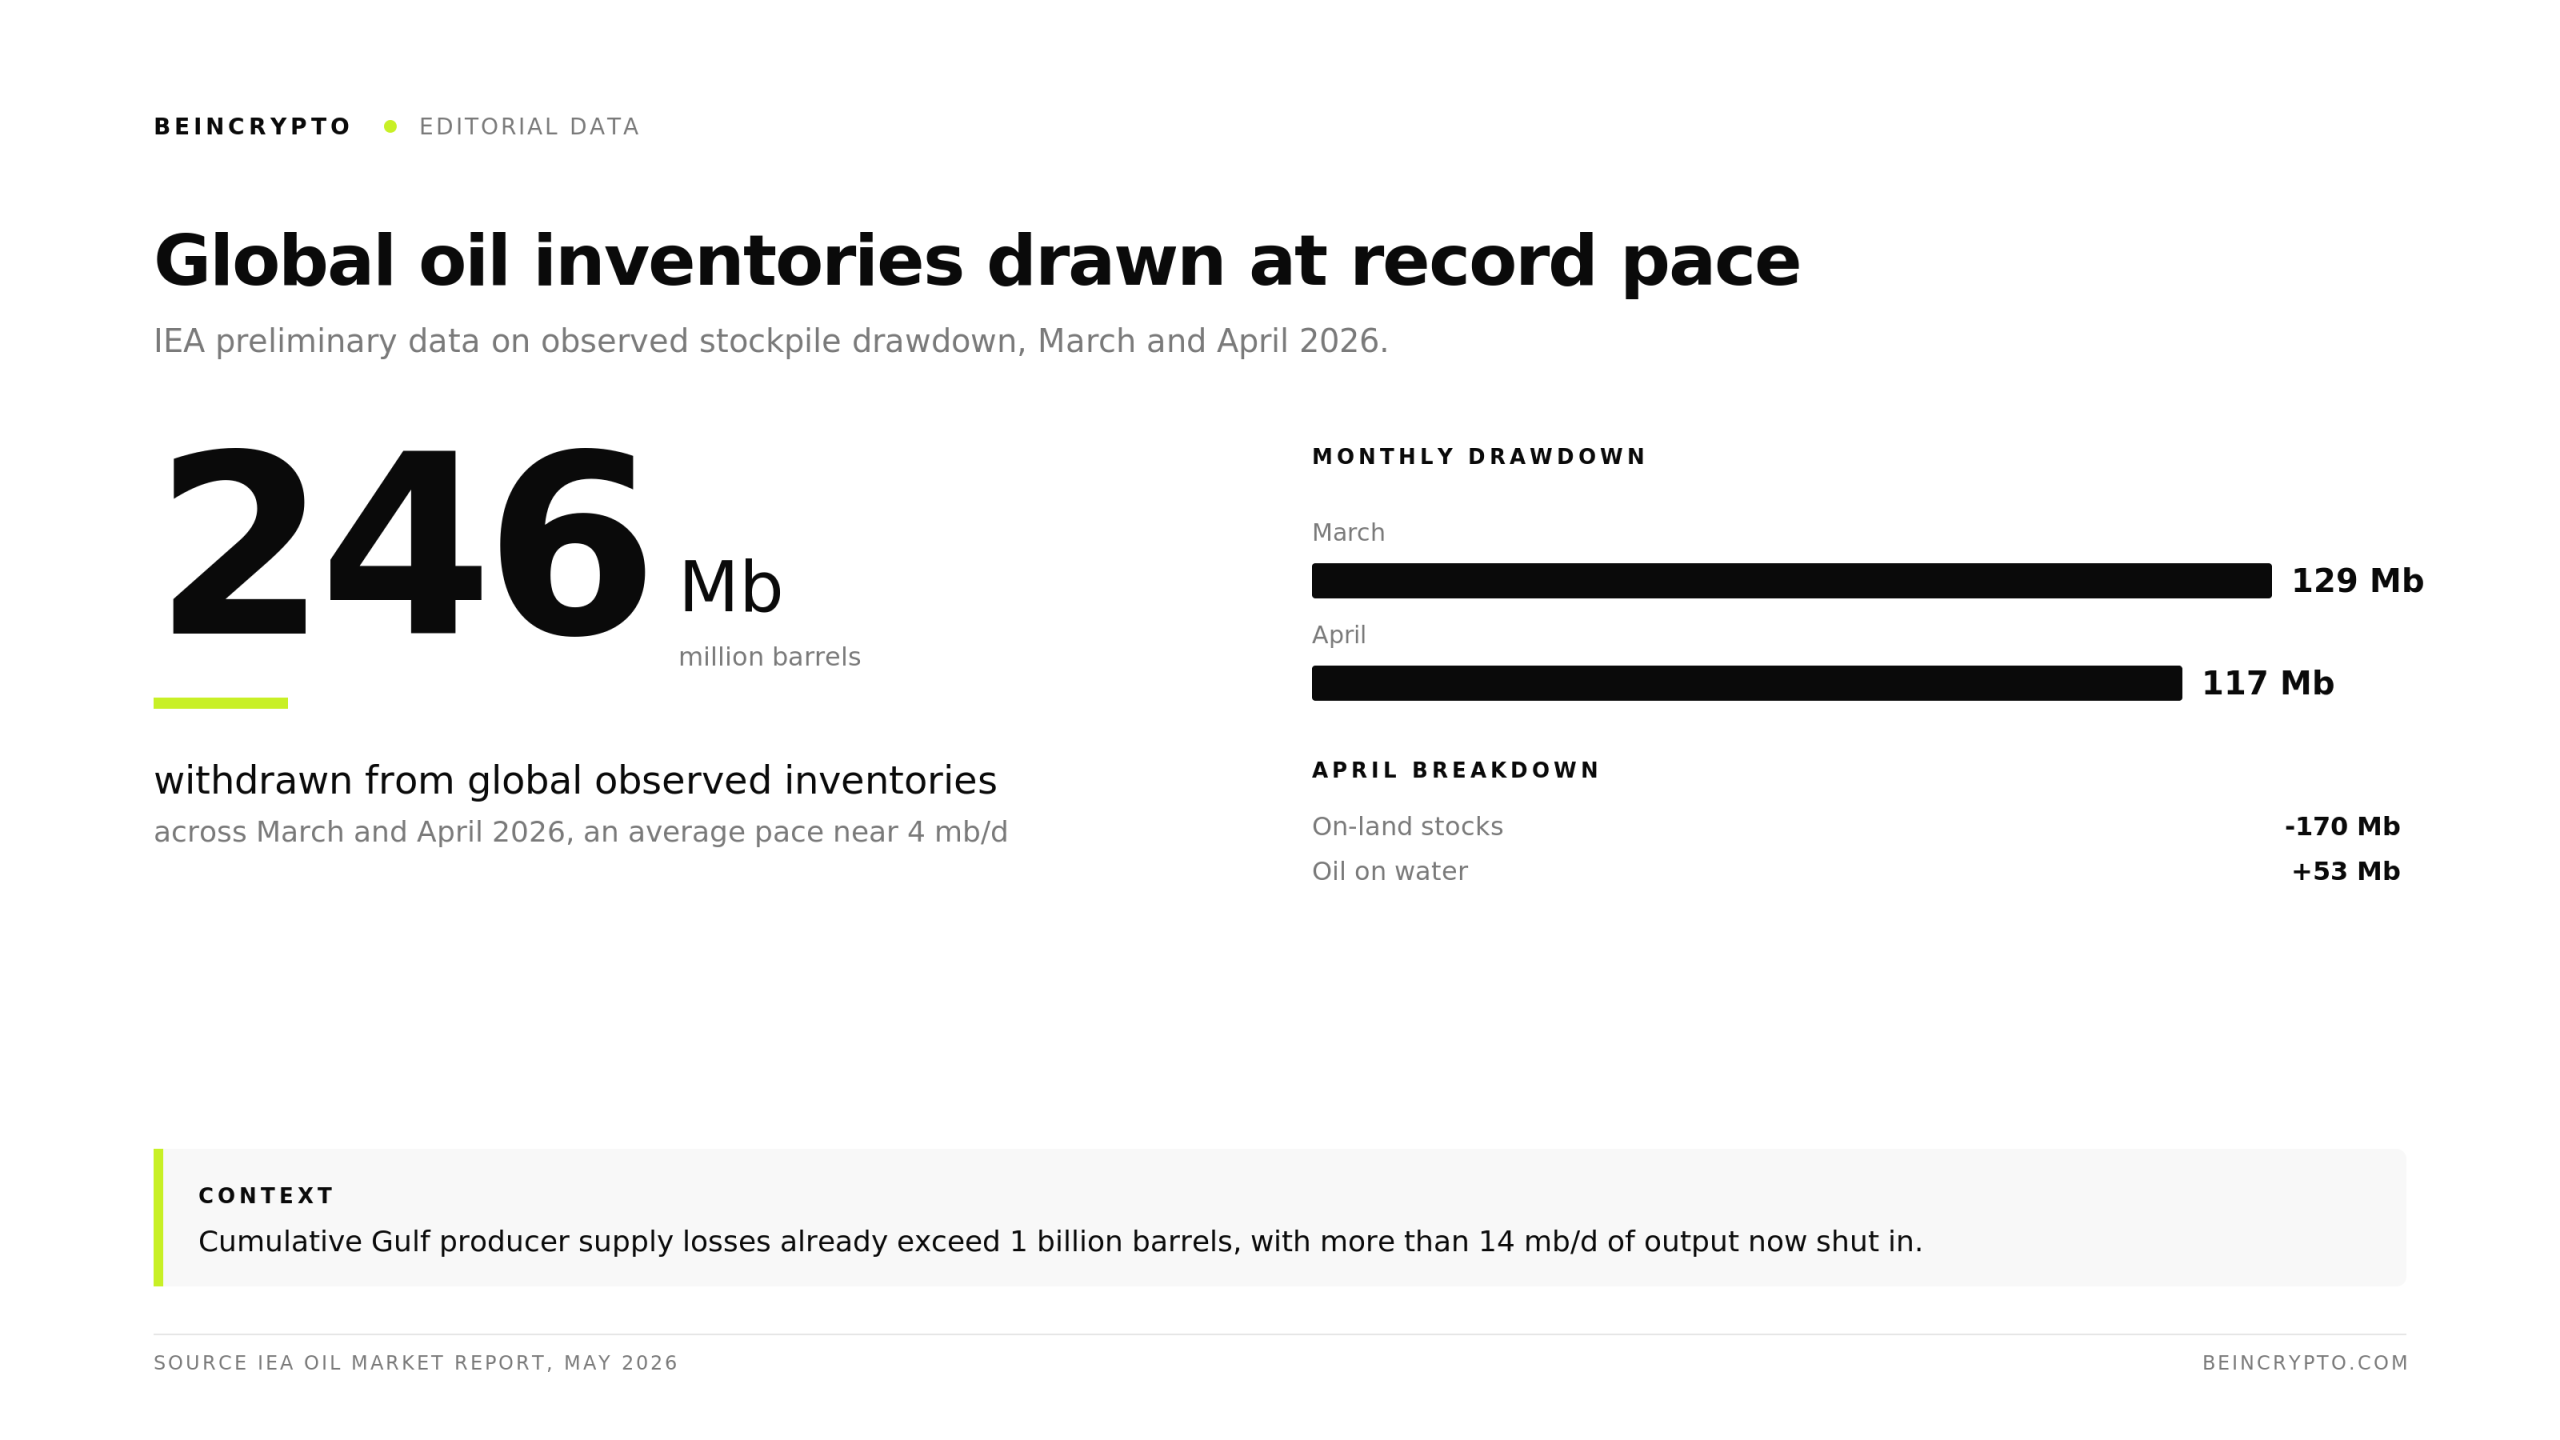
Observed global oil inventories fell by roughly 246 million barrels during March and April, according to the International Energy Agency.

The pace of drawdown has accelerated since the Strait of Hormuz disruption began.
Cumulative supply losses tied to the Hormuz shipping disruption could exceed one billion barrels by month-end. Tehran’s closure of the chokepoint has cut off roughly a fifth of world oil flows.
Independent analysts argue that commercial oil inventories are weaker than headline data suggests.
Continued Strategic Petroleum Reserve sales have flattered the topline figures. Tanks and pipelines tied to private buyers have thinned out at a faster pace.
Strategic Petroleum Reserve releases and government stockpile sales have partially absorbed the shock.
Those buffers shrink quickly when commercial supplies also fall. Energy investors have already begun reweighting toward oil stocks worth watching as supply visibility deteriorates.
$150 Brent Scenario Gains Traction
Chapman framed the timeline as two or three weeks before inventory shortages become disruptive.
ExxonMobil’s internal supply models point to Brent crude prices near the $150 mark once physical buyers compete for scarce cargoes.

“We’re approaching unheard of inventory levels,” Chapman told CNBC.
Follow us on X to get the latest news as it happens
The Exxon view aligns with growing concern from independent energy analysts. Several traders have argued on that futures markets are understating physical-market tightness.
They cite widening spreads in crude grades and refined product margins.
“We are ~9 million bbls away from hitting a storage level that’s the equivalent of living paycheck to paycheck for gasoline and distillate…And we are going into peak summer demand season + hurricane…We are living on the edge now. Product pipeline + inventory needed to move products around. 2-3 weeks to exhaust the 9 million bbls, mid-June,” analysts at HFI Research indicated.
Crypto and macro investors are watching the call closely. Higher oil prices lift inflation expectations and complicate central bank rate paths.
Risk assets have already shown sensitivity to Iran Hormuz tensions, with Bitcoin (BTC) trading lower on past supply scares.
Even modest supply hits could trigger gasoline shortages during peak driving demand. If Brent overshoots $150, demand destruction becomes the likeliest path back to balance.
Whether the coming weeks confirm Chapman’s call may shape both oil shock dynamics and broader risk markets.
The post Top Energy Executive Warns of Critical Oil Inventory Tightness and Imminent Price Spike appeared first on BeInCrypto.



Senator Cynthia Lummis wrote on X: developers should not need lawyers to know if their code is legal. The CLARITY Act, she argues, is the fix.
The Digital Asset Market Clarity Act has recently cleared two major legislative hurdles, passing the House in July 2025 with a 294-134 bipartisan vote before the Senate Banking Committee advanced it 15-9 in May 2026. The bill now sits on the Senate Legislative Calendar awaiting a floor vote.
When Writing Code Became a Federal Risk
The case that brought this debate into focus is that of Roman Storm, a co-founder of Tornado Cash, an open-source privacy protocol built on Ethereum (ETH).
On August 6, 2025, following a four-week trial, a jury found Storm guilty of conspiracy to operate an unlicensed money transmitting business. The jury was deadlocked and unable to reach a verdict on the two more serious charges: conspiracy to commit money laundering and conspiracy to violate sanctions.
The charge carries a maximum sentence of five years in prison.
The conviction turned on a contested legal question that the CLARITY Act is aiming to address. Tornado Cash provides an open-source protocol that breaks the link between senders and recipients of cryptocurrency in order to enhance privacy. Once deployed, neither the platform itself nor its creators ever took custody of the assets at issue.
Storm’s defense argued that holding a developer liable for what independent users do with self-executing code sets a dangerous precedent. The case asked whether writing and deploying open-source privacy software can expose its creator to criminal liability for how others use it, and after the verdict, that question remains only partially resolved.
The Tornado Cash case was not isolated. The SEC issued a Wells Notice to Uniswap Labs in 2024, alleging the primary developer of the world’s largest decentralized exchange protocol was operating an unregistered broker-dealer.
The Commodity Futures Trading Commission (CFTC) separately pursued the Ooki DAO developers, arguing that participating in open-source governance made individual contributors personally liable for how end-users interacted with the platform.
What the CLARITY Act Changes for Developers
The CLARITY Act addresses this directly through Section 604, drawn from the Blockchain Regulatory Certainty Act (BRCA). The provision codifies a principle from FinCEN’s 2019 guidance: that developers and infrastructure providers who do not take custody or control of user funds are not money transmitters under federal law.
Writing open-source software, running a node, or validating transactions would not trigger Bank Secrecy Act obligations.
More than 60 CEOs and founders across the industry, including executives from Coinbase, Uniswap, Kraken, a16z crypto, and Paradigm, signed a letter to Senate leadership in June calling on the full Senate to pass the bill with the developer protections intact, describing Section 604 as a non-negotiable condition of their support.
The post Lummis Says CLARITY Act Will End Crypto Developer Prosecution for Writing Code appeared first on BeInCrypto.
Taiko lost roughly $1.7 million on Monday after an attacker compromised the chain-state verification mechanism.
The latest hack adds to the growing list of attacks targeting crypto networks in 2026.
Taiko Becomes Latest of 20-Plus Crypto Hacks This June
Taiko runs as an Ethereum-equivalent-based rollup that settles its activity back to the mainnet. Earlier today, Blockaid flagged an ongoing exploit in a post on X (formerly Twitter).
Taiko confirmed the compromise in a security notice and warned that bridge security assumptions could no longer be trusted.
Follow us on X to get the latest news as it happens
Meanwhile, on-chain data shared by Lookonchain shows the attacker has already started cashing out. The wallet moved 1.99 million TAIKO, worth about $189,000, to MEXC. The same address still holds 870.8 ETH valued at nearly $1.52 million.
Taiko said it is working with its Security Council and ecosystem partners to contain the incident. In addition, Taiko signaled that it may take technical and legal action against the attacker.
The team has asked centralized exchanges to suspend TAIKO deposits until it issues an official all-clear.
“We strongly advise all users to withdraw their funds from all bridges deployed on Taiko immediately,” the team said.
Meanwhile, it also shared 4 attacker addresses:
- 0x7506DeA0c38ca0B55364B22424374c5A1ae1B76a
- 0x5fbc60a12bc6635e7d587d8dac52e4b1388b4990
- 0x3cc936b795a188f0e246cbb2d74c5bd190aecf18
- 0x9108828e30f2de407aadb0af677b4a9228e4acd4
Historically, bridges have ranked among crypto’s costliest weak points, and 2026 has been no exception. A tracker from DefiLlama counts more than 20 crypto hacks in June alone.
The published addresses of attackers give investigators a trail to follow as funds move. Whether Taiko can recover the stolen assets may hinge on how fast exchanges freeze the flagged wallets.
Subscribe to our YouTube channel to watch leaders and journalists provide expert insights
The post Taiko Exploit Adds to June Tally of Over 20 Crypto Hacks appeared first on BeInCrypto.
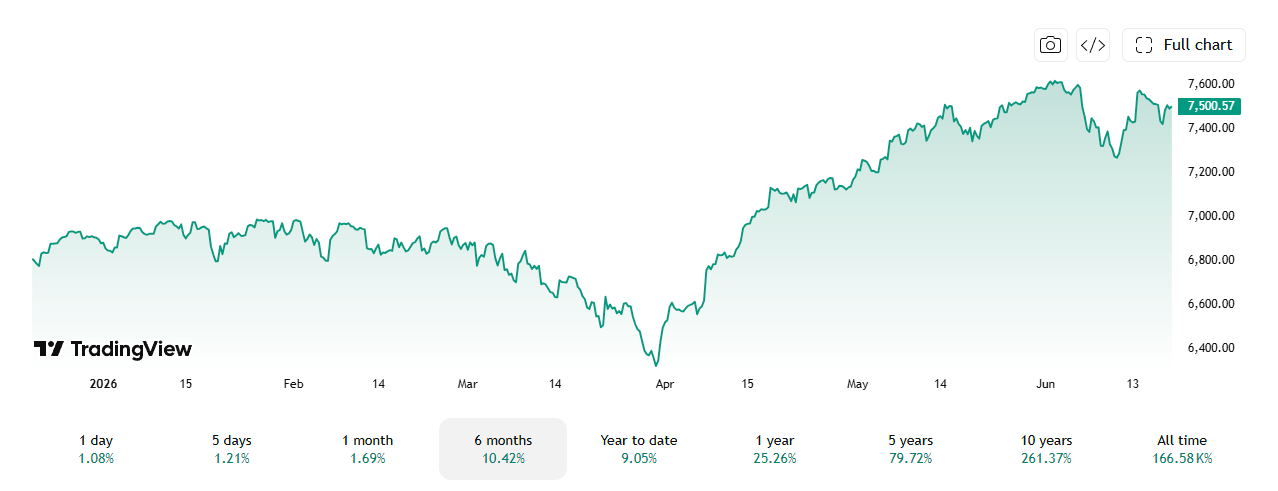
Global markets are entering the week of June 22 with a clearer pecking order of risk. The Strait of Hormuz and Trump’s war is no longer the dominant driver; the Federal Reserve is.
After months of whipsaw headlines from the US-Iran conflict, traders have largely stopped flinching at each new diplomatic twist. The bigger force repricing oil, gold, stocks, and Bitcoin (BTC) is Fed Chair Kevin Warsh’s hawkish debut at the June 17 FOMC meeting.
Oil Deflates as War Premium Fades
Brent crude settled around $80 on Friday, June 19, after US-Iran talks were abruptly called off, yet the reaction was muted. WTI traded near $76, down roughly 34% from conflict highs.
Three Saudi supertankers carrying roughly six million barrels transited the strait last week. Tanker owners report cautious but growing confidence in the waterway. The war premium that once consumed markets is unwinding, even without a signed peace deal.
Warsh Reframes Gold and Stocks
Gold fell to around $4,150 per ounce on Friday, as the dollar climbed to a one-year high. The driver was not geopolitics but the Warsh hawkish FOMC shift, where nine of 18 officials now project at least one rate hike in 2026.
Goldman Sachs cut its year-end gold target to $4,900 from $5,400. US equities held up better, with the S&P 500 recovering from Fed-day losses, closing its 11th winning week in 12.

Bitcoin Caught Between Two Headwinds
BTC trades near $64,000, holding above recent lows but unable to build meaningful momentum. As BeInCrypto reported, Warsh’s press conference sent Bitcoin lower alongside gold, with rate hike odds now at 66% squeezing liquidity expectations that had supported risk assets earlier in the year.
Bitcoin is trading nearly 50% below its October 2025 all-time high of $126,198. The week ahead brings US GDP and PCE data, two readings that will either reinforce Warsh’s hawkish lean or give Bitcoin price a brief reprieve.
The post Fed Hawkishness Displaces Hormuz Noise as the Dominant Market Risk appeared first on BeInCrypto.
Three catalysts are converging this week that could shift sentiment across equities, chips, and the inflation outlook. FedEx earnings, Micron’s fiscal Q3 results, and the May Personal Consumption Expenditures price index are all due in the coming days.
The combination arrives at a tense moment for markets still digesting the Iran war’s economic fallout and reassessing when the Federal Reserve might next move on interest rates.
FedEx Breaks New Ground Tuesday
FedEx (FDX) reports fiscal fourth-quarter results Tuesday, June 23. The print marks the company’s first as a pure-play logistics and parcel firm following the June 1 spinoff of FedEx Freight.
A calendar shift to a December fiscal year adds another layer of complexity, making year-over-year comparisons difficult. Analysts expect revenue for the quarter to reach $24.04 billion, up 8.8% from a year earlier, while full-year earnings per share are projected at $19.78, up 8.7% from fiscal 2025.
Micron Carries the AI Trade Wednesday
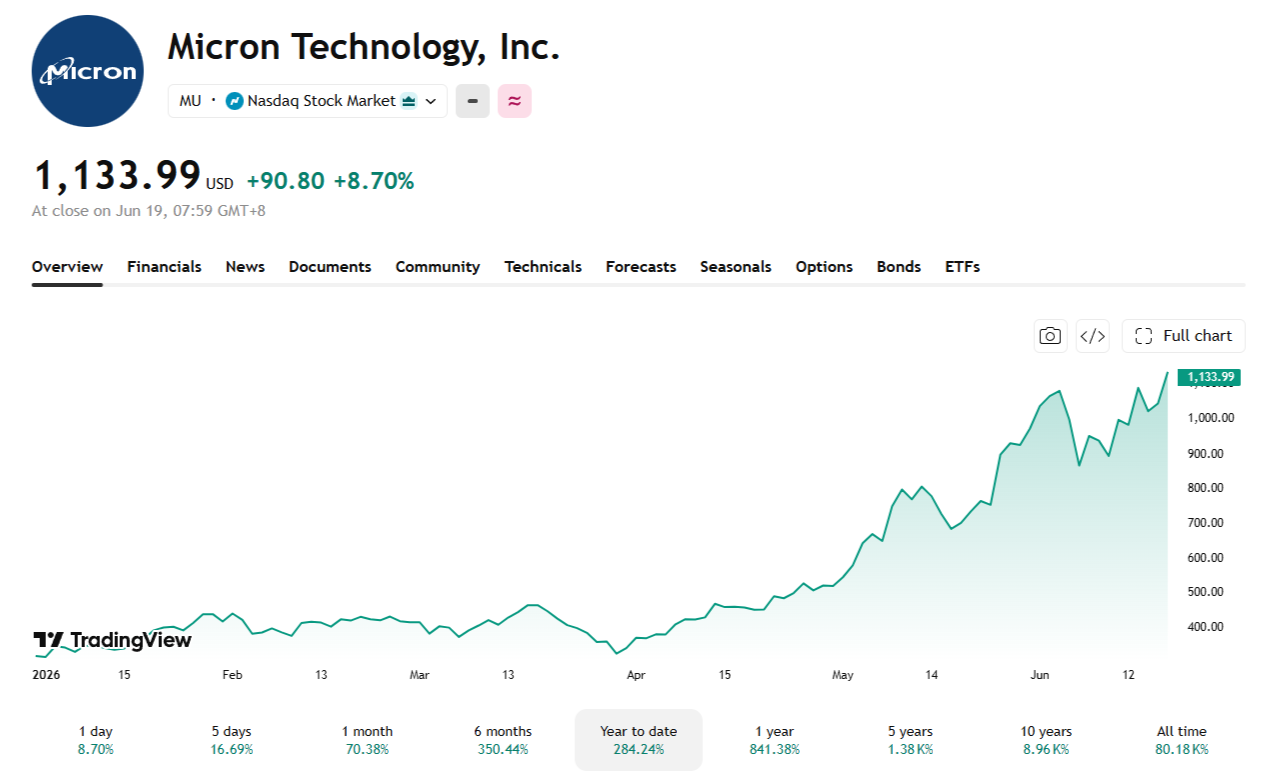
Micron Technology (MU) reports fiscal Q3 results Wednesday, June 24. After a roughly 280% gain in 2026 built almost entirely on the high-bandwidth memory that feeds AI accelerators, the print is the single clearest test of whether that boom is a durable, structural shift or another memory cycle that has run ahead of itself.

Analysts at Deutsche Bank and TD Cowen both raised price targets to $1,500 ahead of the Micron earnings results, citing AI demand outrunning supply through 2028. Key customers remain able to secure only between 50% and two-thirds of their bit demand requirements, with no expectation of supply catching up in the near term.
PCE Data Thursday Tests the Oil Relief Narrative
The Federal Reserve’s preferred inflation gauge, the PCE price index for May, drops Thursday, June 25. Research from the Federal Reserve Bank of Dallas estimates the Iran war pushed headline PCE inflation up 1.7 percentage points at an annualized rate in the first quarter of 2026, with effects expected to remain elevated through the third quarter.
However, WTI crude settling near $76 a barrel last week, down sharply from above $90 throughout May, could provide meaningful relief in the months ahead. Whether the chipflation risk from rising AI memory costs offsets some of that energy-driven easing remains an open question heading into the data.
The post FedEx, Micron Earnings and PCE Data Set to Shape Markets This Week appeared first on BeInCrypto.
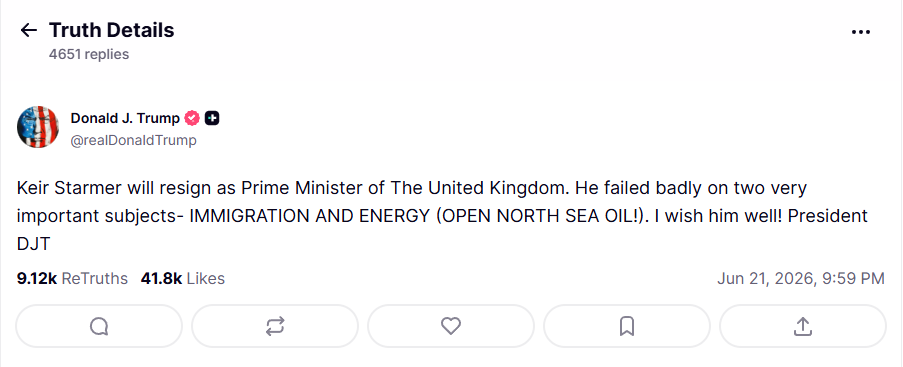
Donald Trump has all but confirmed reports that UK Prime Minister Keir Starmer is set to resign, singling out his government’s ban on new North Sea oil licences as a central cause of his political collapse.
In a Truth Social post on Saturday, June 21, Trump wrote that Starmer had “failed badly” on two issues, immigration and energy, demanding the UK “open North Sea oil.”
North Sea Ban Under Fire as Energy Bills Surge
The UK government announced on November 26, 2025 that it would grant no new oil and gas exploration licenses. It became the largest economy to take that step. The move drew immediate criticism, and its political cost has grown sharply since.

The ongoing US-Israel conflict with Iran disrupted oil and gas flows across the Middle East and triggered a sharp rise in UK energy prices. Since the outbreak of the conflict, Brent crude surged from around $73 a barrel to nearly $114 — while June gas futures on the Dutch TTF jumped nearly 50%.

Ofgem confirmed a 13% rise in the household energy price cap from July. This lifted the annual dual-fuel bill from £1,641 to £1,862, with gas bills climbing 24% and electricity rising 5%.
Critics have pointed to the North Sea ban as compounding British exposure to that shock. Although analysts from Oxford’s Smith School note that even maximum North Sea extraction would save households only between £16 and £82 per year. This is because any domestic oil is sold at global market prices regardless of origin.
Starmer’s Position Collapses
Trump had previously told reporters that Starmer is “a nice man” but warned he needed to “straighten out immigration” and “start drilling”. Sunday’s post dropped the ambiguity entirely.
Starmer’s political position had weakened significantly following major losses in local elections. Andy Burnham’s decisive win in the Makerfield by-election didn’t help either. There are also around 100 Labour MPs formally requesting his resignation.
UK media reported widely on Sunday that an announcement was expected Monday.
The post Trump Declares Starmer Will Resign, Blames North Sea Oil Ban appeared first on BeInCrypto.
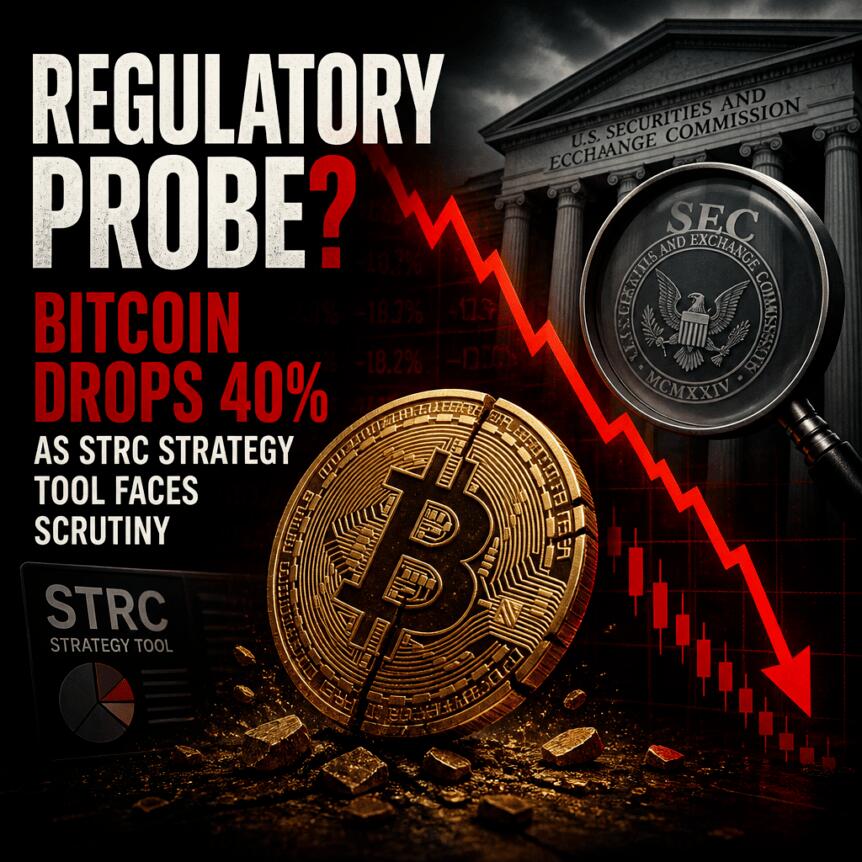
MicroStrategy’s flagship Bitcoin funding vehicle, Strategy’s Stretch (STRC), has traded at a persistent discount to its $100 liquidation preference since late July 2025, prompting renewed scrutiny of its capital-raising design. As STRC’s market price fell to new lows in the lead-up to mid-2026, critics framed the move as evidence that the structure may rely on continuous inflows to meet shareholder expectations.
At the same time, other analysts argue the steep drawdown reflects leverage dynamics rather than a fundamental deterioration in Strategy’s Bitcoin accumulation plan. For institutional stakeholders, the episode matters not only for how STRC functions economically, but also for how such instruments fit within broader oversight and investor-protection frameworks—particularly as leveraged exposures and yield-linked terms raise compliance and risk-management questions.
Key takeaways
- STRC was structured to trade near its $100 par (liquidation preference) via adjustable dividends tied to that benchmark.
- In mid-2026, STRC traded materially below $100, with reports indicating a late-day close below par after a record low intraday print.
- The widening discount has coincided with a slowdown in Strategy’s weekly Bitcoin additions, increasing attention on funding efficiency.
- Critics—including Peter Schiff—reiterated claims that the instrument resembles a “centralized Ponzi,” while analysts counter that leverage wipeouts better explain the move.
- STRC’s dividend mechanics are being debated in terms of how the liquidation preference converts into an effective yield for discounted entry prices.
Why STRC’s discount to $100 is drawing regulatory-style scrutiny
STRC was introduced in July 2025 as a preferred-equity style instrument designed to remain close to its $100 par value, supported by adjustable dividends. The practical objective, as described by market participants around the offering, is to create a predictable redemption/return framework while enabling Strategy to raise capital to purchase additional Bitcoin.
According to the reported trading updates, STRC fell to an intraday record low of $82.53 and closed around $88.59—still below the $100 liquidation preference. While a discount can occur for many reasons in credit-like and preferred structures, sustained divergence from par tends to intensify investor-protection concerns: it can indicate that the market assigns a higher probability of stress scenarios than the instrument’s contractual yield implies.
That dynamic is now fueling accusations that STRC depends on ongoing capital formation to sustain returns—an argument Peter Schiff has repeated, describing STRC as “a classic centralized Ponzi.” Critics’ central compliance-adjacent concern is not the existence of leverage per se, but the possibility that the structure’s economics may become self-reinforcing in a way that disadvantages later entrants if market prices cannot stabilize near par.
Strategy has not, in recent public statements cited in the reporting, directly engaged with the “Ponzi” characterization. Instead, it continues to position STRC as preferred equity supported by its Bitcoin treasury strategy. Nevertheless, the market’s focus has shifted to the contract terms that link dividends to the $100 benchmark and to the implications for investors who adopt leveraged positions.
From an institutional monitoring perspective, this is the kind of dispute that can evolve into formal regulatory or litigation scrutiny: when the price relationship to a stated benchmark deteriorates, supervisors and compliance teams typically ask whether disclosure and risk labeling adequately reflect the instrument’s downside behavior, including margin-call pathways for leveraged holders.
Dividend mechanics and the effective yield debate
Reportedly, STRC uses an adjustable dividend framework with a currently stated 11.5% annualized rate, with proceeds primarily directed toward acquiring Bitcoin. However, the instrument’s market price movement changes how discounted investors interpret return.
Analysts cited in the coverage argue that STRC dividends are calculated relative to the $100 liquidation preference rather than the current market price. Under that interpretation, a discounted entry can produce a higher effective yield than the headline rate. For example, one analyst noted that at $90, the effective yield would be approximately 12.8%, while at $85 it could be around 13.5%, assuming the dividend rate remains anchored to the $100 liquidation preference.
This distinction matters in practice because it highlights a structural tension: a vehicle can offer an attractive contractual yield while still trading far below par due to market-implied stress, forced deleveraging, or holder expectations about future dividend adjustments and redemption outcomes.
Strategy’s next dividend rate announcement has been reported as scheduled for June 30, with the company reportedly retaining alternative funding options such as issuing additional Strategy shares and using cash reserves—elements that, from a governance standpoint, influence whether the instrument is likely to remain within a stable pricing band or whether it will continue to trade at a deep discount.
Slower Bitcoin purchases and funding-efficiency questions
Alongside the price drawdown, reporting indicates that Strategy’s pace of Bitcoin accumulation moderated as STRC traded below par. The company added 1,550 BTC for $101 million in the week ending June 8 and 1,587 BTC for $100 million in the week ending June 15, taking total holdings to 846,842 BTC.
These additions were meaningful, but the weekly dollar amounts were reported to be much smaller than earlier in 2026. For comparison, Strategy was reported to have bought 34,164 BTC for $2.54 billion in a single week during April, and 24,869 BTC for roughly $2.01 billion in May—figures that underscore how the “cash-in-to-BTC” conversion can change when the funding vehicle trades at a discount.
In addition, a small Bitcoin sale was reported earlier in June—32 BTC, worth approximately $2.5 million—described as potentially linked to dividend obligations. While the sale was minimal relative to the size of Strategy’s overall treasury, it reflects a key operational reality for dividend-linked structures: even if the primary plan is to finance purchases via issuance proceeds, cash requirements can still require asset sales when market conditions weaken.
In institutional terms, this is where compliance and risk governance intersect with capital markets execution. A vehicle that depends on continuous issuance can face liquidity and market-impact constraints when its own price dislocates from its stated preference benchmark, potentially affecting obligations to income-seeking or leveraged investors.
Leverage wipeout vs. structural failure
Not all analysts interpret STRC’s decline as a sign of failing fundamentals. Jesse Myers, head of Bitcoin strategy at The Smarter Web Company, argued that the move resembles a leverage wipeout rather than an impairment in Strategy’s broader positioning. In the cited commentary, Myers suggested that STRC holders might assume stable trading near the $99–$100 band and that once the price fell, margin calls and forced selling amplified the downward momentum.
Other market commentators similarly focus on how leveraged investors can create nonlinear liquidation dynamics: a discount that begins as a repricing can become accelerated when position sizing is calibrated to assumptions that do not hold.
Still, the debate remains unresolved for compliance observers because both narratives—leverage-driven volatility and structural dependence—can coexist. The instrument may behave as expected under certain conditions while also exhibiting fragile performance when market participants reduce exposure or when funding terms become less favorable. That uncertainty is precisely what supervisors and institutional risk teams often seek to clarify through documented scenario analysis, stress testing, and disclosures around redemption, dividend adjustment triggers, and investor suitability.
Closing perspective
With STRC continuing to trade below its $100 liquidation preference and with dividend-rate decisions and capital-raising activity tied to that benchmark, the next dividend announcement and any further changes in issuance patterns will likely determine whether the discount stabilizes or deepens. For institutional compliance and legal teams, the episode highlights the importance of monitoring how leveraged investor behavior and contract-linked yield mechanics interact with pricing—especially for instruments positioned as central to a broader Bitcoin treasury strategy.
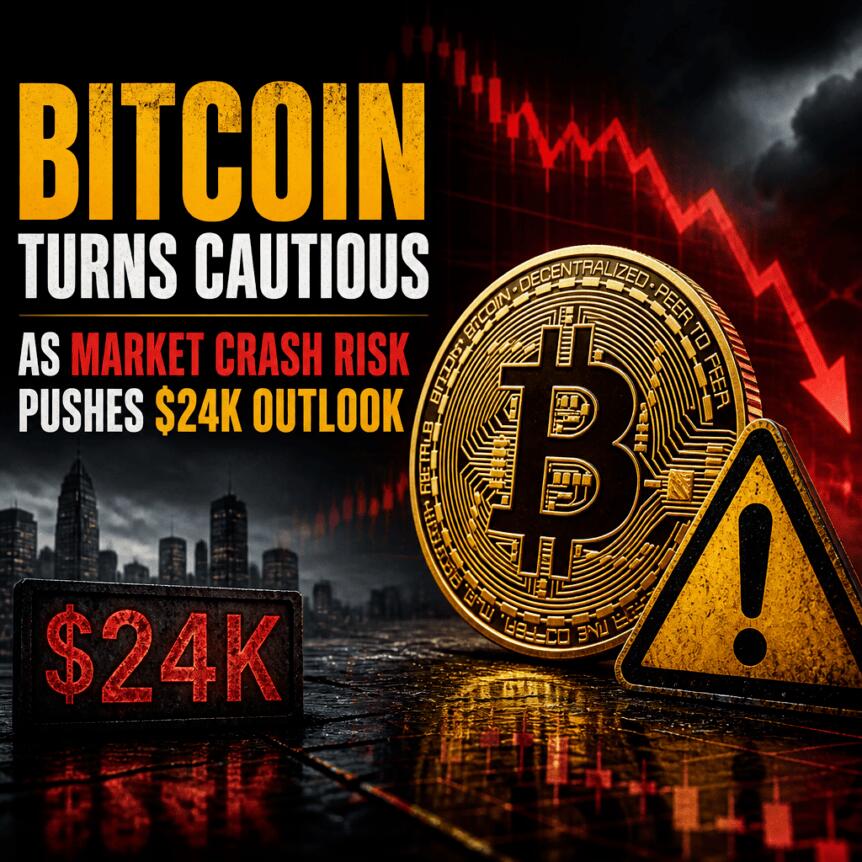
Technical analyst Jesse Olson says Bitcoin could face a sharp drawdown scenario in 2026 if the US stock market experiences a major, recession-level shock. In a post shared over the weekend, Olson highlighted a downside target near $23,980, framing it as a potential outcome if equities fall by more than 50%—a regime he links to how BTC historically behaves when risk appetite collapses.
The call comes alongside on-chain and market-demand indicators pointing to continued caution among institutional participants. Coinbase Premium Index readings have stayed largely negative so far this year, while US spot Bitcoin ETFs have recorded net outflows since May, according to SoSoValue data.
Key takeaways
- Jesse Olson’s worst-case technical target for Bitcoin centers on $23,980 if equities undergo a collapse of 50%+.
- Negative Coinbase Premium Index readings suggest institutional-style demand has not returned with conviction.
- Since May, US spot Bitcoin ETFs have logged $4.68 billion in net outflows, reflecting weaker ETF buyer activity.
- CryptoQuant-associated analyst Darkfost argues institutions tend to buy only after “confirmation,” not during the early stages of a downturn.
Why Olson’s chart points to $23,980 under a macro crash
Olson’s analysis is based on a two-week BTC/USD chart and his proprietary Market Sniper Pro VWAP indicator. In his post, he references a long-term, volume-weighted support line—an anchored VWAP-style tool commonly used to visualize where an asset’s average traded price may act as support or resistance.
According to Olson’s description, the line appears to be anchored to the 2022 bear-market bottom, allowing it to slope forward over time as a potential long-term zone. On this setup, Olson presents $23,980 as a base-case forecast for Bitcoin during a severe macro sell-off scenario where the US stock market drops by more than 50%.
That framing matters for traders because it treats BTC’s direction not just as a function of crypto-native flows, but as a response to broader liquidity and risk-reduction behavior across markets. When stocks fall abruptly, BTC has often traded like a high-risk asset, and the knock-on effect can include forced selling, hedging, or simply an institution-wide reduction in exposure.
Olson’s warning sits in the same broader macro conversation that has been circulating among traditional-market strategists. For example, GMO co-founder Jeremy Grantham has called the ongoing AI market boom a major speculative bubble, while Michael Burry has compared parts of the current rally to the late stages of Dot-com mania. Economist Gary Shilling has also warned that a US recession is “almost inevitable” by year-end and suggested stocks could be at risk of a 20%–30% decline.
Even if investors don’t match Olson’s exact scenario, his key contribution is identifying a concrete level that traders may watch if correlations between BTC and risk assets intensify. In a fast-moving equity drawdown, technical targets like $23,980 can shift from hypothetical to actionable much quicker than many market participants expect.
Institutional demand signals stay muted: Coinbase premium and ETF flows
A second layer of Olson’s bearish backdrop comes from indicators tied to institutional and professional positioning.
First, the Coinbase Premium Index—tracked by CryptoQuant and shown in a chart referenced in the coverage—measures the price gap between Bitcoin on Coinbase and Binance. A positive premium is generally interpreted as stronger US institutional demand, while a negative reading can imply weaker professional buying or relatively heavier selling on Coinbase.
In 2026 so far, the index has remained largely negative, which—based on how the metric is commonly used—suggests that institutional-style bids have not returned decisively.
Second, spot Bitcoin ETFs in the US have shown continued outflow pressure. According to SoSoValue, funds have recorded $4.68 billion in net outflows since May. While ETF flows don’t map perfectly to spot market “strength” tick-for-tick, consistent outflows typically align with reduced buying pressure from the ETF wrapper—one of the main channels through which many traditional allocators access BTC.
Why the “de-risking” narrative matters for timing
CryptoQuant-associated on-chain analyst Darkfost, cited in an X post from Sunday, offered a blunt explanation for why these signals may persist during downturns. In the referenced post, Darkfost said that institutional investors “don’t act like retail,” emphasizing that they operate with “permanent risk management logic.” The key point from the quote is that these investors are not necessarily looking to buy a potential bottom, but to see “confirmation” and “performance”—conditions that may not appear early in a drawdown.
For market participants, this distinction affects expectations about recovery. Retail-driven rebounds can happen quickly, but professional flows often lag—meaning ETF outflows and negative premium readings can remain in place even if BTC stops falling temporarily. If Olson’s macro crash scenario were to unfold, the combination of technical downside levels and institutional hesitation could reinforce each other: equities weaken, risk appetite fades, and demand signals fail to provide a timely counterweight.
That tension is also reflected in earlier commentary referenced in the source material. Analysts such as Galaxy Digital’s Alex Thorn and a pseudonymous trader known as Crypto Kid have previously argued that Bitcoin could decline below $30,000 in a stock-market crash scenario. Olson’s more specific target near $23,980 fits into the same broader thesis: if equities break down sharply, BTC’s drawdown could extend beyond widely watched round-number levels.
What to watch next if equities wobble
If macro stress increases, traders and investors will likely focus on whether BTC breaks down toward Olson’s indicated zone—and whether demand indicators improve before or after any sell-off accelerates. The key question is timing: do institutional metrics like Coinbase premium and spot ETF flows stabilize early, suggesting de-risking is ending, or do they remain weak, implying further downside risk?

TLDR:
- XRP trades at $1.13 after a steep 68% drop from its prior $3.66 cycle peak.
- 24-hour trading volume rose 4.83%, reaching a total of $868.27 million in activity.
- Trader Diana points to $1.10–$1.30 as a key accumulation zone on the weekly chart.
- Cryptollica says this XRP washout has only occurred twice before in 13 years.
XRP changed hands at $1.13, down 1.06% over 24 hours. Trading volume hit $868.27 million, a jump of 4.83%.
The token has now fallen 68% from its cycle high of $3.66. That high was set during a previous rally phase. The pullback has reset trader expectations across social media.
XRP Price Holds Support Zone After Steep Correction
The $1.10 to $1.30 range has become a focal point for traders. Crypto commentator Diana, who posts as @InvestWithD on X, said this zone represents an accumulation area. She argued the broader weekly chart structure still points upward despite the drop.
Diana outlined several upside levels in her post. She cited $2.00 to $2.50 as first resistance, and $3.66 as a retest of the previous cycle high. In addition, she highlighted the $5.00 to $6.00 price zone as a possible range for price discovery.
She also flagged $8.17 as a Fibonacci extension target. A further level near $17.15 appeared in her post as a long-term channel projection. Diana described $0.40 to $0.60 as a deeper macro support zone if the current range fails.
Separately, an account posting as @Cryptollica framed the current setup differently. The post claimed XRP has only seen this level of washout three times in 13 years. It suggested past instances of heavy pessimism preceded later rallies.
Trading Activity Reflects Mixed Sentiment Among Holders
Circulating supply for XRP sits at 62.05 billion tokens, against a max supply of 100 billion. Total supply stands at 99.98 billion. The token’s fully diluted valuation reached $113.44 billion based on current pricing.
Holder count data places active addresses at 536,410. That figure offers a snapshot of distribution across the network. Volume relative to market value sat at 1.23% over the past day.
Neither Diana nor Cryptollica cited specific on-chain metrics to support their projections. Their posts relied on chart pattern interpretation rather than fundamental data. Social sentiment around XRP has fluctuated through the corrective phase.
Price action over coming sessions may test whether the $1.10 floor holds. Traders following the accumulation thesis are watching that range closely. Others remain cautious given the scale of the recent pullback.

Global hedge fund leverage sits near multi-year highs. JPMorgan estimates that quarter-end rebalancing could trigger a $165 billion stock selloff before June ends, raising the risk of sharp moves in crowded technology trades.
The warnings come from Goldman Sachs and JPMorgan, two of the biggest forces in equity markets. Both point to the same risk, that leveraged and concentrated positions could amplify any pullback once mechanical selling begins.
Leverage Builds Inside a Crowded AI Trade
Goldman Sachs prime brokerage data has tracked leverage rising for over a year. Gross hedge fund leverage reached about 294% in June 2025, a five-year high, Reuters reported.
A note from Goldman trader Lee Coppersmith, circulated this month, said net leverage has since pushed to four-year highs.
JPMorgan strategist Nikolaos Panigirtzoglou sharpened the concern. He warned that stretched positioning in semiconductors is raising the risk of more frequent selloffs.
These value-at-risk shocks strike when volatility breaches funds’ internal limits and forces selling.
His team calculates that semiconductors’ share of global equity value is now more than six times their share of revenue. That is over double the comparable figure for the Magnificent Seven.
The concentration leaves the rally in AI stocks exposed if sentiment turns.
Why the $165 Billion Stock Selloff Matters
The near-term trigger is mechanical. JPMorgan estimates that quarter-end rebalancing could drive up to $165 billion in equity sales as June closes. Big investors are trimming stocks after a strong run.
Japan’s $1.9 trillion Government Pension Investment Fund is the single largest seller at about $60 billion.
US pension funds account for another $55 billion. Norway’s and Switzerland’s funds add tens of billions more, while balanced mutual funds offset roughly $15 billion of buying.
The selling meets a market already on edge. Under new Chair Kevin Warsh, the Federal Reserve held rates this month and signaled a possible hike this year.
That hawkish Federal Reserve stance has repriced rate-cut bets and lifted volatility.
What it Means for Bitcoin
The fragility reaches into Bitcoin (BTC). JPMorgan flagged that the network’s hash rate has grown more sensitive to price.
That signals more miners are operating near breakeven, an added pocket of fragility for crypto.
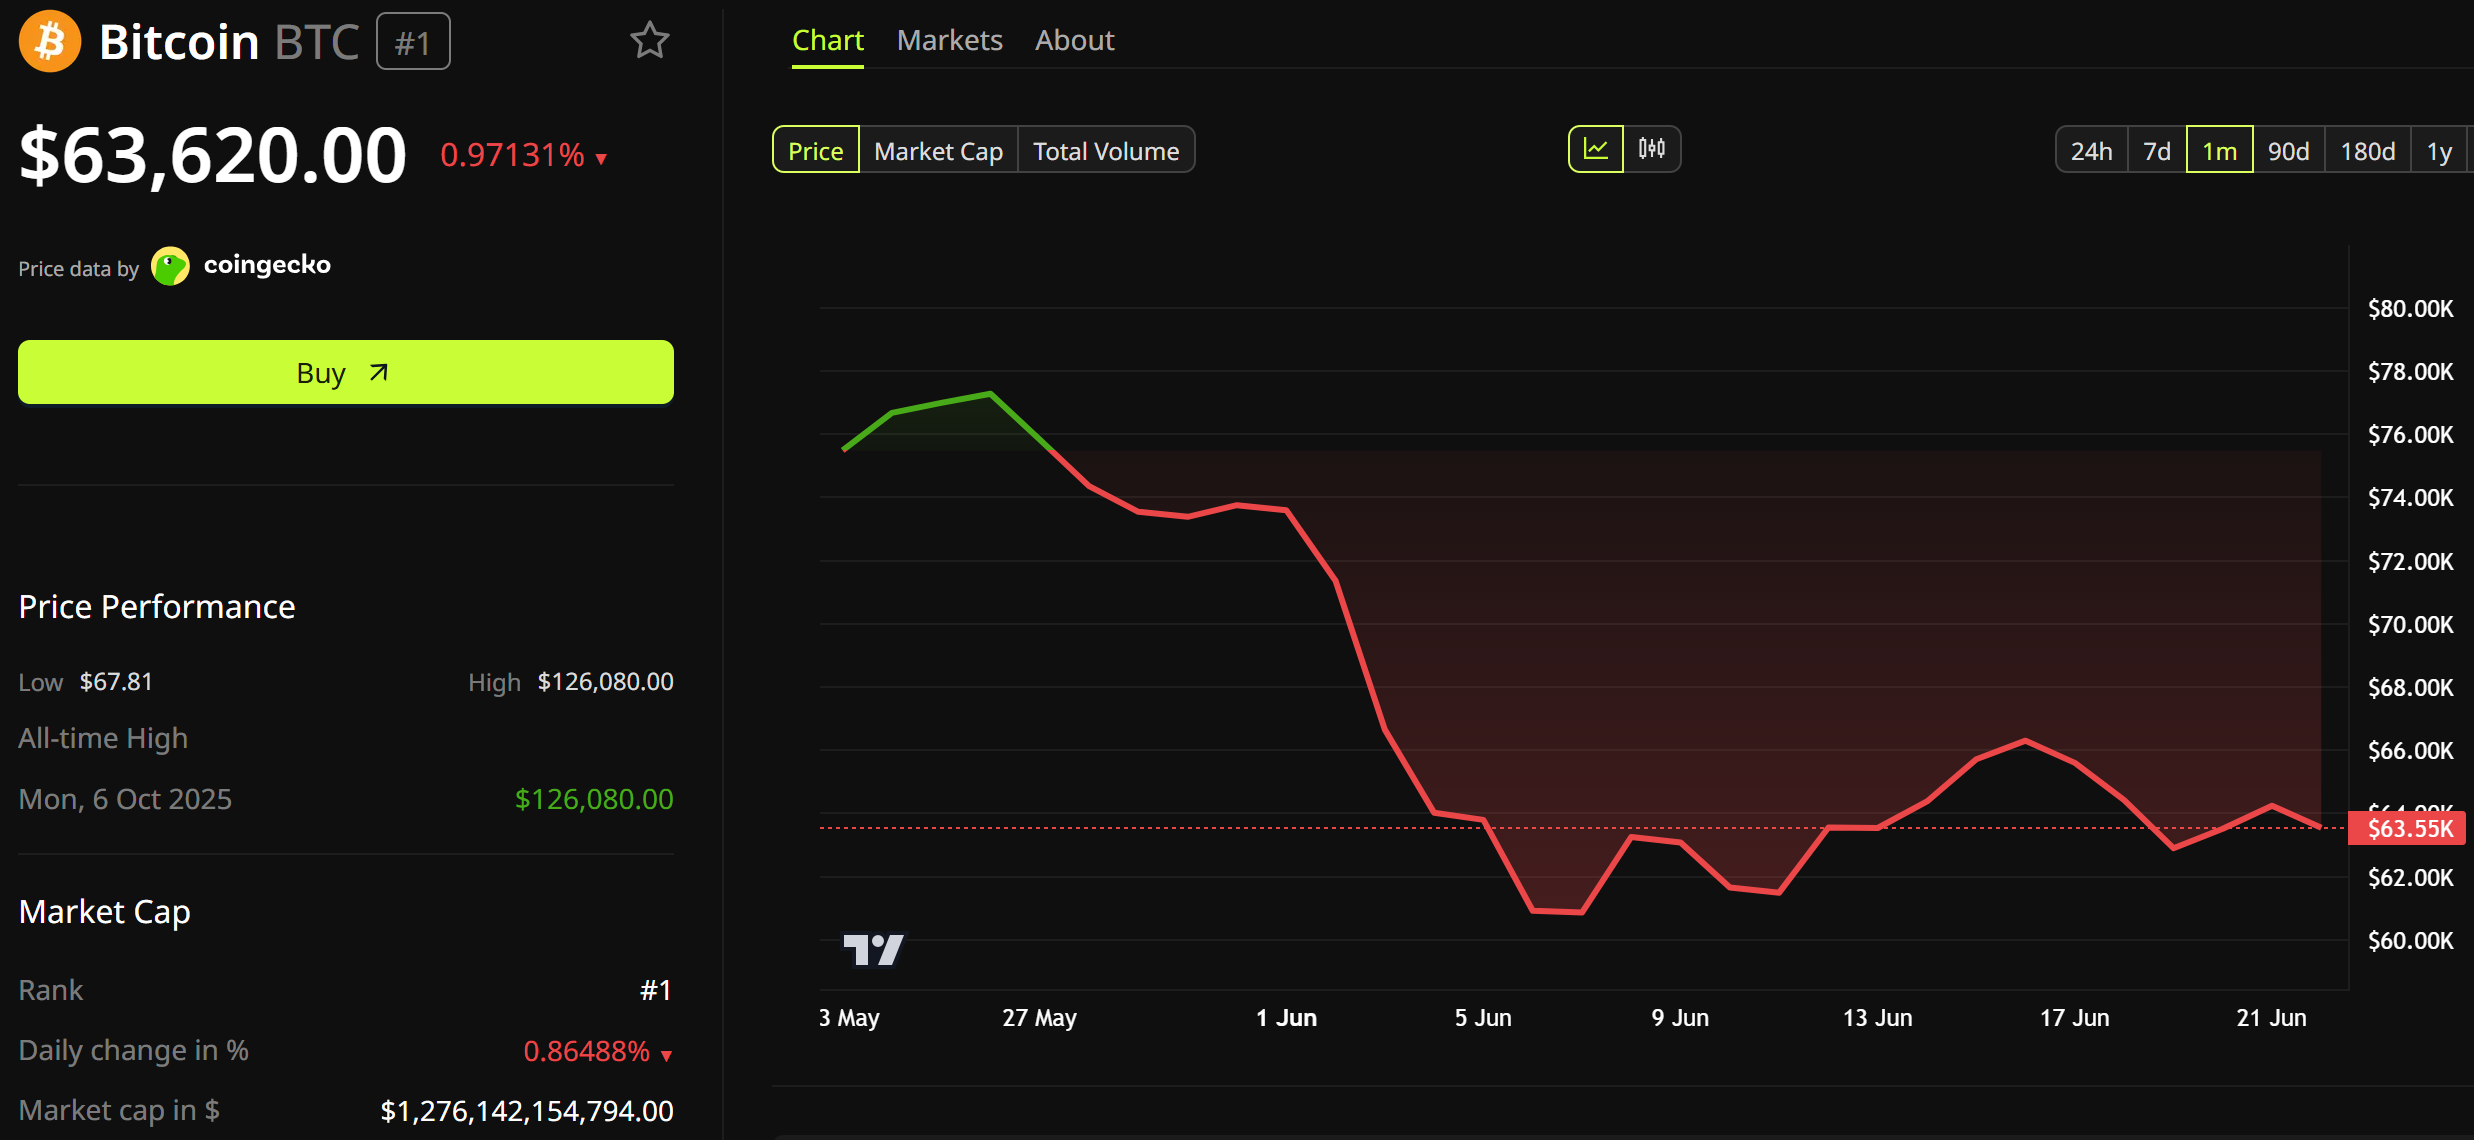
Bitcoin traded near $63,620, with a market value of about $1.28 trillion. It has slid toward the low $60,000s in recent weeks.

The token now trades more like a tech stock than a safe haven. It weakened as FOMC and AI earnings rattled markets.
If forced equity selling collides with high leverage and crowded AI bets, cross-asset volatility could climb into month-end.
The market absorbing the flows or amplifies them may set the tone for stocks and crypto this week.
The post $165 Billion Stock Selloff Looms as Goldman Flags Rising Leverage appeared first on BeInCrypto.
The Proof-of-Stake (PoS) blockchain network, Algorand, has revealed that it is pushing toward becoming quantum-resistant by the end of 2027. The announcement comes as concerns about the post-quantum threat rise in the crypto space.
According to a blog post by the network’s team, the quantum threat has been deemed a serious risk to the security of blockchain technology. Hence, Algorand has outlined a roadmap detailing its efforts, plans, progress, milestones, and ongoing research in the area of post-quantum cryptography (PQC).
Algorand Pushes for Quantum Resistance
Google Quantum AI recently identified Algorand among a set of smart-contract platforms that can achieve PQC. The blockchain already executed its first PQC-secured transaction in 2025 and intends to complete the full PQC transition in less than two years.
“Post-quantum migration is a balancing act. Moving too slowly leaves systems exposed to future quantum attacks, but moving too quickly can mean relying on algorithms and implementations that have not yet been sufficiently battle-tested,” Algorand’s team explained.
The first step in the roadmap is introducing support for native post-quantum accounts in the protocol release scheduled for the third quarter of 2026. Previously enabled Falcon accounts via the Algorand Virtual Machine (AVM) currently demonstrate the viability of post-quantum signatures on the Algorand protocol, but these are not natively supported by the ledger. The introduction of native post-quantum account support will give room for network-level support for multiple concurrent signature schemes.
After the Algorand team establishes a clear direction for standardizing a new derivation scheme for lattice-based post-quantum keys, the network will implement PQC updates to its tools. These include legacy software development kits (SDKs), hardware wallets, and the AlgoKit. Eventually, the network will introduce support for additional signature schemes on traditional Ed25519 accounts.
Exploring Post-Quantum Multisignatures
While implementing these upgrades, Algorand intends to create an environment that enables the integration of future advances with minimal protocol disruption.
“Building on our robust history of native multisig, the arrival of cryptographic agility and native post-quantum accounts enables us to deploy native multisig support for multi-cryptography schemes by the end of 2026. We view this as an essential advancement for institutional operations, treasury management, and high-stakes financial applications,” the team explained.
One of the final steps in the roadmap explores post-quantum multisignatures as a generic policy layer over independently verifiable signatures. This will allow for weighted approvals, hybrid combinations of classical and post-quantum signers, and future PQC signature algorithms as standards develop. This step will ensure protection against both classical and quantum-era threats.
Meanwhile, Algorand is not the only blockchain network pushing for quantum resistance in the coming years; Ethereum and Ripple are working towards the milestone as well.
The post Algorand Reveals Plans to Become Quantum Resistant by 2027 appeared first on CryptoPotato.

Coronation Street star confirms Maria’s most challenging situation is coming | Soaps

Toy Story 5 sees franchise's biggest ever opening weekend

Christian Lundgaard overcomes early collision to win XPEL Grand Prix


![LISA - 'MONEY' Dance Practice [Mirrored]](https://wordupnews.com/wp-content/uploads/2026/02/1770259125_maxresdefault-80x80.jpg)

-
 Crypto World7 days ago
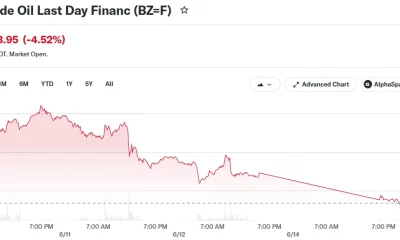
Crude Oil Plunges Over 4% as US-Iran Agreement Reopens Hormuz Strait
-

 Fashion2 days ago
Weekend Open Thread: Miami – Corporette.com
-
 Tech5 days ago
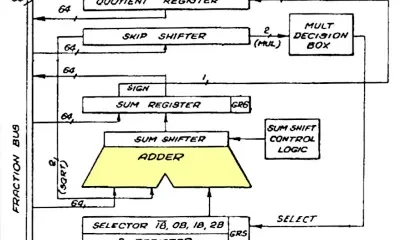
The Adder At The Heart Of Intel’s 8087 FPU
-
 Business2 days ago
Wall Street Week Ahead: Investors see Micron earnings as pulse check of AI rally momentum
-

 Crypto World2 days ago
HIVE shares jump as $220M AI deal speeds Bitcoin mining pivot
-

 Sports3 days ago
FIFA World Cup 2026: Canada beat 9-men Qatar 6-0 to register first ever win | FIFA World Cup 2026
-

 Business1 day ago
MHP SE 2026 Q1 – Results – Earnings Call Presentation (OTCMKTS:MHPSY) 2026-06-20
-

 Crypto World2 days ago
Jake Chervinsky accuses CME of protecting derivatives monopoly
-

 Business3 days ago
Brexit cost 6% of UK economy, Bank of England company data suggests
-

 Business1 day ago
Soccer-U.S. defends Iran World Cup travel restrictions, says discussions ongoing
-

 Crypto World4 days ago
Anthropic’s Dario Amodei Urged AI Unity at G7, Even as US Banned His Models
-

 Tech4 days ago
Weeks Of In-The-Field Testing And A Verdict
-
 Crypto World2 days ago
Can Charles Hoskinson Really Rescue Cardano?
-

 Tech4 days ago
Adobe adds its AI assistant to Premiere, Illustrator and InDesign
-

 Entertainment1 day ago
Renter of Home in Anne Heche Crash Denies Settlement With Son
-

 Politics2 days ago
Andy Burnham and the meaning of Makerfield
-
 Crypto World4 days ago
Iren (IREN) Stock Surges on Jefferies Buy Rating: AI Infrastructure Play Gains Momentum
-
 Politics3 days ago
BBC Reporter Discusses Cross Party Criticism Of Trumps Iran Deal
-

 Tech3 days ago
Instagram Now Lets You Add A Unique Caption To Each Carousel Slide
-

 Crypto World4 days ago
Coinbase Stakes Out Brokerage Territory With SEC-Registered AI Advisor and Stock Options Push
You must be logged in to post a comment Login