
Crypto World
Trap Ahead As Whales Dump $30 Million?
Cardano price has entered a critical phase after confirming a bearish breakdown. The token has already lost key support, and the technical structure now points toward deeper downside risk. Yet, even as large holders continue selling and avoid re-entering, smaller investors are aggressively buying the dip.
This creates a dangerous split in the market. Whales appear to be stepping aside, while retail investors are stepping in. The key question now is whether retail is buying the bottom — or walking into the next leg lower.
Whales Dump 120 Million ADA Before Breakdown — And Still Refuse to Buy Back
Cardano’s recent price drop of nearly 5% over the past 7 days did not come without warning. The largest whale cohort holding between 100 million and 1 billion ADA began reducing holdings days before the head-and-shoulders breakdown happened.
Want more token insights like this? Sign up for Editor Harsh Notariya’s Daily Crypto Newsletter here.
On February 19, this group held about 2.54 billion ADA. By February 23, their holdings had fallen to 2.42 billion ADA. This represents a drop of around 120 million ADA, roughly 30 million.
This selling started even before the head-and-shoulders breakdown confirmed on February 22. In other words, whales reduced exposure while the pattern was still forming, suggesting they anticipated further downside. More importantly, whales have not started buying back.
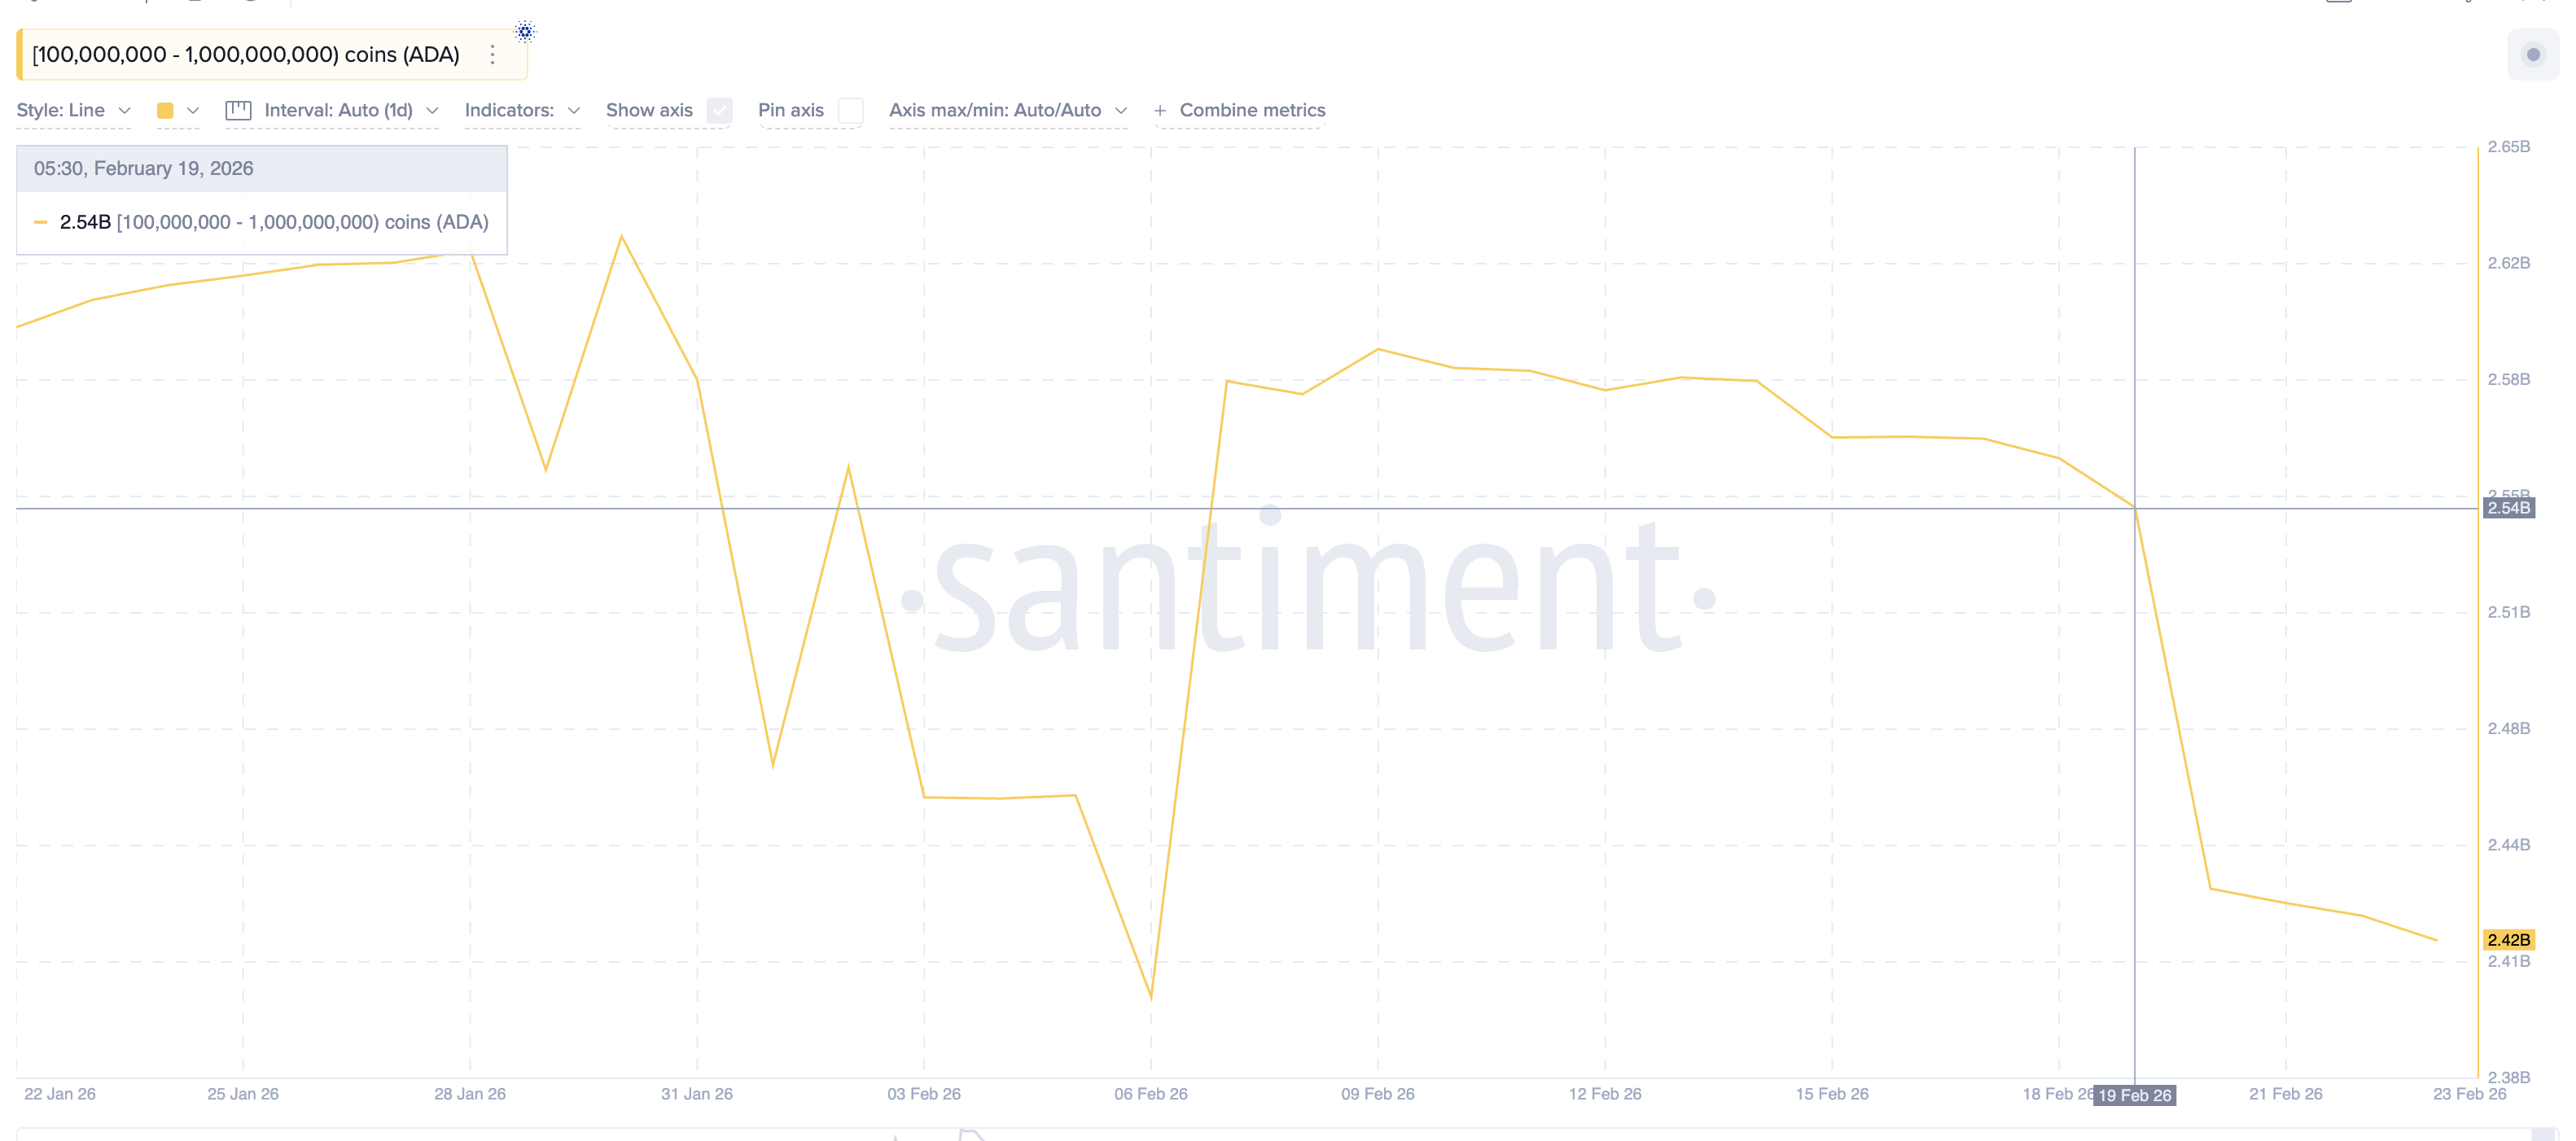
This absence of accumulation matters more than the selling itself. When large investors expect a recovery, they typically begin re-accumulating near support levels. Their refusal to do so signals continued caution.
This raises a critical question. If whales are staying away, why are smaller investors suddenly stepping in aggressively?
Retail Buying Surges 640% Even As Profitability Signals More Downside Risk
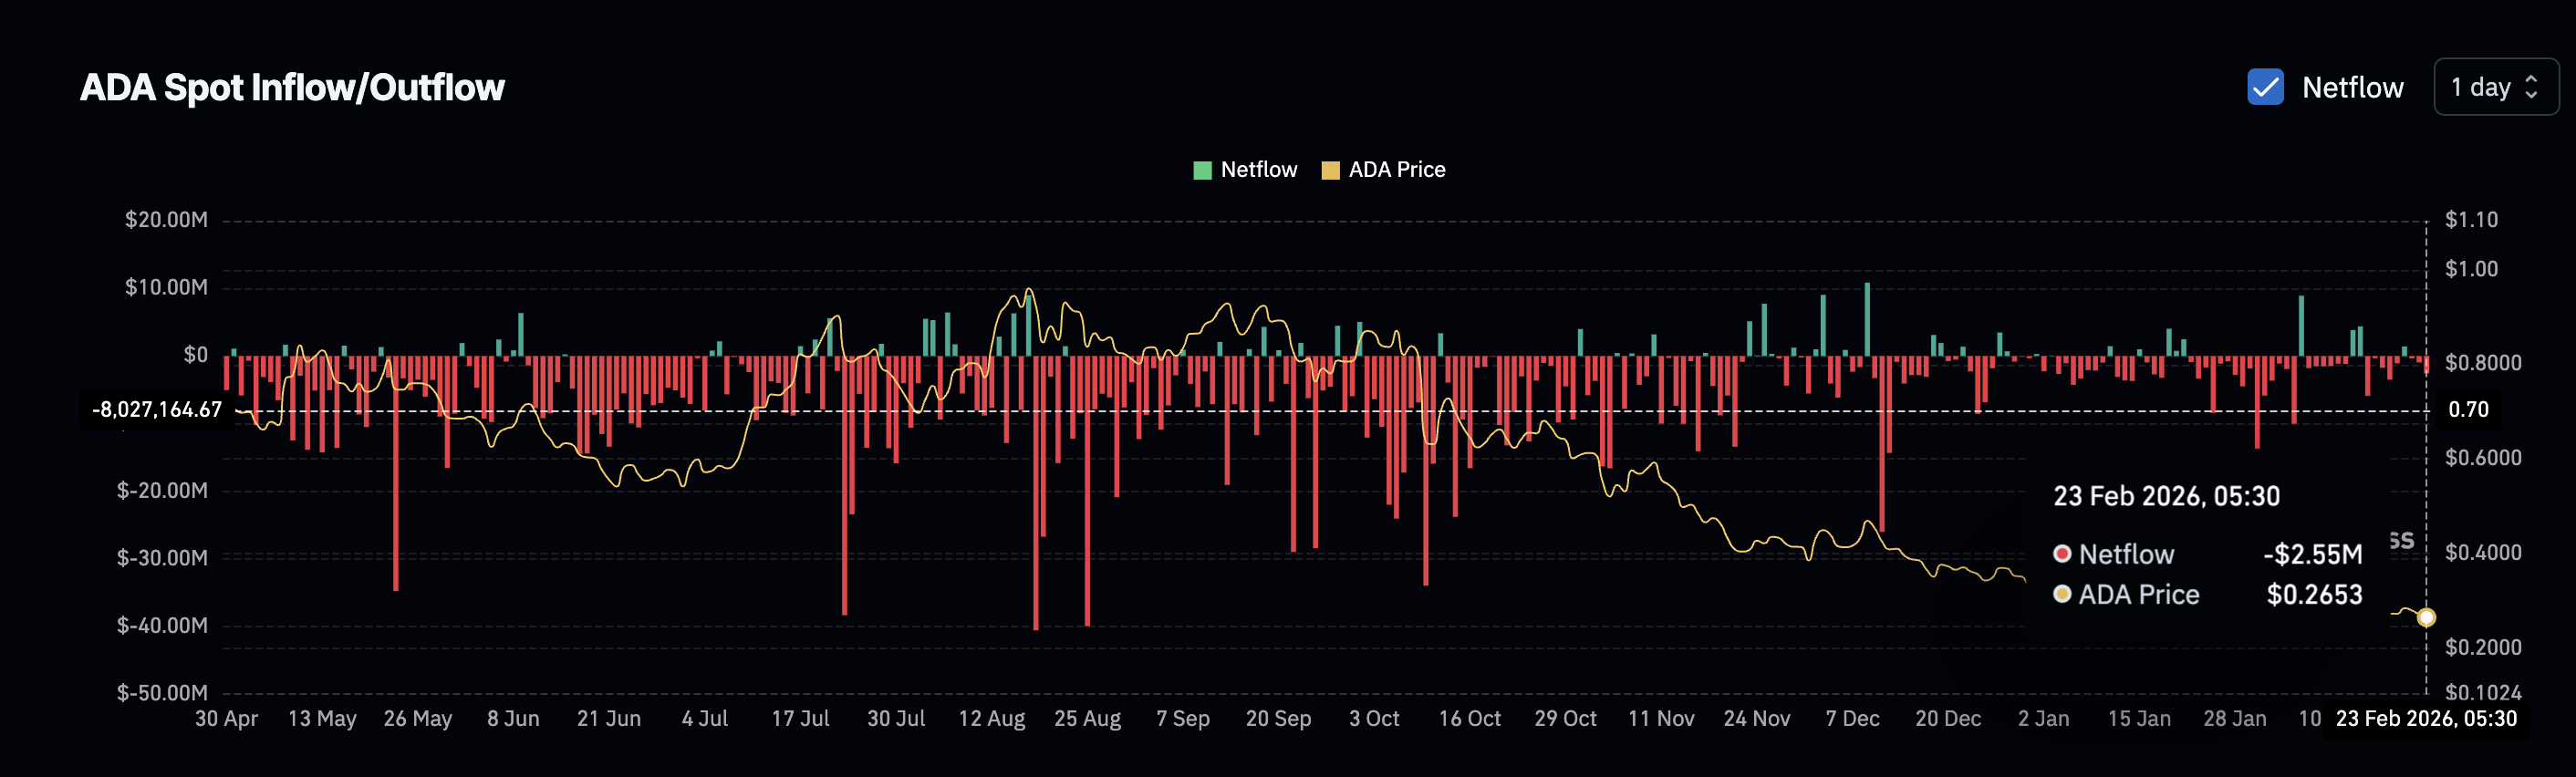
Exchange flow data reveals a dramatic shift in retail behavior. On February 21, ADA exchange outflows totaled around $344,450. By February 23, outflows surged to $2.55 million. This marks a massive 640% increase in just two days.
Exchange outflows happen when investors withdraw coins into private wallets. This usually signals buying and holding rather than preparing to sell. Retail investors are clearly buying the dip as whales have been clearly selling.
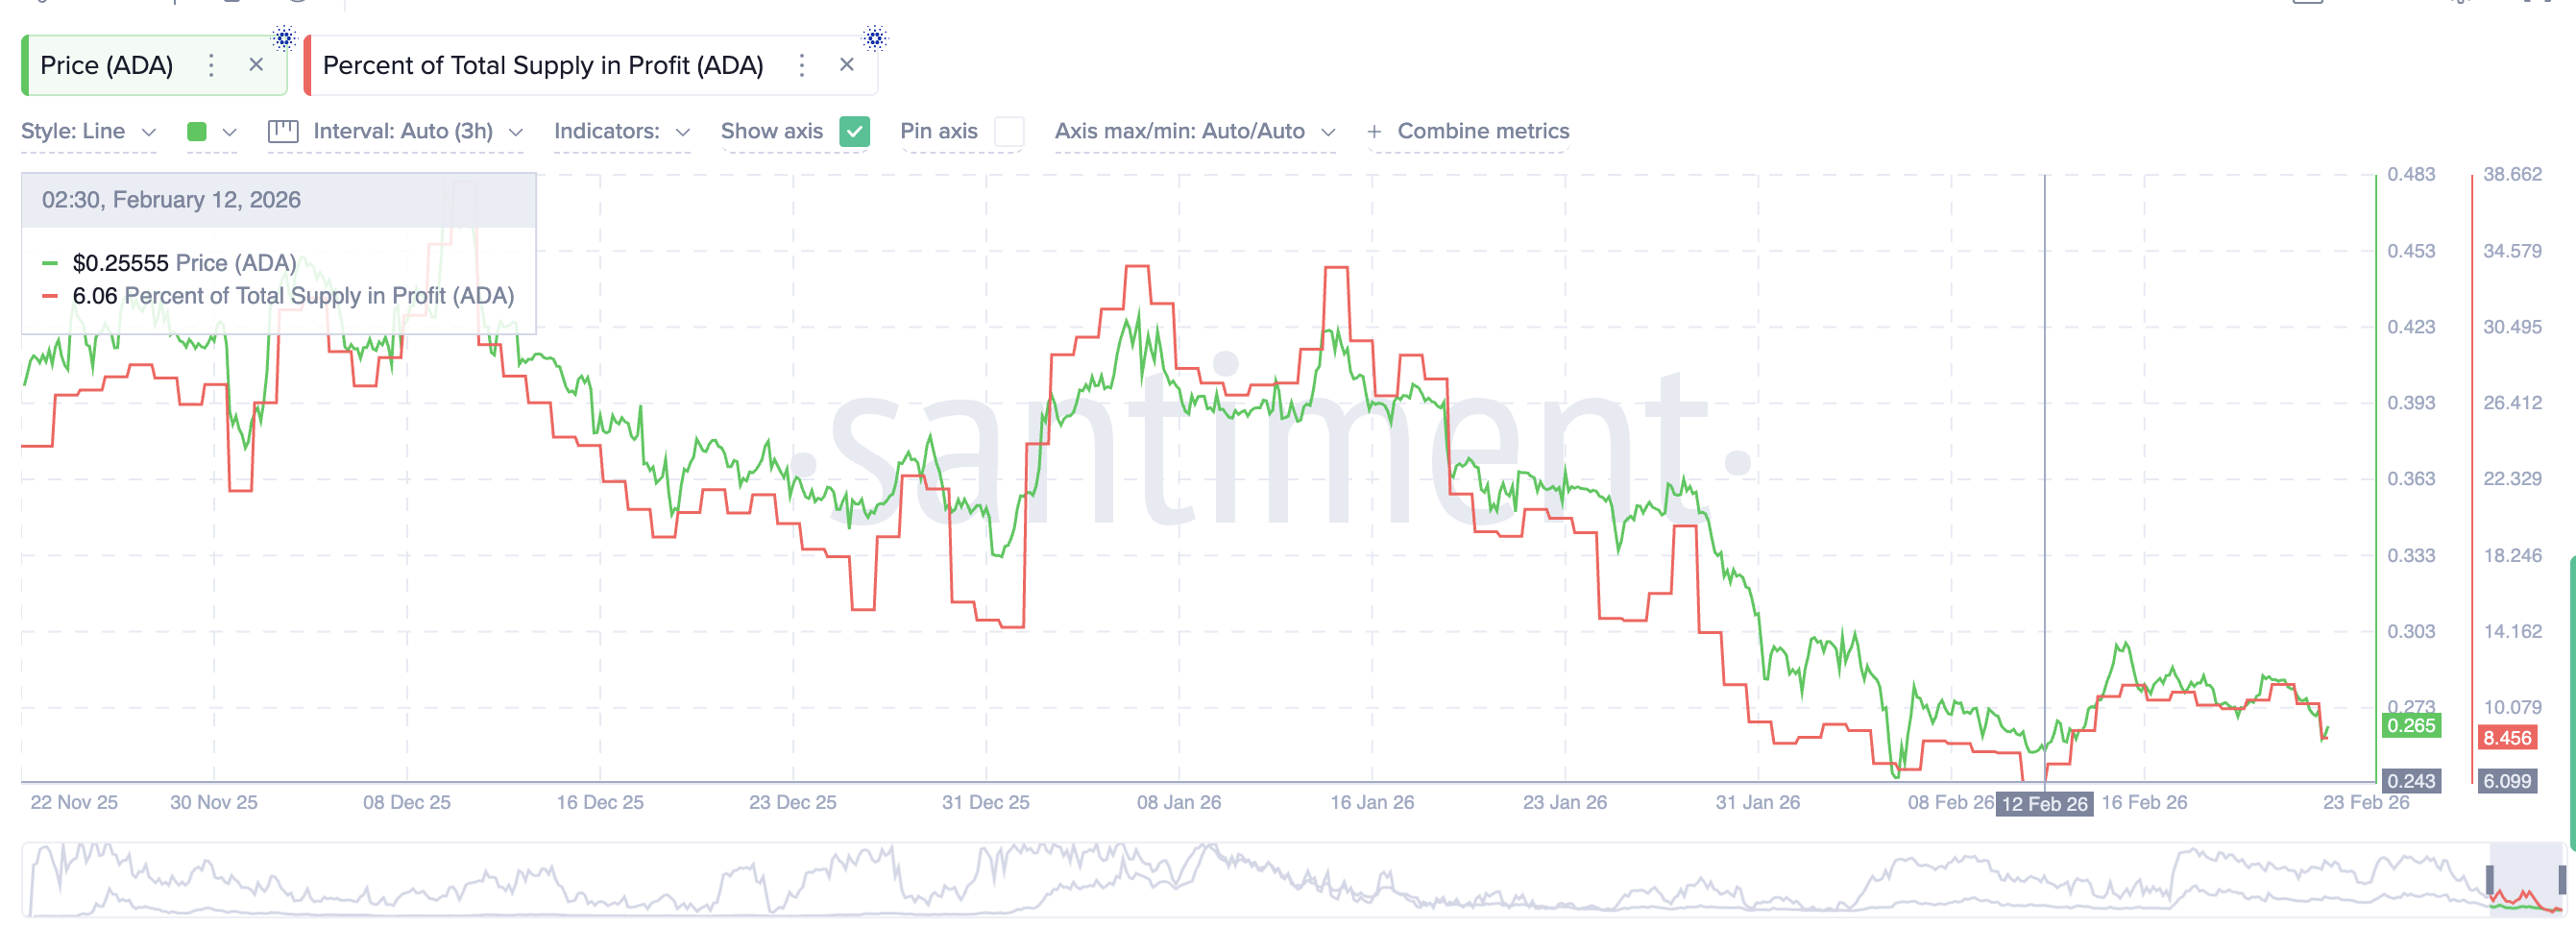
However, another key metric suggests the correction may not be finished yet. The Percent of Total Supply in Profit indicator shows how much of the circulating supply is currently profitable. This metric dropped to just 6.06% on February 12, marking its lowest level in three months.
It later recovered to around 11% before the breakdown and now sits near 8.45%. Even though profitability remains low, it is still about 40% higher than the recent bottom. This matters because markets often continue falling when profitability remains above extreme capitulation levels.
This suggests Cardano may still have room to decline further.
This creates a clear contradiction. Retail investors are accumulating aggressively, but profitability and whale positioning both signal continued caution. The ADA price chart now shows exactly how this conflict could resolve.
Cardano Price Targets $0.23 Unless Bulls Reclaim Critical Resistance
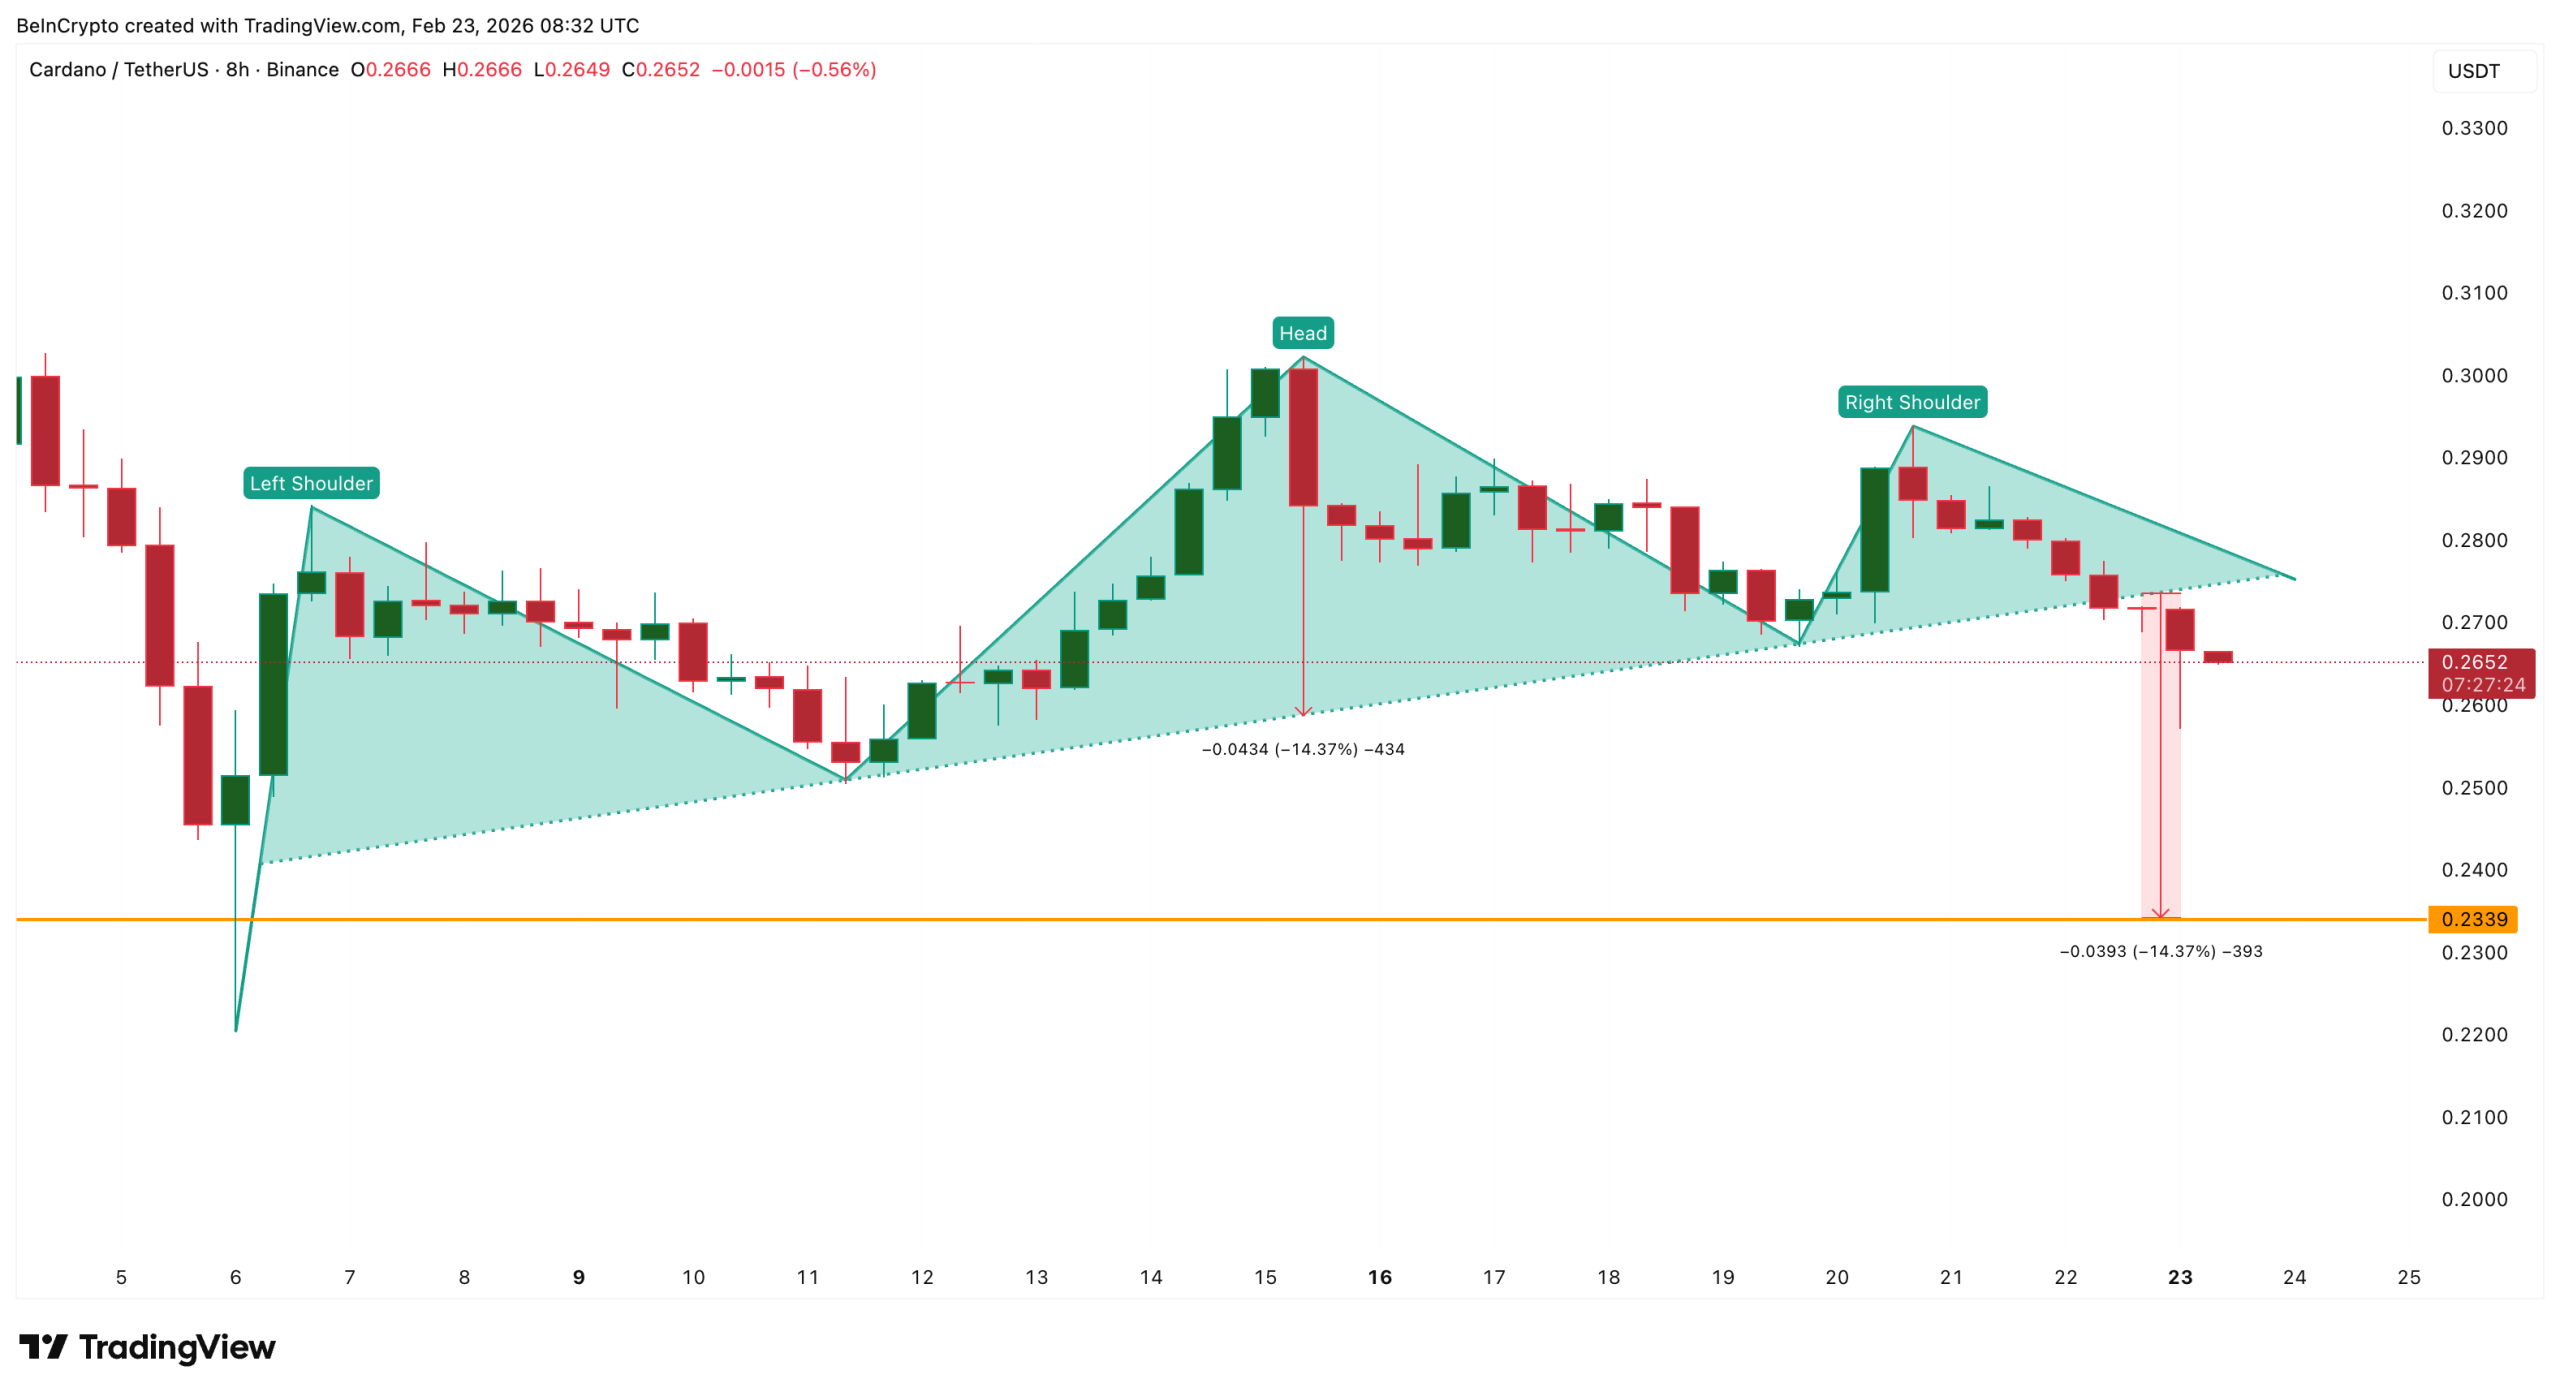
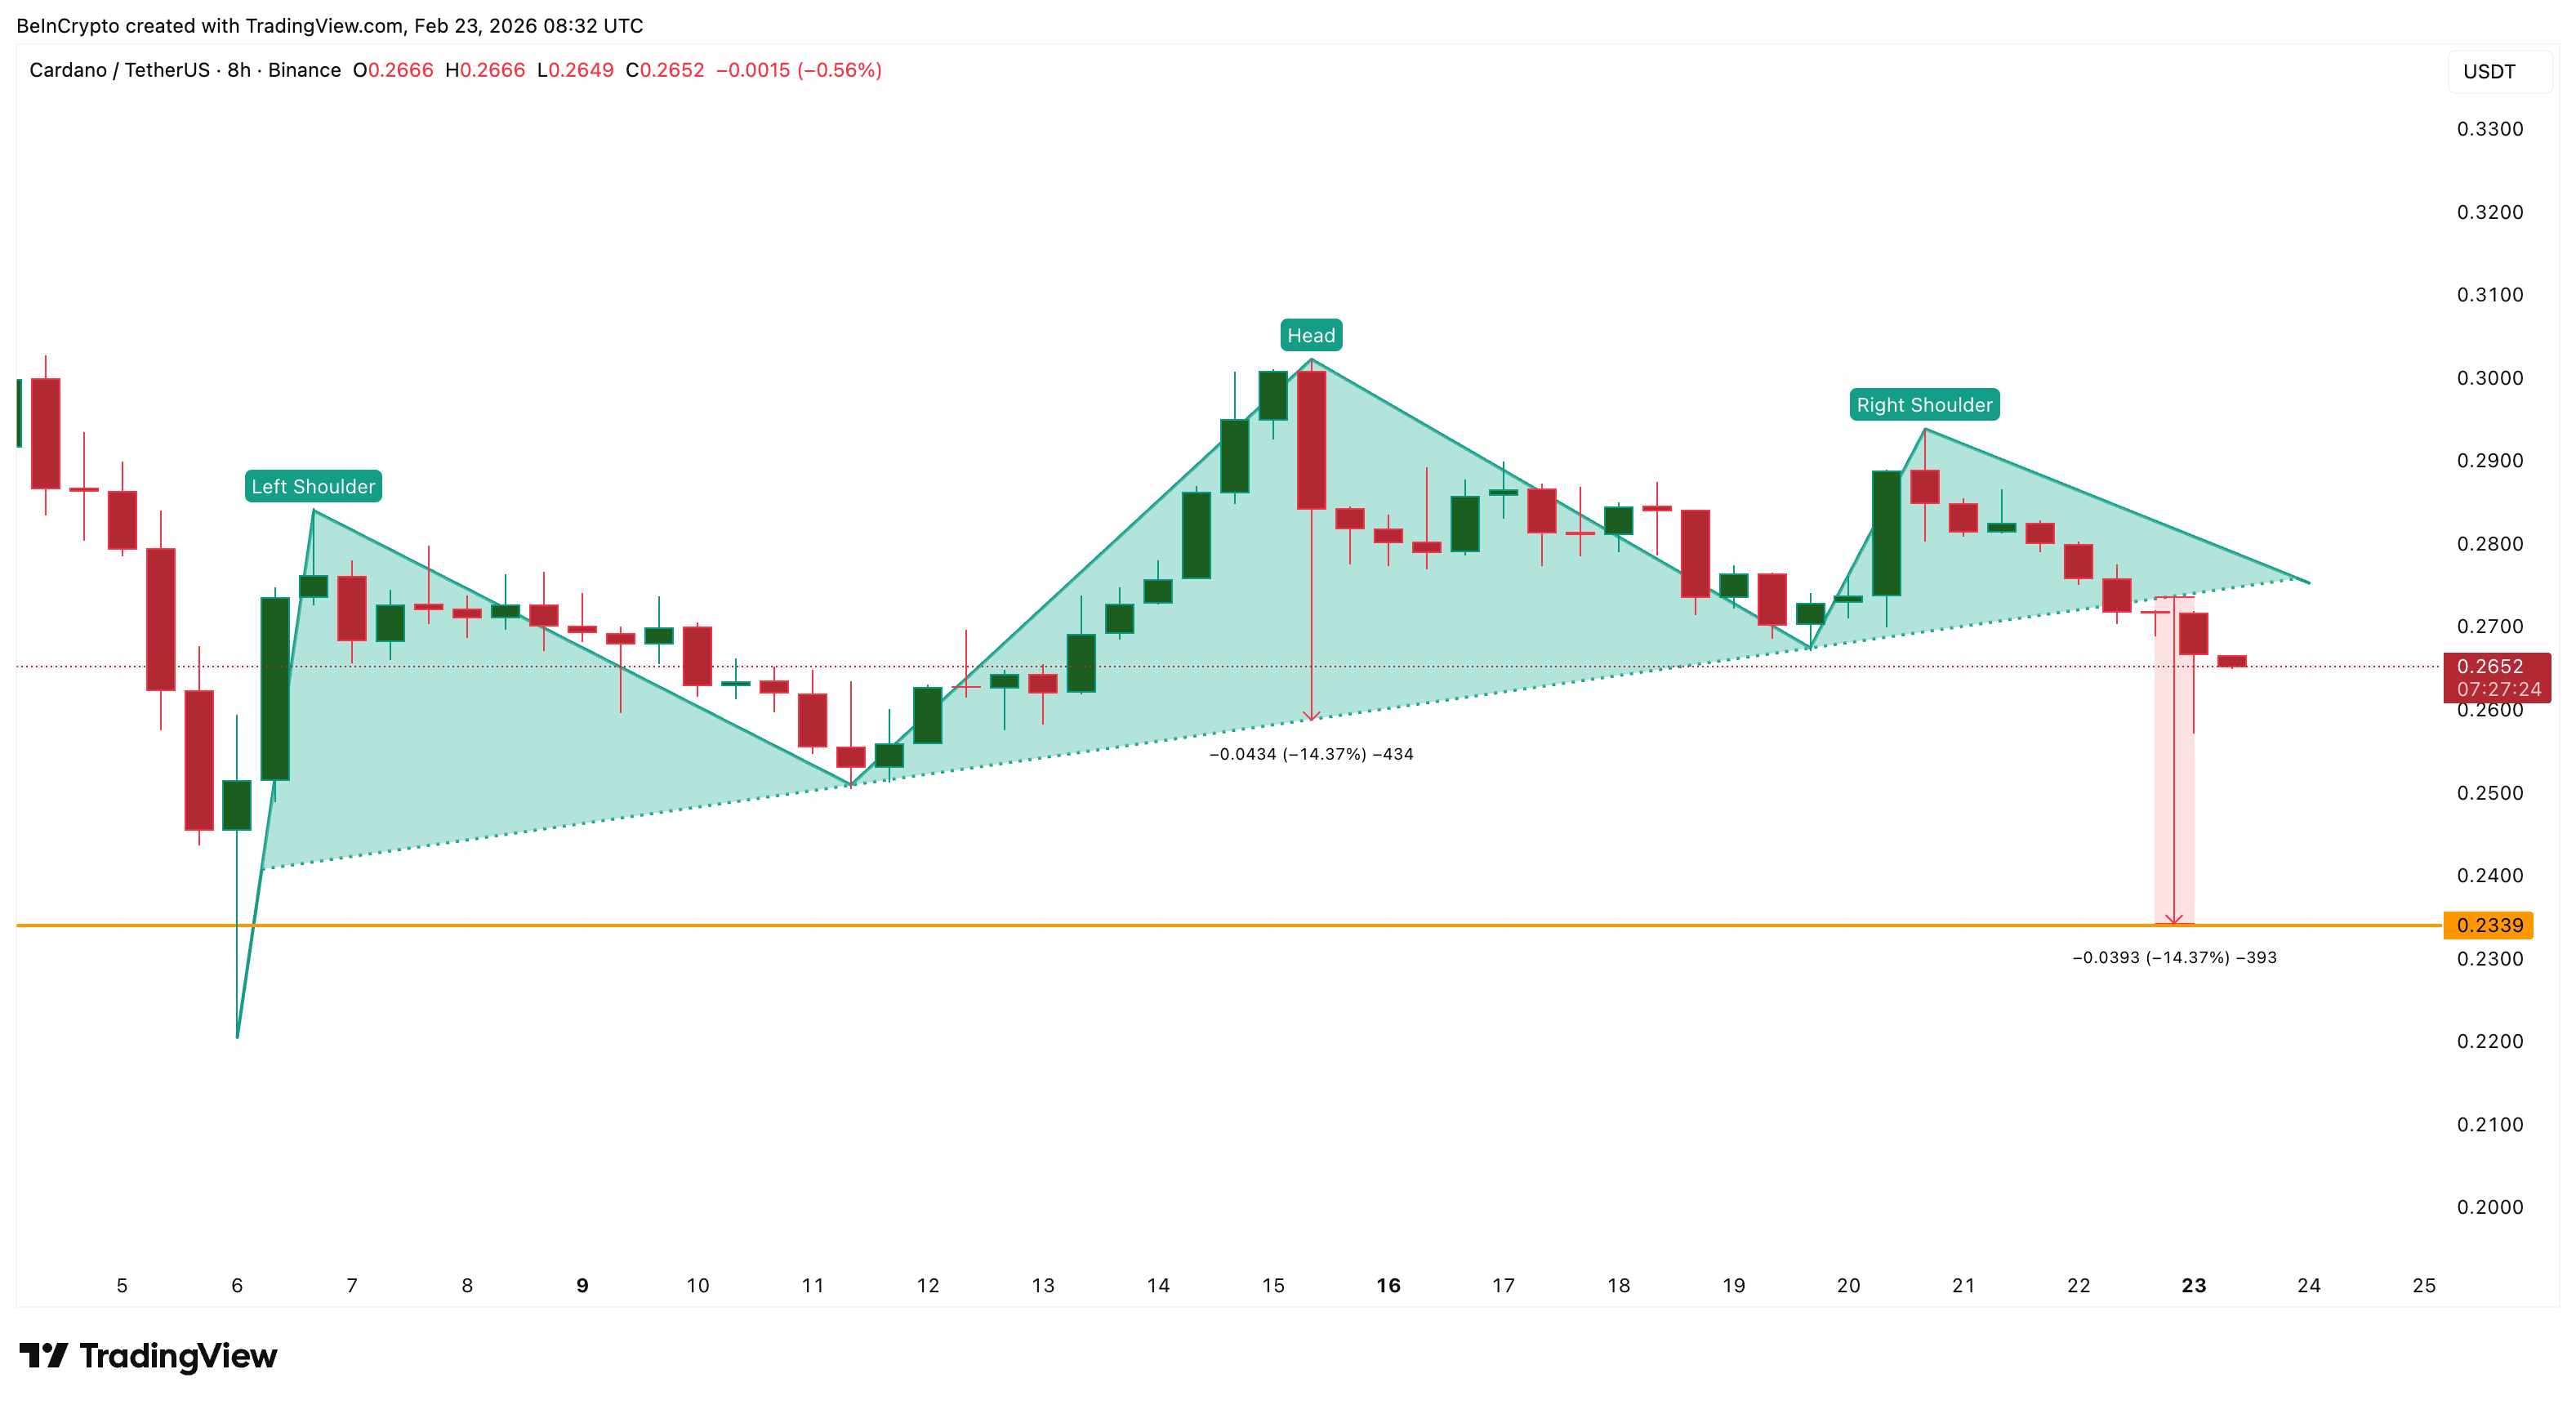
Cardano has now confirmed a breakdown from a head-and-shoulders pattern on the 8-hour chart. This pattern typically signals a shift from accumulation to distribution and often leads to further downside.
Cardano recently lost the key support level at $0.266 and is now trading near $0.265. This level has already failed to provide a strong recovery. Even the Smart Money Index (SMI), which tracks the positions of informed investors, is diverging from the signal line as the ADA price broke support. This pattern aligns with whale skepticism and suggests an immediate rebound might not be on the cards, as retail thinks.
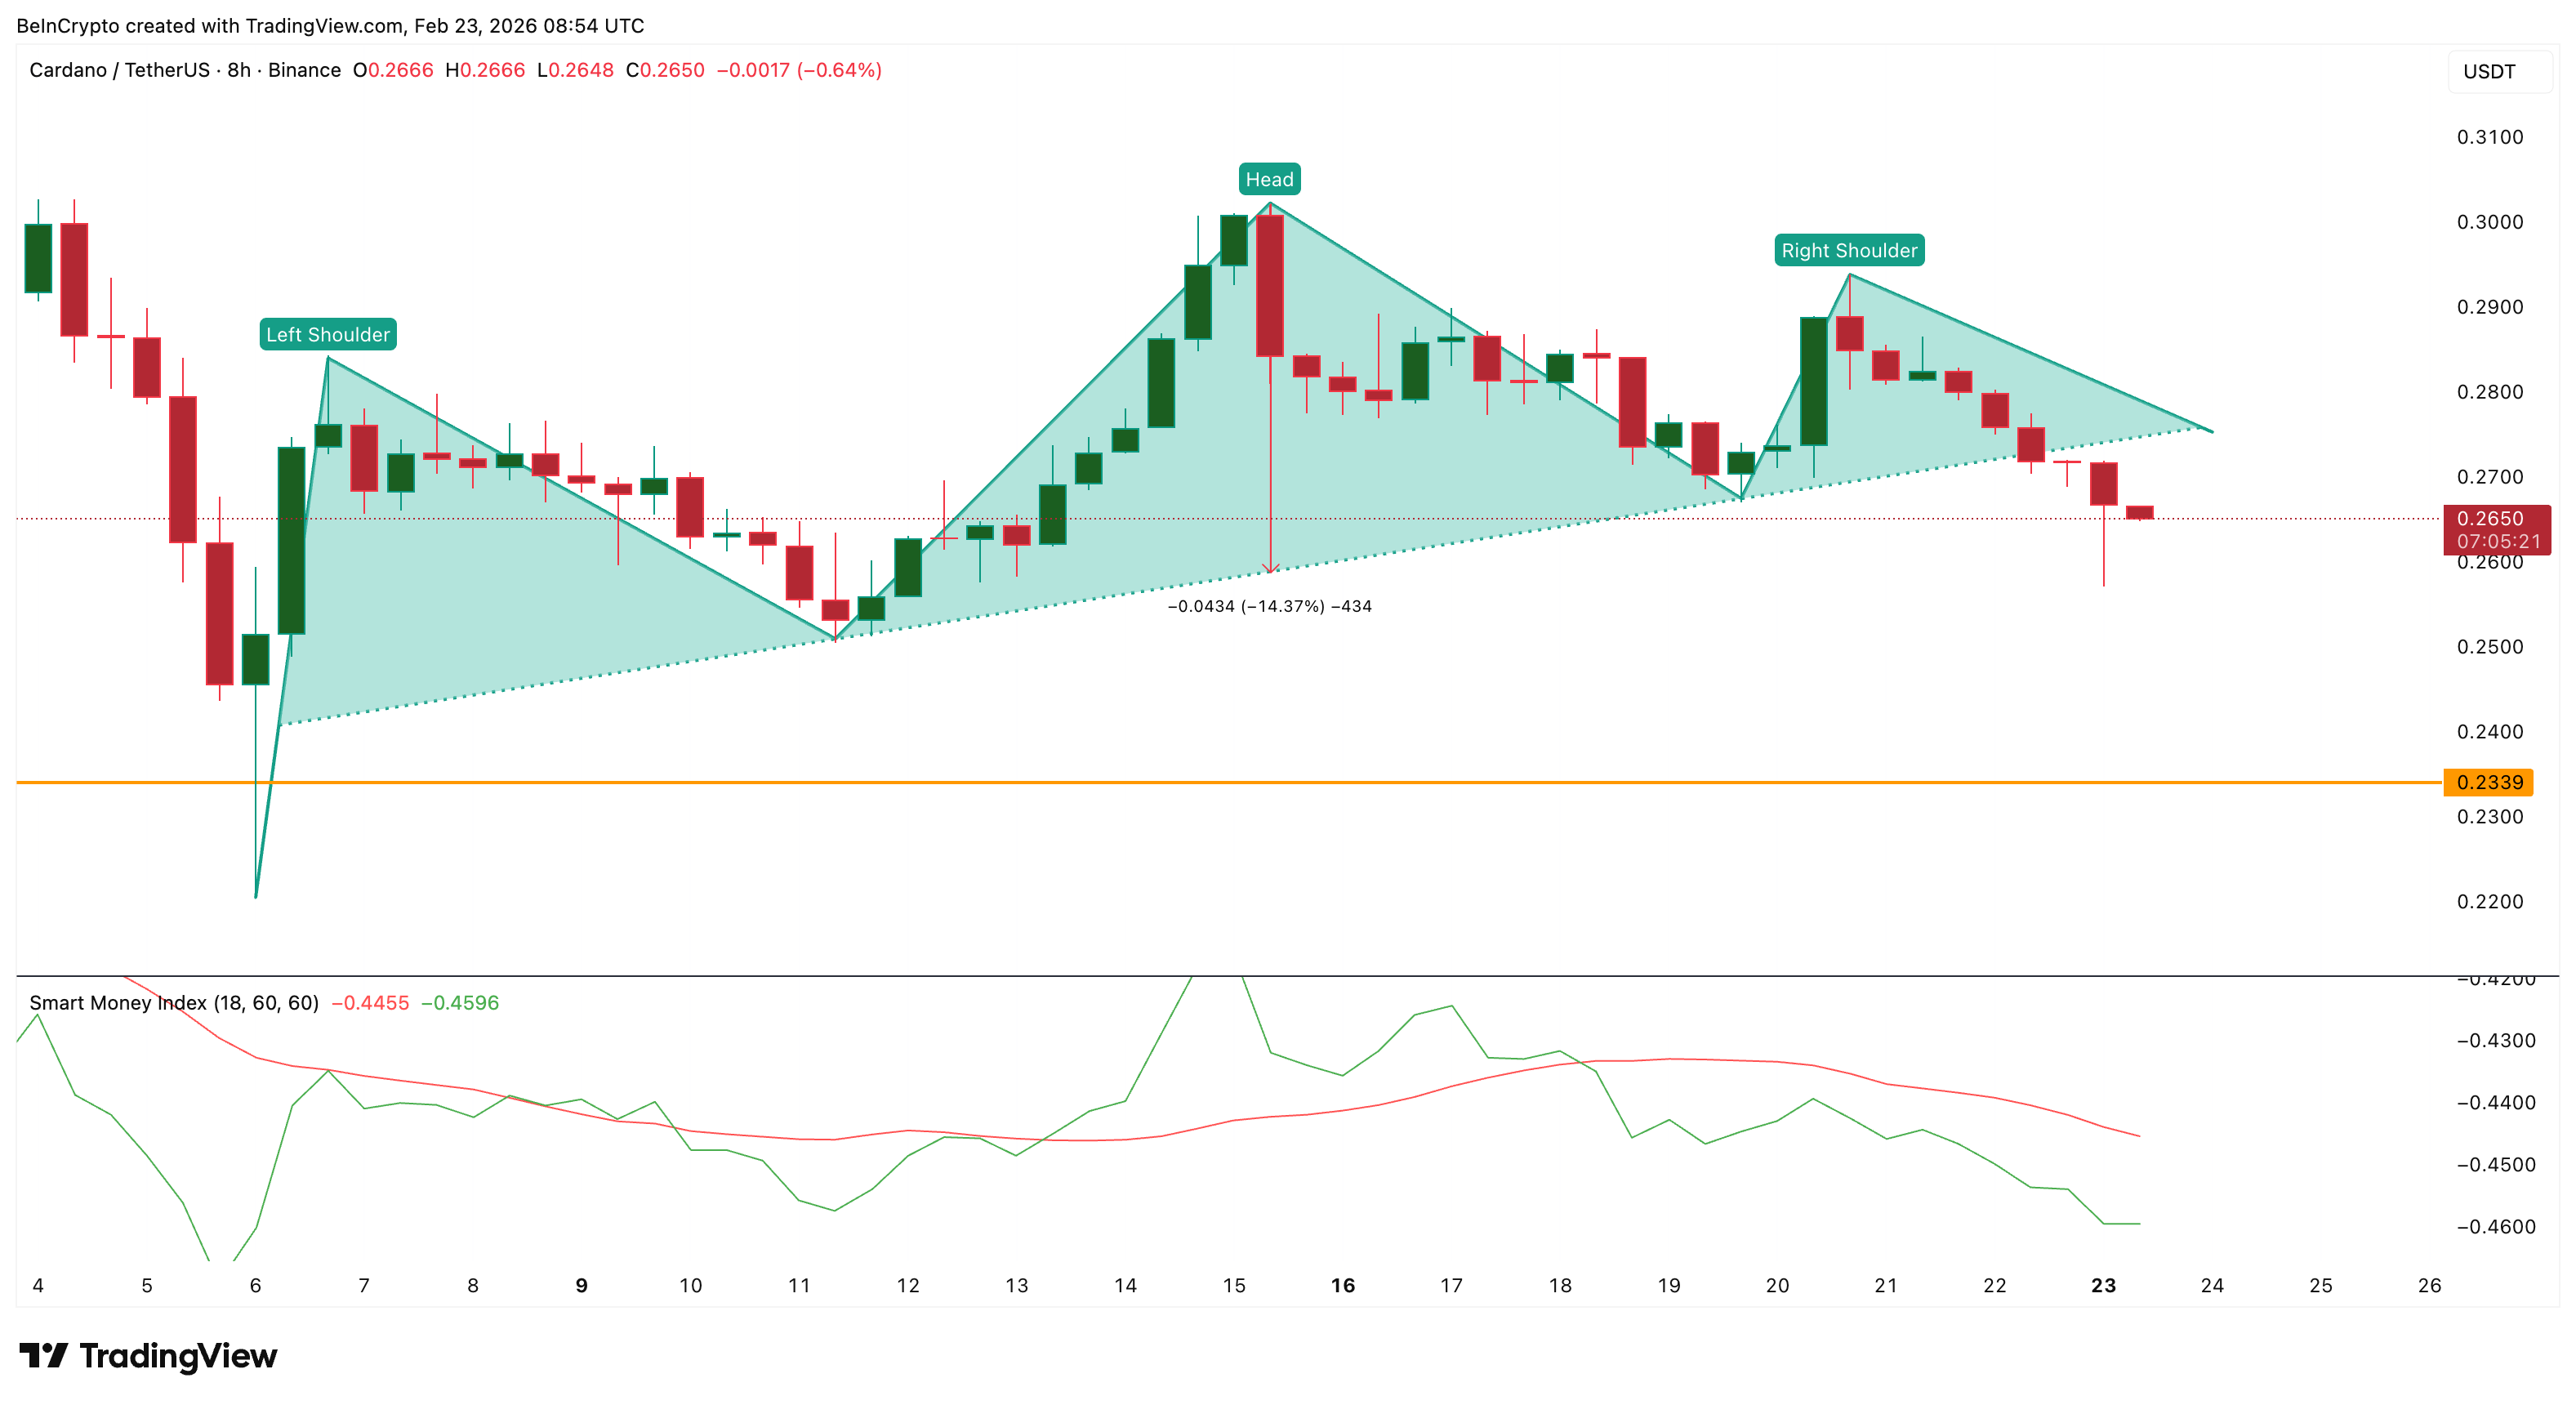
The next immediate support sits near $0.259.
If this level breaks, Cardano could fall toward $0.233. This represents an additional 12% downside from current levels and aligns with the full projection of the breakdown pattern. The broader structure remains bearish unless Cardano can reclaim higher resistance levels.
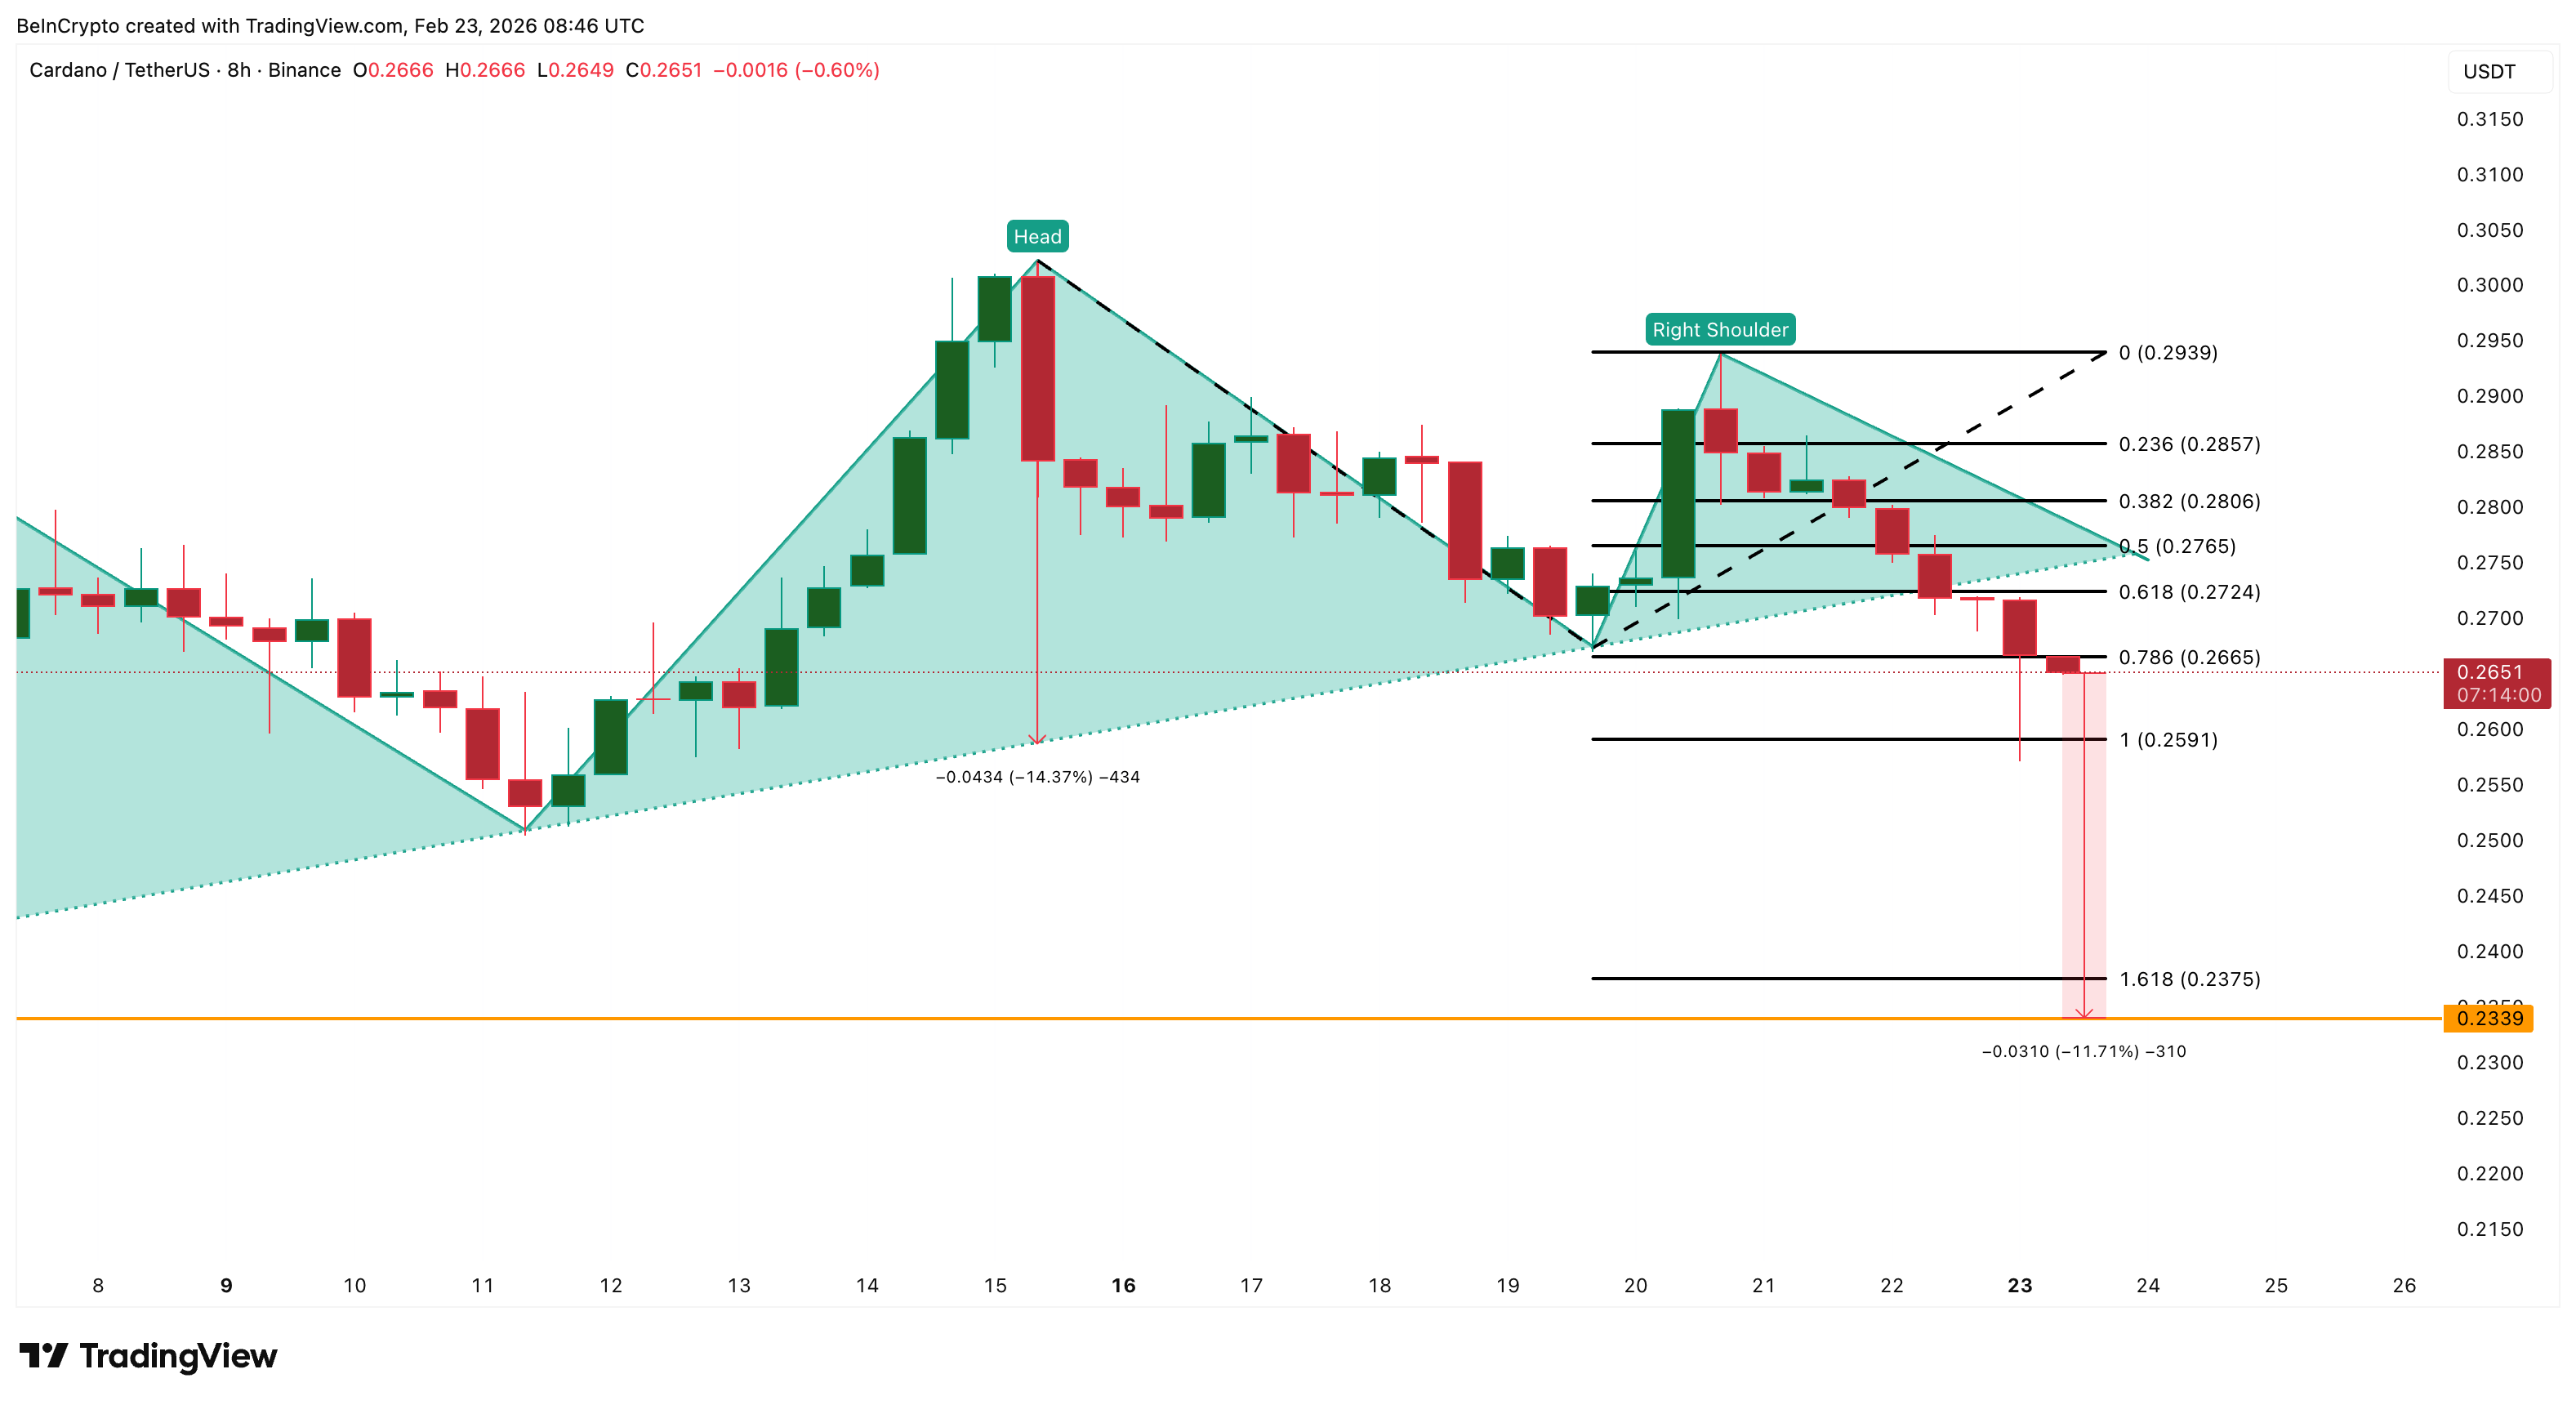
The first sign of strength would appear only if Cardano recovers above $0.276. However, true bullish invalidation requires a move above $0.293. Until then, the trend remains tilted toward further downside.

Crypto World
How North Korea’s 6-month long secret espionage program has crypto community rethinking security


When Drift disclosed the details behind its $270 million exploit, the most unsettling part wasn’t the scale of the loss — it was how it happened.
According to the team behind the protocol, the attack wasn’t a smart contract bug or a clever piece of code manipulation. It was a six-month campaign involving fake identities, in-person meetings across multiple countries and carefully cultivated trust. The attackers, allegedly from North Korea, didn’t just find a vulnerability in the system. They became part of it.
This new threat is now forcing a broader reckoning across decentralized finance.
For years, the industry has treated security as a technical problem, something that could be solved with audits, formal verification and better code. But the Drift incident suggests something far more complex: that the real vulnerabilities may lie outside the codebase altogether.
Alexander Urbelis, chief information security officer (CISO) at ENS Labs, argues the framing itself is already outdated.
“We need to stop calling these ‘hacks’ and start calling them what they are: intelligence operations,” Urbelis told CoinDesk. “The people who showed up at conferences, who met Drift contributors in person across multiple countries, who deposited a million dollars of their own money to build credibility: that’s tradecraft. It’s the kind of thing you’d expect from a case officer, not a hacker.”
If that characterization holds, then Drift represents a new playbook: one where attackers behave less like opportunistic hackers and more like patient operators embedding themselves socially before making a move onchain.
“North Korea isn’t scanning for vulnerable contracts anymore. They’re scanning for vulnerable people… That’s not hacking. That’s running agents,” Urbelis added.
The tactics themselves aren’t entirely new.
Investigations in recent years have shown North Korean operatives infiltrating crypto firms by posing as developers, passing job interviews and even securing roles under fake identities. But the Drift incident suggests those efforts have escalated — from gaining access through hiring pipelines to running months-long, in-person relationship-building operations before executing an attack.
‘The Achilles’ heel’
That shift is what has many security leaders most concerned. Even the most rigorously audited protocol can still fail if a contributor is compromised.
David Schwed, chief operating officer of SVRN and a former CISO at both Robinhood and Galaxy, sees the Drift case as a wake-up call.
“Protocols need to understand what they’re up against. These aren’t simple exploits. These are well-planned, months-long operations with dedicated resources, fabricated identities, and a deliberate human element,” Schwed told CoinDesk. “That human element is the Achilles’ heel for many organizations.”
Many DeFi teams remain small, fast-moving and built on trust. But when a handful of individuals control critical access, compromising one can be enough.
Schwed argues that the response needs to be updated. “The answer is a well-fortified security program that protects not just the technology, but the people and the process… Security needs to be foundational to the project and the team.”
Some protocols are already adjusting. At Jupiter, one of Solana’s largest DeFi platforms, the baseline of audits and formal verification remains, but leaders claim it’s no longer sufficient.
“Clearly, securing code via multiple independent audits, open sourcing, and formal verification is just table stakes. The surface area for attacks has broadened substantially,” said COO Kash Dhanda.
That broader surface now includes governance, contributors and operational security. Jupiter has expanded its use of multisigs and timelocks while investing in detection systems and internal training.
“Given that flesh is more vulnerable than code, we’re also updating opsec training and monitoring for key team members,” Dhanda said.
Even then, he added, “there is no end-state for security” and complacency remains the biggest risk.
For protocols like dYdX, the Drift incident reinforces a reality that can’t be engineered away entirely.
“It’s an unfortunate fact of life that crypto projects are being increasingly targeted by state-sponsored bad actors… developers must take precautions to prevent and mitigate the impact of social engineering compromises, but users should also be aware that given the increasing sophistication of bad actors the risk of such compromises cannot be totally eliminated,” said David Gogel, COO of dYdX Labs.
That evolving threat model is also shifting responsibility toward users themselves.
“Users who are active in DeFi should take the time to understand the technical architecture of protocols or smart contracts that hold their funds, and should factor into their risk assessments the role and nature of any multisigs for software upgrades and the possibility that those could be maliciously compromised,” Gogel added.
‘Threat model’
For some founders, the Drift exploit underscores a more uncomfortable conclusion: that trust itself has become a vulnerability.
“The Drift exploit wasn’t a code vulnerability. It was a six-month intelligence operation that exploited trust between humans,” said Lucas Bruder, CEO of Jito Labs.
In practice, that means designing systems that assume compromise — not just bugs.
“Smart contract audits are table stakes. The real attack surface is your team, your multisig signers, and every device they touch.”
That mindset is becoming central to how DeFi approaches security. Schwed of SVRN says it starts with asking not just how a protocol works, but how it could fail.
“Start with a threat model. Ask yourself, how can I be exploited? If one of the project owners becomes compromised, what’s the blast radius of that scenario?”
In that sense, the Drift exploit may be remembered less for the funds lost than for what it revealed — that the biggest risks in DeFi may no longer live in the code, but in the people who run it.

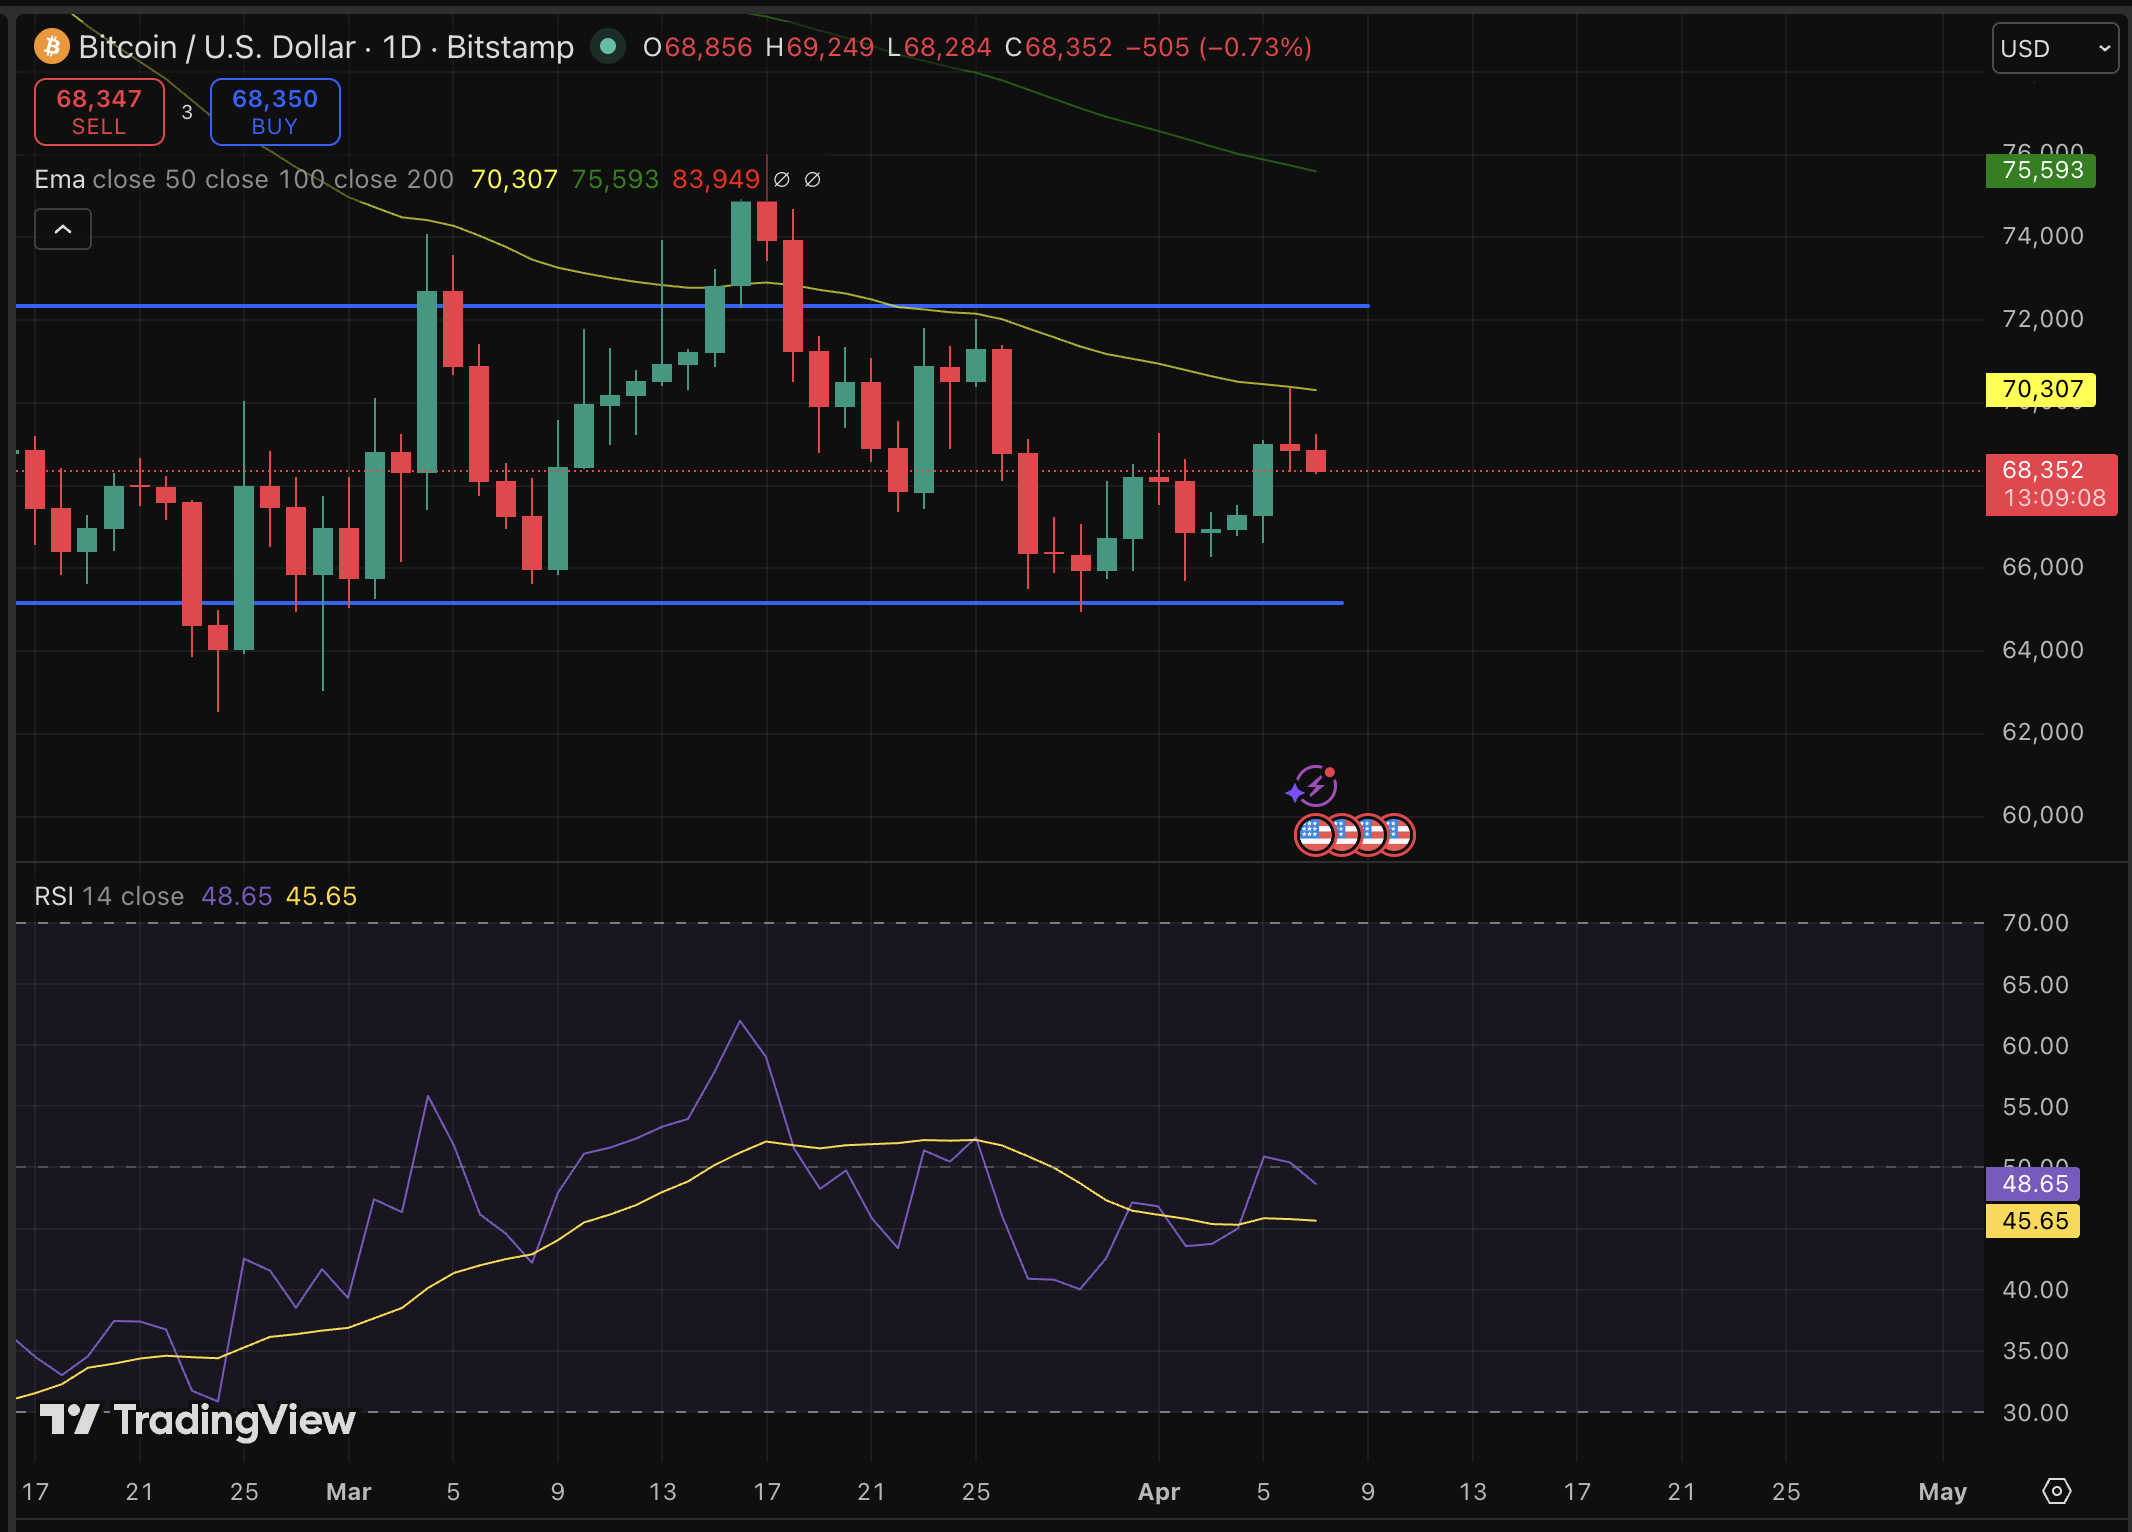
Bitcoin price is doing something it hasn’t done in months by moving on its own terms, breaking the recent bearish prediction. Trading near $68,500 and dropping by 2% today, BTC is quietly separating from the tech equity complex that dragged it lower through most of early 2026.
The catalyst isn’t a halving narrative or ETF inflow. It’s war, and the AI valuation crisis that is hitting software stocks. The full implications for price haven’t been priced in yet.
Since the outbreak of the U.S.-Iran conflict on Feb. 28, Bitcoin’s correlation with the iShares Expanded Tech-Software Sector ETF (IGV) collapsed from near-perfect alignment at close to 1.0 to just 0.13, a level signaling near-total decoupling, before partially recovering to around 0.7.
WOW all eyes on $IGV capitulating now – almost a 1-1 correlation to Bitcoin, does this mean the BTC bottom is in? tick tock, tick tock — Satoshi Flipper (@SatoshiFlipper) February 27, 2026

 https://t.co/BOzHMkMne3
Over that same period, Bitcoin has risen more than 5% while IGV has dropped more than 2%. The gap is widening. Investors appear to be rotating out of software equities, where AI-driven margin compression is hammering SaaS multiples, and treating Bitcoin as a macro hedge instead, a role gold has occupied for decades. Geopolitical shock has a way of accelerating these thesis shifts.
The 1 year chart still shows both assets deeply underwater, Bitcoin down 10%, IGV off 15%, but the divergence since late February suggests the relationship is fundamentally changing.
Discover: The best crypto to diversify your portfolio with
Bitcoin Price Prediction: Reclaim $75K as the Tech Decoupling Deepens?
At current levels, Bitcoin is trading roughly 30% below its October all-time high after a peak-to-trough decline of approximately 50%. IGV peaked slightly earlier and fell about 35% from its own top, a shallower drawdown, but one now accelerating as AI disruption fears mount across enterprise software. The divergence in recovery trajectories is stark.
The key technical level to watch is the $67,000 range. The level has flipped from resistance to support following this week’s move. A hold above that level keeps the bull case intact. The next meaningful resistance cluster sits near $74,000–$75,000, where prior consolidation and moving average confluence converge.
For the bulls, geopolitical tension that sustains macro-hedge demand will keep IGV’s correlation suppressed near 0.3–0.5, and BTC breaks toward $75,000–$78,000 over the next 2–4 weeks.
But, correlation can drift back toward 0.7 as markets stabilize; BTC consolidates between $67,000 and $72,000 while macro catalysts remain ambiguous. A breakdown below $67,000, or a re-coupling with equities if risk-off sentiment deepens, reopens a path toward the $54,000 level flagged by more bearish technicals.
Year-to-date, Bitcoin remains down roughly 10%, matching IGV’s losses almost exactly. That symmetry is now breaking. Whether this week’s move is a structural shift or a head-fake is the only question that matters right now.
Discover: The best pre-launch token sales
Bitcoin Hyper Targets Early Mover Upside as Bitcoin Tests Key Levels
Bitcoin at $68,500 is recovering, but a spot BTC position from here still means waiting on macro catalysts, regulatory timelines, and a 30%-plus move just to return to all-time highs. Early-stage infrastructure in the Bitcoin ecosystem offers a different risk profile entirely.
Bitcoin Hyper ($HYPER) is positioning itself at the intersection of two converging trends: Bitcoin’s resurgence as a macro asset and the explosive demand for scalable smart contract infrastructure. The project claims to be the first Bitcoin Layer 2 integrating the Solana Virtual Machine (SVM), delivering sub-second finality and low-cost smart contract execution while anchoring security to Bitcoin’s base layer.
The presale has raised $32 million at a current price of $0.0136, with 36% APY staking rewards live for early participants. The Decentralized Canonical Bridge enables native BTC transfers into the ecosystem without custodial risk.
For traders who believe Bitcoin’s decoupling thesis has legs, research Bitcoin Hyper as a higher-beta way to express that conviction at the infrastructure layer.
The post Bitcoin Price Prediction: Decoupling From Tech Stocks, Reshaped by War and AI appeared first on Cryptonews.

The Solana Foundation announced a suite of security initiatives on Monday, just five days after decentralized finance (DeFi) platform Drift Protocol suffered a $270 million exploit carried out by a North Korean state-affiliated group following a six-month social engineering campaign.
The centerpiece is Stride, a structured evaluation program led by Asymmetric Research that will assess Solana DeFi protocols against eight security pillars and publish its findings publicly. The foundation also introduced the Solana Incident Response Network (SIRN), a membership-based group of security firms and researchers focused on real-time crisis response.
The initiatives address part of the problem exposed by Drift, but not the mechanics that actually caused the loss. Drift’s smart contracts were not compromised, and its code passed audits. The vulnerability was human: The attackers spent six months building relationships with Drift contributors and compromised their devices through a malicious code repository and a fake TestFlight app.
Under Stride, protocols with more than $10 million in total value locked (TVL) that pass the evaluation will receive ongoing operational security and active threat monitoring funded by Solana Foundation grants, with coverage calibrated to each protocol’s risk profile.
For protocols with more than $100 million in TVL, the foundation will also fund formal verification, a mathematical method that checks every possible execution path in a smart contract to guarantee correctness.
In addition to Asymmetric Research, founding members include OtterSec, Neodyme, Squads, and ZeroShadow. The network is available to all Solana protocols but prioritized by TVL.
Stride’s formal verification, however, would not have caught the North Korean attack, which used the compromised devices to obtain multisig approvals that were then locked into durable nonce transactions and executed weeks later.
Neither would 24/7 monitoring of onchain activity, because the transactions were valid by design and indistinguishable from legitimate administrative actions until they were used to drain the vaults. The attack exploited the gap between onchain correctness and offchain human trust, a gap no smart contract audit or monitoring tool is built to cover.
SIRN, however, could have helped with the response. ZachXBT, an onchain security expert, criticized stablecoin issuer Circle Internet (CRCL) for failing to freeze over $230 million of its stolen dollar-pegged USDC during a six-hour window after the attack began.
A dedicated incident response network with established relationships to bridge operators, exchanges and stablecoin issuers might have shortened the response time. Whether it would have been fast enough to prevent the Wormhole bridging and obfuscation through Tornado Cash is an open question.
The foundation was careful to note that the programs “do not transfer the underlying responsibility away from the protocols themselves,” a line that reads differently after Drift’s postmortem revealed that individual contributor devices were the entry point for a nation-state attack.
Solana already hosts several free security tools for builders, including Hypernative for threat detection, Range Security for real-time monitoring, and Neodyme’s Riverguard for attack simulation.
Cryptocurrency investment products recorded minor inflows last week despite mixed geopolitical signals and increasingly hawkish investor expectations.
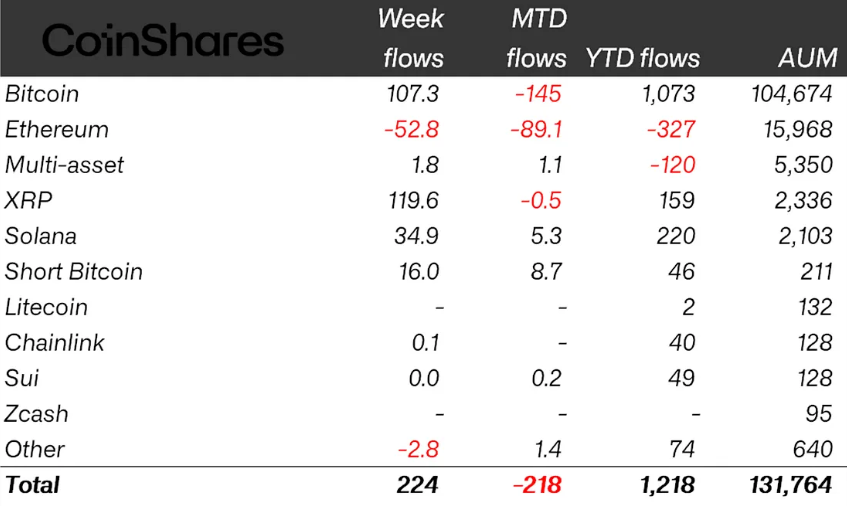
Global crypto exchange-traded products (ETPs) clocked $224 million in inflows last week, following a $414 million outflow a week before, CoinShares reported on Tuesday.
The fresh inflows brought total assets under management to about $131.8 billion, roughly in line with levels seen at the same time last year. Year-to-date inflows also totaled about $1.2 billion, compared with $960 million over the same period last year.
The inflows marked a brief rebound in sentiment before later-week macro data and policy expectations reversed momentum, CoinShares head of research James Butterfill said.
XRP leads inflows as Bitcoin trails closely
XRP (XRP) led inflows with about $120 million, contributing more than half of net weekly inflows.
The gains marked XRP’s largest weekly inflows since mid-December 2025, Butterfill noted, bringing its year-to-date inflows to $159 million.

Bitcoin (BTC) ETPs followed closely with $107 million of inflows, bringing year-to-date flows to slightly above $1 billion. Of those gains, only around $22 million was contributed by US spot Bitcoin exchange-traded funds (ETFs), which remain in negative territory year-to-date.
Solana (SOL) also saw minor inflows totaling around $35 million last week, with steady inflows this year representing 10% of total assets under management.
On the other hand, Ether (ETH) investment products continued to lag, posting $53 million in outflows. That followed $222 million in outflows the prior week, bringing year-to-date outflows to $327 million.
Related: CoinShares stock makes US debut on Nasdaq following SPAC merger
CoinShares’ Butterfill attributed the negative sentiment around Ether to developments tied to the CLARITY Act, a major piece of crypto legislation closely linked to stablecoins, which are largely issued on the Ethereum blockchain. Following months of delays, US Senate Banking Committee member Bill Hagerty said Monday that he expects a potential path for the bill in the coming weeks.
Geographically, Switzerland led last week’s inflows at roughly $157 million, followed by Germany and the US, which both recorded about $28 million each, and Canada with $11 million.


Meta Platforms is preparing to launch its first AI models developed under Alexandr Wang. The company plans to offer some versions of these models under an open-source license, according to a report by Axios.
Summary
- Meta Platforms is preparing to launch new AI models under Alexandr Wang, with some versions planned for open-source release.
- The rollout will be phased, with key components kept proprietary early on to manage safety risks and protect advanced capabilities.
- Meta is shifting toward a hybrid strategy, balancing developer access with tighter control over its most powerful models.
The rollout is expected to follow a staged approach. While some versions may be made publicly available, certain components will remain proprietary in the initial phase as the company assesses safety risks and safeguards more advanced capabilities.
Meta Platforms has been one of the few major U.S. tech firms to let developers modify its frontier models, but rising competition in artificial intelligence has led to growing expectations that it may reduce that level of openness.
Meta argues that its strength lies in its consumer reach. By integrating AI tools across platforms such as WhatsApp, Facebook, and Instagram, the company can deliver its technology to billions of users globally, often without direct cost, a scale that remains difficult for rivals to replicate.
The upcoming models are also part of an effort to close the gap with competitors. Meta’s earlier Llama 4 family lagged on several benchmarks, raising expectations for the next generation. According to Axios, the company does not expect to outperform rivals across every metric but believes it can differentiate in areas that resonate with everyday users.
Wang’s influence is increasingly visible in this direction. He has argued that Meta can help “democratize access” to advanced AI by offering tools that are widely available to developers and consumers. In contrast, competitors such as OpenAI and Anthropic are seen as focusing more on enterprise and government deployments with limited open access.
Meta’s strategy is starting to come into focus as a hybrid approach. The company is looking to stay open enough to draw in developers, while keeping its most advanced systems closed to protect its competitive position.
The approach aligns with a wider industry shift. Even firms that once promoted open access are becoming more selective about releasing their most advanced models.
At the same time, tensions around openness have picked up. Elon Musk has criticized Sam Altman and OpenAI, arguing that the company has moved away from freely accessible models.
Meanwhile, Alibaba has chosen to keep its latest Qwen models proprietary after reversing its earlier open-source stance.
The developments come as debate intensifies within the AI community over the capabilities of current systems. Some researchers argue that models built on large-scale pattern recognition still fall short of genuine reasoning or human-like understanding.
Meta is also exploring alternative approaches alongside its core model development. One of those efforts is its “Brain Decoding” project, first previewed in 2023. The initiative focuses on understanding and simulating neural activity. It points to attempts to move beyond systems that mainly generate outputs from learned data patterns.

Key Highlights
- Technology sector valuations have dipped beneath the broader market’s levels for the first time in multiple decades, according to Goldman Sachs analysts
- The sector has experienced underperformance relative to the overall market at levels unseen since the beginning of the 1970s
- The price-to-earnings-growth (PEG) ratio for tech has declined below sectors including Consumer Discretionary, Consumer Staples, and Industrials
- Despite the selloff, tech sector earnings continue showing strength, with projections of 44% EPS expansion in Q1 2026
- Major tech firms currently command approximately 20x forward P/E multiples, representing less than 40% of dot-com era valuations
Analysts at Goldman Sachs have identified the technology sector as attractively priced following one of its most significant periods of underperformance spanning five decades. The investment bank characterizes the recent decline as presenting a compelling entry point for market participants.
The technology sector reached peak valuations in October of last year, propelled by accelerating revenue expansion and robust profitability metrics. Subsequently, shares have experienced substantial declines amid investor concerns regarding the enormous capital commitments being directed toward artificial intelligence infrastructure.
Major cloud computing providers have pledged upwards of $700 billion toward constructing data center facilities. Market participants are scrutinizing whether anticipated returns can substantiate such extraordinary capital deployment.
The technology sector’s recent underperformance versus the broader equity market has reached magnitudes not witnessed since the early part of the 1970s. Analysts at Goldman, headed by Peter Oppenheimer, argue this performance divergence has generated a compelling valuation entry point.
The price-to-earnings-growth metric for the global information technology sector has descended below that of the wider market. Additionally, the sector’s forward price-to-earnings multiple now registers beneath Consumer Discretionary, Consumer Staples, and Industrial sectors.
Goldman’s analysis draws parallels between the present valuation compression and the bottom observed following the collapse of the dot-com bubble during the 2003-2005 timeframe. However, the firm emphasizes this comparison does not signal an impending repeat of that market crash.
Why Goldman Rejects Bubble Comparisons
Today’s dominant technology companies — encompassing Nvidia, Apple, Alphabet, Microsoft, and Amazon — currently command a collective two-year forward price-to-earnings multiple of approximately 20x. During the zenith of the dot-com bubble in 2000, leading technology stocks commanded valuations near 52x forward earnings.
This valuation disparity forms the foundation of Goldman’s investment thesis. The firm contends present-day multiples do not exhibit the speculative characteristics that fueled the bubble exceeding twenty years ago.
Fundamental earnings performance has demonstrated resilience throughout the market correction. Analysts project the information technology sector will deliver earnings per share growth of 44% during the first quarter of 2026.
This growth figure represents 87% of aggregate S&P 500 earnings expansion during the same timeframe. Goldman’s research suggests AI infrastructure investment independently will account for approximately 40% of S&P 500 earnings growth throughout this year.
Understanding the Shift Away From Technology
Capital has migrated toward what Goldman characterizes as “old economy” equities. A Goldman-constructed basket of capital-intensive securities, encompassing utilities and industrial manufacturing firms, has appreciated 11% on a year-to-date basis.
These traditional sectors have experienced multiple expansion as market participants anticipate increased infrastructure expenditure to facilitate energy production and data center construction. This sector rotation has redirected capital flows away from technology holdings.
Goldman further observes that technology sector cash flow generation exhibits lower sensitivity to macroeconomic growth dynamics. The bank contends this characteristic positions the sector more defensively should ongoing Middle Eastern geopolitical tensions continue pressuring international markets.
The S&P 500 has also demonstrated relative weakness compared to other primary global equity indices since early 2025, reversing a persistent trend established following the financial crisis.
Oppenheimer from Goldman noted that return on equity metrics within the technology sector have maintained elevated levels, while earnings revision trends have sustained positive momentum throughout the downturn.

Crypto World
Senate Has 3 Weeks to Pass the CLARITY Act: Most Important Month in Ripple XRP History?
Ripple XRP is trading at $1.34 on April 7 – up 2.2% on ceasefire-driven risk-on flows, but the price level that matters most in April won’t be set by macro sentiment: it will be set by the Senate Banking Committee.
The CLARITY Act, which would codify XRP’s classification as a digital commodity under CFTC jurisdiction and strip the SEC of primary oversight authority, is targeting a committee markup in the second half of April.
Senator Bernie Moreno has stated publicly that if the bill doesn’t reach the full Senate floor by May, midterm election dynamics push it off the calendar for the rest of 2026. That makes the next three weeks the most consequential legislative window XRP has faced this year.
- Price level: XRP is trading at $1.34 as of April 6, down 63% from its July 2025 peak of $3.65, with Q1 2026 marking its worst quarter in eight years.
- Legislative clock: Senate Banking Committee markup is targeted for late April; Senator Moreno has warned that failure to advance by May effectively kills the bill for 2026.
- Bull case trigger: Banking Committee approval unlocks a projected $4–$8 billion in XRP ETF inflows per Standard Chartered’s Geoffrey Kendrick, with a price target above $1.60.
- Bear case floor: A stall past May combined with Bitcoin breaking below $60,000 puts XRP at risk of sliding toward $0.82, per 24/7 Wall St. analysis.
- Passage odds: Kalshi had 2026 passage odds at ~69% as of March 20; Polymarket currently sits at 63–66%, reflecting residual uncertainty around DeFi provisions and scheduling.
Discover: The best crypto to diversify your portfolio with
What the CLARITY Act Actually Does – and Why April Is the Only Window
The CLARITY Act (H.R. 3633) passed the House with a bipartisan 294–134 vote on July 17, 2025, assigning primary digital commodity oversight to the CFTC while limiting SEC jurisdiction over assets that qualify under the new framework.
The Senate Agriculture Committee advanced its version on January 29, 2026, but the Banking Committee – chaired by Tim Scott – has yet to markup, with unresolved disputes around DeFi regulatory provisions and tokenization treatment holding up the calendar.
The Senate returns from Easter recess on April 13, and Scott’s committee has a targeted markup window in the final two weeks of April.
The stablecoin yield dispute that stalled earlier negotiations appears to be resolving: Senators Tillis and Alsobrooks reached a compromise in principle on March 20 that bans passive yield on stablecoin balances but permits activity-based rewards tied to payments and platform use.
Senator Cynthia Lummis confirmed at the Chamber of Digital Commerce Blockchain Summit that DeFi provisions are finalized, projecting committee markup in late April followed by a mid-2026 floor vote.
The honest read on the scheduling math: Galaxy Research’s Alex Thorn has flagged that with only 18 working weeks remaining before the midterm recess on October 5, each week of delay compresses floor consideration time to the point where 2026 passage becomes structurally implausible without Banking Committee clearance by April’s end.
The SEC and CFTC jointly classified XRP as a digital commodity on March 17 – but that classification is an interpretive release, not statute.
A future administration could reverse it. Banks and large asset managers won’t commit capital at scale on the basis of an administrative determination alone. The CLARITY Act would make the commodity classification permanent federal law, and that distinction is the entire mechanism behind the bull case.
Discover: The best pre-launch token sales
Ripple XRP Might Hit $1.60-Plus If Clarity Clears
This whole Ripple XRP setup is basically riding on one thing, the CLARITY Act, because if it gets through the Banking Committee in late April, that is the switch that brings real institutional money off the sidelines, not just talk but actual flows, and that is where projections like $4–$8 billion in ETF inflows start to matter, especially when we have already seen strong demand even without full legal clarity, which is how you get price pushing through $1.60 and aiming higher.
The key detail most people miss is that this is not just hype around regulation, it is about certainty, because right now institutions can look at Ripple XRP but cannot fully commit, and that is why even something like the SEC CFTC classification did not move things structurally, it helps sentiment but does not unlock capital, while a law like CLARITY changes the rules completely and makes deployment easier.
If that approval gets delayed past May, the whole story weakens fast, because without it XRP just falls back into tracking Bitcoin, and with BTC already moving sideways, that means no strong independent move, and if macro pressure hits again, downside opens quickly.
The timeline shift from Ripple itself is also telling, with expectations already getting pushed back, which is usually a sign things are not as smooth behind the scenes as they look publicly.
So right now everything narrows down to that late April window, because if the committee moves, momentum hits fast, but if it stalls, this turns from a catalyst driven breakout setup into just another range with fading hype.
Research Best Wallet and join the presale before the next price tier.
The post Senate Has 3 Weeks to Pass the CLARITY Act: Most Important Month in Ripple XRP History? appeared first on Cryptonews.
When you search for:
“best AI crypto trading bot for beginners 2026”
“is automated crypto trading safe”
you’re already at a critical decision point:
Should you keep learning crypto trading on your own, or let an AI-powered system handle it for you?
In 2026, this question has become more relevant than ever. As the crypto market grows more complex and more beginners enter the space, a rising number of investors are turning to AI crypto trading bots to simplify the process and explore automated crypto trading as a more efficient way to participate.
Among the many platforms available, AriseAlpha has been gaining increasing attention—especially in searches related to:
-
AI crypto trading bot for beginners
-
hands-free crypto trading platform
-
passive income crypto strategies
But the real question is:
Is AriseAlpha truly beginner-friendly?
Or is it just another platform that looks simple on the surface?
In this review, we’ll break it down from a real user perspective, analyzing its workflow, system design, and usability to help you decide whether it’s worth trying.
What Makes AriseAlpha Different from Other AI Crypto Trading Bots?
Most platforms labeled as “AI trading bots” still require users to:
-
Configure strategies
-
Adjust parameters
-
Understand trading logic
AriseAlpha takes a different approach.
Instead of giving you tools, it gives you a ready-to-run system.
Key concept:
You don’t manage trades — you select a system that trades for you.
This is why it’s increasingly associated with searches like:
How AriseAlpha Works (Beginner Workflow Explained)
1. Quick Account Setup
The onboarding process is streamlined and doesn’t overwhelm new users with technical steps.
This removes the biggest barrier: getting started.
Click Register to claim your free $12 real reward right away!
2. Strategy Selection Instead of Strategy Building
Instead of charts and indicators, users see:
-
Pre-built AI trading strategies
-
Risk levels (conservative / balanced / aggressive)
-
Expected behavior explanations
This aligns perfectly with beginner intent:
choose, not analyze
3. Fully Automated Execution
Once activated, the system handles:
-
Market analysis
-
Trade execution
-
Strategy adjustments
No manual intervention required.
This is what defines a true hands-free crypto trading experience.
Performance Logic: How Does It Generate Returns?
AriseAlpha’s AI operates on three core layers:
-
Data-driven signal detection
-
Automated trade execution
-
Built-in risk management controls
Compared to manual trading:
|
Factor |
Manual Trading |
AI Trading |
|
Emotional bias |
High |
None |
|
Trading hours |
Limited |
24/7 |
|
Execution speed |
Slower |
Faster |
This explains the growing demand for:
“passive income crypto strategies” and “AI crypto bot automation”
Who Should Use AriseAlpha?
✔ Best Fit
-
First-time crypto investors
-
Users looking for passive income
-
People with limited time or trading knowledge
✖ Not Ideal For
Realistic Expectations
Let’s address the most searched concern:
“Do AI crypto trading bots actually work?”
The honest answer:
✔ They improve execution efficiency
✔ They remove emotional decision-making
✔ They automate trading processes
⚠ But they do NOT:
The value lies in process optimization, not certainty of returns
Why AriseAlpha Is Gaining Popularity in 2026
Three key trends are driving adoption:
-
Beginner demand for simplified investing
-
Rising interest in passive crypto income
-
Shift from manual trading to automation
Trending search keywords include:
-
AI crypto trading bot 2026
-
automated crypto investing platform
-
crypto passive income for beginners
AriseAlpha sits right at the intersection of these trends.
Conversion Insight: Why Many Beginners Actually Try It
From a behavioral perspective, most users are not looking for perfection—they are looking for:
-
A low-risk starting point
-
A simple onboarding experience
-
A way to test crypto trading without complexity
This is where AriseAlpha stands out.
The availability of a $12 free reward lowers the entry barrier significantly, allowing users to explore the platform before committing real funds.
FAQ
Q1: Is AriseAlpha legit for beginners in 2026?
✅ Yes, it is designed specifically for beginners with a fully automated trading system.
Q2: Can I earn passive income with AriseAlpha?
✅ Potentially yes, but results depend on market conditions and strategy performance.
Q3: Do I need trading experience?
✅ No, the platform is built for users with zero experience.
Q4: Is it really hands-free?
✅ Yes, once activated, the AI handles all trading operations automatically.
Final Verdict: Is AriseAlpha Worth Trying?
AriseAlpha may not be the most complex or customizable trading platform in the market—but that’s exactly its strength.
For users searching:
-
best AI crypto trading bot for beginners 2026
-
hands-free crypto trading platform
-
how to start crypto investing without experience
it offers something more practical:
A simple, low-barrier way to start
Rather than positioning itself as a “professional trading tool,” AriseAlpha functions as an entry point into automated crypto investing—especially for those who prefer simplicity over complexity.
If your goal is to explore crypto investing without spending weeks learning trading strategies, starting with a hands-free AI system like AriseAlpha could be a more efficient first step.
Disclaimer: This is a Press Release provided by a third party who is responsible for the content. Please conduct your own research before taking any action based on the content.

Strategy (MSTR), the world’s largest publicly traded holder of bitcoin, announced on Monday that it purchased 4,871 BTC for $330 million, marking one of its largest acquisitions of 2026.
Yet a recurring question remains, why do these sizable purchases fail to move the market? In fact, bitcoin’s price often declines around the time these announcements are made.
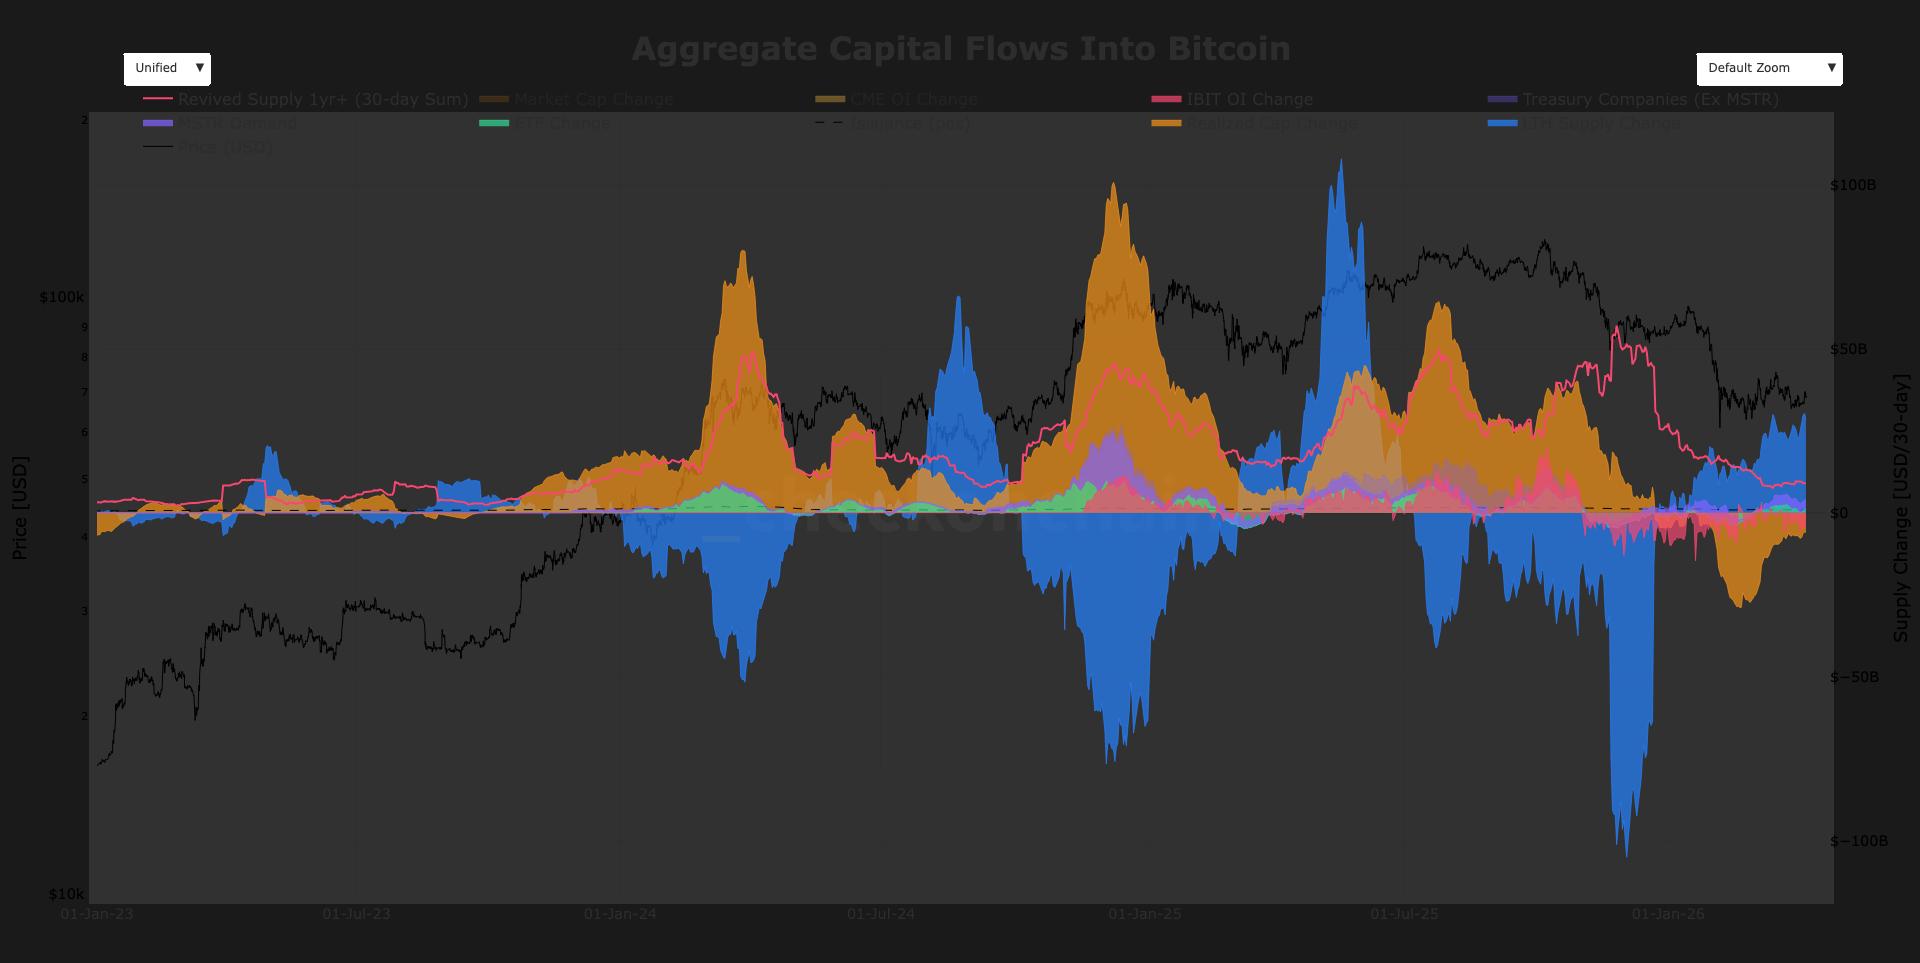
The answer lies in understanding market flows. MSTR demand currently accounts for roughly 7% of total gross inflows, rising to about 9% of net flows, according to checkonchain data. Gross flows reflect only positive demand entering the market, while net flows account for both buying and selling, giving a clearer picture of overall pressure. While Strategy remains a consistent buyer, its impact is relatively small compared to broader market forces.
Historically, its influence was larger. MSTR demand peaked above $15 billion in November 2024, coinciding with its all-time high stock price high and bitcoin over $100,000. Since then, activity has normalized to a range of $1 billion to $4 billion, with current demand around $2.8 billion over the past 30 days.
The dominant force is long-term holders (LTHs), coins held for more than 155 days, which are driving roughly $28.5 billion in supply change. A key subsection is revived 1+ year supply — older coins moving on chain over the past 30 days — which represents roughly $9 billion in change.
Elsewhere, U.S. spot exchange-traded funds (ETFs) have added roughly $1 billion of inflows over the past 30 days, while miner issuance, at 450 BTC per day, contributes around $880 million of monthly supply pressure.
More importantly, capital continues to leave. Bitcoin’s realized cap saw a $29 billion drawdown since February over a 30-day window, while BlackRock’s IBIT open interest is down over $4 billion. Together, these outflows dwarf MSTR’s demand.
Strategy may be buying aggressively, but it is being overwhelmed by larger forces distributing supply and capital being pulled out of the system.


Polygon crypto activated its Giugliano hardfork on mainnet at block 85,268,500 on April 8, delivering a 2-second reduction in transaction finality through a mechanism that lets block producers announce blocks earlier in the confirmation pipeline. The Polygon crypto Foundation confirmed the upgrade went live at approximately 2:00 p.m. UTC – on schedule and without reported disruption.
That 2-second cut isn’t cosmetic. For payment applications and real-world asset platforms running on Polygon PoS, faster finality directly compresses settlement risk and reduces the confirmation latency that separates blockchain UX from traditional financial infrastructure.
- What It Is: The Giugliano hardfork (PIP-83) is a Polygon PoS mainnet upgrade activating at block 85,268,500, targeting faster transaction finality and updated fee infrastructure.
- The Technical Change: Block producers can now announce blocks earlier in the cycle, cutting finality by 2 seconds – validated on the Amoy testnet before mainnet deployment.
- Fee Infrastructure: Fee parameters are now embedded directly in block headers, with new RPC endpoints for fee data – a structural change for wallets and developer tooling.
- Node Requirement: All node operators must run Bor v2.7.0 or Erigon v3.5.0 or higher; nodes on earlier versions will fall out of consensus at the activation block.
- What to Watch: Real-world finality metrics post-activation will determine whether the 2-second testnet gain holds at mainnet scale – and whether Polygon closes the UX gap with faster L2 competitors.
Discover: The Best Crypto to Get Right Now
What Giugliano Actually Changes for Polygon Crypto – and Why the Finality Mechanism Matters
The core change in Giugliano is architectural: block producers on Polygon PoS can now signal block availability earlier in the slot cycle, reducing the time validators must wait before treating a block as confirmed. On the Amoy testnet, that translated to a 2-second finality improvement – a measurable delta, not a rounding error, when the baseline confirmation window is already measured in seconds.
The upgrade also embeds fee parameters directly into block headers and introduces new RPC support for fee data.
That distinction matters for developers: wallets and dApps can now query fee conditions from block data directly rather than reconstructing them through separate API calls, which simplifies gas estimation logic and reduces the surface area for fee-related errors at the application layer.
Giugliano isn’t a throughput upgrade – it’s a latency and infrastructure upgrade. The Gigagas roadmap targeting 100,000 TPS remains a separate and longer-horizon effort. What Giugliano delivers is a tighter confirmation loop and cleaner fee data pipelines – foundational plumbing that the Gigagas scaling work will depend on.
The upgrade also carries specific backstory. Giugliano formally reintroduces PIP-66, a set of changes that were bundled into the earlier Bhilai hardfork (PIP-63) but rolled back after triggering unspecified network behavioral issues in deployment.
The Amoy testnet run on March 23 at block 35,573,500 served as the final validation gate before mainnet, and the clean activation on Wednesday suggests those earlier issues have been resolved.
Benchmarked against the broader L2 landscape, the gap Giugliano closes is real but context-dependent. Optimistic rollups like Arbitrum and Optimism carry 7-day challenge windows that dwarf any PoS finality metric. ZK-based rollups achieve near-instant cryptographic finality but at higher proving costs.
Polygon PoS sits in a different architectural category – a sidechain with its own validator set – and Giugliano tightens its native finality without altering those fundamental tradeoffs.
Explore: The Best Pre-Launch Token Sales With Asymmetric Upside Potential
The post Polygon Crypto Activates Giugliano Hardfork to Improve Transaction Finality appeared first on Cryptonews.
Joy-Anna Duggar’s Husband Sent Joseph a Letter of Support

Mad Money 04/06/26 | Audio Only

Wuthering Heights Director Emerald Fenell Tipped To Direct Basic Instinct Reboot


-

 NewsBeat5 days ago
Steven Gerrard disagrees with Gary Neville over ‘shock’ Chelsea and Arsenal claim | Football
-

 Business5 days ago
No Jackpot Winner and $194 Million Prize Rolls Over
-

 Fashion4 days ago
Weekend Open Thread: Spanx – Corporette.com
-

 Crypto World6 days ago
Gold Price Prediction: Worst Month in 17 Years fo Save Haven Rock
-

 Business2 days ago
Three Gulf funds agree to back Paramount’s $81 billion takeover of Warner, WSJ reports
-

 Sports3 days ago
India men’s 4x400m and mixed 4x100m relay teams register big progress | Other Sports News
-

 Business3 days ago
Expert Picks for Every Need
-

 Business5 days ago
Login and Checkout Issues Spark Merchant Frustration
-

 Sports7 days ago
Tallest college basketball player ever, standing at 7-foot-9, entering transfer portal
-

 Crypto World7 days ago
Bitcoin enters the public bond market as Moody’s gives a first-of-its-kind crypto deal a rating
-
Crypto World6 days ago
Bitcoin stalls below key resistance as technical signals skew bearish
-

 Tech5 days ago
Commonwealth Fusion Systems leans on magnets for near-term revenue
-

 Politics6 days ago
Starmer’s centre has collapsed, and the left was right all along
-
Business2 days ago
No Jackpot Winner, Prize to Climb to $231 Million
-

 Fashion7 days ago
Tuesday’s Workwear Report: Tavira Sculpt Stretch Crepe Trousers
-
Crypto World7 days ago
AI Memory Rout Wipes 9% Off Nvidia Stock: Chart Says More Pain Ahead
-

 Crypto World6 days ago
Why It’s Partnering, Not Issuing
-

 Crypto World6 days ago
Ripple rolls out enterprise crypto treasury platform for corporates
-

 Fashion1 day ago
Massimo Dutti Offers Inspiration for Your Summer Mood Board
-
Tech7 days ago
AirPods Max 2 review: Familiar features & design, but needs more
You must be logged in to post a comment Login