

Crypto World
U.S. regulator says 24/7 trading is great for crypto, may not be fit for other sectors

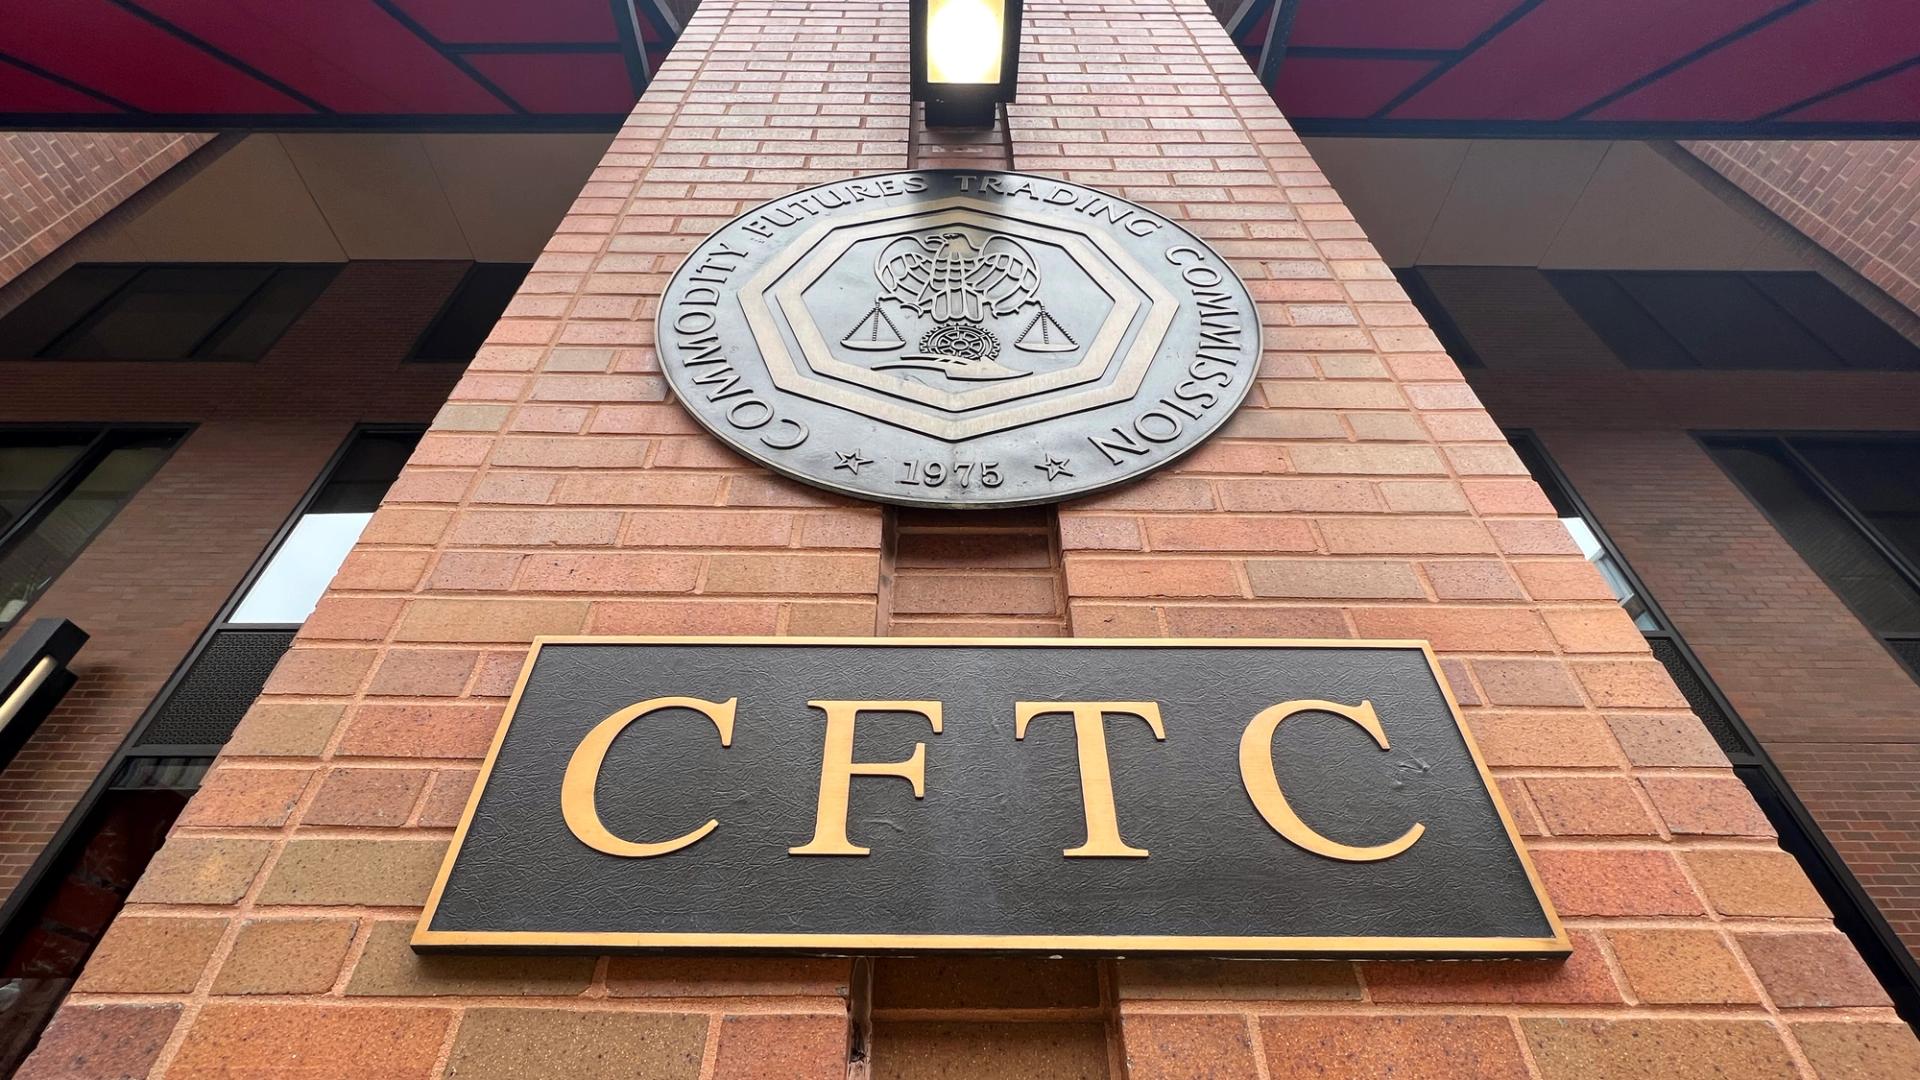
As global trading trends race toward 24-hour, no-days-off markets, the U.S. Commodity Futures Trading Commission argued that it may be fine for the new blockchain-native players, but that expanded hours might not be appropriate for some of the traditional markets, the derivatives watchdog said in a Friday letter issued to the wide waterfront of firms it regulates.
The advisory — coming on the same day that the agency gave a consequential green light to native crypto platforms offering perpetual futures contracts — marks what may be a growing divide between the traditional firms and the new entrants.
“Because of inherent differences between underlying markets, switching to 24/7 trading and clearing may not currently be suitable for all asset classes,” the agency wrote to its regulated exchanges and clearing operations.
“The ability to engage in, and maintain, markets on a 24/7 basis has been, in part, paralleled by evolutions in market technologies, such as blockchain networks and decentralized infrastructure, alternate forms of collateral, including stablecoins and crypto assets, and market accessibility through smartphones and associated software applications,” the CFTC noted. “With this evolution, an increasing number of platforms, with a growing list of tradeable products, are providing 24/7 access to retail and institutional participants.”However, it said, “other derivatives markets, such as in agricultural products, may be less
suited for 24/7 trading due to their unique customer bases, regional nature, and the specialized
trading and hedging practices in those markets.”
The derivatives watchdog’s primary concern is the potential for market abuse in less-observed, off-peak activity, contending that “extending trading hours to a 24/7 schedule for certain markets or products could potentially result in reduced liquidity, increased volatility, widened bid/ask spreads, and, as a result, create greater opportunities for market manipulation.”
The platforms are responsible for policing themselves as the first line of defense and “should implement additional compliance measures designed to address the unique challenges associated with expanded trading hours.”
The advisory was meant to lay out the considerations for firms looking to expand trading hours, and the CFTC urged them to communicate their plans to the agency.
The current chief of the agency, Chairman Mike Selig, has made it one of his leading priorities to embrace new technologies including crypto and prediction markets. His enthusiasm for the advances — tracking the orders and encouragement from President Donald Trump — has led to a surge in crypto policy work meant to clear a regulatory path for the industry.
One of the crypto-native firms supervised by the CFTC, Coinbase, said in a blog post on its website on Friday that it’s trying to rebuild traditional financial services atop crypto infrastructure.
“Equities, futures, and prediction markets all operate 24/7 on our platform,” the company said, noting the agency’s new allowance of global options and perps through one of its CFTC-regulated affiliates. “Today’s announcement adds the largest and most liquid category of global crypto trading to that lineup.”

TLDR:
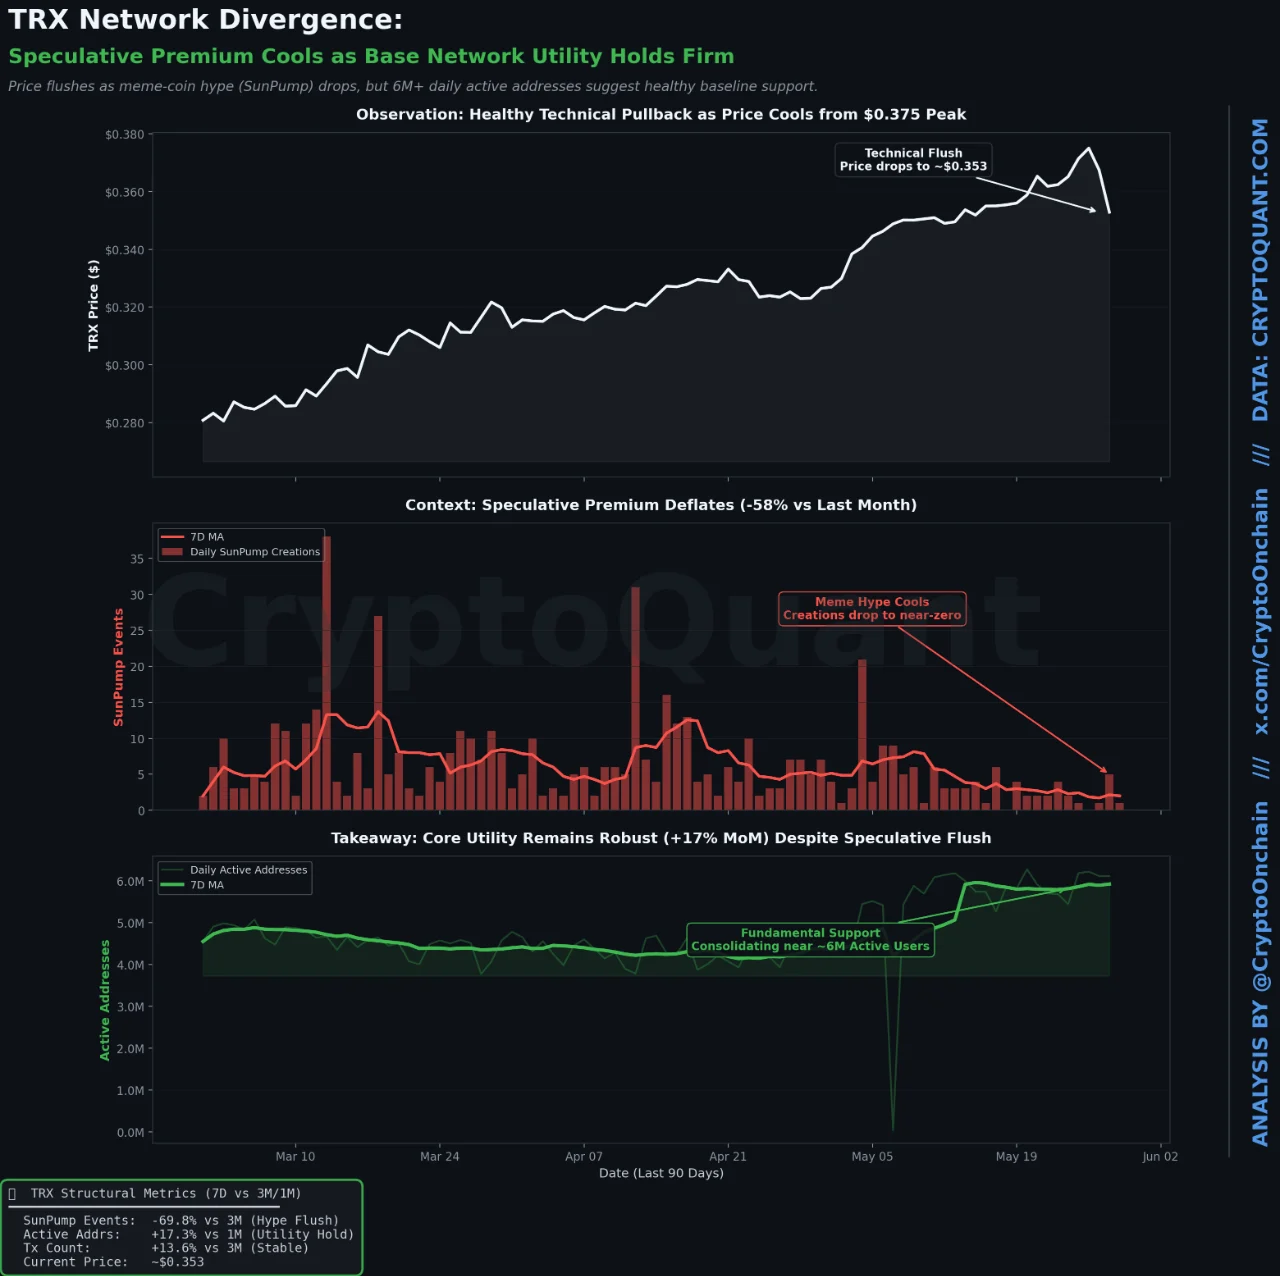
- TRX price dropped from $0.375 to $0.346, resetting the daily RSI from above 74 down to nearly 43.
- SunPump Token Create Events collapsed nearly 70% vs. its three-month baseline, signaling fading meme-coin hype.
- TRON active addresses rose 17% month-over-month, holding a strong daily average of roughly 6 million users.
- Tron Inc. bought 141,433 TRX at $0.3535, pushing total treasury holdings past 698 million TRX tokens.
TRX, the native token of the TRON blockchain, has retreated sharply over the past 48 hours. The price has slid from a local high near $0.375 to around $0.346.
Alongside this drop, the RSI on the daily chart has reset from overbought levels above 74 to approximately 43.
On-chain data, however, tells a more nuanced story — one where base utility continues to hold even as speculative activity cools.
SunPump Activity Collapses as Meme-Coin Hype Retreats
The most telling signal behind this TRX correction is the steep decline in meme-coin creation on the TRON ecosystem.
SunPump Token Create Event Count has fallen by 58% compared to last month. Against its three-month baseline, the drop is even steeper — nearly 70%, with near-zero events recorded in recent days.
This kind of speculative pullback is not unusual following a sharp price run-up. Markets often attract short-term participants drawn by momentum rather than fundamentals. When that momentum fades, token creation activity tends to dry up alongside it.
Source: Cryptoquant
What makes this particular data point relevant is that SunPump activity had been one of the visible drivers of elevated TRX sentiment. As that layer of hype deflates, the price naturally adjusts to reflect a lower speculative premium on the asset.
The sharp decline in meme-coin events does not mean the TRON network is losing users or transaction volume. It simply removes a layer of froth that had been priced into TRX during the run-up phase.
Active Addresses and Transaction Volume Remain on Solid Ground
Despite the retreat in speculative metrics, TRON’s core usage data has held firm. Active addresses have actually grown by 17% over the past month. The network continues to process a strong daily average of roughly 6 million active addresses.
Total daily transaction counts are also stable, maintaining more than 12 million transactions per day. This level of consistent on-chain activity points to a network that is still in active use beyond the meme-coin cycle.
Adding another layer to the picture, Tron Inc. (NASDAQ: TRON) disclosed a fresh treasury purchase. The company acquired 141,433 TRX tokens at an average price of $0.3535, bringing its total TRX treasury holdings to over 698 million TRX. The move reflects ongoing institutional conviction in the token even through the price correction.
This structural divergence — collapsing speculative activity alongside stable core usage — sets up a potential reset toward sustainable pricing.
Traders are now watching whether the $0.34 zone can establish itself as a fundamental support level rather than a temporary liquidity flush.

Crypto World
ICE Chief Sprecher Calls Hyperliquid 'Bigger Than Nasdaq' as HYPE Run Draws TradFi Notice


Jeff Sprecher, founder and chief executive of Intercontinental Exchange, the roughly $90 billion exchange giant that owns the New York Stock Exchange, called decentralized exchange Hyperliquid "bigger than Nasdaq" at an investor conference this week, a rare endorsement of a crypto-native venue from… Read the full story at The Defiant


- Bitcoin held near $73,000 but risks crashing lower as risks linger.
- Spot Bitcoin ETFs saw net outflows of $229 million for a nine-day negative streak.
- On-chain metrics show whale balances flat for months, signaling reduced accumulation.
Bitcoin traded near $73,200 on Thursday after failing to sustain a rebound amid broader cryptocurrency selling.
While BTC struggled, US stock futures edged slightly higher following reports of a potential US-Iran agreement to reopen the Strait of Hormuz, easing some geopolitical risk and supporting broader risk assets outside the crypto market.
Bitcoin’s ETF outflows extend negative streak
Spot Bitcoin exchange-traded funds continued to see withdrawals, extending a record nine-day streak of net outflows.
US spot Bitcoin ETFs recorded net redemptions of $229 million on May 28, bringing weekly net outflows to roughly $1.3 billion.
According to SoSoValue data, this would mark the third consecutive week of capital leaving BTC investment products.
Notably, the sustained outflows have coincided with price pressure on Bitcoin, undermining short-term liquidity and market sentiment.
On-chain analytics add further nuance to the picture. CryptoQuant data indicates that major Bitcoin holders have halted accumulation.
Dolphin balances, representing mid-sized holders, have printed successive lower highs since September 2025, while whale balances have remained largely flat since February 2026.
Historically, when both cohorts simultaneously pause or reduce accumulation, the market often experiences prolonged weakness as demand at higher price levels fades.
What next for Bitcoin price?
Analysts continue pointing to a mix of technical, options-market, and on-chain signals to assess Bitcoin’s near-term direction.
Glassnode observed that Bitcoin recently retested the $75,000 “strike,” a high gamma zone where options positioning can amplify price moves. This contributed to the pullback below $73,000, with BTC briefly falling near $72,500.
According to Greeks.live, the selloff occurred ahead of a major options expiry.
May 29 Options Expiration Data
84,000 BTC options expired, with a put-call ratio of 0.88, a maxpain point of $75,000, and a notional value of $6.2 billion.
639,000 ETH options expired, with a put-call ratio of 0.81, a maxpain point of $2,200, and a notional value of $1.28… pic.twitter.com/NNnFMy3tgx— Greeks.live (@GreeksLive) May 29, 2026
Analysts continue pointing to a mix of technical, options-market, and on-chain signals to assess Bitcoin’s near-term direction.
Glassnode observed that Bitcoin recently retested the $75,000 “strike,” a high gamma zone where options positioning can amplify price moves. This contributed to the pullback below $73,000, with BTC briefly falling near $72,500.
According to Greeks.live, the selloff occurred ahead of a major options expiry.
The on-chain analytics provider noted that the decline failed to fully extend after at-the-money implied volatility (ATM IV) briefly spiked during the drop, while longer-dated implied volatilities eased. This suggests many market participants still view the move as contained rather than the beginning of a broader structural trend reversal.
Despite this, risks remain asymmetric. Options markets continue implying the potential for larger moves than spot markets have so far produced, leaving room for renewed volatility around expiries and macroeconomic developments.
“The market’s next focus is on whether capital will flow back in, and whether BTC can reclaim $75,000 and ETH can retake $2,100. The settlement appears more like a “bearish unwinding”—large positions have expired—but the fact that both BTC and ETH are trading below their key resistance levels indicates that the dominant force this week has not been chasing rallies, but rather risk aversion and a retreat by longs. The market’s bullish sentiment is currently very fragile,” analysts at Greeks.live noted.
Technically, analysts have identified $70,000 as a key downside level.

A break below that zone could trigger deeper weakness and accelerate outflows. Meanwhile, a sustained recovery above $80,000 would likely signal renewed conviction and could attract fresh inflows into both spot products and derivatives markets.
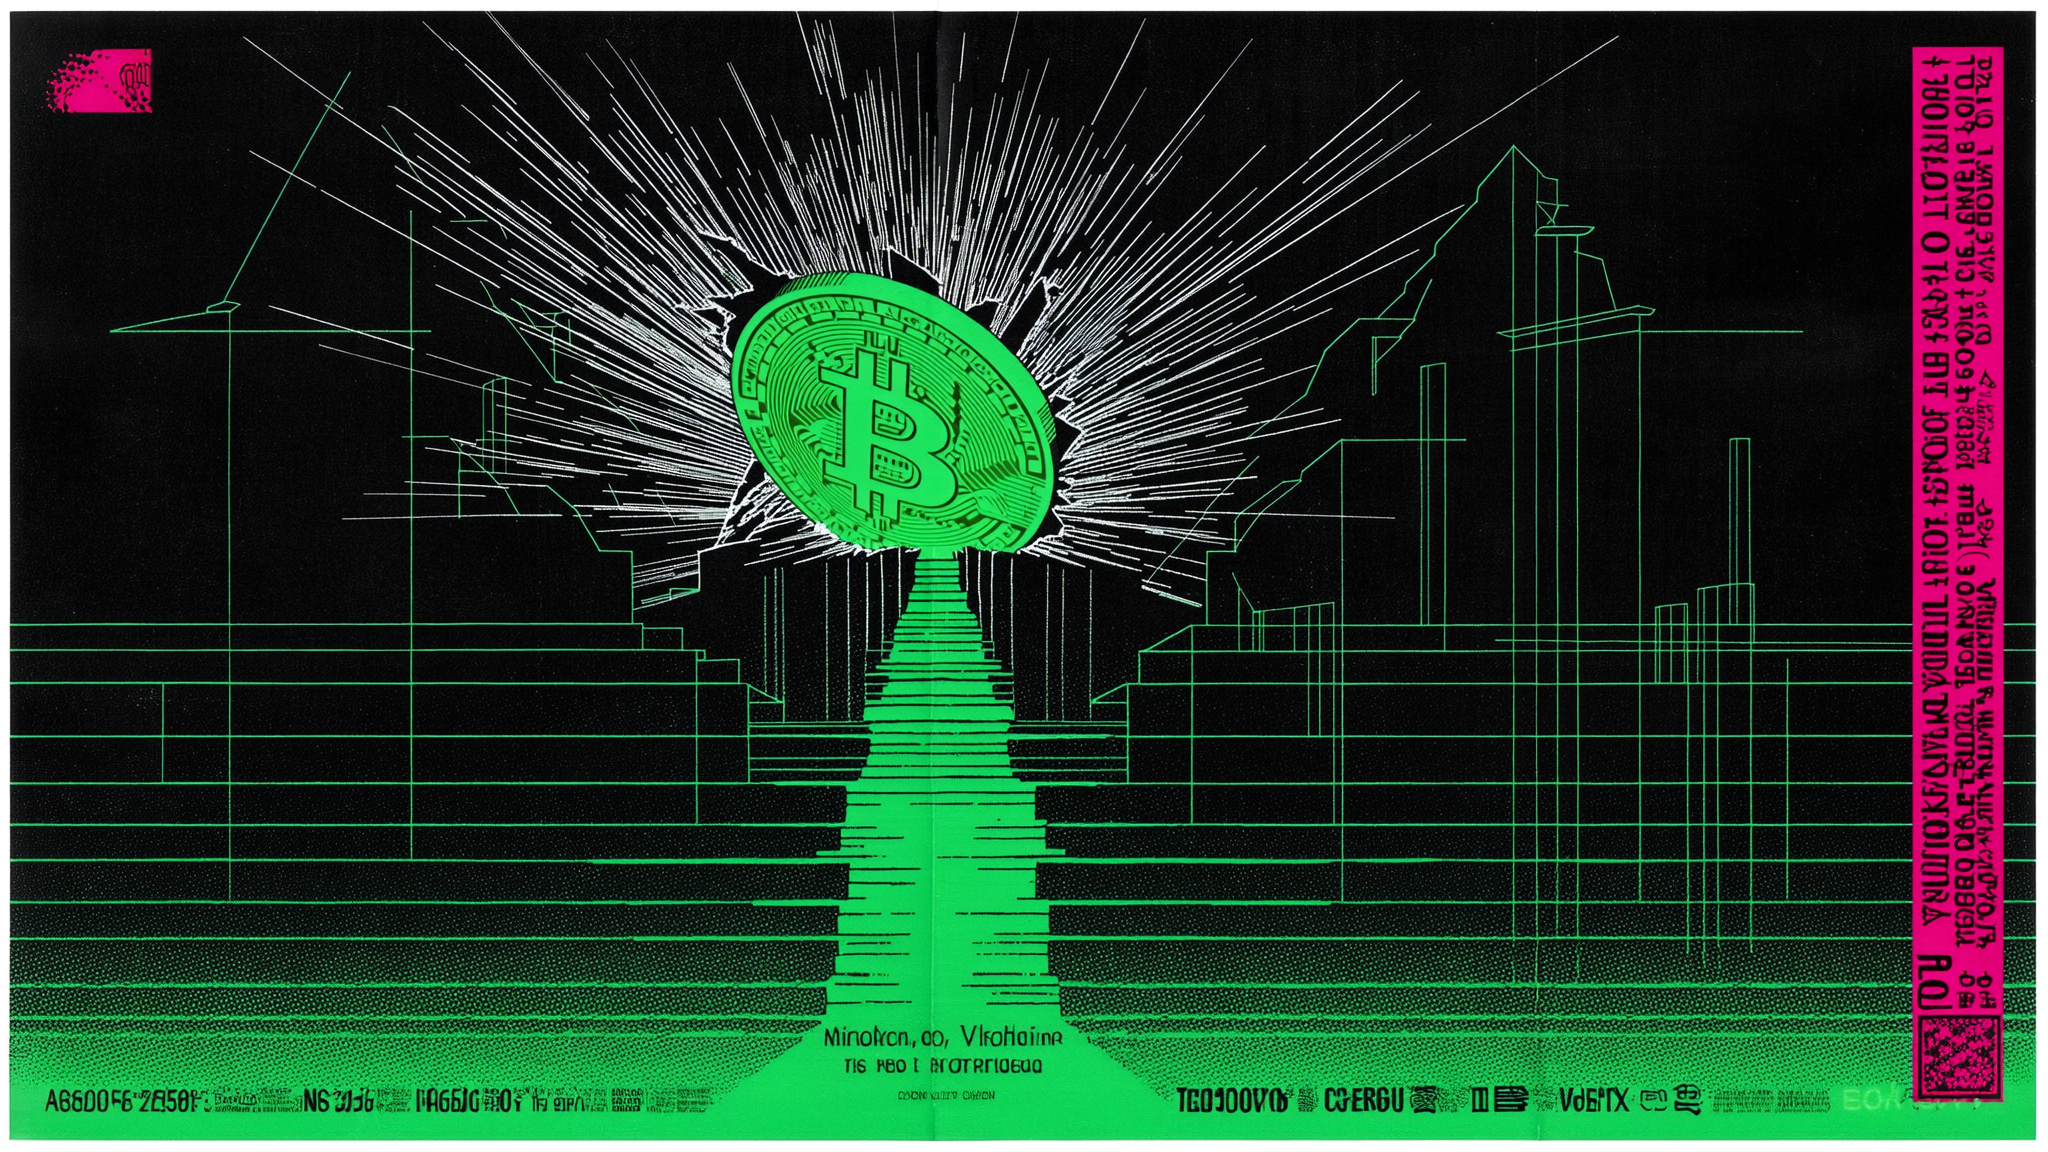
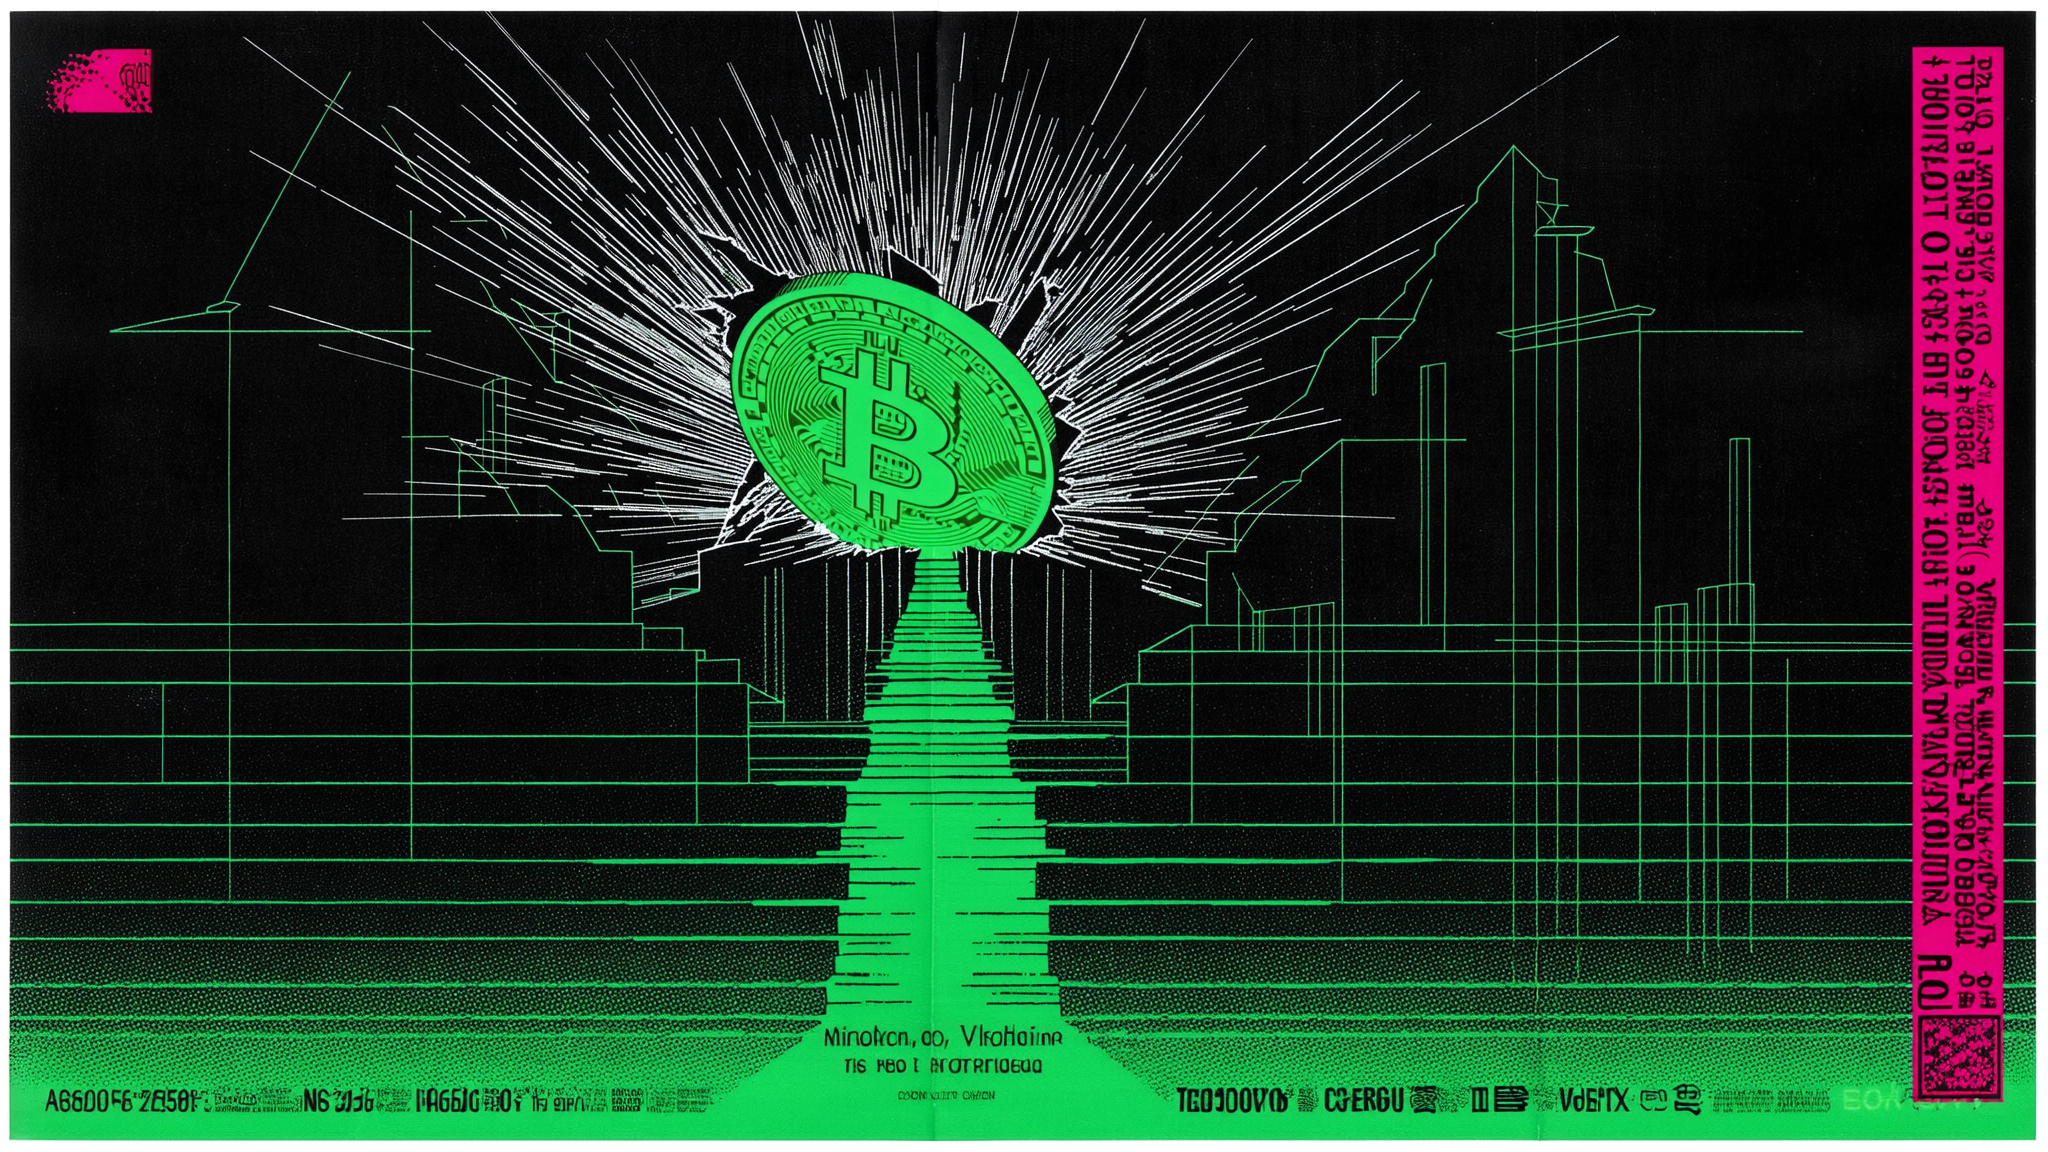
The Commodity Futures Trading Commission approved the first bitcoin perpetual futures contract on a registered U.S. exchange on Friday, clearing a product that American traders have long had to access on offshore venues. The agency issued an Order for Approval to KalshiEX, a designated contract… Read the full story at The Defiant

Around 85,500 Bitcoin options contracts will expire on Friday, May 29, with a notional value of roughly $6.3 billion. This event is larger than usual for the end of the month, so it may affect spot markets.
Crypto markets have been in decline all week, with around $120 billion leaving the space as Bitcoin continues to weaken and Ether gets crushed.
Escalation of US military action in the Middle East has pushed investors into panic mode, and the sell-off has accelerated.
Bitcoin Options Expiry
This week’s batch of Bitcoin options contracts has a put/call ratio of 0.85, meaning that sellers of longs and shorts are pretty evenly matched. Max pain is around $75,000, according to Coinglass, which is a little higher than current spot prices, so some could be out of the money on expiry.
Open interest (OI), or the value or number of Bitcoin options contracts yet to expire, remains highest at the $80,000 strike price on Deribit, with $1.7 billion, but short sellers still have $1.2 billion in OI at $60,000. Total BTC options OI across all exchanges has been declining recently, and is at $37.5 billion, according to Coinglass.
Although Bitcoin has fallen to a “very dangerous level,” implied volatility (IV) has not risen significantly, reported derivatives provider Greeks Live on Thursday.
Under these circumstances, today’s expiry appears likely to “significantly alter the current options position structure,” they added.
“The market as a whole is still betting on support, and large investors’ concerns about the risk of a breakout have not increased significantly.”
BTC’s price has begun to break below the Gex concentration zone, and the resistance from open interest will continue to weaken. Meanwhile, since Gex is concentrated around $2,000, ETH has also broken below the Gex resistance level.
Although BTC has fallen to a very dangerous… pic.twitter.com/INeioAIqMP
— Greeks.live (@GreeksLive) May 28, 2026
In addition to today’s batch of Bitcoin options, around 650,000 Ethereum contracts are also expiring, with a notional value of $1.3 billion, max pain at $2,200, and a put/call ratio of 0.77. Total ETH options OI across all exchanges is around $6.9 billion.
This brings the total crypto options expiry notional value to around $7.6 billion, the largest event for many weeks.
Spot Market Outlook
Markets have been falling all week, with total capitalization dipping to $2.55 trillion on Friday morning in Asia, their lowest level since April 13.
BTC managed to recover $73,000 after falling below it twice on Thursday, but its market structure remains weak and further losses look likely.
ETH had reclaimed $2,000 at the time of writing, but also looked very weak and deep in bear market territory.
Crypto could be further pressured by US inflation, which increased at its fastest pace in three years in April as measured by this week’s PCE report.
The post Will Crypto Markets Fall Further When $6.3B Bitcoin Options Expire? appeared first on CryptoPotato.
Crypto World
Top Energy Executive Warns of Critical Oil Inventory Tightness and Imminent Price Spike
ExxonMobil’s senior vice president has warned that oil inventory tightness will reach critical levels within weeks, setting the stage for a sharp price surge unless physical supply rebounds soon.
Neil Chapman, the company’s senior vice president, told a Bernstein investor conference that markets sit only weeks away from rarely seen stockpile levels. He projected Brent crude could spike to $150 or $160 per barrel.
Oil Inventory Tightness Hits Critical Stage
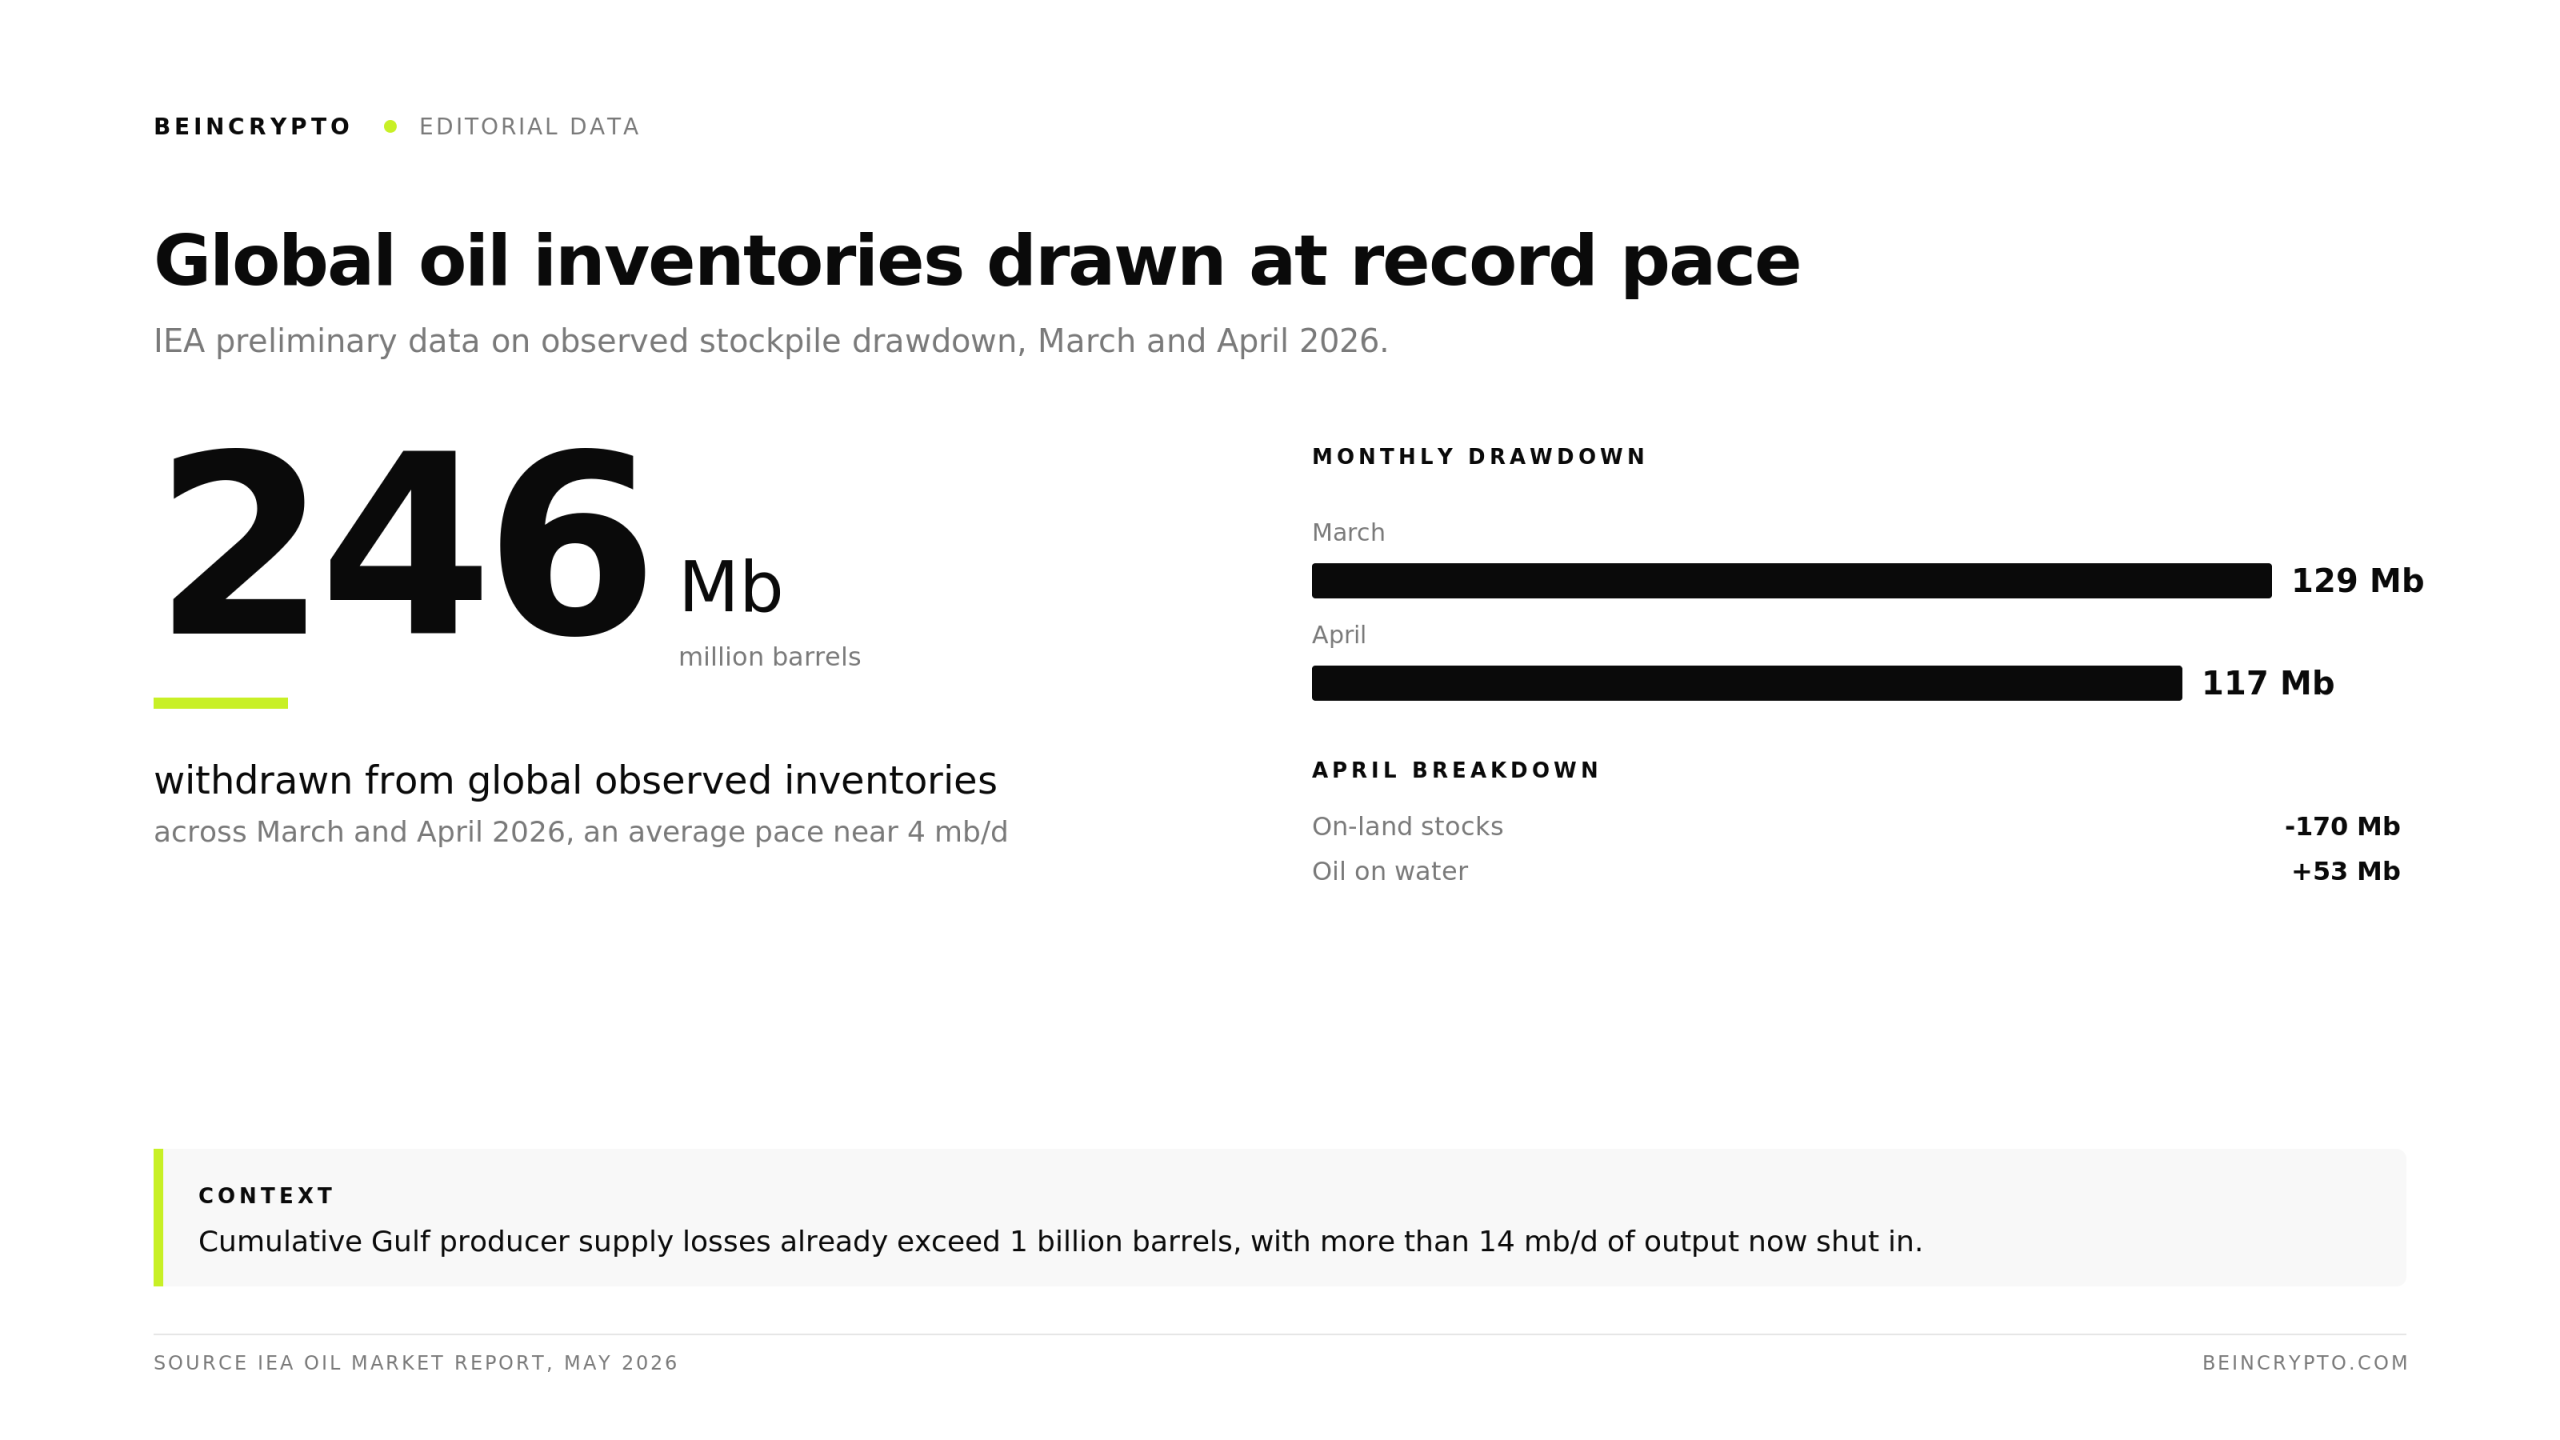
Observed global oil inventories fell by roughly 246 million barrels during March and April, according to the International Energy Agency.

The pace of drawdown has accelerated since the Strait of Hormuz disruption began.
Cumulative supply losses tied to the Hormuz shipping disruption could exceed one billion barrels by month-end. Tehran’s closure of the chokepoint has cut off roughly a fifth of world oil flows.
Independent analysts argue that commercial oil inventories are weaker than headline data suggests.
Continued Strategic Petroleum Reserve sales have flattered the topline figures. Tanks and pipelines tied to private buyers have thinned out at a faster pace.
Strategic Petroleum Reserve releases and government stockpile sales have partially absorbed the shock.
Those buffers shrink quickly when commercial supplies also fall. Energy investors have already begun reweighting toward oil stocks worth watching as supply visibility deteriorates.
$150 Brent Scenario Gains Traction
Chapman framed the timeline as two or three weeks before inventory shortages become disruptive.
ExxonMobil’s internal supply models point to Brent crude prices near the $150 mark once physical buyers compete for scarce cargoes.

“We’re approaching unheard of inventory levels,” Chapman told CNBC.
Follow us on X to get the latest news as it happens
The Exxon view aligns with growing concern from independent energy analysts. Several traders have argued on that futures markets are understating physical-market tightness.
They cite widening spreads in crude grades and refined product margins.
“We are ~9 million bbls away from hitting a storage level that’s the equivalent of living paycheck to paycheck for gasoline and distillate…And we are going into peak summer demand season + hurricane…We are living on the edge now. Product pipeline + inventory needed to move products around. 2-3 weeks to exhaust the 9 million bbls, mid-June,” analysts at HFI Research indicated.
Crypto and macro investors are watching the call closely. Higher oil prices lift inflation expectations and complicate central bank rate paths.
Risk assets have already shown sensitivity to Iran Hormuz tensions, with Bitcoin (BTC) trading lower on past supply scares.
Even modest supply hits could trigger gasoline shortages during peak driving demand. If Brent overshoots $150, demand destruction becomes the likeliest path back to balance.
Whether the coming weeks confirm Chapman’s call may shape both oil shock dynamics and broader risk markets.
The post Top Energy Executive Warns of Critical Oil Inventory Tightness and Imminent Price Spike appeared first on BeInCrypto.
Market analysts say Ether (ETH) still faces “downside pressure” that could trigger another ETH price sell-off as traders shift their focus to support at $1,800.
Key takeaways:
- Ether faces downside pressure as elevated leverage and positive funding rates amid falling prices signal fragile market conditions.
- Analysts say ETH must hold the $1,800-$1,750 support zone to avoid a deeper correction.
Ether price metrics suggest downside risks remain
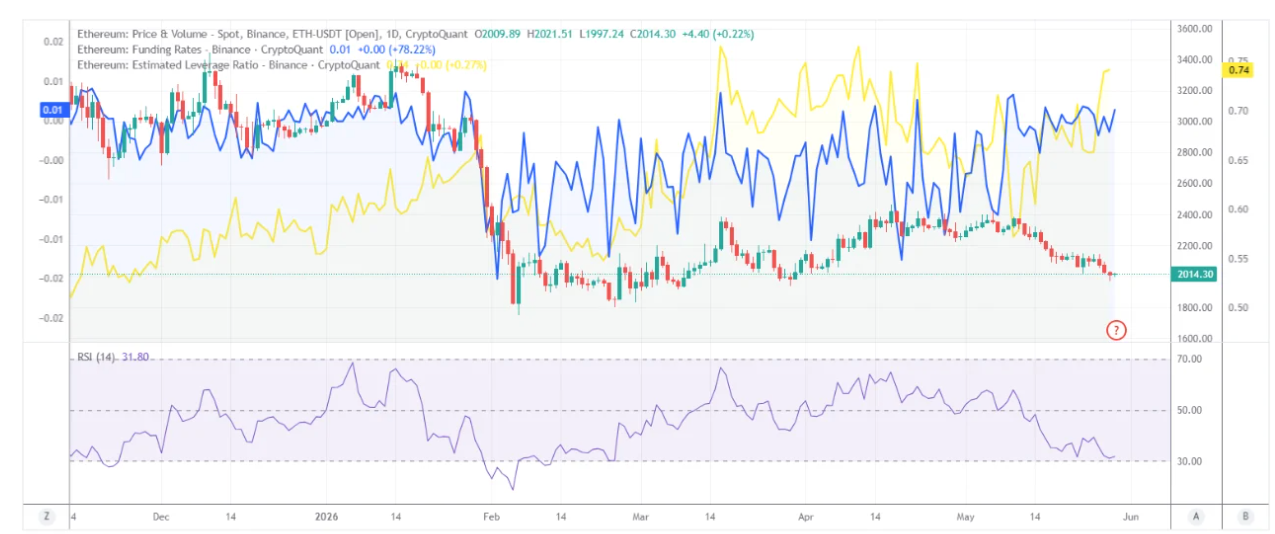
Analysts have highlighted several reasons for Ether’s potential to drop lower, including an elevated estimated leveraged ratio and positive funding rates amid a “weakening price structure,” according to CryptoQuant analyst PelinayPA.
The chart below shows that Ether’s estimated leverage ratio (yellow line) remains relatively elevated at around 0.74.
Related: Ether bears at risk of $2B squeeze as short positions build around $2K
The funding rate (blue line) has remained mostly in positive territory since mid-April, meaning long positions still dominate the market. Meanwhile, the RSI (purple line) is closer to the oversold zone at 31 and has not yet “produced a convincing recovery signal,” the analyst said in a Friday QuickTake analysis.
“Leverage remains elevated and long positioning is still dominant, yet price continues to struggle as the RSI reflects weakening momentum,” the analyst said, adding:
“Overall this combination suggests that short term downside pressure in the ETH market still remains the dominant structure.”
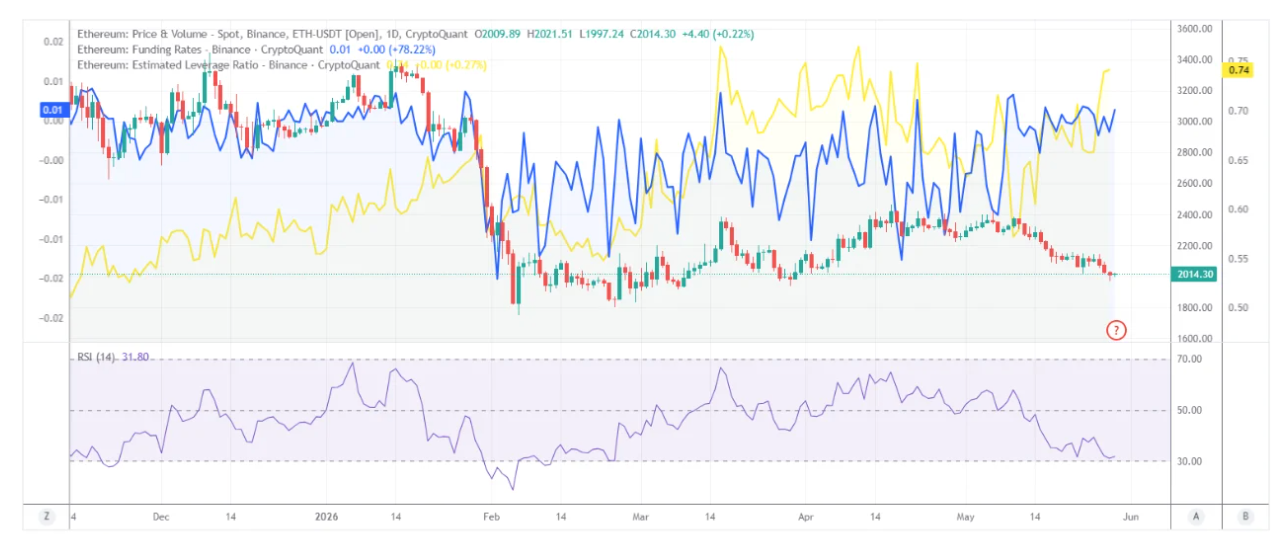
ETH: Funding rates and leveraged ratio
Under normal market conditions, rising leverage and increasing funding rates are usually supported by strong price expansion. However, in this case, leverage remains high while price continues to record lower lows.
“But the key signal is that this leverage build-up came alongside heavy sell-side pressure,” fellow analyst Amr Taha said in another QuickTake note.
The chart below shows that the Binance cumulative net taker volume fell to around -$744 million, its deepest negative reading since April 6, 2026.
Amr Taha added:
“This means new leverage entered the market while aggressive sellers were still in control, making the setup more fragile than a clean bullish open-interest expansion.”
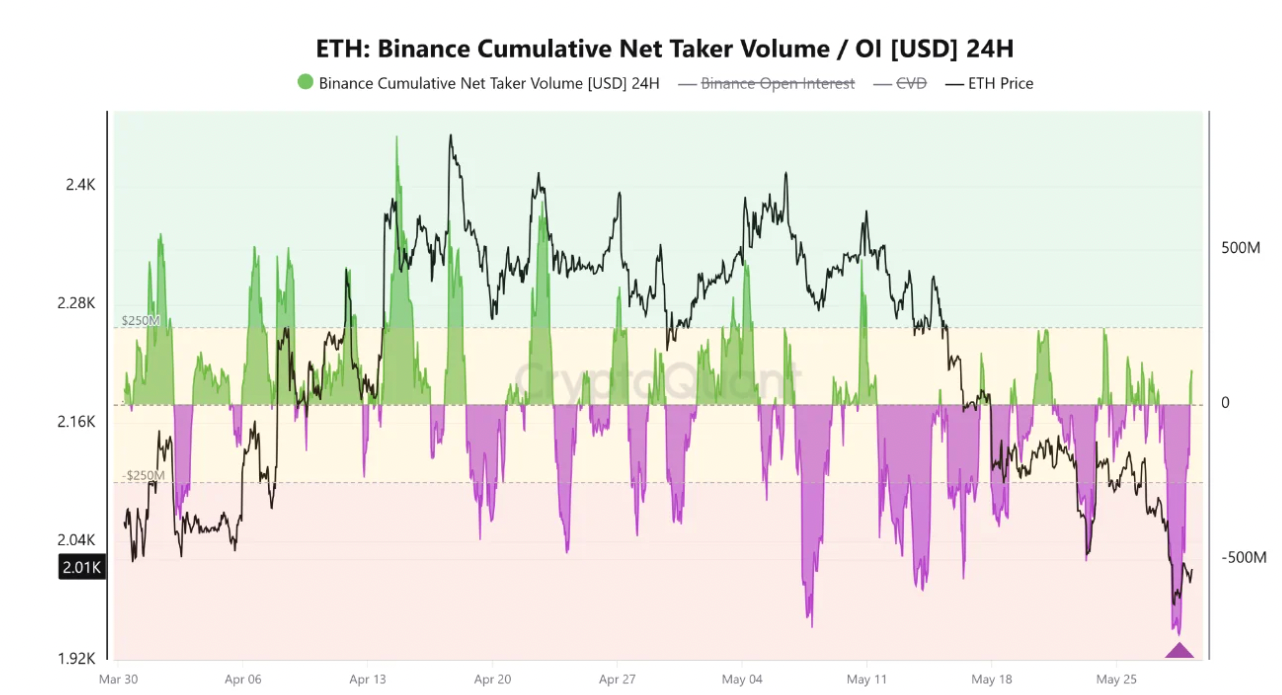
ETH: Cumulative net taker volume on Binance. Source: CryptoQuant
This suggests that the market structure is driven by derivative positioning instead of spot demand, which creates a weaker overall setup.
Waning demand is also seen in US-based spot Ethereum exchange-traded funds (ETFs), which continue to post heavy outflows, indicating declining institutional interest. These ETFs have recorded outflows for thirteen consecutive days, totaling $695 million. The $121 million in net outflows recorded on Thursday marked the largest withdrawal in two weeks.
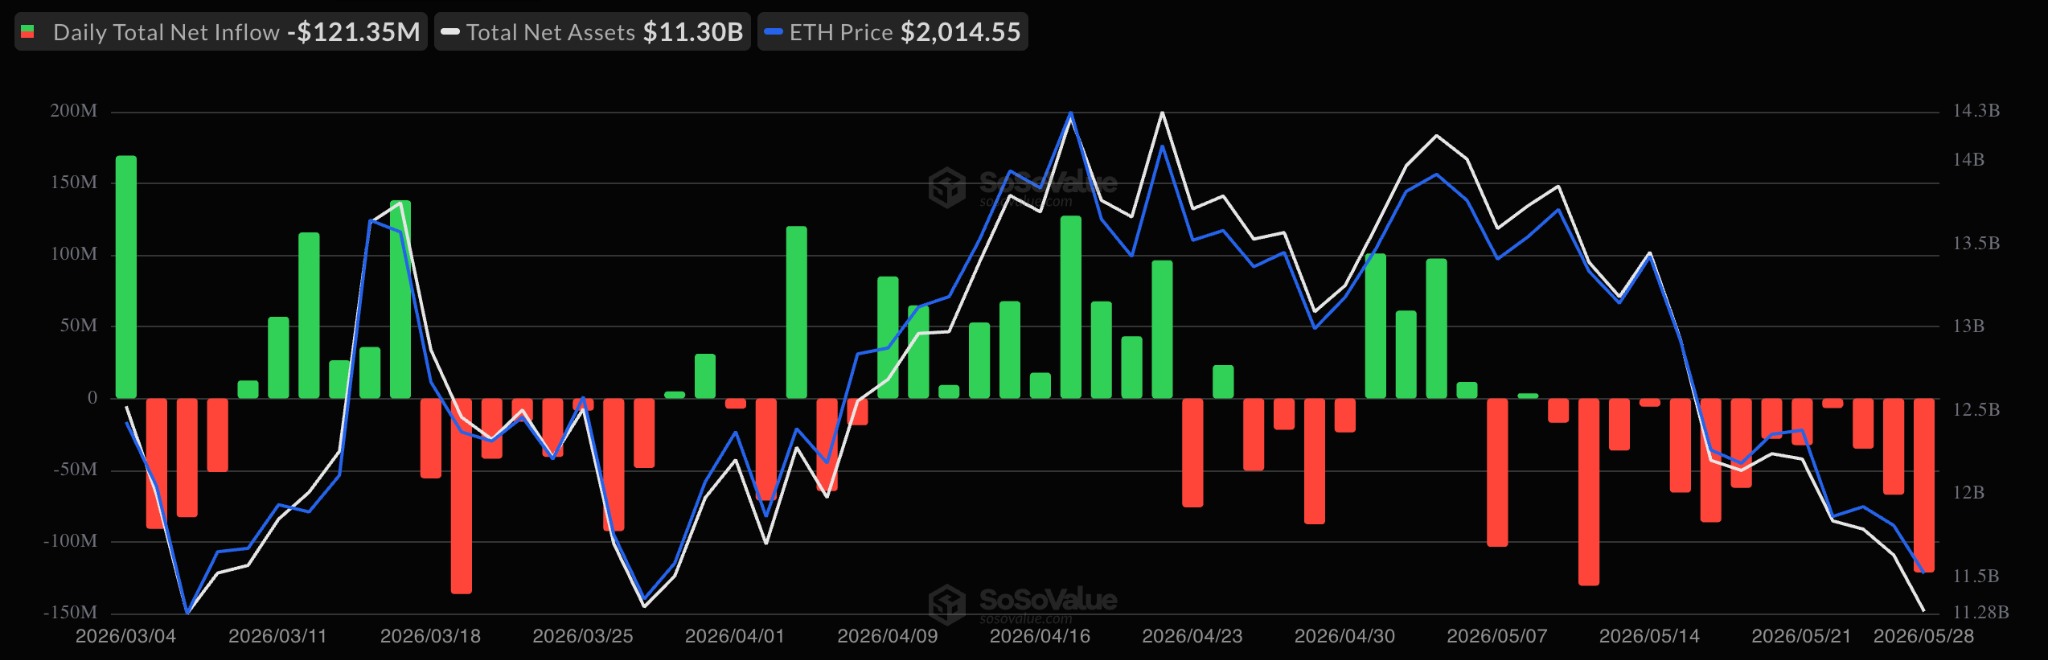
Spot Bitcoin Ether flows chart. Source: SoSoValue
As Cointelegraph reported, a break below the crucial $2,000 support and increased selling by whales indicate additional downside risk for ETH price in the near term.
Ether price must hold above $1,800
Ether’s 7% drop over the last three days has seen it lose the crucial $2,000 support, as the bears gained momentum.
Traders are now watching key levels on the downside, including the $1,800 demand zone.
“A good spot buy would be around $1,700-$1,800 key area,” analyst Suraj Jha said in a Friday post on X, adding:
“A confirmed breakdown below this level could shift the structure bearish and open up continuation to the downside.”
Fellow analyst Crypto Patel said Ether’s technical structure remains “bearish until we reclaim $3050.”
The ETH/USD pair “needs to hold $1,750 to keep the long-term bullish case alive,” the analyst said, adding:
“If $1,750 breaks, accumulation zone 2 sits at $,1500-$,1400, a massive discount for long-term holders.”
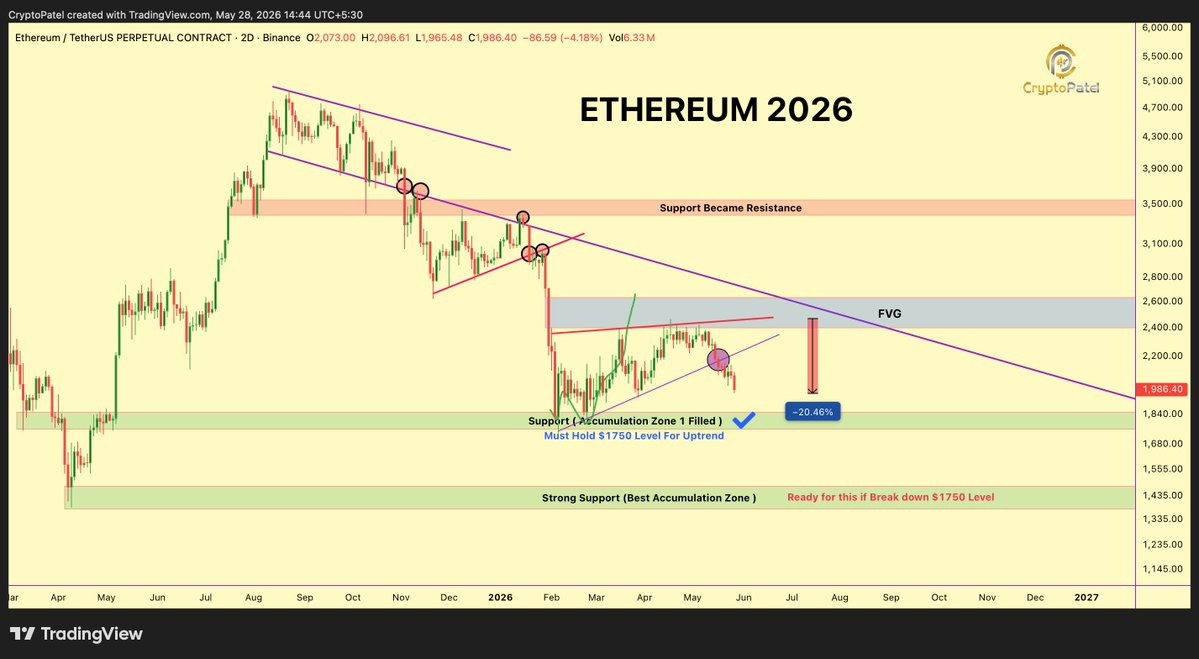
ETH/USD two-day chart. Source: X/CryptoPatel
A daily candlestick drop below $1,750 could trigger another sell-off episode, first toward the April 2026 low at $1,550 and later to the 2022 macro low around $1,000, as shown on the daily chart below. This would bring the total losses to 47% from the current price.
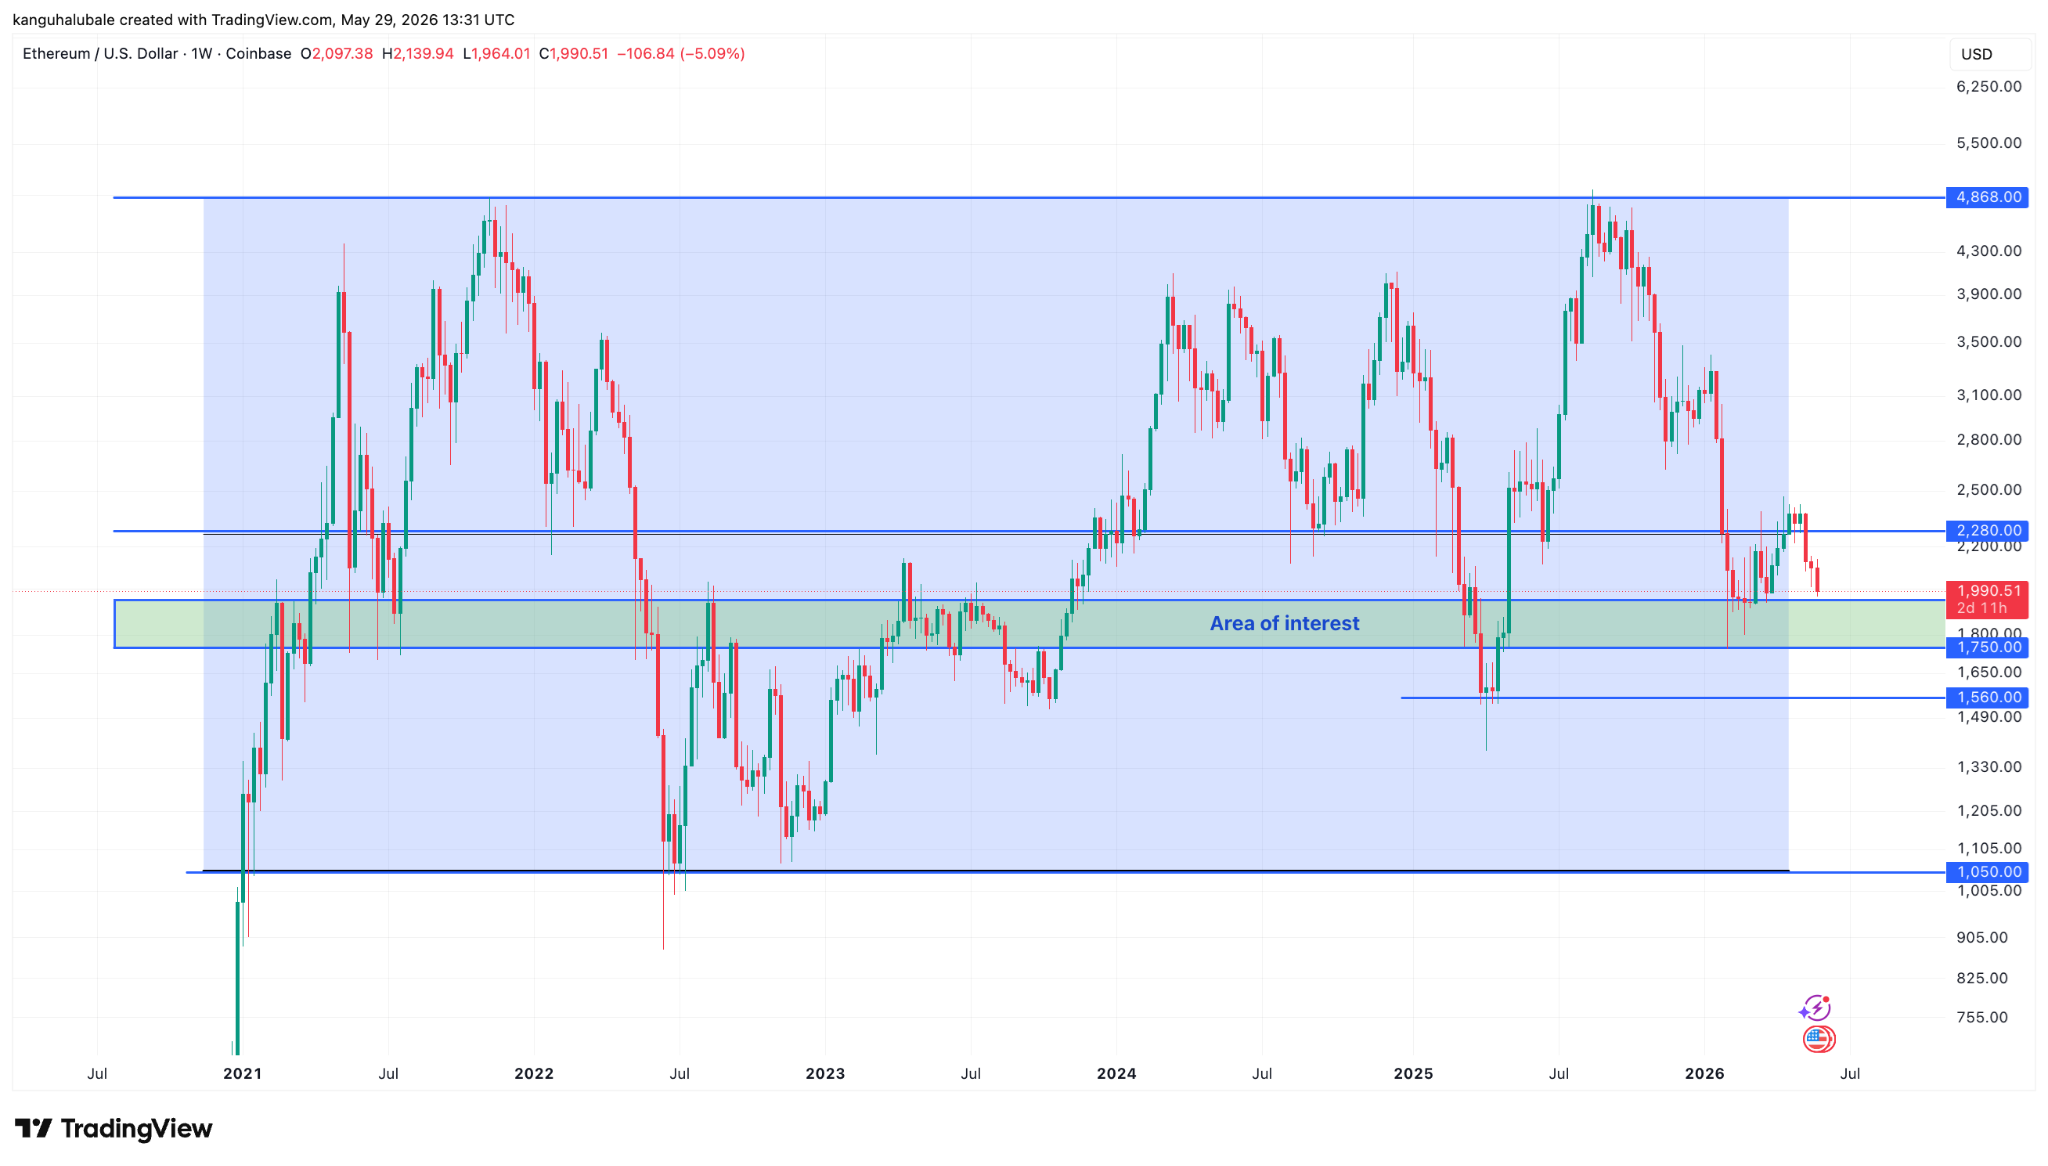
ETH/USD weekly chart. Source: Cointelegraph/TradingView
As Cointelegraph reported, after losing the psychological support at $2,000, the ETH/USD pair may then descend toward the $1,900-$1,750 zone, which buyers are expected to defend aggressively.
Ethereum is clinging to support near $1,800 as rising leverage, crowded longs, and persistent U.S. spot ETF outflows deepen downside risks for the second largest cryptocurrency.
Summary
- ETH broke below the key $2,000 level with sell pressure now concentrated around $1,800–$1,750
- U.S. spot ETH ETFs have seen 13 straight days of net outflows totaling about $695 million
- Derivatives data show elevated leverage and positive funding despite a weakening price structure
Ethereum (ETH) price is extending a weak trend after losing the psychologically important $2,000 level, with market focus now locked on whether bulls can defend the $1,800–$1,750 support area.
According to on chain analytics platform CryptoQuant, analyst PelinayPA noted that Ethereum’s estimated leverage ratio remains elevated at roughly 0.74, while funding rates have stayed positive since April, a combination that signals “crowded long positions” even as prices continue to grind lower.
The same analysis shows Ethereum’s relative strength index hovering near 31, indicating conditions are close to oversold but without “an effective rebound signal,” leaving spot price exposed if forced liquidations begin to cascade.
At the same time, U.S. spot Ethereum exchange traded funds have logged net outflows for 13 consecutive trading sessions, with roughly $695 million in capital pulled and a single day peak of around $121 million in redemptions, underscoring what the report describes as a “continued cooling of institutional allocation demand.”
ETF outflows and derivatives pressure converge
The mounting stress around the $1,800 level comes after weeks of structurally bearish signals in both spot and derivatives markets.crypto+1
A recent crypto.news analysis observed that Ethereum had already broken below an ascending channel on the daily chart, warning that MACD had turned bearish and that failure to hold supports near $2,080 could open the door to a swift move toward the $1,800 region.crypto
That same report cited CoinGlass estimates suggesting more than $1.7 billion in leveraged long positions could face liquidation if ETH fell below roughly $2,044, a level now decisively lost as intraday price action grinds closer to the $1,800 line in the sand.crypto
In parallel, flows data compiled by CryptoSlate show that combined Bitcoin and Ethereum ETFs have seen nearly $2.7 billion in net redemptions over the past two weeks, with allocators rotating into niche products tied to Solana, XRP, and Hyperliquid’s HYPE token instead.cryptoslate
Key support at $1,800 becomes sentiment pivot
Within this backdrop, ChainCatcher’s summary stresses that “short term risks are skewed to the downside,” arguing that Ethereum currently “maintains a weak structure against the backdrop of high leverage, crowded long positions, and ongoing ETF outflows,” making the $1,800 support “a key observation point for market sentiment and technical aspects.”
That language echoes earlier commentary from crypto.news, which described $1,800 as a “psychological floor” that traders have been defending for more than a month, warning that “a drop below this key structural pivot point could trigger more downside, especially considering the stressed macro environment.”
Recent coverage on crypto.news also underlined that Ethereum still trades below a crucial $2,500 resistance cluster and that a weekly close under roughly $1,850 would likely accelerate volatility toward lower range boundaries.
At press time in the ChainCatcher report, Ethereum was quoted around $2,019, but price action has been defined less by spot demand than by the slow bleed of ETF capital and a derivatives market where funding and leverage remain stubbornly tilted long even as the chart breaks down.
For now, the question facing traders is brutally simple: can Ethereum absorb yet another wave of ETF outflows and defend $1,800 without triggering the kind of liquidation cascade that the derivatives data are clearly primed for.


Sui, the 31st-largest cryptocurrency by market value, said its mainnet is processing transactions again after two halts in two days knocked the Layer 1 blockchain offline, with validators rolling out what the team described as a long-term fix. Activity resumed and transactions are "flowing… Read the full story at The Defiant


Mark Cuban has dumped most of his Bitcoin, calling it “not the hedge I expected” as the Iran war and dollar volatility exposed what he sees as a failed safe haven narrative.
Summary
Billionaire investor Mark Cuban has revealed he sold the majority of his Bitcoin holdings, declaring that the flagship cryptocurrency “has lost the plot” and “is not the hedge I expected” against war and inflation.
Speaking on the Portfolio Players podcast with Front Office Sports, Cuban said he offloaded roughly 80% of his BTC after watching gold rip to $5,000 during the U.S.–Iran conflict while Bitcoin dropped instead of behaving like “a better version of gold.”
“I always thought it was a better version of gold than gold,” Cuban said. “But gold just blew up and went to $5,000. Bitcoin dropped.”
“This might get some people upset,” he added. “I think Bitcoin has lost the plot.”
Cuban’s hedge thesis breaks, but the data fights back
Cuban framed his exit explicitly as a verdict on Bitcoin’s failure as a hedge during geopolitical stress and dollar weakness, pointing to the Iran war as the turning point. He argued that when “fiat is getting hit and there’s geopolitical turmoil,” Bitcoin should behave like a crisis asset, yet in his view “the hedging effect never materialized” while gold surged.
The timing is awkward. Since the start of the 2026 Iran war on February 28, Bitcoin has actually outperformed gold by roughly 35–36% on a relative basis, with BTC up about 7–10% while gold has been flat to down and the BTC/gold ratio has surged. separate analysis cited by Yahoo Finance noted that Bitcoin has gained more than 16% over the conflict period even as gold prices have declined by over 15%, undercutting Cuban’s claim that BTC “failed” as a hedge in aggregate.
At the time of Cuban’s comments, Bitcoin was trading near $77,500, down roughly 38% from its October 2025 all time high of $126,080 but still well above its pre war levels; gold, meanwhile, had pulled back to around $4,500 per ounce after briefly touching $5,000.
What about Bitcoin price
According to the Bitcoin (BTC) price page from crypto.news, BTC recently hovered in the mid $70,000s, reinforcing that the asset has recovered sharply from early conflict lows even if it remains below its peak.
Cuban’s own positioning underscores the reversal. Heading into 2026, he said his crypto portfolio was roughly 60% Bitcoin, 30% Ethereum and 10% other tokens, a structure he previously justified by calling BTC “a better store of value asset than gold.”
Now he says he still holds Ethereum for its “utility” while dismissing most altcoins as “junk,” effectively recasting Bitcoin as the disappointment in a portfolio he once described as anchored by BTC.
War, inflation and the safe haven narrative
The clash between Cuban’s experience and the data comes as the broader market reassesses what, exactly, Bitcoin hedges.
As crypto.news has previously reported in its coverage of how Bitcoin outperforms gold by roughly 36% since the Iran war began, BTC has behaved less like a classic “panic bid” asset and more like a high beta macro instrument that still managed to beat traditional havens over the war’s first months.
In its own report on Cuban’s remarks, crypto.news noted that “Bitcoin defenders” argue the billionaire cherry picked the worst window: BTC did sell off on initial Iran headlines, but from the first signs of conflict it has risen more than 16%, while gold has sagged.
Fortune similarly observed that “since the start of the war, the original cryptocurrency is up about 7%, and on Wednesday was trading at around $71,000,” even as gold drifted near $5,240 per ounce.
Cuban’s broader skepticism comes after years of vocal support, including a 2021 podcast appearance where he revealed that 60% of his crypto holdings were in Bitcoin and insisted he would “never sell it for anything” because it was superior to gold as a store of value.
With that stance now reversed, his sale has become a Rorschach test for the market: either a high profile confirmation that the “digital gold” story is broken, or, as some traders suggest and as earlier crypto.news coverage of Bitcoin’s performance during crises implies, an exquisitely mistimed capitulation top in a still evolving hedge narrative.
Other crypto.news reporting on war driven flows into gold tokenization and renewed institutional interest in Ethereum suggests that the safe haven debate is fragmenting across assets rather than converging on a single “digital bunker.”
For now, Cuban’s verdict is blunt: Bitcoin, he says, “lost the plot” – even as the numbers stubbornly refuse to give him the clean failure he thinks he saw in real time.

TRX Drops 8% as SunPump Hype Fades, Network Holds

How Spielberg’s Team-Up With Michael Jackson Destroyed A Fantasy Icon

From Charlotte Tilbury to Pandora – here’s 26 items a shopping expert is buying this weekend


-

 Fashion7 days ago
Holiday Weekend Open Thread – Corporette.com
-

 Business5 days ago
NYT Strands Answers May 24 2026 Revealed for Puzzle No. 812 Theme Summer Essentials
-

 Politics4 days ago
Bridgerton Season 5: Cast, Release Date And Everything We Know So Far
-

 Crypto World6 days ago
Robinhood crypto COO Tanya Denisova exits
-

 Tech4 days ago
Microsoft’s quiet Claude Code retreat and the real cost of enterprise AI
-

 Business3 days ago
Selena Gomez Reportedly Upset Over Benny Blanco’s Comments on Her ‘Terrible’ Diet
-
 Crypto World3 days ago
Micron Crosses $1 Trillion Market Cap as AI Demand Reshapes Memory Sector
-

 Politics7 days ago
Makerfield: a tale of two social-media histories
-

 Business4 days ago
BTS Sells Out Four Las Vegas Shows at Allegiant Stadium for ARIRANG World Tour
-
Tech2 days ago
The Samsung pay deal is the moment Korean unions changed register
-

 Tech4 days ago
Westone Audio and Etymotic Acquired by Fidelity Collective in Major IEM Market Move
-

 Tech13 hours ago
Waymo dominates autonomous vehicle registrations as Tesla trails behind
-

 Tech3 days ago
Millions of AI agents imperiled by critical vulnerability in open source package
-
 Crypto World4 days ago
Nvidia (NVDA) CEO Calls on Super Micro to Strengthen Export Controls Amid Smuggling Probe
-
 Tech4 days ago
China assigns ID codes to 28,000+ humanoid robots
-
Crypto World2 days ago
SpaceX’s $2 Trillion IPO: Why Tech Giants Nvidia (NVDA), Apple (AAPL), and Microsoft (MSFT) May Face Pressure
-

 Tech2 days ago
NASA taps Blue Origin to deliver lunar rovers for Moon Base initiative
-
 Entertainment4 days ago
‘Breaking Bad’ Star’s Easy-to-Binge 6-Part Crime Series Spin-Off Is Finally Heading to Free Streaming
-
Crypto World5 days ago
Brian Armstrong Outlines Crypto Vision for the Future Financial System
-

 Business4 days ago
Yatra Online, Inc. 2026 Q4 – Results – Earnings Call Presentation (NASDAQ:YTRA) 2026-05-25
You must be logged in to post a comment Login