

Crypto World
Was Bankless Founder Right to Sell His Ethereum? On-Chain Data Reveals

Bankless co-founder David Hoffman sold his Ethereum (ETH) holdings. He argues the “ETH is money” thesis has fully played out. On-chain data and the daily chart suggest the market is already pricing in his call.
Ether trades around $1,975, down 2.4% on the day and roughly 14% over the past month. Active addresses are falling, and exchange balances are rising again. Both echo the fade Hoffman described in his exit note.
Why David Hoffman Sold His ETH
Hoffman called the “ETH is money” thesis a long shot. He argued it required every Ethereum layer to outperform rivals. According to him, that bar was missed.
The Bankless co-founder stresses he remains bullish on the Ethereum network. However, he sees no structural rerating ahead for ETH as an asset. The protocol returns value to L2s and apps rather than capturing it.
His sale drew wide coverage across crypto. Hoffman has been one of the loudest Ethereum advocates of the past five years. The reaction split the market. Some traders agree the thesis has run its course. Others still see ETH as a discounted bet on Web3.
Declining Active Addresses Confirm Fading Network Demand
Daily active addresses on Ethereum have trended lower since early February, according to Santiment data. The metric peaked above 1.5 million in January. It now sits near 544,000.
This fade tracks the broader drawdown from above $3,400 in early December to under $2,000 today. Hoffman argues that L1 assets are ultimately priced on fees and revenue. Fees only flow when users keep transacting on the base layer.

In his exit note, Hoffman pointed to Solana’s 2024 rerating and NEAR’s 2026 move. Both showed that L1 token strength correlates with fee market share. Ethereum lost that share through 2024 and 2025.
He also referenced BNB and TRX, two of the highest-grossing chains. Their charts behave as he expected ETH would after 2022. The takeaway is that fee dominance, not technology, sets the ceiling.
A reversal in the trend would weaken the signal. Addresses would need to push back above one million on a 30-day rolling average. Until then, the on-chain backdrop matches Hoffman’s bearish call.
Demand is fading while activity migrates to L2s. Those L2s pay almost nothing back to the Ethereum base layer.
Exchange Supply Reverses, Sellers Return After Months of Accumulation
The second on-chain signal cuts a more interesting shape. ETH supply on exchanges dropped sharply in late January, from roughly 8.5 million to about 7 million. That low held through April. The stretch looked like a quiet accumulation.
However, the trend has flipped in May. Supply on exchanges has climbed back to 7.5 million. It now holds steady at that level. Coins moving back to exchanges typically signal that holders are positioning to sell.
The rotation is small in absolute terms but directionally important. It coincides with the breakdown below $2,140 on the daily chart. It also overlaps with the renewed downtrend in active addresses.

Hoffman argues that bullish on-chain phases for ETH eventually fade. The network is architecturally a “giver, not a taker.” The May reversal in exchange supply is consistent with that view.
Holders who accumulated through the dip are now distributing into weakness. They are not waiting for a structural rerating.
The behavior also lines up with the stablecoin point in Hoffman’s piece. Ethereum settles $163 billion in stablecoins today, up from $3 billion in 2020. That utility helps the dollar more than it helps ETH. Holders appear to be reading the same memo.
Net exchange inflows tend to lead to price weakness by several weeks. If the May trend continues into June, ETH may see fresh selling pressure even before the daily chart breaks. The Q1 accumulation case no longer carries the same weight.
ETH Price Prediction Points to $1,920 Channel Floor
The daily chart shows ETH trapped inside a descending parallel channel since late April. Price was rejected from the 0.382 Fibonacci retracement at $2,382 in early May. It then lost the 0.236 level at $2,140 in mid-May.
ETH currently trades at $1,978 and is grinding toward the lower channel band. That zone aligns with the next visible support near $1,920. A clean break below opens the path toward $1,750, the previous swing low and the 0 Fibonacci anchor.
Volume has been declining since early February. The drop signals weak conviction from both buyers and sellers. Meanwhile, the 14-day RSI sits near 30 and is stepping into oversold territory.
Historically, RSI prints below 30 on ETH have produced sharp counter-trend rallies. However, those rallies often reset before the broader trend resumes. Therefore, traders should watch for a wick into the $1,920 zone followed by a daily reversal candle.

The setup that would flip the bias bullish is a daily close above $2,140. That move would reclaim the 0.236 Fibonacci level and open a push through $2,382. Until that happens, every rally fades inside the descending channel.
A bounce from $1,920 on rising volume would buy time for bulls. A close below would confirm Hoffman’s structural read on the tape. It would also put $1,750 on the table.
A retest of $1,750 would mark ETH’s lowest print of 2026. It would also wipe out months of accumulated work by spot holders. Bulls need the $1,920 zone to hold cleanly to avoid that scenario.
For now, the channel, the on-chain tape, and Hoffman’s thesis form a coherent bearish stack. None of these signals is decisive alone, but together they pressure the same trade. Buying ETH here is a bet that all three rotate at once.
Watching the $2,140 reclaim level is the cleanest way to test whether bears or bulls control the next move. Until that level prints on a daily close, the burden of proof sits with the bulls, exactly as Hoffman’s note “Why I Sold My ETH” implied.
The post Was Bankless Founder Right to Sell His Ethereum? On-Chain Data Reveals appeared first on BeInCrypto.


Bitget has launched Stock+, a new feature under its Stocks 2.0 suite that lets eligible users buy real U.S. stocks using crypto.
Summary
- Bitget Stock+ lets eligible users buy real U.S. stocks using crypto converted into USDC directly.
- Users can receive dividends and split adjustments, while trades follow U.S. market trading sessions.
- Launch fees start at 0.1%, with a 50% discount available through August 31, 2026 initially.
In a Monday press release, the exchange said users can fund trades with digital assets, which are converted into Circle’s USDC stablecoin before stock purchases are completed.
The company said Stock+ is different from synthetic stock products or derivatives because users gain ownership of the underlying shares through regulated brokers. Holders are also eligible for cash dividends and stock split adjustments tied to their positions, while trading hours follow U.S. pre-market, regular market and after-hours sessions.
Crypto payments convert into USDC
Stock+ is designed for users who already hold crypto and want access to U.S.-listed companies without moving funds through separate banking and brokerage systems. Bitget said the product allows users to manage digital assets and equities from one account.
Bitget CEO Gracy Chen said the feature fits the company’s universal exchange strategy.
“Access is important, but ownership matters too,” Chen said. “Giving users access to real ownership of US-listed companies is how we actually bridge financial markets.”
In addition, the launch follows Bitget’s early June upgrade to Stocks 2.0, which introduced Reality, a regulated real-world asset protocol, and its tokenized stocks, known as rTokens. As previously reported by crypto.news, Reality issues 1:1-backed tokenized U.S. stocks and ETFs through regulated broker-linked structures.
Bitget said it has now listed more than 500 leading U.S. stocks and ETFs, including SpaceX, Tesla and Nvidia-linked products. It also said assets under management tied to rToken products have exceeded $50 million. Stock+ adds a direct stock ownership route alongside the existing tokenized asset model.
Transfers and fees expand the offer
Stock+ supports inbound stock transfers from participating brokers through standard transfer processes. That allows users to bring existing U.S. equity holdings into Bitget’s portfolio environment. The company did not say outbound transfers are ready at launch.
Bitget said Stock+ trading fees start from 0.1%. A 50% promotional discount is available through August 31, 2026. The fee campaign gives Bitget a lower-cost entry point as it tries to attract crypto-native investors who are used to fast transfers and app-based trading.
Exchange stock race widens
Bitget is not alone in adding stock products to crypto platforms. Crypto.news recently reported that Binance launched bStocks with tokenized Nvidia, Tesla and Circle shares, while Gate opened access to more than 1,000 Hong Kong-listed stocks using USDT.
The trend shows that major exchanges are moving beyond spot crypto and futures. Their goal is to place stocks, ETFs, commodities, tokenized assets and digital coins inside one trading interface. For users, that can reduce the need to switch between brokers and exchanges.
The main question is whether users prefer direct stock ownership, tokenized exposure or both. Stock+ gives Bitget a product closer to a brokerage model, while rTokens keep the on-chain asset route open.
For Bitget, the launch strengthens its push to become a multi-asset platform. For the wider market, it adds another sign that stablecoins are becoming a bridge between crypto balances and traditional securities. Regulation, regional access and broker arrangements will still decide how far the model can spread.
A scary Bitcoin prediction is spreading across socials just as an institutional red flag appears in ETF data. The timing is what makes the pairing look so alarming.
The call comes from analyst Jesse Olson, who ties $23,979 to a stock market crash of more than 50%. Recent data gives that warning just enough teeth to spread.
ETF Outflows Stretch to the Longest Streak
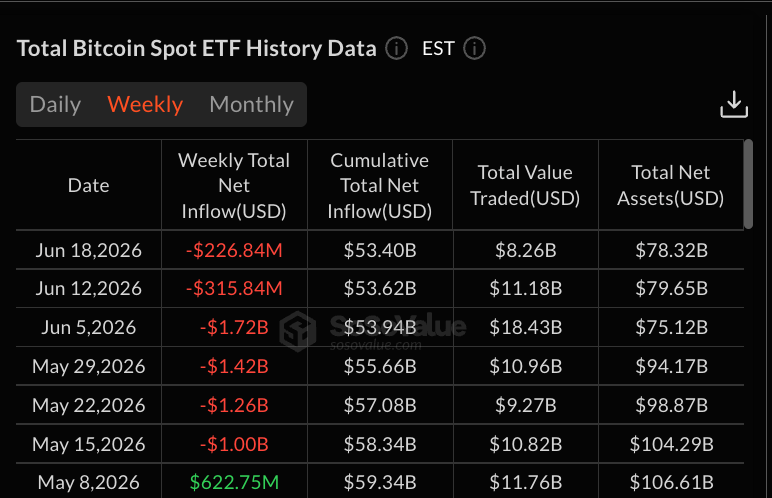
Olson’s call is not pulled from thin air. Bitcoin ETF outflows have run for six straight weeks, from mid-May through June 18. The current week is still in progress.

That is longer than the five-week outflow streaks of early 2026 and early 2025. So institutions have pulled cash longer than at any point, since the ETF inception.


The scary call leans on one more link, the bond between Bitcoin and stocks.
Bitcoin’s correlation with the S&P 500 sits at 0.468 over six months, a moderate positive reading. Correlation measures how closely two assets move, where 1.0 is lockstep. So a deep stock selloff would likely pull Bitcoin down with it.

A six-week streak sounds alarming on its own. But a closer Bitcoin price trend analysis shows the red flag already losing force.
Why a 50% Stock Crash Looks Unlikely for Now
The outflows are already shrinking. Weekly redemptions fell from $1.72 billion on June 5 to about $227 million by June 18. So the institutional exit is losing steam, even as the streak holds.
Want more token insights like this? Sign up for Editor Harsh Notariya’s Daily Crypto Newsletter here.
The crash condition is the bigger hurdle. A 50% drop would be a rare, 2008-scale event, not a routine pullback. Deep crashes usually need a recession or an earnings slump. Analysts still expect S&P 500 earnings to grow this year, which argues against one.
Analyst Benjamin Cowen sees the cycle bottom most likely around October 2026, not an imminent collapse. An early, deeper bottom would need capitulation well beyond past norms. BTC today has held up better than a doom call suggests.
A short-term stock market wobble is still possible, after JPMorgan flagged a $165 billion quarter-end stock market selloff. And BTC’s correlation with equities can lead to a substantial hit. Yet, the market positioning shows limited room for a cascade-like Bitcoin prediction.
Bitcoin Liquidation Map Shows a Deeper Short Bias
A liquidation map shows where leveraged bets would be wiped out at each price. On Binance, long liquidation leverage sits near $2.41 billion. That trails short liquidation leverage near $3.01 billion.

So a fall would still burn longs, but the heavier pile sits on the short side above price. That setup means a rebound could squeeze shorts harder than a dip could squeeze longs. A short squeeze happens when rising prices force shorts to buy back. The bigger forced move points up, not down.
The steadiest holders appear to agree with that calmer read, ensuring spot support.
Why Bitcoin’s Most Patient Holders Are Buying the Fear
The strongest counter comes from the holders with the most to lose. Bitcoin long-term holder net position change tracks whether wallets held at least 155 days are adding or shedding coins. That reading fell to a low near 30,885 BTC on June 11. By June 21 it had more than doubled to about 79,298 BTC.

So the most patient owners are buying into the weakness, not running from it. Therefore, it is hard to square that with a collapse that deep. For anyone asking whether Bitcoin is a good investment after such a scary headline, that behavior is the tell.
This is where the Bitcoin prediction meets its limits. The figure has spread across Bitcoin news this week, yet it needs a 50% stock crash that few expect.
The post Bitcoin’s 6-Week ETF Exodus Fuels a Scary New Prediction appeared first on BeInCrypto.

Key Takeaways
- Michael Saylor shared a suggestive “Looks better with more dots” post on X, signaling a potential new Bitcoin acquisition by Strategy
- The firm just acquired 1,587 BTC valued at approximately $100 million, pushing its total reserves to 846,842 BTC
- A small 32 BTC transaction earlier in the month raised questions, though Blockstream’s Adam Back dismissed bearish interpretations
- JPMorgan analysts project Strategy’s Bitcoin acquisitions could total around $32 billion throughout 2026
- Bitcoin surged past $64,000 amid positive sentiment surrounding scheduled US-Iran diplomatic discussions in Switzerland
Michael Saylor has once again ignited speculation across crypto social media. The Strategy chairman shared a brief post on X featuring the firm’s iconic Bitcoin acquisition tracker, with a simple caption: “Looks better with more dots.”
For those monitoring Strategy’s movements, the pattern is familiar. Saylor has deployed similar messaging before revealing additional Bitcoin acquisitions, and the dot visualization represents each individual purchase the corporation has executed. The crypto community interpreted it as a clear indicator.
This suggestive message emerged mere days following Strategy’s confirmation of acquiring 1,587 BTC for approximately $100 million, elevating their cumulative position to 846,842 BTC. This positions Strategy as overwhelmingly the world’s premier corporate Bitcoin accumulator.
The acquisition came on the heels of an unexpected 32 BTC transaction earlier this month. For an organization fundamentally committed to perpetual Bitcoin holding, even a minimal sale generated considerable attention.
Strategy characterized it as a procedural verification. Blockstream CEO Adam Back dismissed concerns during a Bloomberg appearance, explaining the transaction demonstrated the firm’s capability to leverage Bitcoin within standard treasury operations without indicating any strategic pivot.
JPMorgan’s Perspective on Future Moves
Not all observers share this calm assessment. JPMorgan highlighted that Strategy might need to maintain dollar liquidity to satisfy dividend commitments associated with its preferred equity. The apprehension centers on whether these dividend requirements could necessitate additional Bitcoin liquidations.
Nevertheless, the financial institution maintained its broader forecast regarding Strategy’s acquisition trajectory. JPMorgan estimated Strategy would allocate approximately $32 billion toward Bitcoin purchases throughout 2026.
Saylor directly addressed the company’s financial positioning this week. He emphasized that Strategy’s combined Bitcoin and cash assets now approximately equal its $48 billion debt obligations, and that the firm has secured over $60 billion in fresh capital since 2022, channeling the majority into Bitcoin.
He referenced 2022, when Bitcoin traded around $20,000 and Strategy’s debt burden surpassed its asset values. The company’s equity declined from roughly $24 to $13 that year on a split-adjusted basis. His emphasis was that current circumstances represent a fundamentally different landscape.
Geopolitical Developments Lift Bitcoin
Bitcoin’s price movement has simultaneously captured market attention. The cryptocurrency had retreated and was hovering near $64,000 before reports emerged that Iran confirmed participation in discussions with US representatives in Switzerland. The negotiations, initially scheduled for June 19, faced postponement but are now proceeding, with Qatar and Pakistan facilitating.
Optimism regarding a potential diplomatic resolution propelled Bitcoin back beyond $64,000.
Saylor also leveraged this opportunity to advocate for cohesion within the Bitcoin ecosystem. In another X message he stated, “Bitcoiners agree on the 99% that matters,” contending that internal disagreements regarding technical vulnerabilities or quantum computing concerns shouldn’t eclipse the broader potential.
“The opportunity is bigger than the argument,” he stated.
At publication time, Strategy has not issued an official statement verifying a new acquisition. The corporation routinely submits regulatory filings with the SEC following any purchase, and investors are anticipating such documentation potentially early this week.


Bitcoin peaked at over $126,000 last October, which now appears to be a lifetime ago since it trades below $65,000, representing a near 50% decline.
Although this sounds pretty painful, and it is, especially for those who entered at $120,000+, the reality might be more positive. Here’s why.
Is BTC Doing Better?
While most analysts are still focused on determining whether the cryptocurrency has bottomed yet or there’s another leg down in the cards, Michaël van de Poppe noted that the asset holds the 200-Week Moving Average and “refuses to drop deeper.” Moreover, he believes there’s not enough sell pressure at the moment despite all the negative developments surrounding the broader market (and mostly BTC) ecosystem.
First, he mentioned the war in Iran. The conflict that started on February 28 was supposed to have finished by now following the initial reports and comments by Trump. Progress was seemingly made over the past week as the POTUS announced a deal with Iran, which both sides confirmed. However, they failed to sign it, and the negotiations in Switzerland reportedly broke down on Sunday. The Strait of Hormuz remains closed, and Trump is back to making big threats.
Second, van de Poppe outlined the growing industry fears about STRC – Strategy’s shares used to raise funds and buy more BTC. The shares trade well below their par level, and there are some speculations that Strategy could become this cycle’s FTX or at least would have to sell a significant portion of its bitcoin fortune.
Third, there are the massive net outflows from the spot Bitcoin ETFs. As we have repeatedly reported, investors are on a substantial selling spree, as the funds have ended in the red for six straight weeks, during which the cumulative total has declined by about $5 billion.
Lastly, the popular analyst highlighted the macroeconomic inflationary topic, as US inflation (and in many other regions) is increasing again, and there is a lack of rate cuts from the Fed. Furthermore, the central bank’s new Chairman remained highly hawkish after the most recent FOMC meeting.
We Are Done Already?
Given the aforementioned factors, BTC’s 50% drop from its top might not seem as bad as many think, especially since it has been able to hold above the $60,000 support. Consequently, van de Poppe noted that this is a sign that “we’re done already.” Additionally, he believes many altcoins are “showing resilience for the past month,” which is another “great” signal.
My thesis is:
If #Bitcoin holds the 200-Week MA and refuses to drop deeper, there’s clearly not enough sell pressure despite:
– Iran war
– STRC Michael Saylor doomposting about FTX
– Outflows of the ETF
– Macroeconomic inflationary topics and no rate cutsThat’s the sign that… https://t.co/nVCk9CMIsL
— Michaël van de Poppe (@CryptoMichNL) June 20, 2026
The post Unpopular Opinion: Bitcoin Faces Relentless Headwinds, Yet It Refuses to Break appeared first on CryptoPotato.
Taiko, an Ethereum layer-2 network, has asked users to immediately withdraw any assets held on bridges connected to its ecosystem after it confirmed a compromise affecting a core verification component. The incident follows a run of high-profile decentralized finance (DeFi) exploits in June, with DeFiLlama reporting at least 23 hacks across the sector so far this month.
In an update posted to X on Monday, Taiko said it “confirmed a compromise of Taiko’s chain state verification mechanism,” adding that the security assumptions underlying all bridges deployed on Taiko “can no longer be relied upon.” The team urged users to “withdraw their funds from all bridges deployed on Taiko immediately.”
Key takeaways
- Taiko has confirmed a compromise of its chain state verification mechanism and is treating bridge security guarantees as unreliable.
- Security firm Blockaid attributes the exploit to a bridge validation weakness that allowed fraudulent message proofs to be accepted.
- Estimated losses differ by analyst: Blockaid suggested at least $1 million, while others put the figure as high as $1.7 million.
- Blockchain monitoring tools show the exploiter moving value, with Arkham reporting roughly $1.5 million in ETH in associated wallets.
- The incident adds to a June cluster of major DeFi breaches, including losses tied to Humanity Protocol and Syscoin Bridge earlier this month.
Taiko warns bridge users after verification compromise
The warning is aimed specifically at bridge risk rather than at general activity on Taiko itself. Taiko framed the problem as a breach in how it verifies chain state and validates the messages bridges rely on to release assets on the other side.
Taiko also said it was coordinating with partners to contain the issue and that it had paused affected systems, signaling that bridge operations tied to the compromised verification path may require additional remediation before normal user withdrawals resume.
For users, the practical implication is straightforward: bridges are designed to move funds across trust boundaries, and if the verification assumptions behind those bridges fail, withdrawals become time-sensitive. Taiko’s instruction to withdraw immediately reflects that risk assessment.
Why the exploit worked, according to Blockaid
Blockaid said the root cause appeared to be a flaw in how the Taiko bridge validated source signals. In its explanation, the issue centered on message proofs: proofs were reportedly accepted as valid on Ethereum even when they lacked corresponding legitimate proofs on Taiko.
Blockaid described how this could let an attacker register and later retrieve fraudulent bridge messages, enabling unauthorized asset releases from an ERC20 vault. That mechanism matters because it points to a verification mismatch rather than, for example, a simple smart-contract logic error limited to a single bridge instance.
Blockaid estimated that at least $1 million was stolen, while other analysts pointed to a higher potential value. PeckShield and Lookonchain suggested the amount taken could reach about $1.7 million.
Stolen funds, wallet activity, and token transfer signals
PeckShield reported that the exploiter had already transferred 1.99 million Taiko (TAIKO) tokens—worth around $189,000 at the time of reporting—to MEXC.
PeckShield’s wallet-tracking aligns with broader on-chain monitoring. Arkham’s explorer data, as cited in the report, shows exploiter-linked wallets holding roughly $1.5 million, primarily in Ether (ETH). The presence of significant ETH balances is relevant for traders and investigators because it suggests the attacker may hold liquidity that can be deployed across exchanges or other swaps, depending on operational intent and timing.
Separately, CoinGecko data cited in the source notes TAIKO was trading down sharply versus its 2024 peak—an indication of broader market repricing for the token, though the article does not connect that move causally to this specific exploit.
June’s exploit tally keeps rising
Taiko’s incident arrives during a busy stretch for crypto security. DeFiLlama data, cited in the report, indicates at least 23 decentralized finance exploits this month.
The Taiko hack follows other notable breaches in June, including:
- Humanity Protocol, which reportedly lost over $30 million earlier in the month
- Syscoin Bridge, reported losses of about $8 million
- A Secret Network smart contract exploit discovered on Friday, resulting in theft valued at $4.67 million
- An alleged drainage of around $1.1 million from a PancakeSwap liquidity pool involving OLPC/LABUBU
The accumulation of these events matters because it highlights a recurring sector vulnerability: the bridge and cross-chain messaging layer is repeatedly targeted. Even when individual hacks differ in technical cause, the economic effect is similar—assets can be released or transferred when the conditions that should validate legitimacy fail.
For users, the repeated pattern makes operational guidance more important than ever. When bridge operators issue emergency withdrawals—like Taiko did—investors and liquidity providers should treat it as a risk-management instruction rather than a routine status update.
Looking ahead, readers should watch for Taiko’s next technical briefing on what must change for bridges to be considered safe again, whether affected systems remain paused long-term, and how quickly analytics firms confirm the final scope of stolen funds as attacker wallets are tracked and assets move.
TLDR
- ETH currently trades around $1,731, hovering near price points first reached in March 2021
- Market analyst Ali Martinez identifies $1,060 as critical downside support if current levels fail
- Bulls eye $2,850 and $4,630 as primary upside objectives, though $1,960 represents immediate resistance hurdle
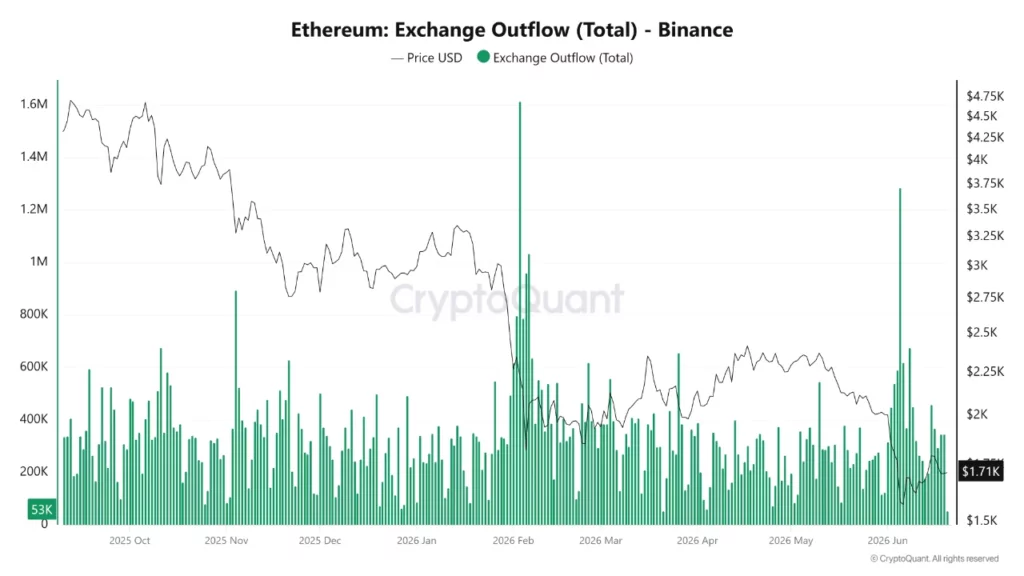
- June 2026 witnessed significant Binance withdrawal activity, indicating holders relocating ETH to private wallets
- Corporate accumulator Bitmine has amassed 5.54 million ETH, representing approximately 4.58% of circulating tokens
After half a decade of market turbulence, Ethereum finds itself in a remarkable position: essentially unchanged from its March 2021 valuation. This reality has become a focal point for market participants monitoring the critical $1,700 price region.

At press time, ETH changed hands at $1,731, registering a modest 0.48% gain across the previous 24-hour period. Daily price action ranged from $1,708 to $1,742. The digital asset remains remarkably close to its March 2021 valuation despite experiencing multiple dramatic bull cycles and prolonged bear markets in between.
Market commentator Ali Martinez highlighted this stagnation bluntly: “A $10,000 investment made five years ago would still be worth approximately $10,000 today.” Martinez emphasized that “severe volatility, explosive bull runs, and deep bear-market liquidations” have ultimately resulted in “zero net gains from that baseline.”
This historical backdrop influences current trading strategies significantly. Market participants prioritize technical price levels over fundamental narratives.
Technical analyst Daan Crypto identified $1,750 as a crucial battleground for near-term momentum. In his assessment of $ETH shared on X, he stated: “That $1750 level is pivotal for me to determine the short term strength. If price can’t manage to retake it, then that’d be a sign of weakness.” His analysis observed that ETH struggled to sustain momentum after briefly piercing above February peaks, though another attempt appeared underway.
Critical Price Zones Under Scrutiny
Technical charting reveals ETH positioned beneath a notable price gap around $1,709.50. Should prices retrace to fill this void before stabilizing, bulls could establish a more solid foundation. Failure to maintain $1,700 would likely shift attention toward $1,650 as the subsequent support target.
Looking upward, $1,960 emerges as the primary resistance barrier on monthly timeframes. ETH has yet to achieve a monthly close exceeding this threshold. Successfully breaching $1,960 would establish a runway toward $2,850. Beyond that zone, $3,740 and $4,630 represent subsequent objectives. According to Trader Symba’s extended-term charting analysis, a breakout above $4,862 could theoretically target $10,000.
The MACD histogram currently reads positive at 21.25, with the MACD line positioned above its signal counterpart. Nevertheless, both metrics remain in negative territory. Meanwhile, the RSI registers 40.45, surpassing its moving average though staying beneath the neutral 50 threshold. These technical indicators have not yet confirmed a definitive trend reversal.
Corporate Accumulation and Exchange Withdrawal Patterns
Blockchain metrics indicate substantial withdrawal activity from Binance during June 2026 while Ethereum traded near $1,710. CryptoQuant analyst Rei Researcher documented this movement, observing substantial ETH volumes departing the trading platform. Reduced exchange balances typically correlate with diminished immediate selling pressure.
In parallel developments, corporate entity Bitmine has accumulated more than 1.4 million ETH since December 2025. The institution’s current ETH holdings total 5.54 million tokens, valued at approximately $9.40 billion. This cache constitutes 4.58% of available supply, placing the organization at 91.7% completion toward its announced objective of controlling 5% of all circulating Ethereum.
Ethereum’s aggregate market capitalization continues exceeding $200 billion, securing its position among cryptocurrency’s largest assets by valuation.

For decades, financial products have been designed and distributed through centralized institutions such as banks, brokerages, insurance companies, and payment processors. While these institutions have played a vital role in global economic growth, they often operate within systems that can be slow, costly, exclusive, and opaque.
Decentralized Finance (DeFi) is challenging this traditional model by introducing an open, programmable, and transparent financial ecosystem powered by blockchain technology. Rather than relying on intermediaries, DeFi enables financial services to be delivered through smart contracts that execute automatically according to predefined rules.
This raises an important question: Can DeFi build better financial products than traditional finance?
The answer depends on how we define “better.” If accessibility, transparency, efficiency, and innovation are the criteria, DeFi has already demonstrated significant advantages. However, challenges remain before it can fully replace traditional financial systems.
What Makes a Financial Product “Better”?
A high-quality financial product should ideally possess several characteristics:
- Accessibility for a broad range of users
- Low costs and efficient execution
- Transparency and trustworthiness
- Security and reliability
- Flexibility to meet diverse user needs
- Innovation that creates new opportunities
Traditional financial institutions often struggle to optimize all of these factors simultaneously because they operate within complex regulatory frameworks and legacy infrastructure.
DeFi offers a different approach.
DeFi’s Key Advantage: Programmability
One of the most transformative features of DeFi is that financial products become programmable.
Smart contracts allow developers to create financial services that automatically execute predefined actions without requiring manual approval from banks or financial institutions.
Examples include:
- Automated lending and borrowing platforms
- Decentralized exchanges
- Yield-generating savings products
- Synthetic assets
- Prediction markets
- Insurance protocols
Because these products are built from code, they can evolve faster than traditional financial offerings and often introduce entirely new financial mechanisms.
Greater Accessibility and Financial Inclusion
Traditional finance excludes billions of people worldwide due to geographic, economic, or bureaucratic barriers.
Opening a bank account may require:
- Government-issued identification
- Minimum deposits
- Credit history
- Access to banking infrastructure
DeFi significantly lowers these barriers.
Anyone with:
- An internet connection
- A crypto wallet
- Digital assets
can access a wide range of financial services.
This accessibility creates opportunities for individuals in underserved regions to participate in global financial markets without needing permission from centralized institutions.
In many cases, DeFi products are available 24 hours a day, seven days a week, regardless of location.
Transparency Creates Trust
Traditional financial systems often operate behind closed doors.
Users rarely have complete visibility into:
- How funds are managed
- Risk exposure
- Liquidity positions
- Operational processes
DeFi operates differently.
Transactions, smart contracts, and protocol reserves are generally visible on public blockchains.
Users can verify:
- Total value locked (TVL)
- Lending activity
- Liquidity pool balances
- Protocol revenue
- Governance decisions
This transparency reduces information asymmetry and allows participants to make more informed decisions.
Lower Costs Through Automation
Financial intermediaries add value, but they also add costs.
Banks, payment processors, clearing houses, brokers, and custodians each introduce fees and operational overhead.
DeFi replaces many of these functions with automated smart contracts.
Potential benefits include:
- Reduced transaction costs
- Faster settlement times
- Lower operational expenses
- Fewer intermediaries
For example, cross-border transfers that may take days in traditional finance can often be completed within minutes through blockchain-based systems.
Innovation Through Composability
A unique feature of DeFi is composability.
Developers often describe DeFi as “money legos” because protocols can interact with one another.
A single application can combine:
- Lending protocols
- Decentralized exchanges
- Stablecoins
- Yield strategies
- Insurance solutions
This modular architecture accelerates innovation and enables developers to create entirely new financial products by integrating existing components.
Traditional finance generally lacks this level of interoperability and openness.
Better Yield Opportunities
DeFi has introduced new ways for users to earn returns on digital assets.
Examples include:
Lending
Users lend assets to borrowers and earn interest.
Liquidity Provision
Participants provide liquidity to decentralized exchanges and receive a portion of trading fees.
Staking
Users secure blockchain networks and earn rewards.
Yield Aggregation
Protocols automatically optimize capital allocation across multiple opportunities.
These mechanisms create a more competitive environment where capital can flow efficiently toward productive uses.
Personalized Financial Products
Artificial intelligence and DeFi are increasingly converging.
Future DeFi products may offer:
- Personalized lending rates
- Automated portfolio management
- AI-powered risk analysis
- Dynamic yield optimization
- Autonomous investment strategies
Because DeFi systems are programmable and open-source, customization can occur at a much greater scale than traditional finance.
This could lead to financial products tailored to individual needs rather than one-size-fits-all offerings.
Challenges That Still Need to Be Solved
Despite its advantages, DeFi is not without limitations.
Smart Contract Risk
Bugs or vulnerabilities can lead to significant financial losses.
Regulatory Uncertainty
Many jurisdictions are still developing frameworks for decentralized finance.
User Experience
Managing wallets, private keys, and blockchain transactions can be intimidating for newcomers.
Market Volatility
Crypto asset prices can fluctuate dramatically, creating additional risk.
Liquidity Fragmentation
Assets and liquidity are often spread across multiple blockchains and protocols.
Addressing these challenges will be essential for mainstream adoption.
The Future of Financial Products
Rather than completely replacing traditional finance, DeFi may evolve alongside it.
A hybrid future could emerge where:
- Banks integrate blockchain infrastructure
- Traditional assets become tokenized
- DeFi protocols provide backend financial services
- AI agents automate financial decision-making
- Global financial markets operate continuously
In this scenario, users benefit from both the security and regulatory protections of traditional finance and the efficiency and innovation of decentralized systems.
Conclusion
DeFi has already proven that financial products can be more transparent, accessible, programmable, and innovative than many traditional alternatives. Through smart contracts, open networks, and composable infrastructure, DeFi enables entirely new forms of lending, trading, investing, and wealth creation.
However, building better financial products is not solely about technology. Security, usability, regulation, and trust remain critical factors that DeFi must continue to improve.
The most likely outcome is not a world in which DeFi replaces traditional finance, but one in which decentralized technologies become a foundational layer of the global financial system. As the industry matures, DeFi has the potential to create financial products that are not only more efficient but also more inclusive and adaptable to the needs of a digital-first world.
REQUEST AN ARTICLE

Key Takeaways
- Altura has initiated the shutdown of its USDT stablecoin vault following more than $8.5 million in redemptions within a 24-hour period
- The vault’s total value locked had reached $39 million on HyperEVM prior to the mass withdrawal event
- Main Street’s msUSD stablecoin plummeted more than 70% from its peg following Accountable’s termination of verification services
- While Altura utilized Accountable as a verification partner, it maintained no direct financial ties to msUSD
- Altura’s CEO Ranveer Arora attributed the withdrawal spike to market panic and false information spreading online
The weekend of June 20-21 witnessed Main Street’s msUSD stablecoin plunge by over 70% from its dollar peg. The dramatic collapse followed Accountable’s sudden decision to terminate its proof-of-solvency services, citing Main Street’s failure to satisfy its verification requirements.
Accountable functions as a third-party verification mechanism that validates whether a protocol’s asset reserves align with its outstanding obligations. Its withdrawal triggered an immediate loss of investor confidence across connected platforms.
Altura had contracted with Accountable for the same verification services. Despite maintaining no financial exposure to msUSD or any of Main Street’s investment strategies, depositors rushed to withdraw funds without seeking clarification.
22% of Total Value Locked Vanished in 24 Hours
Within a single day, depositors pulled more than $8.5 million in USDT from Altura’s vault. This represented approximately 22% of the platform’s total locked value disappearing virtually overnight.
The vault operated on the ERC-4626 standard architecture. Depositors contributed USDT in exchange for proportional vault shares. Altura then allocated these assets across various strategies including funding-rate arbitrage operations, market-making activities, and real-world asset investments.
Withdrawal mechanisms offered depositors flexibility. They could choose immediate redemption with a 0.1% processing fee, or opt for epoch-based withdrawals without any charges.
On June 21, CEO Ranveer Arora announced via X that Altura would begin shutting down the vault. He emphasized that this proactive measure aimed to safeguard depositor assets and facilitate orderly redemptions, preventing a full-scale bank run situation.
“Our priority remains the protection of user capital and ensuring all redemptions are completed in a fair, transparent, and efficient manner,” Arora wrote.
CEO Challenges Spread of False Information
Arora voiced his disappointment regarding what he characterized as baseless rumors fueling user panic. He maintained that Altura has consistently prioritized transparency in its operations, and that the withdrawal surge resulted from speculation rather than substantiated concerns.
Prior to Arora’s personal statement, Altura’s official channels had already released a clarification confirming the protocol held zero direct exposure to Main Street or its msUSD stablecoin.
“Our HyperEVM lending vault, the associated USDT/AVLT market, and borrowers utilizing our Ethereum vault remain unaffected,” the protocol stated.
Altura notified all counterparties and business partners about the shutdown decision. The platform commenced liquidating positions across centralized exchanges, private credit arrangements, and real-world asset portfolios. According to company communications, certain positions may require extended timeframes for complete redemption.
Altura’s remaining product offerings, including its HyperEVM lending facility and Ethereum vault, continue functioning without disruption and were excluded from the wind-down process.
The Accountable incident highlighted a critical infrastructure weakness. Platforms depending on a single external entity for solvency attestation face concentrated risk exposure that can spark depositor panic even when their financial position remains fundamentally secure.
Key Highlights
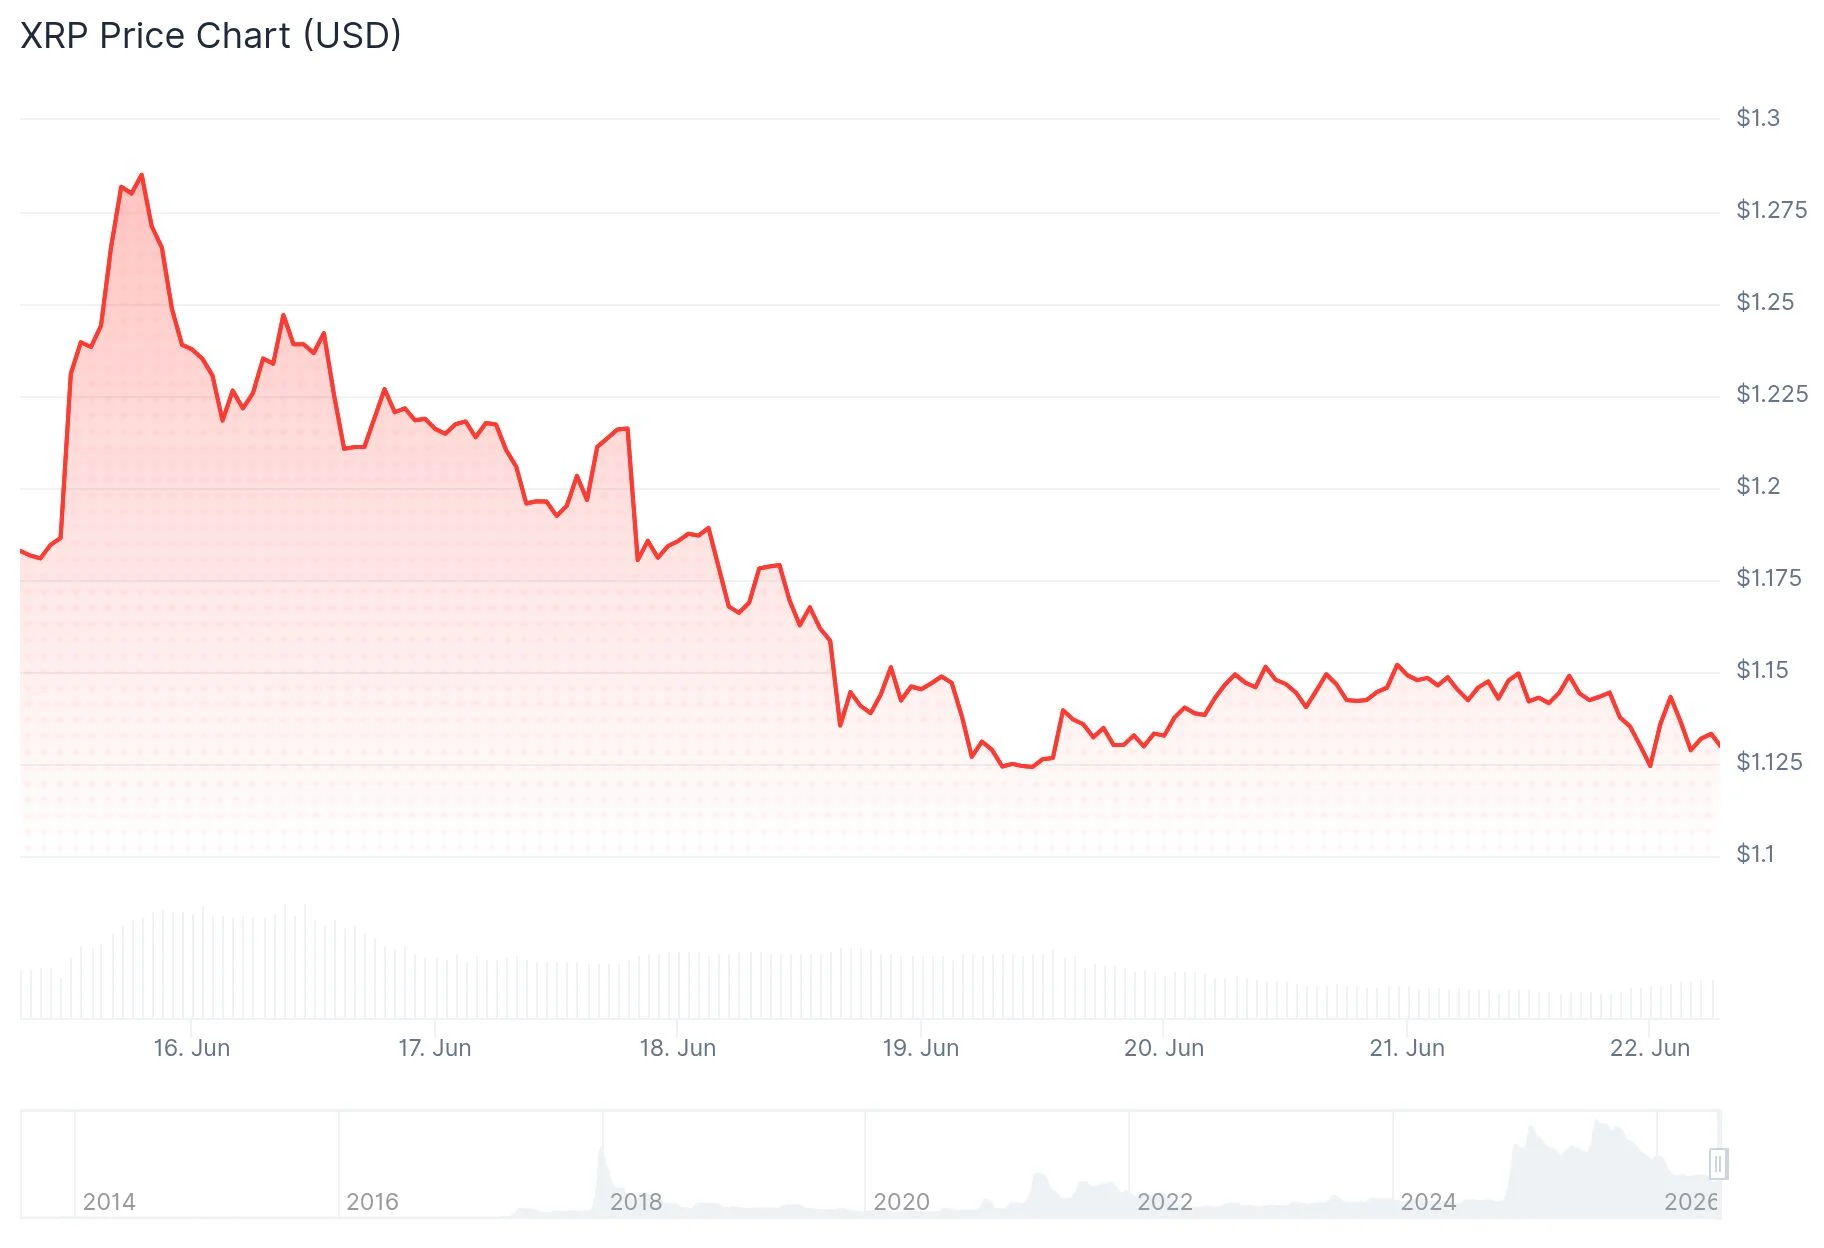
- XRP maintained trading activity around $1.14 during June 21–22, staying within the $1.10–$1.30 corridor
- Support at $1.10 held firm following a temporary decline to $1.12 accompanied by elevated trading volume
- Exchange-held XRP supply dropped to approximately 1.6 billion tokens, marking the lowest level in seven years
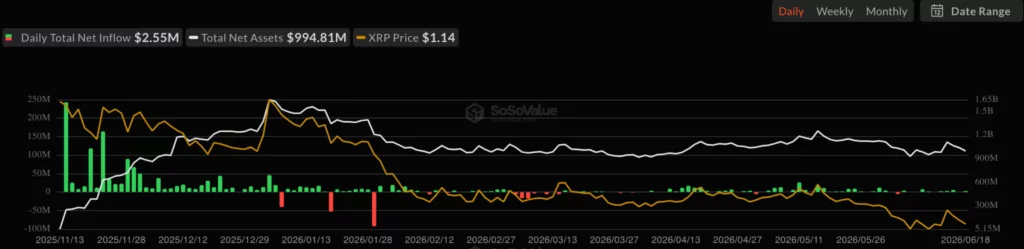
- Investment products tied to XRP attracted roughly $10.66 million in net capital during the weekly period
- Ripple advanced RLUSD integration through Mastercard infrastructure, African payment corridors, and AI-powered transaction systems
Throughout much of June 2026, XRP has exhibited constrained price movement, oscillating between $1.10 and $1.30. On June 21, the digital asset was valued at approximately $1.14, reflecting a modest 24-hour decline of -0.34%.

Daily trading volume registered around $872 million, while XRP’s total market capitalization remained near $70.97 billion. This valuation secured its position as the sixth-largest cryptocurrency by market cap.
The monthly perspective reveals more volatility. XRP has declined over 16% across the 30-day timeframe, despite recent evidence of demand at critical price thresholds.
On June 22, XRP experienced a brief downturn to approximately $1.12 during elevated trading activity. Near 21:00 UTC, transaction volume spiked to 85.8 million XRP, driving the asset to an intraday low around $1.1213.
Buyers responded rapidly to the dip. XRP rebounded toward $1.148, recovering nearly 80% of the session’s losses in a matter of hours.
The recovery encountered resistance between $1.147 and $1.149, establishing this zone as a near-term ceiling. The established range of $1.10 to $1.30 continues to define the current market structure.
Cryptocurrency analyst EGRAG CRYPTO shared technical analysis on X, characterizing the two-month price formation as “E is the battlefield.” The commentary emphasized that sustained defense of current levels is necessary before any meaningful upward movement can develop. EGRAG’s long-term cycle projections include targets ranging from $9.50 to $17.23, with $13 highlighted as a key milestone — though these levels remain distant while XRP trades beneath $1.20.
Developments in the Ripple Ecosystem
Ripple has maintained momentum across its product development and strategic partnership initiatives. The company extended RLUSD stablecoin integration into additional payment infrastructure and participated in Flutterwave’s Series E funding round to facilitate stablecoin adoption across African markets.
Ripple collaborated with Bitso on MXNB, a peso-denominated stablecoin operating on the XRP Ledger. Additionally, RLUSD achieved integration with Mastercard’s stablecoin settlement infrastructure.
The XRP Ledger introduced an AI Starter Kit designed to enable AI agents to execute automated transactions using XRP and RLUSD through the x402 protocol framework.
On-Chain Metrics and Investment Flows
XRP tokens held on centralized exchanges declined to approximately 1.6 billion — representing a seven-year low and roughly a 50% reduction from October 2025 levels. Reduced exchange-held supply can amplify price volatility when buying pressure emerges.
Institutional product flows remained constructive. XRP products generated approximately $10.66 million in net inflows during the week concluded June 18. Total cumulative inflows have now approached $1.45 billion.
Conversely, large holders distributed over 30 million XRP across a five-day window, while on-chain activity metrics softened during the corresponding period.
The CLARITY Act, legislation designed to establish clearer regulatory definitions for digital commodities, has advanced through committee stages and now awaits Senate floor consideration, requiring 60 votes for passage.
Exchange-held XRP reserves registered at approximately 1.6 billion tokens according to the latest available data, marking the lowest level recorded in seven years.
Following a period of heightened volatility in early June, investor attention in Ethereum has once again shifted towards institutional demand and the development of the spot ETF market in the United States. The funds launched last year continue to serve as one of the key channels for capital inflows into digital assets, while their daily flow statistics remain an important indicator of sentiment among major market participants. Expectations regarding the future direction of Federal Reserve monetary policy may also influence Ethereum’s price dynamics. Changes in interest-rate projections traditionally affect investors’ appetite for risk assets, including the cryptocurrency market.
Technical Picture
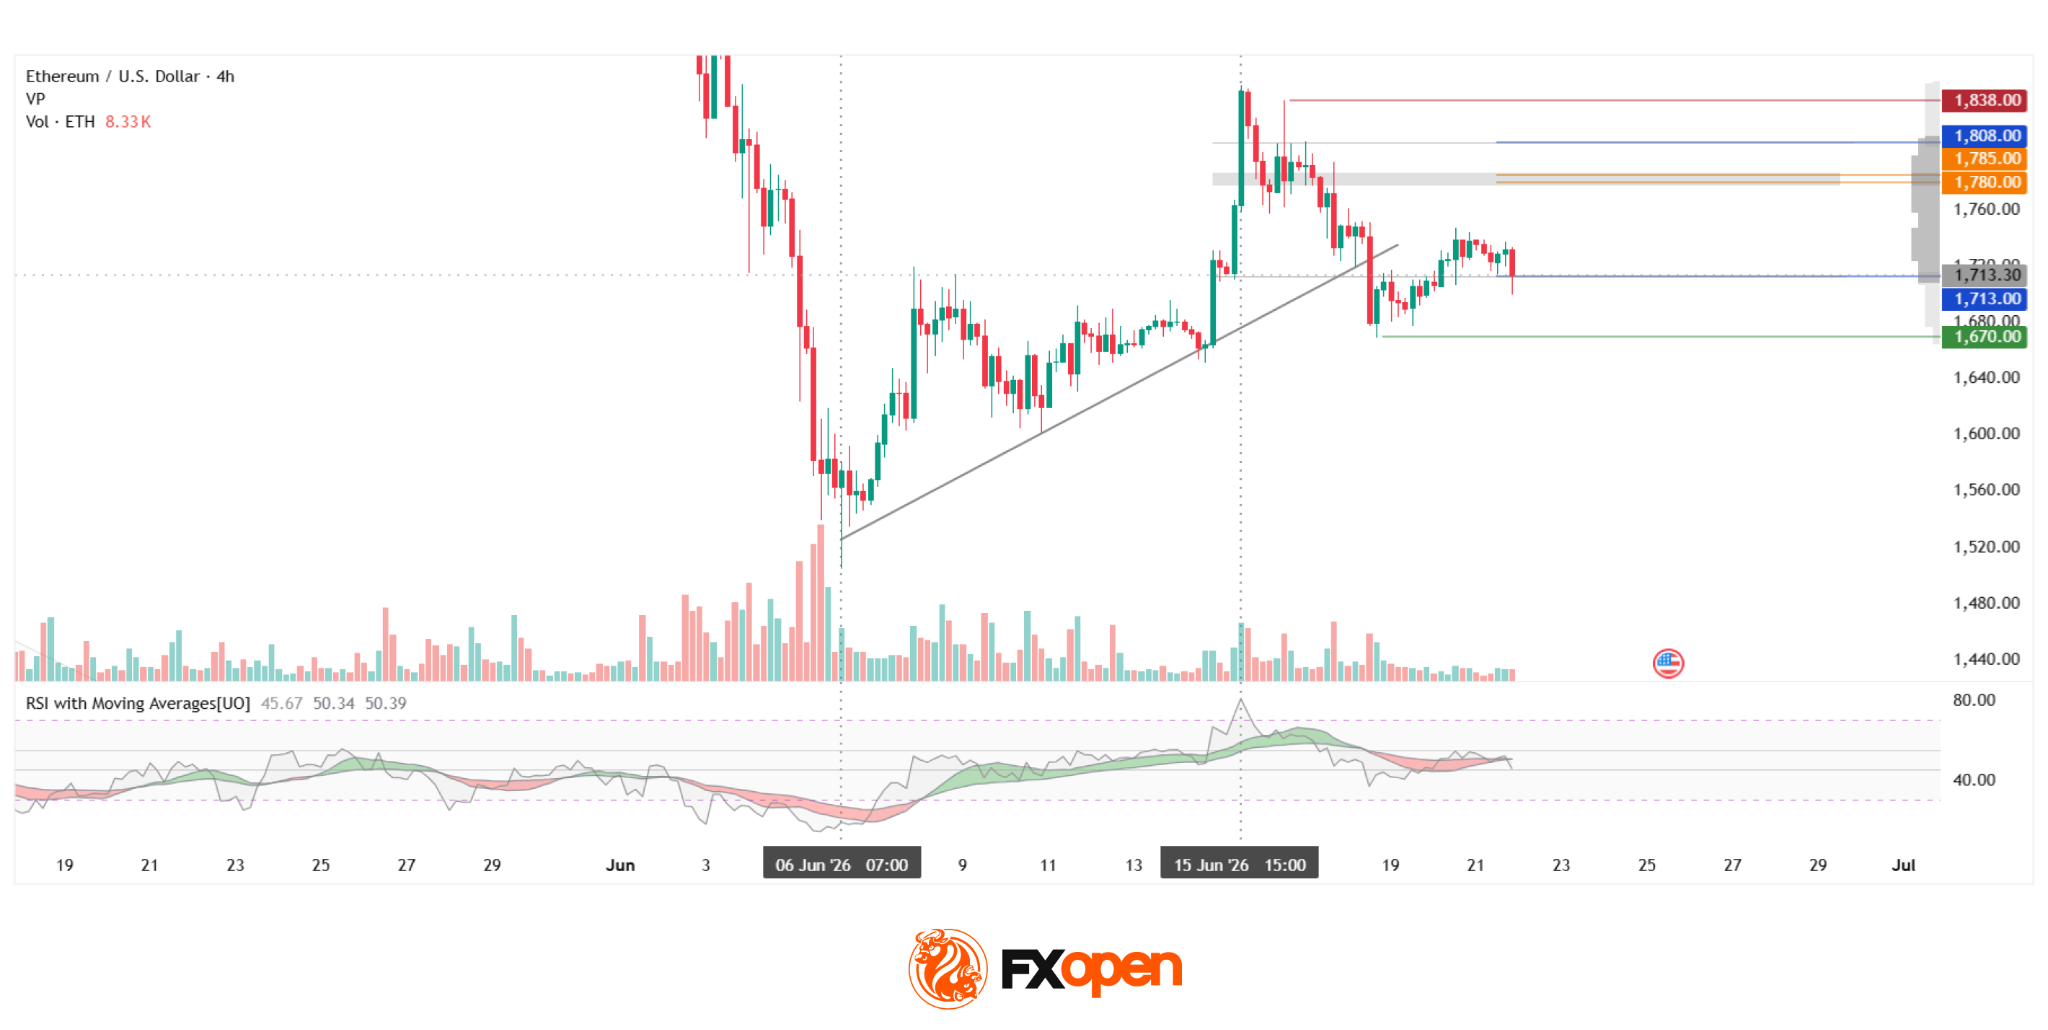
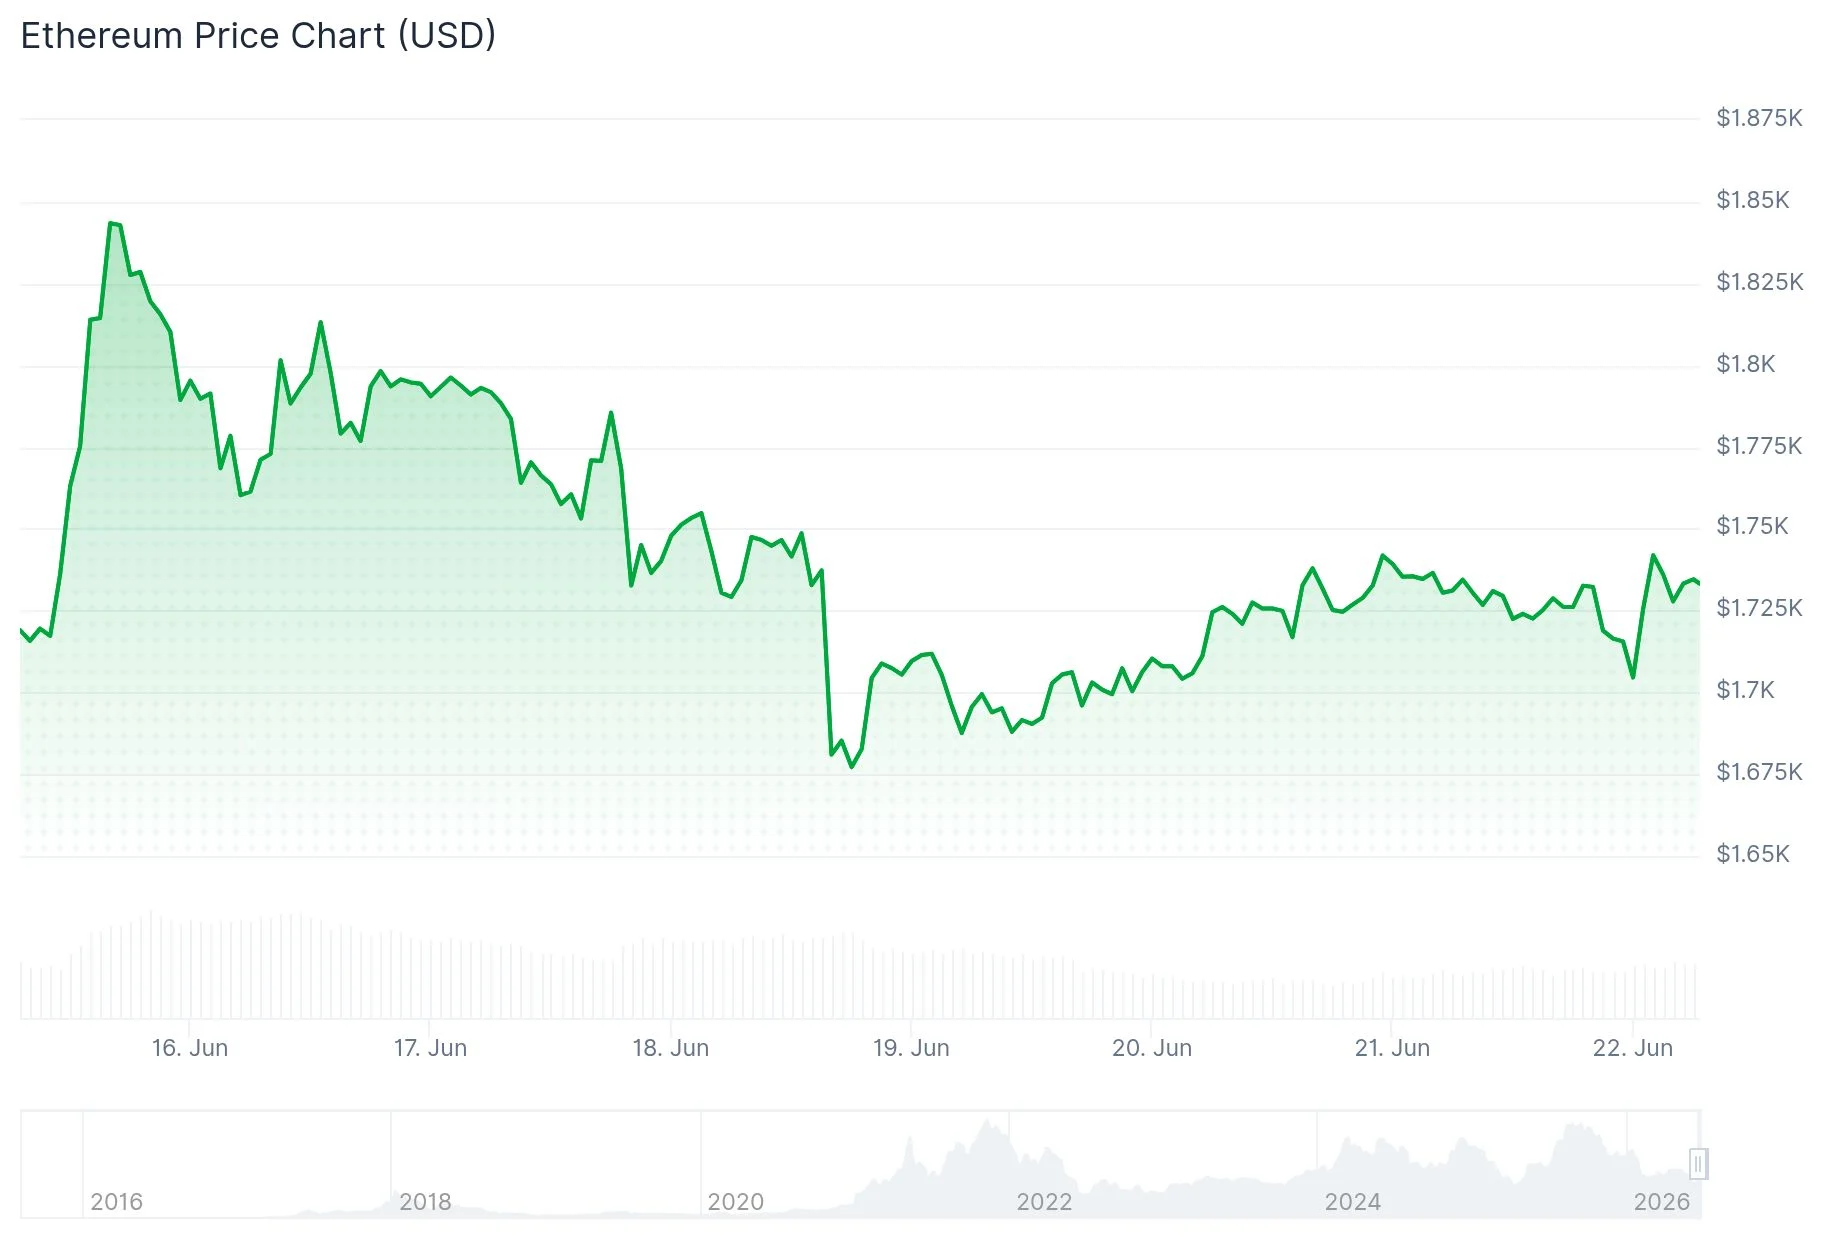
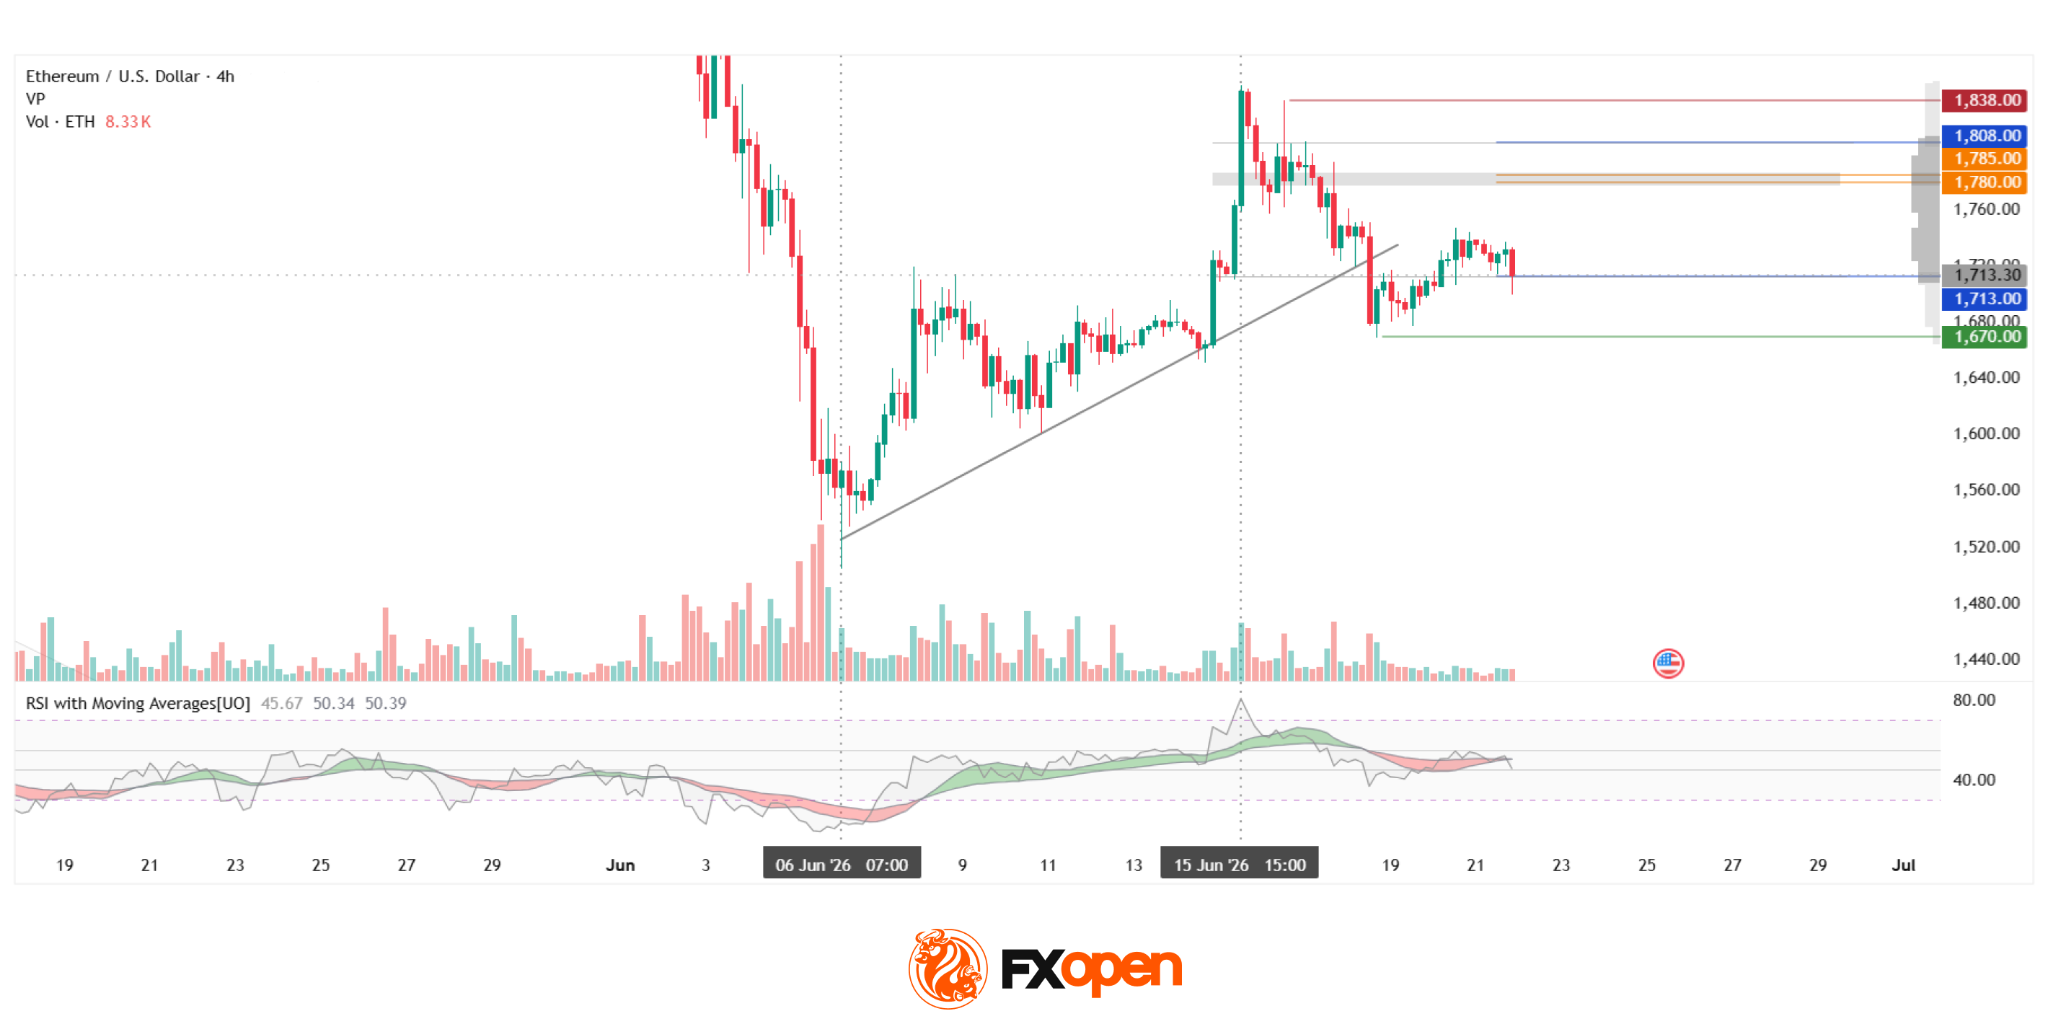
On the four-hour chart of ETH/USD, a corrective recovery can be observed from the June low, followed by the formation of a local high near the $1,838 resistance level. After reaching this area, buyers lost momentum and the price moved below the ascending trendline. The attempted trend break currently appears unconvincing and has so far been limited to a single bearish candle on 18 June, the impact of which was subsequently offset by the following candles.
Should selling pressure persist, the $1,670 area may come into focus for market participants. If the asset manages to establish itself above the lower boundary of the profile at $1,713 and continues its recovery within the current profile, the primary target could be the POC zone at $1,780–$1,785, followed by the upper boundary of the profile at $1,808. If the current profile density is overcome, the red resistance level may gain further significance. The RSI + MAs indicator shows readings of 46, 50 and 50. The main oscillator line and both moving averages remain in the middle of the neutrality zone, suggesting that the instrument currently has no clear directional bias.
Key Takeaways
Ethereum’s technical picture remains neutral, with RSI + MAs showing no signs of a clear directional impulse. In the coming weeks, additional volatility may be driven by capital flows into spot Ethereum ETFs and by changing expectations regarding the Federal Reserve’s next policy moves.
FXOpen offers the world’s most popular cryptocurrency CFDs*, including Bitcoin and Ethereum. Floating spreads, 1:2 leverage — at your service (additional fees may apply). Open your trading account now or learn more about crypto CFD trading with FXOpen.
*Important: At FXOpen UK, Cryptocurrency trading via CFDs is only available to our Professional clients. They are not available for trading by Retail clients. To find out more information about how this may affect you, please get in touch with our team.
This article represents the opinion of the Companies operating under the FXOpen brand only. It is not to be construed as an offer, solicitation, or recommendation with respect to products and services provided by the Companies operating under the FXOpen brand, nor is it to be considered financial advice.

It’s time to end the ‘cage age’ for egg-laying hens

Wyndham Clark hangs on to win second US Open in 4 years

ASUS Expands Chromebook Lineup in India With New CM14, CM15, and CM32 Models


-
 Crypto World7 days ago
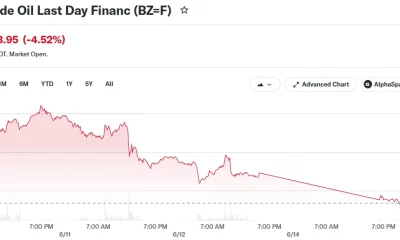
Crude Oil Plunges Over 4% as US-Iran Agreement Reopens Hormuz Strait
-

 Tech6 days ago
The Adder At The Heart Of Intel’s 8087 FPU
-

 Fashion3 days ago
Weekend Open Thread: Miami – Corporette.com
-
 Business2 days ago
Wall Street Week Ahead: Investors see Micron earnings as pulse check of AI rally momentum
-

 Crypto World2 days ago
HIVE shares jump as $220M AI deal speeds Bitcoin mining pivot
-

 Sports3 days ago
FIFA World Cup 2026: Canada beat 9-men Qatar 6-0 to register first ever win | FIFA World Cup 2026
-

 Crypto World2 days ago
Jake Chervinsky accuses CME of protecting derivatives monopoly
-

 Business1 day ago
MHP SE 2026 Q1 – Results – Earnings Call Presentation (OTCMKTS:MHPSY) 2026-06-20
-

 Crypto World4 days ago
Anthropic’s Dario Amodei Urged AI Unity at G7, Even as US Banned His Models
-

 Business3 days ago
Brexit cost 6% of UK economy, Bank of England company data suggests
-

 Business1 day ago
Soccer-U.S. defends Iran World Cup travel restrictions, says discussions ongoing
-
 Crypto World2 days ago
Can Charles Hoskinson Really Rescue Cardano?
-

 Tech5 days ago
Weeks Of In-The-Field Testing And A Verdict
-

 Politics2 days ago
Andy Burnham and the meaning of Makerfield
-

 Tech4 days ago
Adobe adds its AI assistant to Premiere, Illustrator and InDesign
-
 Crypto World4 days ago
Iren (IREN) Stock Surges on Jefferies Buy Rating: AI Infrastructure Play Gains Momentum
-

 Entertainment1 day ago
Renter of Home in Anne Heche Crash Denies Settlement With Son
-

 Politics4 days ago
BBC Reporter Discusses Cross Party Criticism Of Trumps Iran Deal
-

 Tech3 days ago
Instagram Now Lets You Add A Unique Caption To Each Carousel Slide
-

 News Videos3 days ago
Nightcore – MONEY ON THE DASH (Soft Rock Version) (Lyrics)
You must be logged in to post a comment Login