
Crypto World
Was The 40% Rally A Retail Trap?
Uniswap price is up around 3% over the past 24 hours, trading near $3.40. But this small move hides what really happened on February 11. That day, UNI surged nearly 42% to a high near $4.57 after news linked Uniswap to BlackRock’s tokenized fund expansion.
Since then, sellers have erased about 26% of that rally. This raises a key question: was this institutional-driven breakout a real trend shift, or a trap for retail buyers?
Uniswap Price Breakout on February 11 Was Driven by Retail Momentum
The rally on February 11 did not happen randomly.
Sponsored
Sponsored
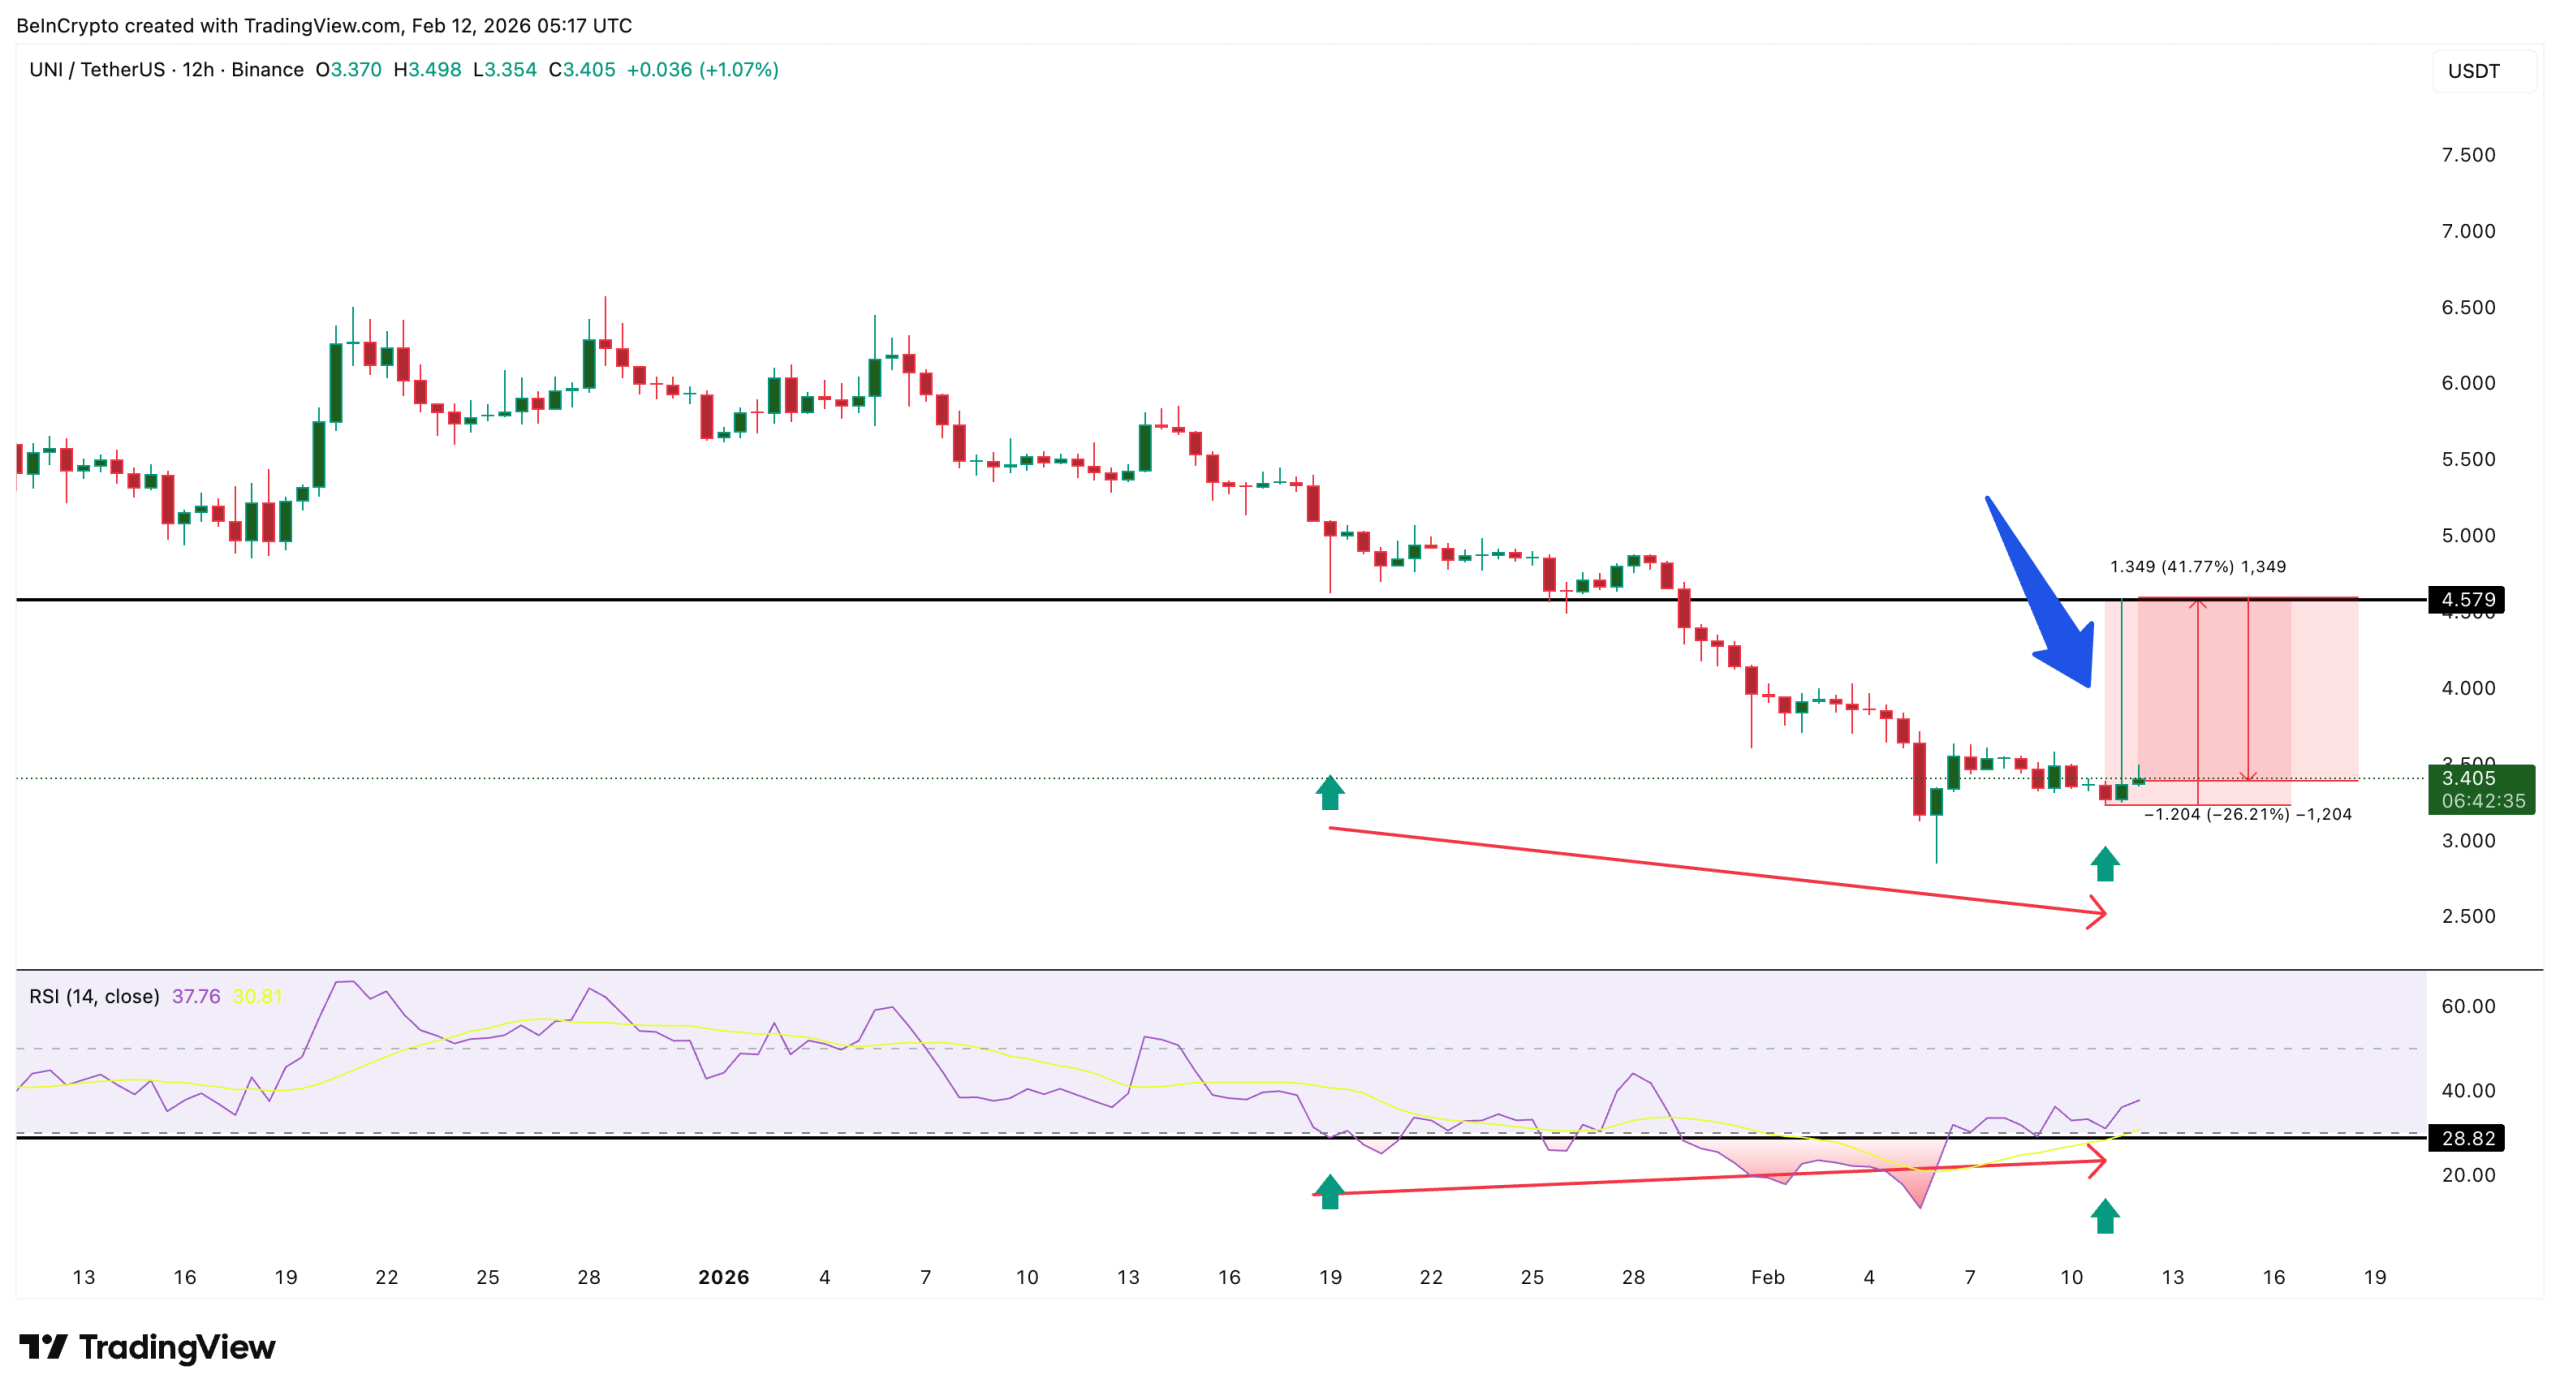
On the 12-hour chart, Uniswap price had been forming a bullish setup since mid-January. Between January 19 and February 11, UNI made lower lows while the Relative Strength Index, or RSI, made higher lows. RSI measures momentum by tracking buying and selling strength. When price falls, but RSI rises, it signals a bullish divergence, often warning that selling pressure is weakening.

Want more token insights like this? Sign up for Editor Harsh Notariya’s Daily Crypto Newsletter here.
This divergence suggested that a rebound was building.
That signal was confirmed on February 11. On that day, On-Balance Volume, or OBV, broke above a long-term descending trendline. OBV tracks whether volume is flowing into or out of an asset. When OBV breaks upward, it usually shows growing retail participation. The timing was important.
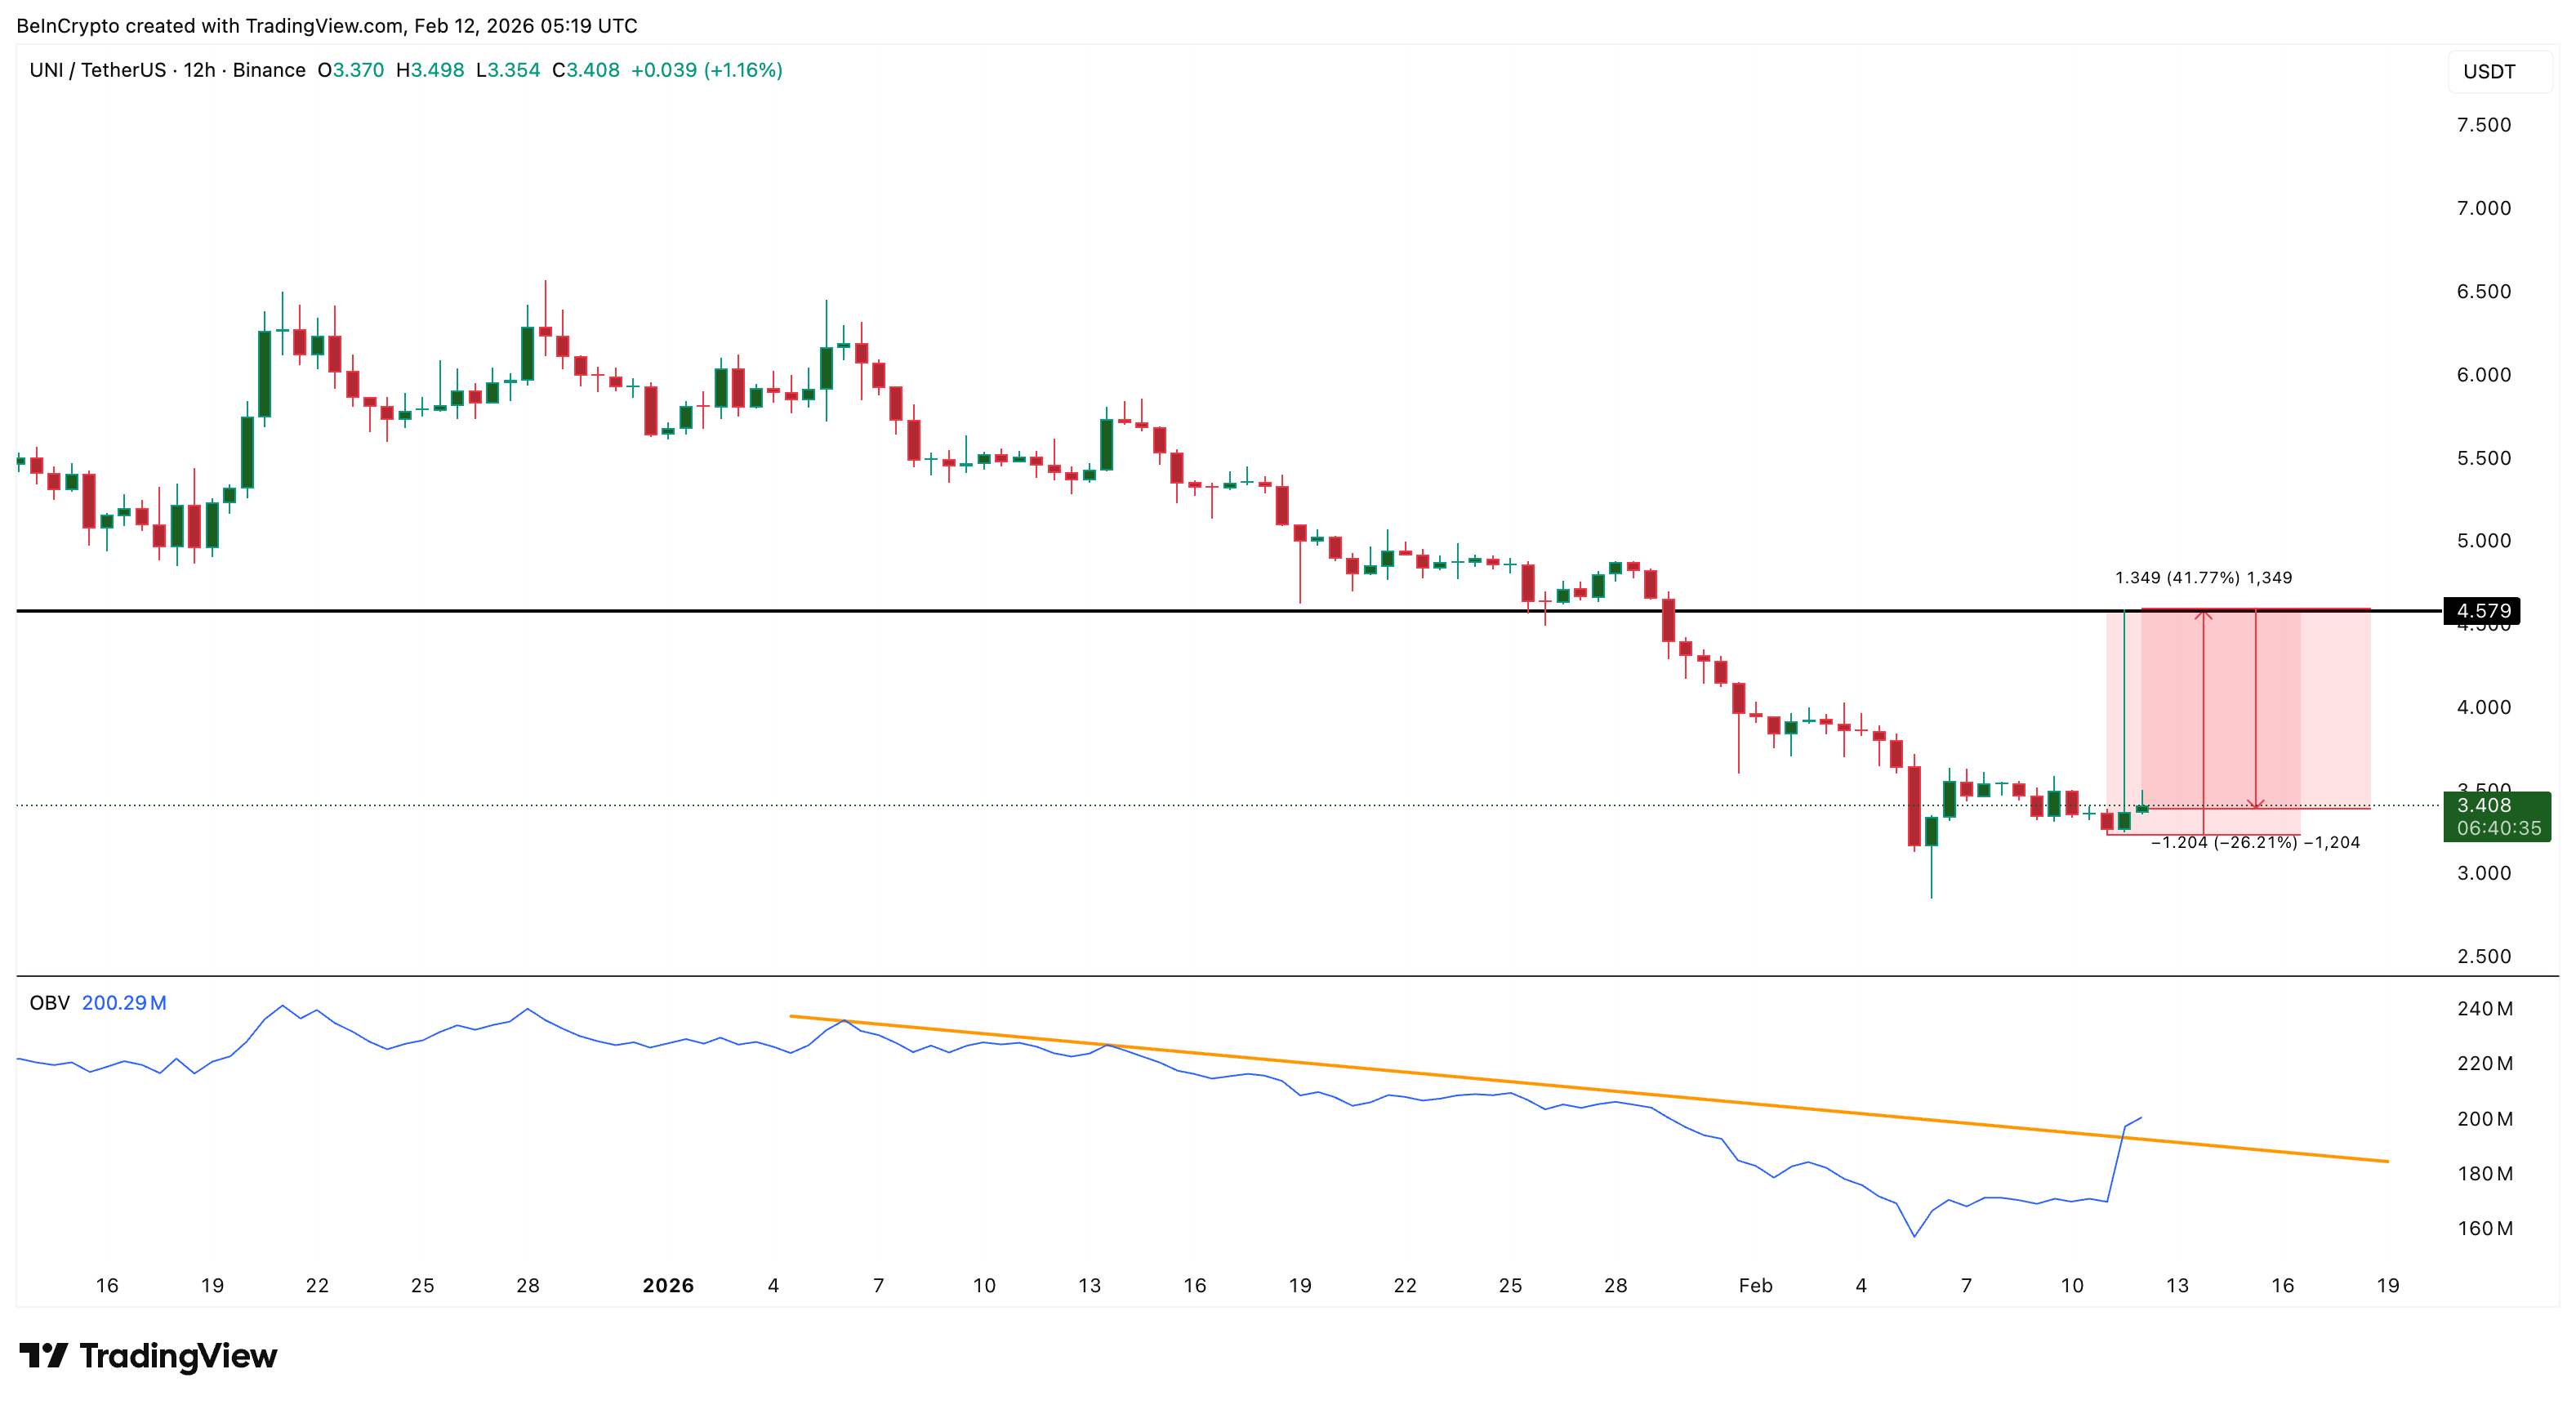
RSI divergence had been in place for weeks. OBV only broke out on February 11, exactly when the BlackRock-linked news hit the market. This shows that retail traders reacted aggressively to the headline, rushing into UNI.
Sponsored
With momentum and volume aligned, the Uniswap price surged to around $4.57 in a single session. But the structure of that candle raised early warning signs.
On the 12-hour chart, the breakout candle formed with a very long upper wick and a small body. This means buyers pushed the price higher, but sellers absorbed most of the move before the close. It was the first sign that a strong supply existed near $4.50. The rally looked powerful. But distribution had already started.
Whale Selling Near $4.57 Explains the Sharp Rejection
The long wick on February 11 was not driven by random selling. Whale data shows who was responsible.
On that day, supply held by large Uniswap holders dropped sharply from about 648.46 million UNI to 642.51 million UNI. That is a reduction of roughly 5.95 million tokens. At prices near $4.57, this represents selling pressure worth about $27 million.
This was not profit-taking by small traders. It was a coordinated distribution by large wallets.
Sponsored
Sponsored
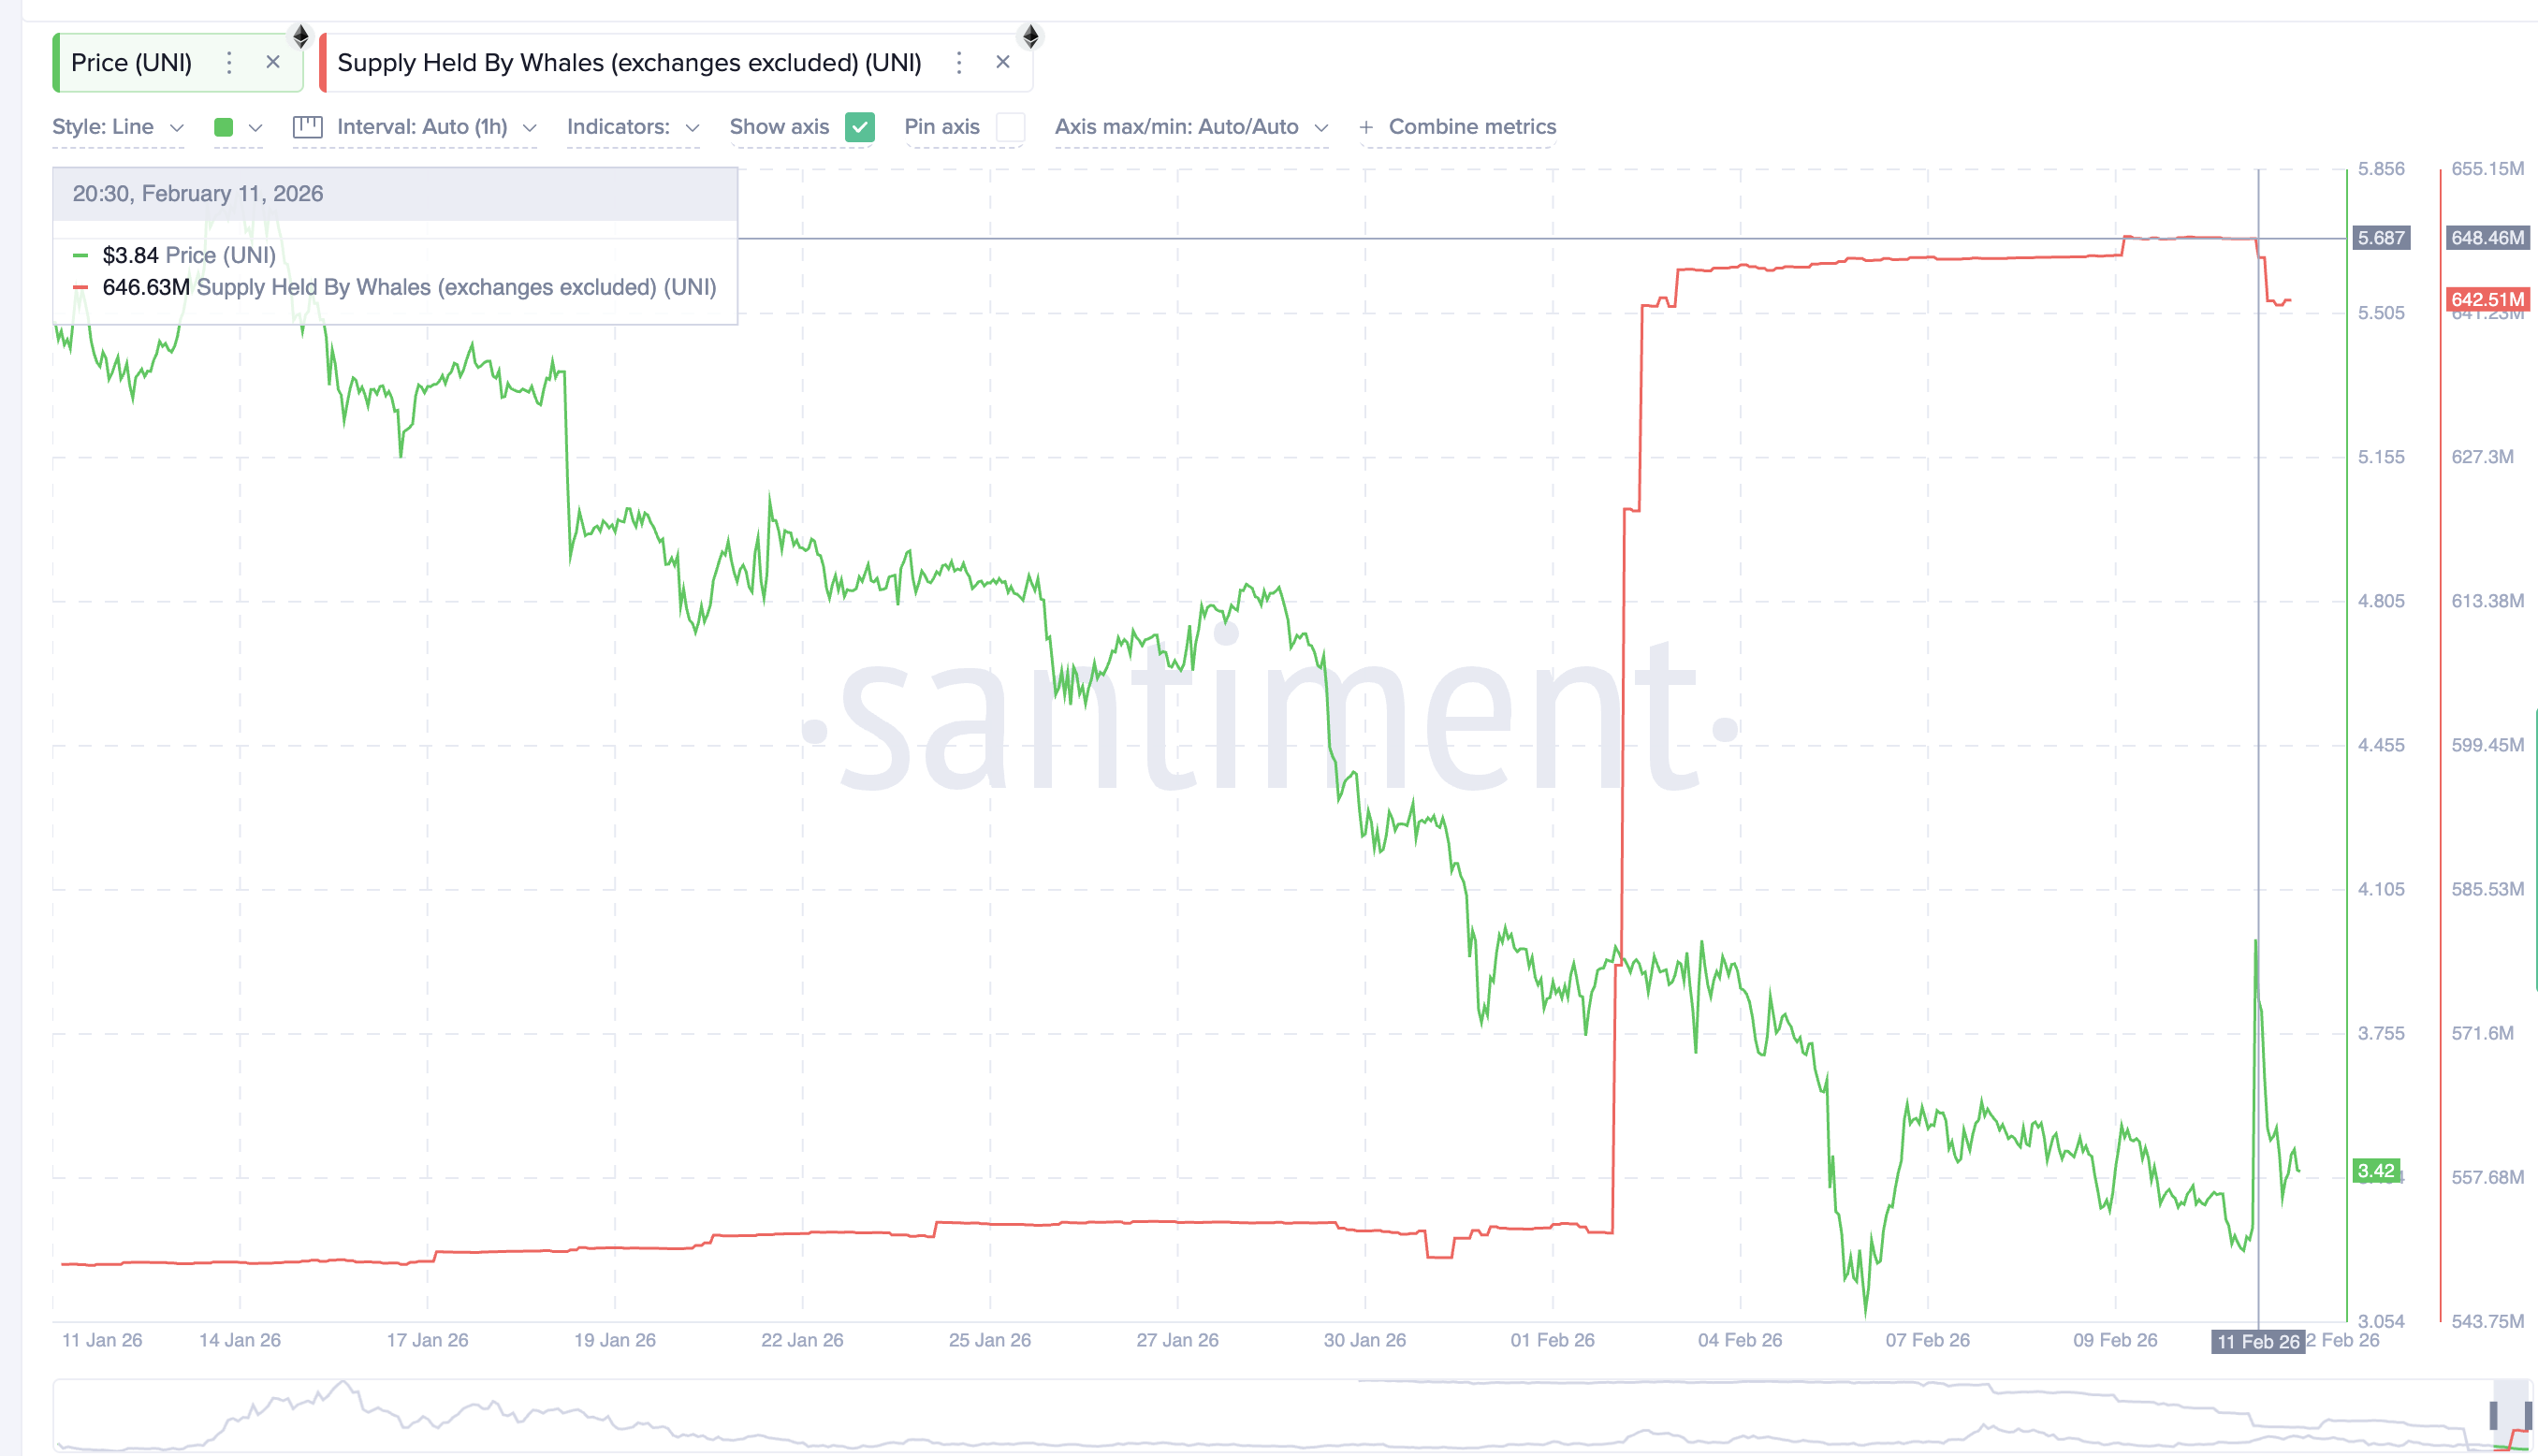
While retail buyers were chasing the breakout, whales were exiting into strength. This explains why the UNI price failed to hold above $4.50 and why the rally collapsed so quickly. Once large holders finished selling, buy-side momentum weakened. Without whale support, the market could not sustain elevated prices.
The result was a fast retracement. From the $4.57 peak, the Uniswap price fell about 26%. Most late buyers were possibly immediately pushed into losses. This confirms that the BlackRock-related surge became a liquidity event for large holders.
Retail provided the demand. Whales provided the supply.
4-Hour Chart Shows the Uniswap Price Rally Target Was Already Completed
The lower timeframe explains why the pullback started so quickly. On the 4-hour chart, Uniswap had been forming an inverse head-and-shoulders pattern inside a descending channel. This is a classic reversal structure that often signals a short-term breakout.
Sponsored
Sponsored
On February 11, UNI broke above the neckline of this pattern and quickly reached its projected target near $4.57. In technical terms, the setup had already completed its measured move.
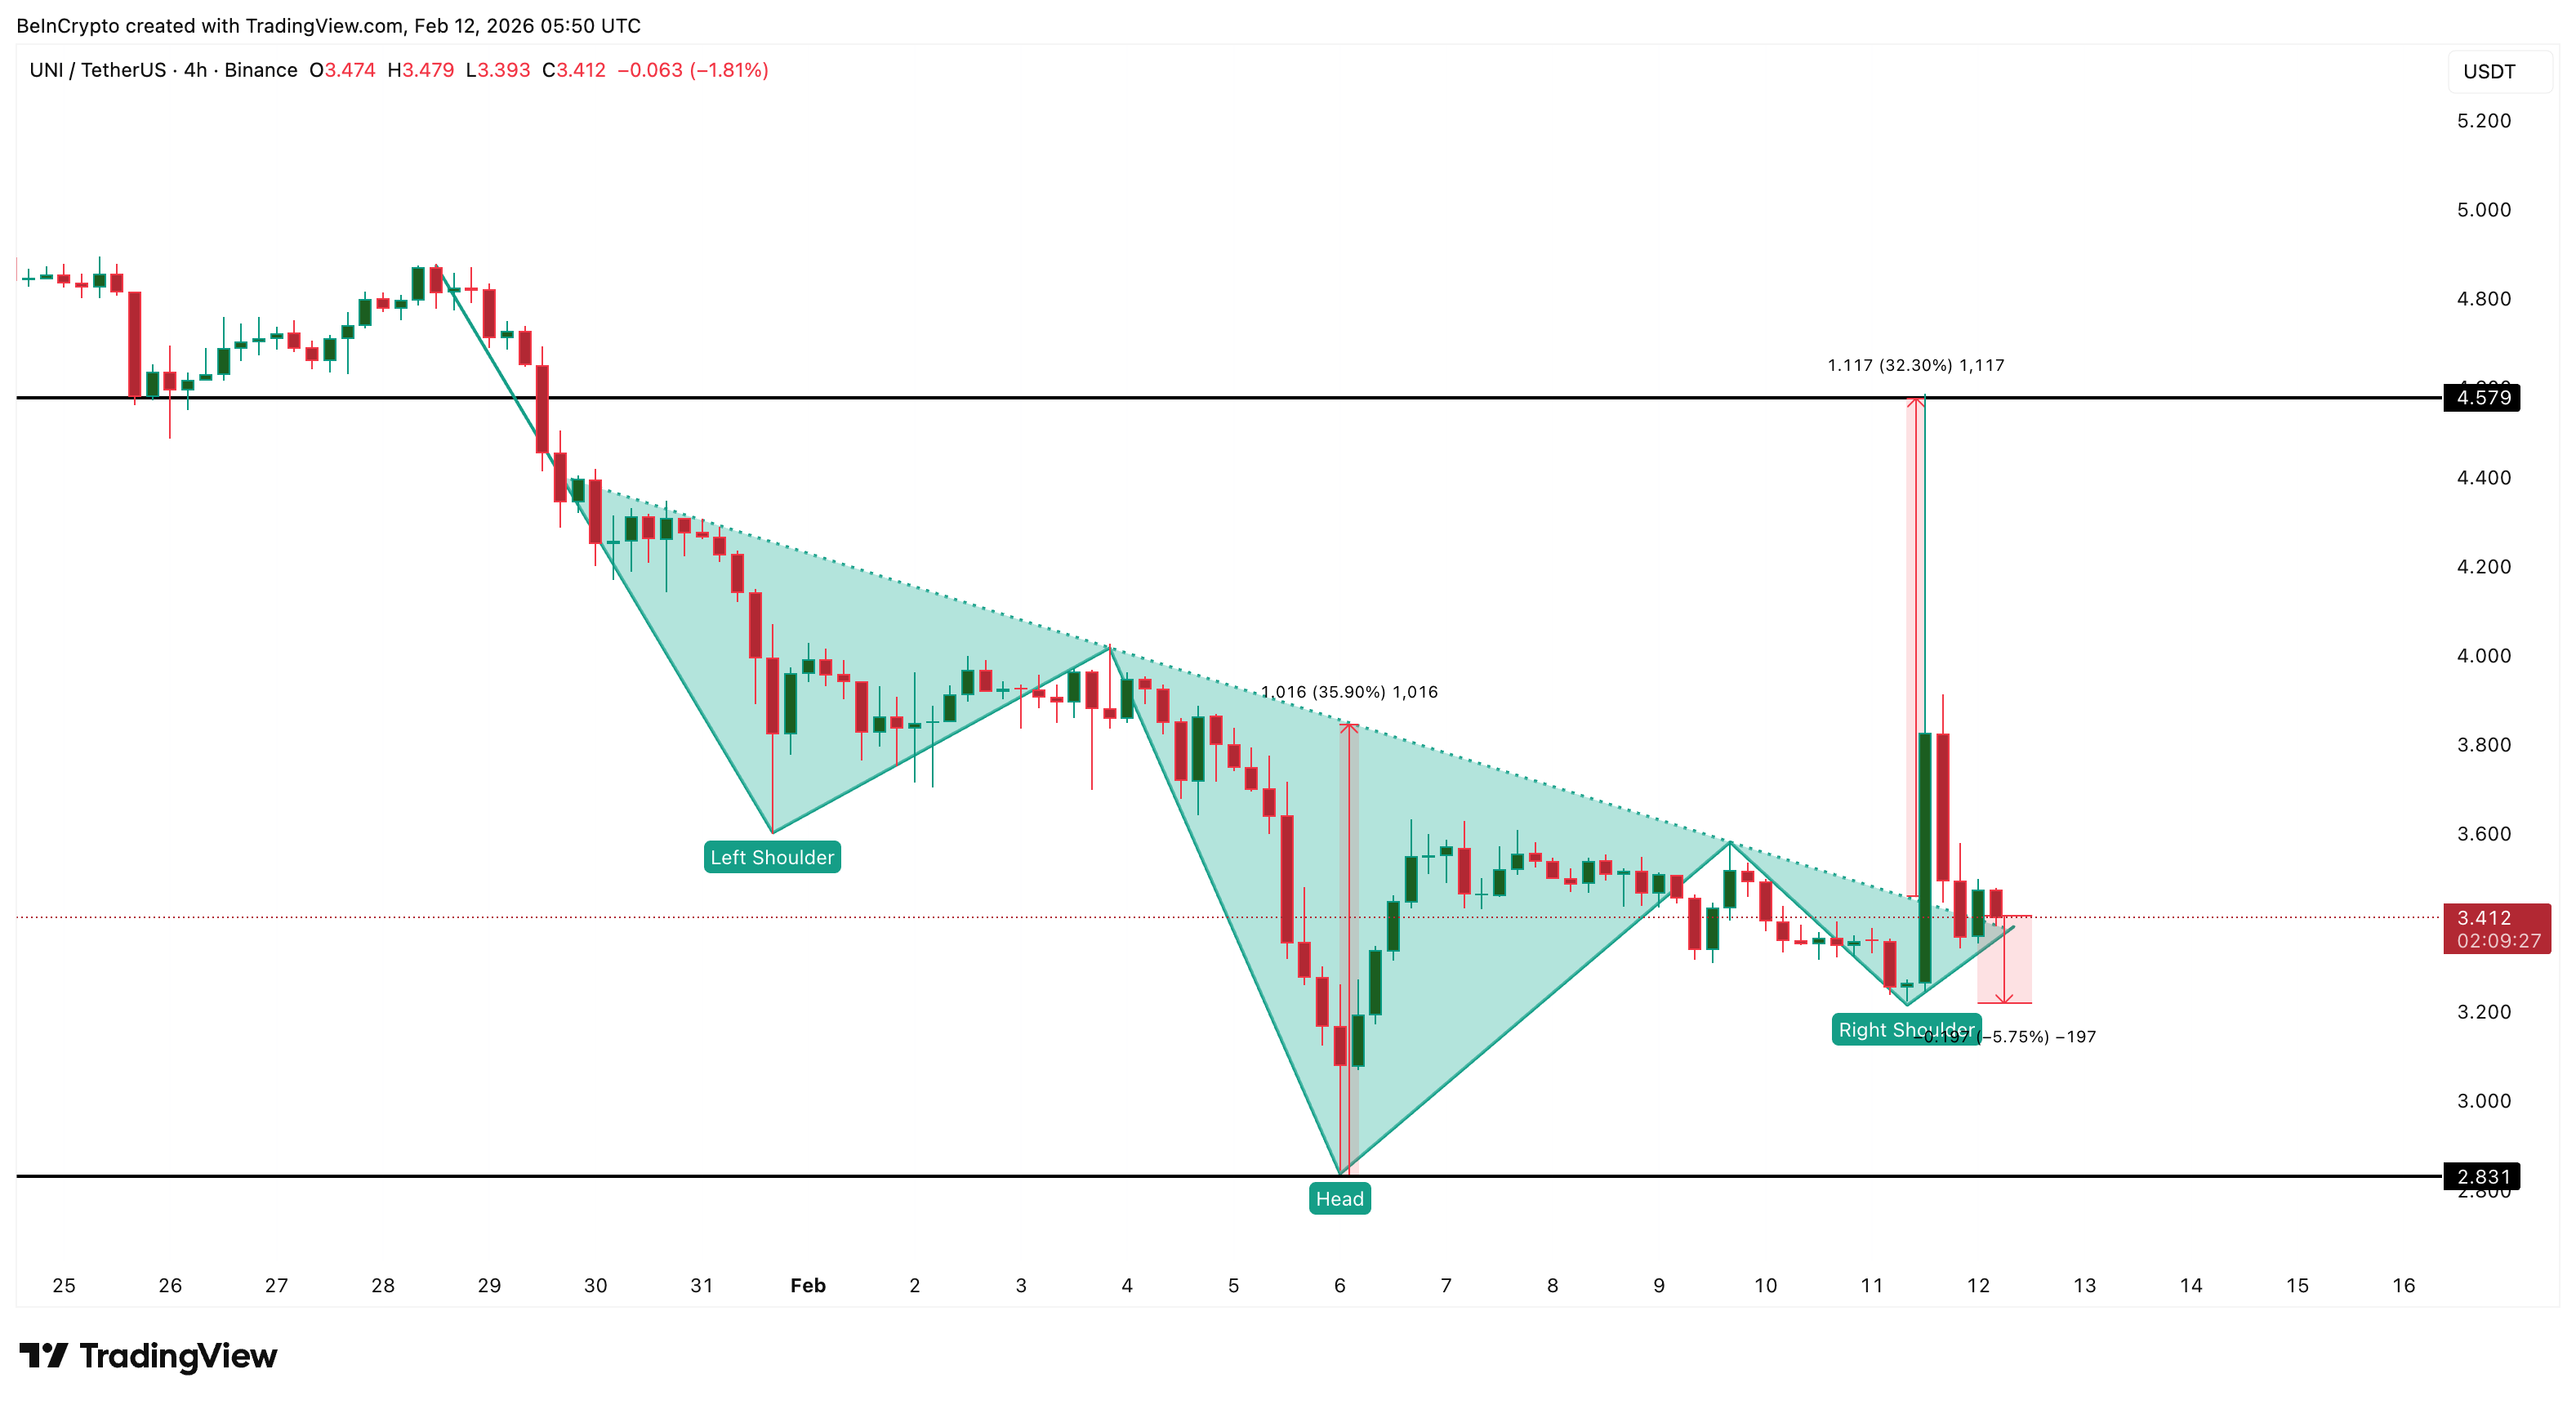
At the same time, the 4-hour OBV divergence became clear. Between late January and February 11, UNI moved higher, but OBV continued trending lower. This shows that volume strength was weakening even as the price rose. This bearish OBV divergence warned that the breakout was not being supported by sustained retail demand. Plus, the OBV is currently trending down, showing retail offloading.
Retail traders focused on the price move. Whales focused on the structure. By the time most buyers entered, the rally was already mature. Now, price is drifting near $3.40 while volume continues to weaken. This suggests that speculative demand is fading.
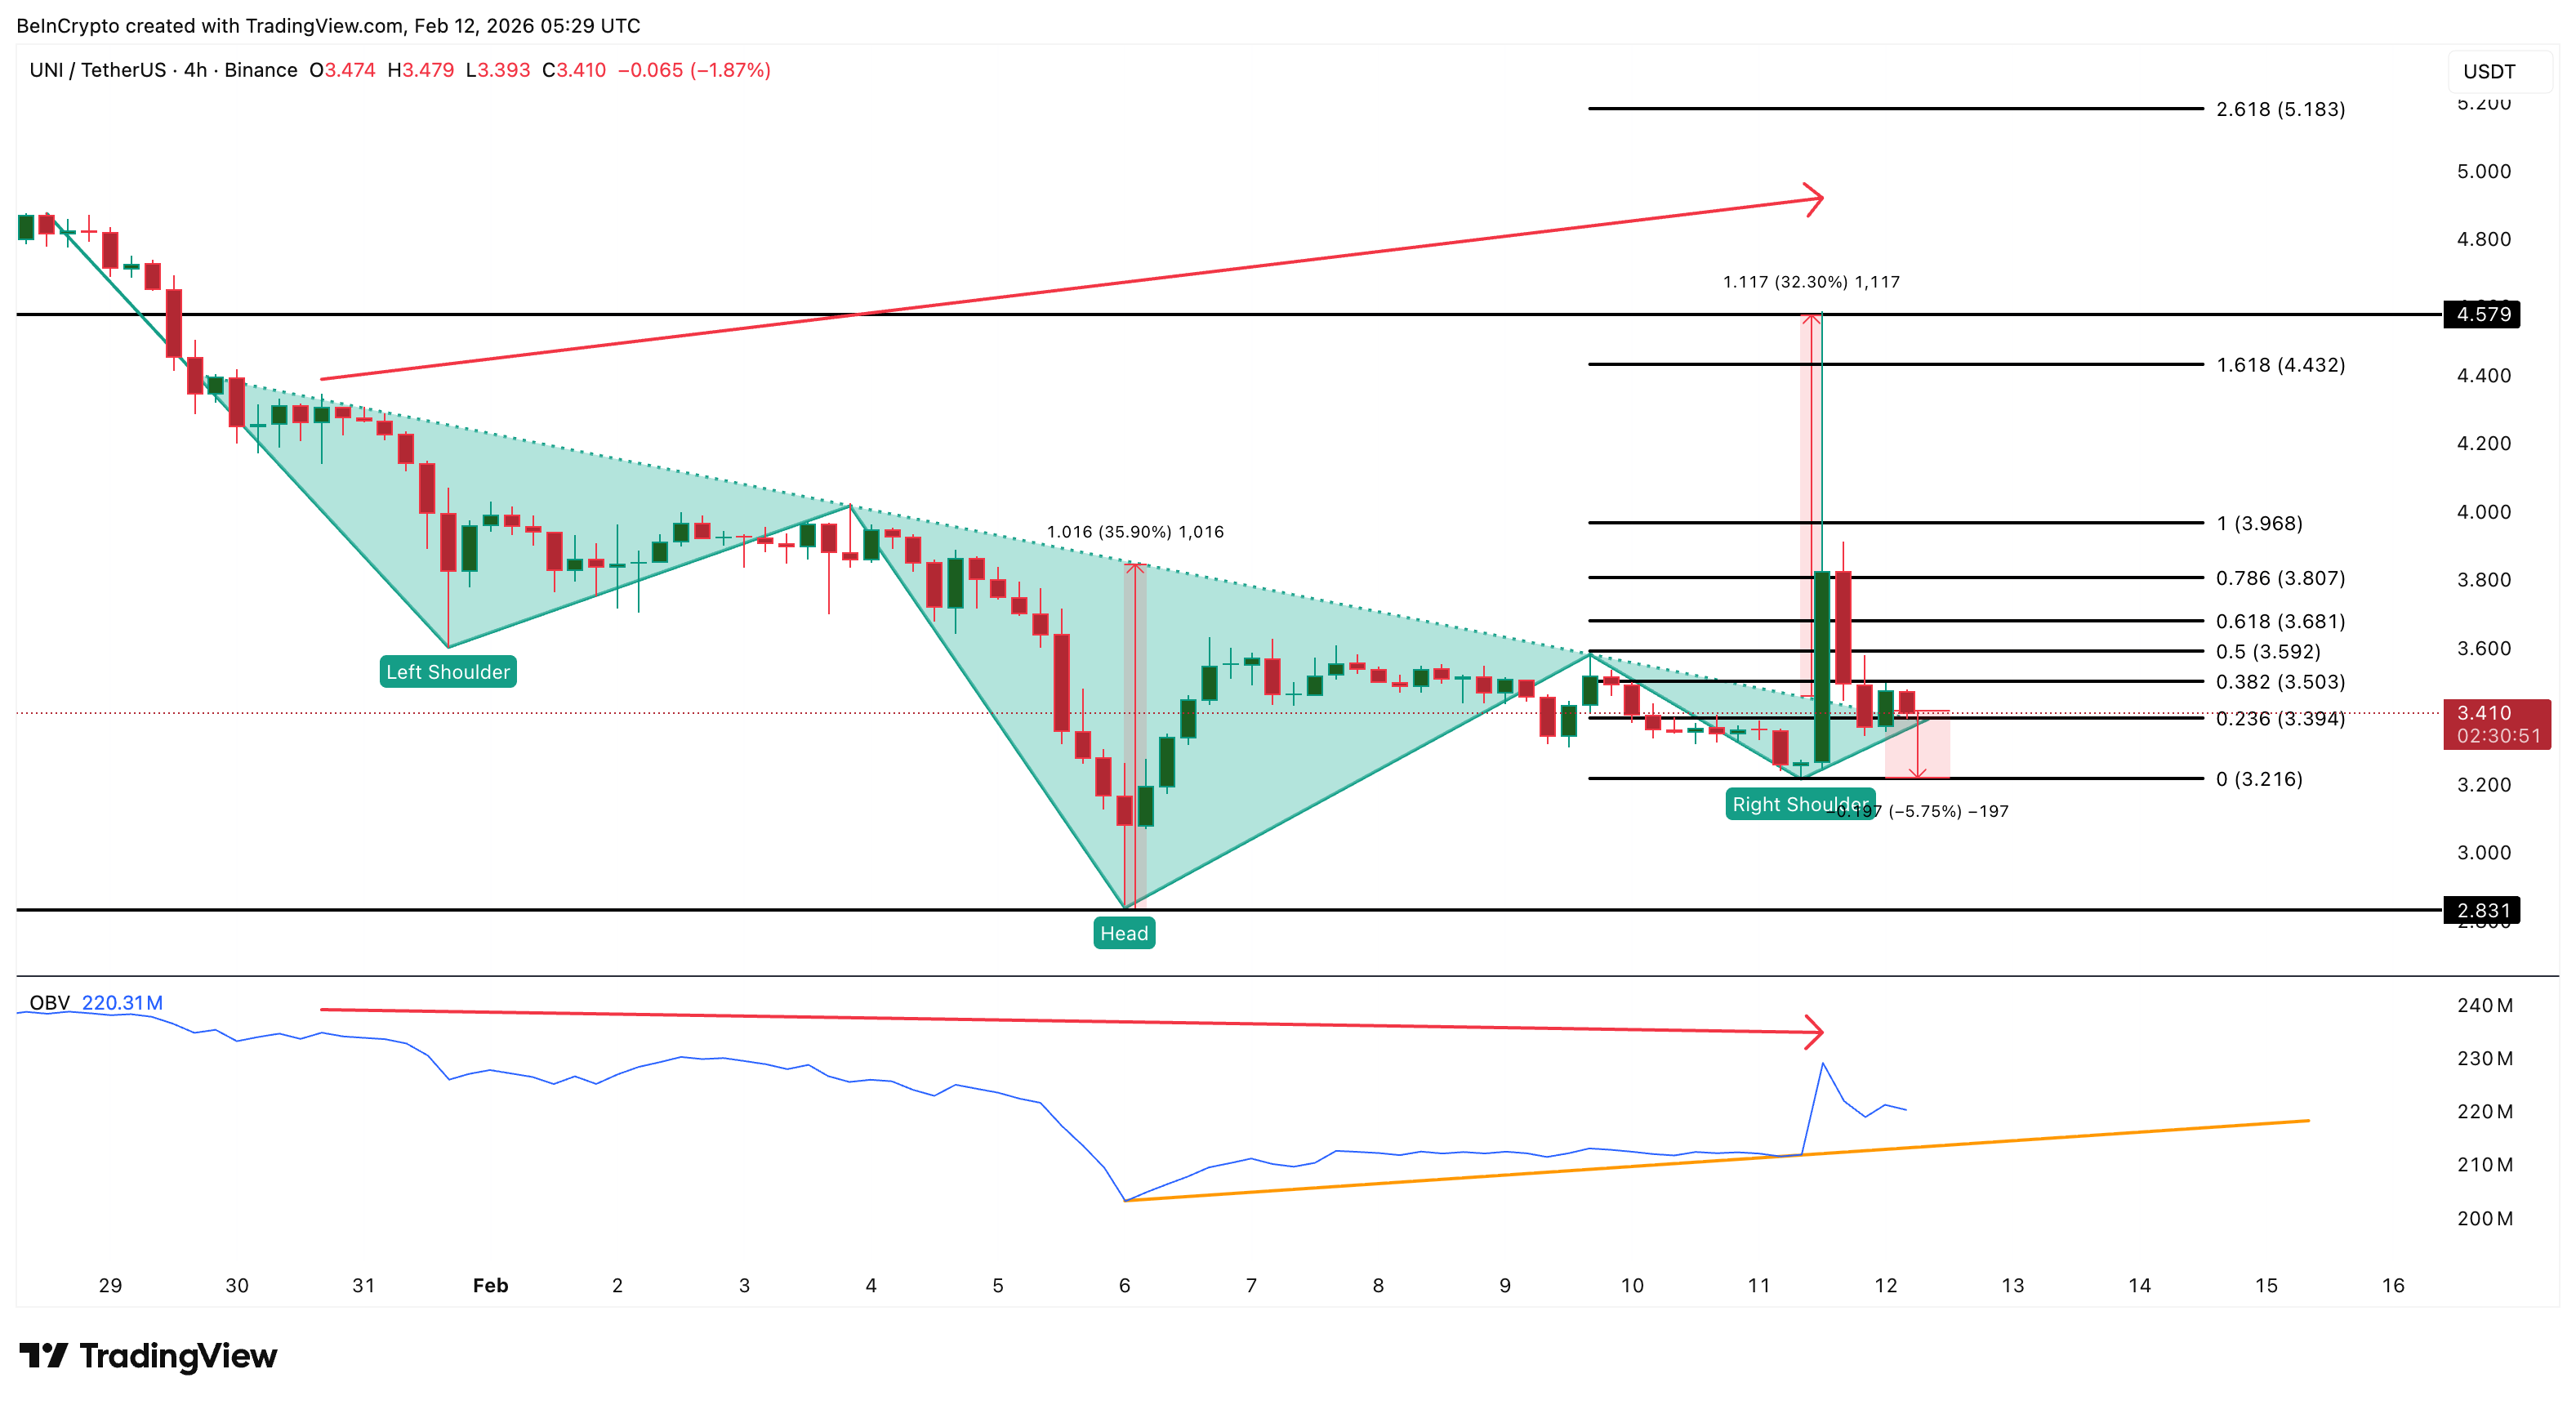
If UNI holds above $3.21, the market may attempt consolidation. But this support is fragile because it is built on short-term buying, not long-term accumulation.
A breakdown below $3.21 would likely trigger another sell wave. In that case, the next major level sits near $2.80, which marks the head of the prior reversal pattern. A move to this zone would erase all of the BlackRock-driven gains.
To regain strength, Uniswap price must reclaim the $3.68 to $3.96 region. This area now acts as a major obstacle after the failed breakout. Only a sustained move above it would reopen upside toward $4.57.

AI-powered Bitcoin treasury and education company Genius Group revealed on Tuesday that it sold the remainder of its Bitcoin in Q1 to pay off debt, adding to a recent wave of companies offloading assets amid a crypto bear market.
“The company will recommence building its Bitcoin Treasury when it believes market conditions are more favorable,” it stated.
The move appears to go against its “Bitcoin first” strategy, which it touted in November 2024, vowing at the time to commit 90% or more of its current and future reserves to be held in Bitcoin.
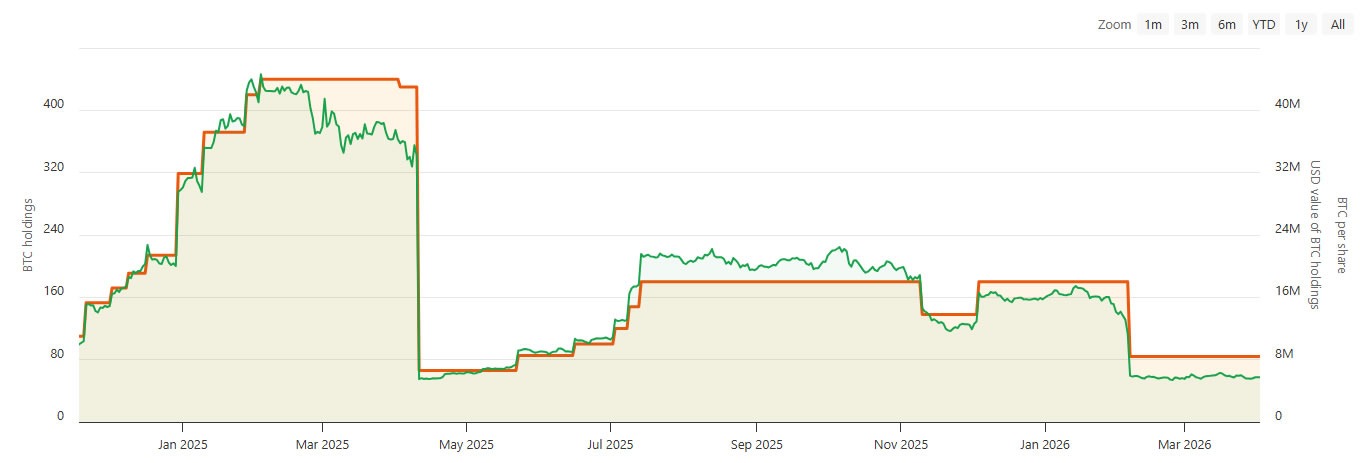
Genius Group held 84 BTC worth around $5.7 million as of March 2026, but holdings have declined since April 2025, around the time it was temporarily barred by a US court from expanding its Bitcoin treasury. It resumed buying in June of that year.
The recent announcement came as Genius Group reported strong results in Q1, with revenue up 171% year-on-year to $3.3 million and gross profit up 228% to $2 million. The company swung from a $500,000 operating loss in Q1 2025 to a $2.7 million net profit in Q1 2026.

Bitcoin treasuries liquidating in 2026
Genius Group is not the only Bitcoin-related company to offload assets in recent months.
MARA Holdings sold 15,133 BTC for around $1.1 billion in March, dropping its treasury to 38,689 BTC and down to the third largest corporate Bitcoin treasury, behind Twenty One Capital.
The proceeds were used to repurchase approximately $1 billion of convertible senior notes and the remainder for general corporate purposes.
Related: Bhutan offloads another $37M in Bitcoin as sovereign wallet shrinks
Meanwhile, mining company Bitdeer liquidated its entire stash of 943 BTC and sold newly mined coins, cutting corporate holdings to zero in February.
Other notable recent sales include Bitcoin miner Cango Inc., which sold 4,451 BTC, and AI tech firm GD Culture Group, confirming authorization of the sale of some of its 7,500 BTC treasury in February.
Stalwart Strategy keeps on buying
Michael Saylor’s Strategy, the world’s largest corporate Bitcoin treasury, has bucked the trend and has continued buying Bitcoin, dominating purchases this year.
“Strip out Strategy, and the rest of the ecosystem’s buying pace has collapsed,” reported BTC mining analytics outlet BitcoinMiningStock in March.
The firm’s last purchase was 1,031 BTC on March 23, and it has accumulated 89,581 BTC worth around $6.1 billion at current market prices so far this year, according to the Saylor Tracker.
Magazine: Nobody knows if quantum secure cryptography will even work


US-listed spot Bitcoin ETFs ended the first quarter of 2026 in negative territory. March did see a return of inflows, but that came only after two straight months of steady withdrawals.
Summary
- US spot Bitcoin ETFs ended Q1 2026 with about $500 million in net outflows, as early-quarter redemptions outweighed March inflows of $1.32 billion.
- Ether ETFs saw $769 million in quarterly outflows, while Solana funds attracted $213 million.
Figures from SoSoValue show that the funds added $1.32 billion in March and ended a dry spell that had lasted since October 2025.
Yet the inflows were not enough to offset the heavy redemptions that occurred in January, when $1.61 billion was pulled from the funds. Subsequently, February saw further withdrawals of $207 million, leaving the quarter with roughly $500 million in net outflows.
Outflows picked up pace as Bitcoin fell by more than 22% over the quarter, extending losses after a 23% drop in the final quarter of 2025. Consecutive declines across two quarters added pressure on investor positioning and fund flows.
Investor sentiment remained fragile even as capital returned in March. Readings from the Crypto Fear & Greed Index stayed under 20 for most of the month, a range tied to “Extreme Fear.”
Even under those conditions, ETF inflows picked up toward the end of the quarter. Some analysts link that resilience to continued institutional participation, despite uncertainty tied to geopolitical tensions in the Middle East.
However, trading activity slowed, with spot Bitcoin ETF volumes falling to around $79 billion in March, compared with $93 billion in February and $87 billion in January. By the end of the quarter, cumulative inflows into the segment reached close to $56 billion, while total assets under management stood near $87.5 billion.
Spot Ether ETFs recorded the largest quarterly losses among altcoins at about $769 million. These products have recorded three consecutive months of outflows after closing March with $46 million in net withdrawals.
XRP ETFs also recorded outflows in March with roughly $31 million exiting the funds. Earlier inflows kept the quarterly figure positive, with net additions of roughly $43 million.
Meanwhile, Solana ETFs brought in a combined $213 million over the quarter. Since their launch in October 2025, they have yet to post a month of net outflows.

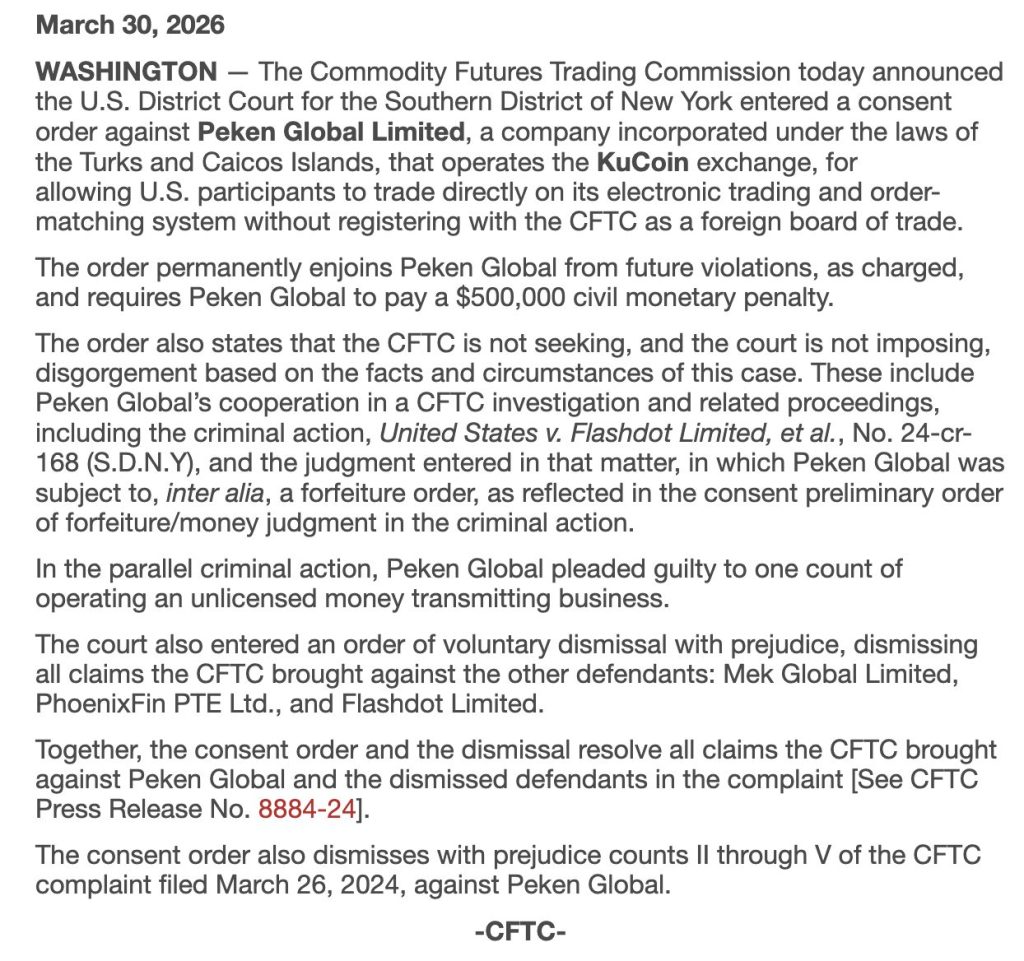
The CFTC has fined Peken Global Limited – the KuCoin operating entity – $500,000 and issued a permanent injunction barring the exchange from serving U.S. traders, closing a civil enforcement loop that began with a March 2024 complaint against the platform for running an unregistered futures commission merchant and swap execution facility.
The order mandates active blocking of U.S. user access, not merely a policy update – KuCoin must implement technical controls to prevent American traders from opening accounts or accessing derivatives products.
That requirement, paired with the $297 million the exchange already forfeited under a January 2025 DOJ guilty plea, makes this one of the most consequential offshore exchange enforcement sequences in CFTC history.
- Penalty Amount: $500,000 civil fine levied against Peken Global Limited by the CFTC
- Restriction Scope: Permanent injunction barring KuCoin from onboarding or serving U.S. traders across spot and derivatives products
- Prior Resolution: $297 million in penalties and forfeitures under January 2025 DOJ guilty plea; 1.5 million registered U.S. users generated at least $184.5 million in fees
- Precedent Signal: CFTC isolated liability to Peken Global; claims against Mek Global, PhoenixFin, and Flashdot were dismissed in the final order
What the CFTC Order Actually Requires – and What the $500K Kucoin Charge Covers
The CFTC’s civil complaint, filed March 26, 2024, in the U.S. District Court for the Southern District of New York, charged KuCoin’s operators with violating the Commodity Exchange Act across a four-year window – July 2019 to June 2023 – by operating as an unregistered futures commission merchant and swap execution facility without the required CFTC registration.
The complaint also alleged sham KYC procedures: KuCoin publicly claimed U.S. users couldn’t access the platform while simultaneously allowing them through via VPN with no IP-level restrictions in place.
The final order isolates the $500,000 civil monetary penalty to Peken Global Limited – the entity the CFTC determined held primary operational liability. Claims against affiliated entities Mek Global Limited, PhoenixFin PTE Ltd., and Flashdot Limited were dismissed.
That distinction matters: the CFTC is not pursuing a blanket penalty across the corporate structure but targeting the specific operator responsible for U.S.-facing derivatives access.
CFTC Enforcement Director Ian McGinley framed the issue directly: “For too long, some offshore crypto exchanges have followed a now-familiar playbook by offering derivative products and falsely claiming people in the United States cannot use their platforms.” The $500,000 fine covers the civil derivatives violations – it is separate from, and much smaller than, the $297 million resolved through the parallel DOJ criminal track.
Discover: Best Crypto Exchanges for Active Traders in 2026
What U.S. Traders Actually Lose – and How This Compares
The injunction covers the full scope of KuCoin’s U.S.-facing access – derivatives trading, account creation, and ongoing service to existing American accounts.
KuCoin had roughly 1.5 million registered U.S. users before its partial July 2023 KYC rollout, which itself was triggered by knowledge of the federal probe and excluded millions of existing users. Those accounts are now subject to forced exit under the permanent bar.
The products at stake are not marginal. KuCoin offered leveraged perpetual futures and margin trading – the same derivatives categories that put BitMEX and, later, Binance in the CFTC’s crosshairs.
For active traders who relied on KuCoin for offshore derivatives access, the injunction closes that channel permanently, not provisionally. There is no compliance pathway back to U.S. market access under this order.
The practical consequence is straightforward: U.S. traders holding open positions or balances on KuCoin need to treat this as a wind-down event, not a temporary disruption.
The broader question – whether centralized exchange platforms serving U.S. users can sustain their market share amid accelerating enforcement – is now sharper than ever.
Discover: Top Crypto Presales to Watch Before They Launch
The post KuCoin Ordered to Block US Traders and Pay $500,000 CFTC Penalty appeared first on Cryptonews.

President Donald Trump delivered his first prime-time address on the Iran war on Wednesday night. He told the nation that “core strategic objectives are nearing completion.” He then promised to escalate.
Oil was falling when Trump started talking. It was up 5% by the time he stopped — and that tells the whole story.
Markets Expected Peace. They Got ‘Stone Ages.’
“We are going to hit them extremely hard over the next two to three weeks,” Trump said. “We’re going to bring them back to the Stone Ages, where they belong.”
The speech lasted 19 minutes. It contained no new information, no timeline to end the war, and no plan to reopen the Strait of Hormuz. Markets had spent two days rallying on hopes that Trump would announce an off-ramp. Instead, he promised more bombs.
Brent crude surged 5% to above $106 per barrel. West Texas Intermediate jumped 4.1% to $104. The S&P 500 futures fell 1.1%. European futures dropped 1.5%. Gold lost 1.4% to $4,691 per ounce. Silver fell 3%. The 10-year Treasury yield climbed to 4.36%.
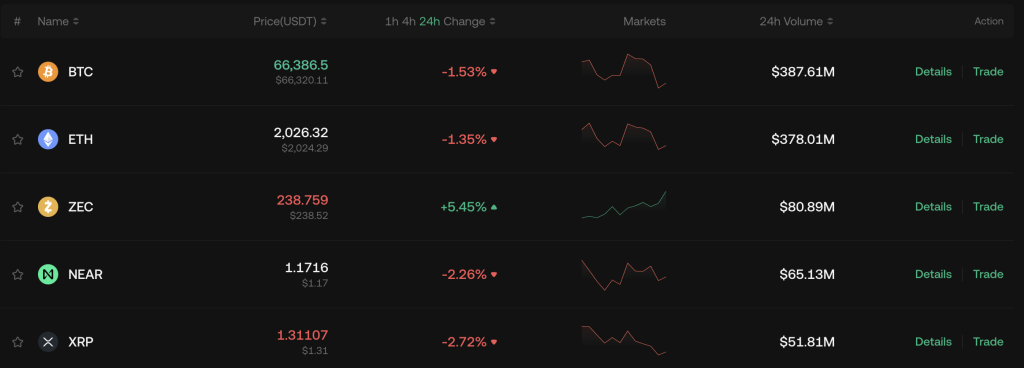
Bitcoin dropped from an intraday high of $69,135 to $66,818, a 3.3% decline. Ethereum fell 2.8% to $2,084. The entire two-day relief rally in crypto evaporated in a single evening.
Asia took the hardest hit. South Korea’s KOSPI fell 3.5%, the worst performer in the region. Japan’s Nikkei lost 1.8%. Hong Kong’s Hang Seng dropped about 1%.
‘Just Take It’ — Trump Tells Allies to Secure Hormuz
Trump said the Strait of Hormuz would “open up naturally” once the war ends. He urged oil-importing nations to “build some delayed courage” and secure the waterway themselves. He did not explain how or when that might happen.
Hours earlier, at a White House Easter lunch, Trump was more blunt. He said the US could “just take their oil,” but added that Americans lack “the patience” for it. He also named South Korea, Japan, and China directly, telling each to step up on Hormuz.
That message landed hard in Seoul. The KOSPI’s 3.5% decline reflected both energy import vulnerability and the shock of being singled out by the US president.
Trump also dropped his April 6 deadline threat to bomb Iran’s power grid. He made no mention of NATO, ground troops, or ongoing negotiations. The absence of specifics was itself a signal. Investors had hoped for clarity. They received ambiguity.
Iran Holds Firm, Toll Booth Stays Open
Iran showed no interest in backing down. Foreign Minister Abbas Araghchi said there are no direct negotiations with Washington and that Tehran’s trust in the US stands at zero. President Masoud Pezeshkian posted an open letter in English asking Americans which of their interests this war truly serves.
Meanwhile, Iran’s parliament continues working on legislation to make its Hormuz toll system permanent. The IRGC already charges vessels up to $2 million per transit, settled in stablecoins or Chinese yuan. If codified into law, this regime would outlast any ceasefire.
That is the gap the market is now pricing in. Trump says the strait will open naturally. Iran is building a toll booth designed to last forever. Oil traders, bond traders, and crypto traders all reached the same conclusion Wednesday night: this war is not ending soon.
The post Trump’s ‘Stone Ages’ Threat Sends Bitcoin Below $67K appeared first on BeInCrypto.
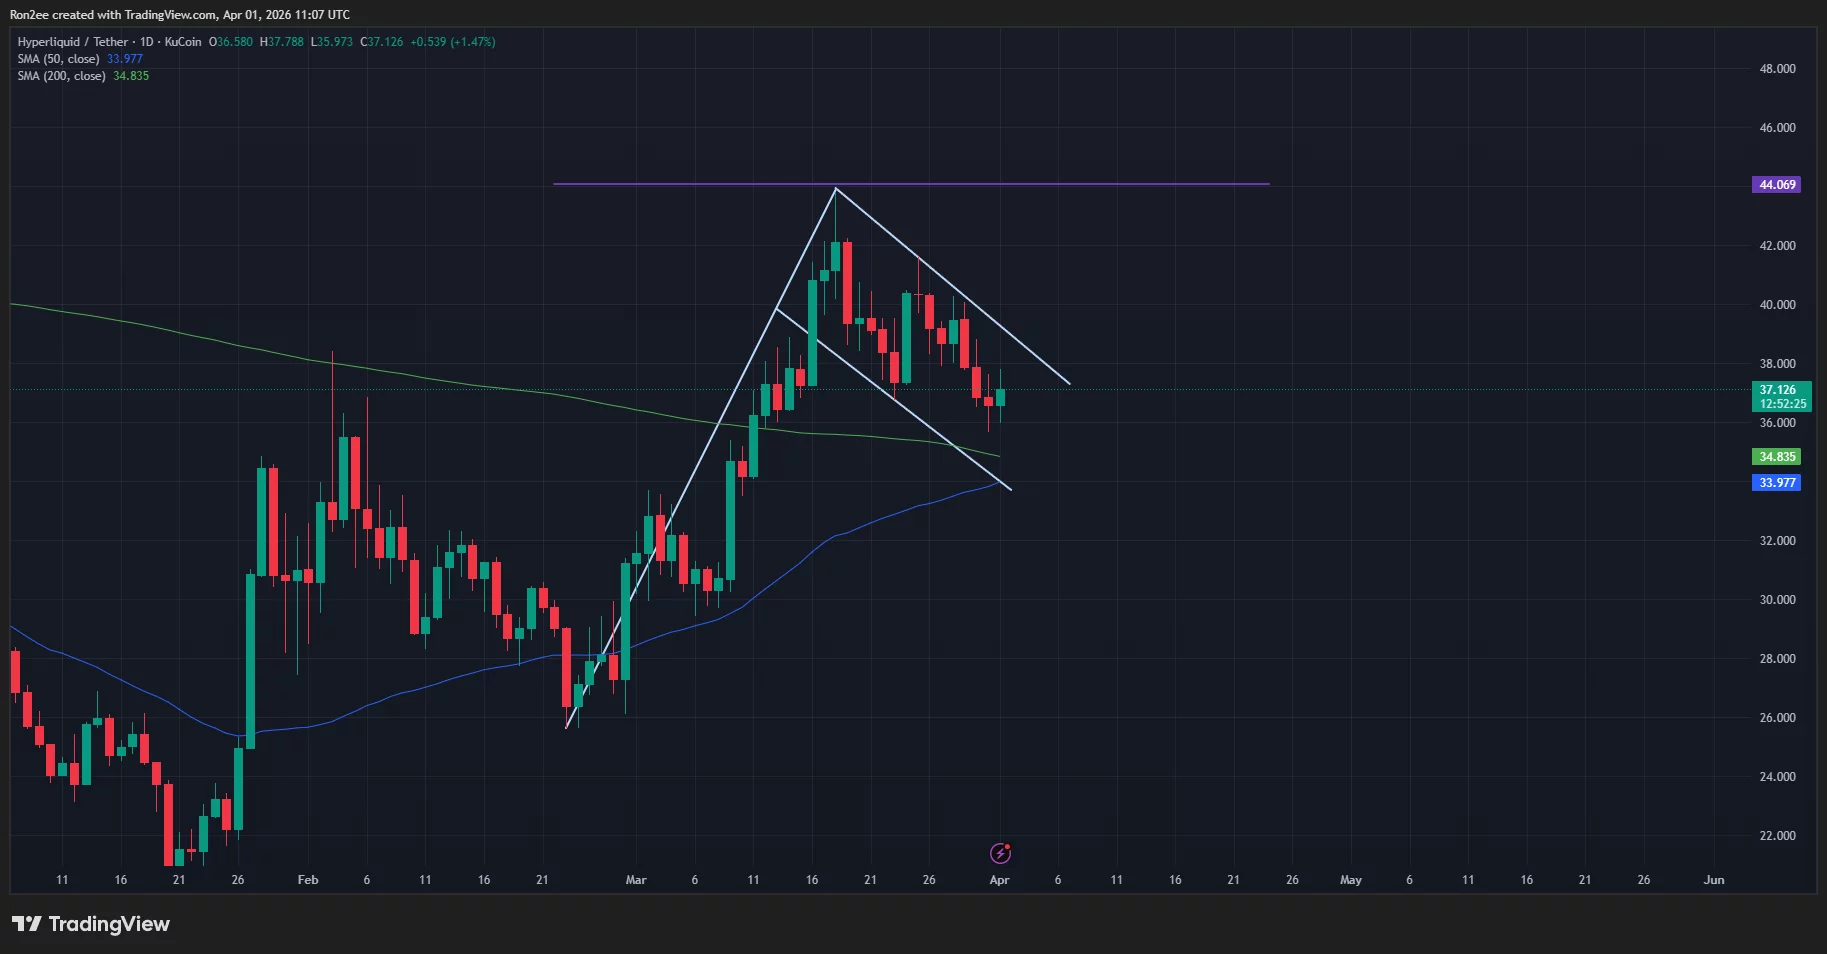
Hyperliquid price is close to confirming multiple bullish patterns as futures traders show increased interest in the token.
Summary
- Hyperliquid price has risen up 22% over the past month, supported by rising open interest and increased futures market activity.
- Growth in commodity perpetuals and event-based contracts, alongside rising trading volumes, has boosted token demand through increased burn mechanisms.
- Technical setup shows a bullish flag and a potential golden cross, with upside targets near $44, while a drop below $34.8 could invalidate the bullish outlook.
According to data from crypto.news, Hyperliquid (HYPE) price was trading at $36.9, up 22% over the past month and 78% higher than its year-to-date low.
Hyperliquid price rallied as it witnessed a massive surge in real-world asset trading volumes.
Notably, following the implementation of HIP-3, which expanded the protocol capabilities, investors can now trade decentralized perpetual contracts on commodities like gold, silver, and crude oil.
Amidst escalating tensions in the Middle East, a massive jump in volume was observed in Hyperliquid’s 24/7 crude oil perpetuals, which topped $1 billion in a single day in March.
Unlike traditional markets, Hyperliquid provides round-the-clock access to its commodity markets, making it a pressure valve for macro traders amidst geopolitical events that often unfold over the weekend.
Furthermore, the project’s expansion into prediction markets from its introduction of event-based contracts has added another layer of utility and attracted fresh participants who can now trade on the outcome of real-world events natively alongside their futures positions.
In the last 24 hours, open interest on Hyperliquid hit over $1.61 billion. A surge in open interest suggests more active participation from traders and is a sign that the current trend has significant backing.
The HYPE token has also benefited from increased trading volumes. Trading volumes on the platform have hit a record high of over $2.4 billion.
As Hyperliquid’s Assistance Fund uses up to 97% of protocol fees to buy back and burn HYPE tokens, the latest surge has significantly increased the burn rate of tokens and hence has helped drive the asset price higher through deflationary pressure.
On the daily chart, Hyperliquid price has formed a bullish flag pattern after a steep vertical move known as a pole, followed by a brief period of consolidation. A bullish flag is one of the most well-known bullish continuation patterns in technical analysis.

It is also close to confirming a golden cross, which occurs when the 50-day SMA crosses over the 200-day SMA. Traders view such pattern confirmations as a major signal of long-term trend reversal and sustained buying momentum.
Hence, if a golden cross is confirmed, Hyperliquid price would likely confirm the bullish flag pattern, which would propel it toward the upside of $44, the highest point of the flag formation. A breakout above it could set the stage for a push toward new all-time highs.
On the contrary, if Hyperliquid price drops below the 200-day SMA at $34.8, the bullish thesis would be invalidated and could lead to further downside.
Disclosure: This article does not represent investment advice. The content and materials featured on this page are for educational purposes only.

Li Xiong, a key member of a group that allegedly helped crypto scam rings in Asia to move money, has been extradited from Cambodia to China, where he will face fraud and money laundering charges, according to Hong Kong-based news outlet Ta Kung Wen Wei.
“On April 1, with strong support from the relevant authorities in Cambodia, a task force sent by China’s Ministry of Public Security successfully escorted Li Xiong, a core key member of the Chen Zhi criminal syndicate, back to China from Phnom Penh, Cambodia,” it said on Wednesday, citing a statement from China’s Ministry of Public Security on WeChat.
Xiong previously served as chairman of Huione Group, an alleged criminal organization that served scam centers in Cambodia that carried out “pig butchering” scams and other investment schemes to steal crypto from victims around the world.
Huione Group was responsible for one of the largest illicit online marketplaces in the world, handling over $89 billion in cryptoassets.

His extradition comes three months after the arrest of Chen Zhi, the head of Prince Group, which operates Huione Group. In October, it was reported that the US Department of Justice seized 127,271 Bitcoin (BTC) worth more than $15 billion from Zhi.
Related: Hong Kong retiree loses $840K in triple ‘crypto expert’ scam
The US Treasury Department’s Financial Crimes Enforcement Network directed US banks to cut payments and accounts tied to the Huione Group in October.
Authorities ask other Huione members to surrender
Ta Kung Wen Wei noted that several other members of Zhi’s criminal syndicate have been brought to justice “one after another,” citing comments from Chinese public officials.
“Public security authorities will continue to intensify efforts to capture fugitives,” it said, adding:
“At the same time, they once again warn criminals to recognize the situation, stop before it is too late, surrender as soon as possible, and strive for lenient treatment.”
Magazine: Banks want to run Vietnam’s crypto exchanges, Boyaa’s $70M BTC plan


The United States Department of Justice has brought charges against 10 individuals for allegedly manipulating digital asset prices through so-called “pump-and-dump” schemes.
Summary
- The US Department of Justice charged 10 individuals linked to four crypto market making firms for alleged pump and dump schemes dating back to 2018.
- Prosecutors said the group inflated trading volumes through wash trading and coordinated transactions before selling assets to unsuspecting investors at higher prices.
- Three of the defendants were extradited from Singapore to the US.
In a Tuesday press release, federal prosecutors alleged that the defendants conspired to artificially inflate trading volumes and cryptocurrency prices before selling to unwitting investors at inflated valuations. The case centers on four market maker firms, Gotbit, Vortex, Antier, and Contrarian, with the incident dating back to 2018.
The cases have unfolded over the years, with the first phase emerging in October 2024, followed by the Gotbit-related indictment filed in March 2025, subsequently expanding with a Vortex case in August 2025 and further charges tied to Contrarian and Antier in September 2025.
Three defendants, including Vortex CEO Gleb Gora, Contrarian CEO Manu Singh, and Contrarian employee Vasu Sharma, have been arrested in Singapore and extradited to the United States, where they appeared in federal court on Monday.
The indictments claim that the defendants employed tactics including wash trading, matched orders, and other prearranged transactions to generate fake volume and support token prices, creating the illusion of genuine market demand.
“These so-called pump-and-dump schemes caused losses to investors in the United States and elsewhere,” prosecutors said. The release noted that authorities have seized more than $1 million in cryptocurrency.
Gotbit founder Aleksei Andriunin had already pleaded guilty in 2025 and agreed to forfeit approximately $23 million in crypto assets as part of a plea deal.
The DOJ has previously brought related charges against CLS Global through an FBI undercover operation, which used a bureau-created token to expose alleged market manipulation services.
Crypto World
Whales quietly switched to ConfluxCapital’s automated quantitative trading robot platform to avoid losses, and earn $19,700 daily

Disclosure: This article does not represent investment advice. The content and materials featured on this page are for educational purposes only.
Bitcoin and Ethereum rebound sparks risk hedging as investors turn to ConfluxCapital’s AI-driven trading robots for stable daily returns.
Summary
- Bitcoin and Ethereum rebound temporarily, but minor gains often precede sharp drops, raising risk for retail investors.
- Traders are turning to AI-powered platforms like ConfluxCapital to hedge losses and earn stable daily returns.
- ConfluxCapital’s quantitative trading robots profit through automated long and short strategies, independent of market direction.
In the past 48 hours, Bitcoin (BTC) and Ethereum (ETH) prices have seen a slight rebound, with BTC regaining the $68,000 mark and ETH briefly rising above $2,100. For inexperienced retail investors, this might seem like a “buy the dip” signal. However, on-chain data and historical price movements reveal another unsettling fact: such temporary, minor rises are often the prelude to a sharp drop.
Faced with this market signal, an increasing number of cryptocurrency holders are taking action — not by adding to their positions, but by turning to AI-powered quantitative trading robot platforms like Conflux Capital to hedge risks and mitigate losses through automated strategies, achieving a stable daily income of $19,700.
A new hedging option: ConfluxCapital quantitative trading robot
The greatest hedging value of quantitative robots lies in their independence from market rallies. Through both long and short positions, even when the market enters a deep downtrend, the system can continue to profit through short-selling strategies.

ConfluxCapital registration guide
Step 1: Register an Account
New users receive a $20 welcome bonus upon registration.
Daily logins also earn an additional $0.80 login bonus.
Step 2: Choose a strategy package
Choose a suitable quantitative strategy package based on budget and investment goals. The platform offers a variety of options.
Strategy Name
unit price
Days
Total Revenue
Starter Strategy
$100
2 days
$100+$6
Basic Strategy
$600
5 days
$600+$45
Advanced Strategies
$5,000
15 days
$5,000+$1,215
Elite Strategy
$25,000
25 days
$25,000+$11,250
Quantum Strategy
$90,000
20 days
$90,000+$36,000
Infinite Strategy
$200,000
25 days
$200,000+$110,000
Earnings will be automatically credited to an account the day after a strategy is purchased. When the account balance reaches $100, it can be withdrawn to a cryptocurrency wallet or continue purchasing strategies to earn more earnings.
ConfluxCapital advantages:
- Receive an instant $20 bonus upon registration. Automated operation: After purchasing a strategy package, earnings are automatically credited to an account the next day, with no need to monitor the market.
- Flexible withdrawals: Withdrawals to a crypto wallet are available once an account balance reaches $100, or reinvest for even more returns.
- Top-tier security: Dual security protection with McAfee® and Cloudflare® ensures assets are safe.
- Globally trusted: Recognized by over 3 million users in 195+ countries and regions.
- Multi-currency support: Supports settlement in major digital assets such as XRP, DOGE, SOL, BTC, ETH, LTC, USDC, USDT, BNB, and BCH.
- Zero extra fees: No hidden fees, transparent and worry-free.
Investor Stories: From passive attack to proactive risk aversion
An investor who wished to remain anonymous shared her experience in a community forum:
“During the mid-March market crash, I lost nearly 30%. At the time, I stubbornly held on, thinking it would eventually recover. But the market continued to fall, and I lost even more. Later, a friend recommended ConfluxCapital’s quantitative trading robot. I transferred 50,000 USDT and selected the advanced strategy. Now, I wake up every day to find profits in my account, even when the market is falling; my account value is actually increasing. This feeling is completely different from before—no longer ‘being led by the market,’ but letting the machine make money for me.”
Another seasoned investor holding BTC and ETH also stated:
“Before, when a bear market came, I could only tough it out or painfully cut my losses. Now, with quantitative tools, it’s like having an extra hedging tool. I keep my core positions unchanged, use a portion of my funds to run the quantitative strategy, and use the profits to buy more at lower prices. This way, I don’t miss out on gains while hedging against the risk of further declines.”
Conclusion
When market signals point to risk, the wise choice is not to “bet on the direction,” but to find an investment tool that can weather bull and bear markets and is independent of market direction. ConfluxCapital AI Quantitative Trading Robot is precisely such a tool — it doesn’t predict the market, but rather uses algorithms to capture predictable returns in every market fluctuation.
For more information, visit the official website and download the application.
Disclosure: This content is provided by a third party. Neither crypto.news nor the author of this article endorses any product mentioned on this page. Users should conduct their own research before taking any action related to the company.

South Korea-based cryptocurrency exchange Bithumb has again postponed its planned initial public offering, with insiders signaling a listing would come only after 2028. The company previously eyed a 2025- or 2027-targeted listing, but renewed restructuring and ongoing regulatory hurdles have pushed the timeline further, according to Maeil Business News Korea.
A Bithumb official told Maeil Business News Korea that the firm would focus on preparing for the listing until 2027, while strengthening accounting policies and internal controls following an IPO advisory contract with Samjong KPMG. The company’s chief financial officer, Jeong Sang-gyun, framed the moves as part of a broader readiness program ahead of public listing.
Shareholders also reaffirmed CEO Lee Jae-won for a two-year term at the annual meeting, extending leadership continuity. Under Lee’s tenure, Bithumb has faced regulatory scrutiny, including a six-month suspension and a $24 million fine from South Korean authorities for alleged anti-money-laundering violations.
A broader context for Bithumb’s IPO plans is the evolving Korean listing landscape. Upbit operator Dunamu is reportedly planning an IPO after a share swap with Naver Financial, with September cited as the timetable by local outlets. The prospect of a major local exchange going public could influence investor appetite and domestic crypto adoption.
In February, Bithumb drew headlines for a technical blunder that credited users with about 2,000 BTC instead of 2,000 won. The incident briefly generated illusory balances in the exchange ledger totaling more than $40 billion, though most of the funds existed only on paper and were subsequently reversed.
Key takeaways
- Bithumb’s IPO timeline is pushed beyond 2028, with a continued focus on readiness through 2027.
- CEO Lee Jae-won is kept in place, providing leadership continuity amid restructuring and regulatory scrutiny.
- Governance enhancements are underway, including a strengthened role for accounting policies and internal controls via Samjong KPMG.
- South Korea’s regulatory and policy environment remains in flux, with crypto-tax discussions and stablecoin legislation shaping IPO prospects.
- Past operational missteps underscore the ongoing need for strong risk management in a country with a rapidly evolving crypto market.
Bithumb’s delayed IPO: what it signals about Korea’s crypto IPO landscape
According to Maeil Business News Korea, Bithumb’s updated timeline centers on preparations through 2027, with an IPO no sooner than after 2028. The company’s leadership has emphasized governance upgrades as a prerequisite for listing, aligning with expectations from investors for stronger disclosures and controls. The report also notes the presence of an IPO advisory contract with Samjong KPMG, underscoring a formal governance posture as the firm eyes a future public market debut. Maeil Business News Korea
Beyond internal reforms, Bithumb’s path must contend with a broader domestic IPO scene. Dunamu, the operator of Upbit, is said to be pursuing an IPO after a share swap with Naver Financial, with local press pointing to a September window. If a large exchange-minted listing materializes in Korea, the market could reassess liquidity and the competitive dynamics among domestic platforms. Seoul Economic Daily coverage has circulated the timeline, though other outlets have noted the regulatory and market hurdles that may complicate the schedule.
Regulatory climate in Korea: implications for listings and adoption
The policy environment in South Korea continues to evolve alongside the crypto sector. President Lee Jae-myung, who took office in mid-2025, has backed early proposals on payment stablecoins, signaling a readiness to integrate digital assets into the financial system. At the same time, lawmakers have wrestled with crypto-tax plans that were first floated years ago but have faced repeated delays and, in some accounts, may be scrapped entirely as of March this year. As the government calibrates its stance, the fate of a large public filing by a domestic exchange remains tethered to regulatory clarity and the cost of compliance for incumbents. As of March 2025, estimates put the number of South Koreans with crypto exchange accounts at around 16 million, illustrating the market’s scale even as policy debate continues. Cointelegraph also highlighted the broader policy conversation tied to the sector.
Operational risk and the path to a compliant IPO
Bithumb’s governance upgrades take on heightened significance in light of prior enforcement actions. The exchange faced a six-month suspension and a $24 million fine from South Korean authorities over alleged anti-money-laundering issues, a reminder that any future public listing would demand rigorous compliance and transparent controls. The ongoing emphasis on strengthening internal policies, as described by CFO Jeong Sang-gyun and corroborated by reporting on the IPO advisory arrangement, points to a broader industry-wide shift toward governance-readiness before capital market access. Cointelegraph coverage
Looking ahead, investors and builders will be watching whether Korea’s exchanges can harmonize rapid user growth with robust risk management and regulatory alignment. The coming quarters will reveal if Bithumb’s patient approach to listing—paired with stronger governance—can unlock a credible path to a public market presence in a country where crypto adoption remains high but policy remains unsettled. Cointelegraph: February BTC-credit incident
Readers should watch how Bithumb reframes its governance blueprint, how Korea’s policy stance crystallizes around crypto taxation and stablecoins, and whether the broader IPO wave among domestically run exchanges gains or loses momentum as regulators weigh the costs and benefits of public listings in the crypto era.

The U.S. Treasury on Wednesday issued a notice of proposed rulemaking seeking public comment on state-level stablecoin governance under the GENIUS Act. The proposal clarifies how states may regulate stablecoins with a market cap under $10 billion, provided their regulations remain aligned with federal policy and standards.
The GENIUS framework—short for the Guiding and Establishing National Innovation for US Stablecoins Act—enables states to oversee smaller stablecoins, while ensuring that core protections stay in sync with federal rules. The Treasury NPRM outlines non-negotiable guardrails that issuers must meet, including a stringent reserve model, ongoing reporting, and strict compliance with federal anti-money laundering and sanctions policies.
Key takeaways
- The Treasury’s NPRM invites public comment on implementing GENIUS Act state-level governance for stablecoins under $10 billion in market cap, with alignment to federal standards.
- Core protections are codified: 1:1 reserve backing with cash or high-quality cash equivalents, plus monthly reporting requirements; full AML and sanctions compliance; and a ban on rehypothecation of reserves.
- States may impose their own liquidity, reserve, risk management, and enforcement rules, but only if they are equal to or more restrictive than federal standards and raise financial thresholds when appropriate.
- Comment period is open for 60 days; once a stablecoin issuer exceeds $10 billion in market cap, federal jurisdiction applies automatically to the largest issuers.
- The broader regulatory conversation continues to grapple with yield-bearing stablecoins and the viability of sharing interest with holders, a debate rich with tensions between innovation and incumbent financial interests.
Regulatory architecture clarified by the NPRM
The Treasury’s notice articulates a clear floor of protections that stablecoin issuers under state purview must observe. The proposed framework requires reserves to back each token on a 1:1 basis with cash or high-quality cash equivalents, paired with monthly reporting to maintain transparency and accountability. In addition, issuers must operate in full compliance with federal anti-money laundering and sanctions regimes, and the proposal explicitly prohibits rehypothecation, the practice of using the same reserve asset to back multiple claims.
Crucially, the NPRM emphasizes that state-level regimes should produce regulatory outcomes that are at least as stringent as the federal framework. This principle is designed to prevent a patchwork of weaker state rules that could undermine consumer protections or introduce systemic risk across the sector. The Treasury text also signals that states are free to implement stricter liquidity or risk-management procedures if they exceed federal requirements, provided those measures maintain a conservative, shielded stance toward stability and resilience.
For market participants, the NPRM sets the stage for a more modular regulatory landscape. Smaller issuers—those below the $10 billion threshold—could be governed by state-level regimes that mirror federal guardrails, while larger players would inevitably fall under federal oversight. The proposal reiterates that public comments are welcome for 60 days, signaling a proactive, consultative phase before any formal rule adoption.
State versus federal oversight and implications for issuers
Under the GENIUS Act, state authorities may regulate stablecoins that carry a market cap of less than $10 billion, so long as the rules do not deviate meaningfully from federal policy. This design aims to strike a balance between encouraging innovation at the state level and preserving a coherent national standard for token stability, disclosure, and consumer protection.
The NPRM also outlines a practical brake on the largest issuers. When an issuer surpasses the $10 billion threshold, federal jurisdiction takes precedence, meaning the biggest players would be regulated exclusively at the federal level. This arrangement acknowledges the systemic importance of the top stablecoins and aligns with broader efforts to harmonize oversight across federal and state lines.
The GENIUS Act itself has already seen significant political attention. The act became law after President Donald Trump signed it in July, marking a notable moment in U.S. crypto regulation. This backdrop helps explain why the Treasury’s NPRM emphasizes alignment with federal policies while granting states a time-limited runway to craft tailored approaches for smaller issuers. For readers following regulatory history, the law’s signing signaled an intent to formalize stablecoin governance rather than rely on scattered, disparate state actions.
Industry debate: yields, savings and regulatory tensions
Beyond the mechanics of reserve-backed tokens, the GENIUS framework intersects with a broader policy debate about yield-bearing stablecoins. Some industry participants, including Coinbase among others, contend that stablecoins capable of earning interest could offer savers a competitive alternative to traditional savings accounts, which have historically yielded well under 1 percent in many markets. This view has positioned yield-bearing stablecoins as a potential bridge between crypto markets and mainstream savings utilities.
Still, yield-bearing structures have drawn pushback from the traditional banking lobby, which argues that enabling token holders to share in yields could siphon deposits away from traditional banking, potentially threatening financial stability for incumbents. The regulatory conversation reflects this tension: on one side, proponents view yield-bearing stablecoins as a step toward more consumer-centric financial innovation; on the other, opponents warn about destabilizing effects on conventional funding models.
Adding to the regulatory backdrop, the Financial Stability Board has previously warned about the risks posed by dollar-pegged stablecoins, particularly in emerging markets where policy transmission is more fragile. Those concerns frame a policy environment that seeks to deter a repeat of systemic stress while still supporting innovation in payments and settlement. The broader debate remains unsettled in Congress, where the CLARITY market-structure bill has stalled, complicating efforts to codify how stablecoins interact with traditional banking rails and market infrastructure.
As the rulemaking unfolds, industry participants will be watching how aggressively states implement the NPRM’s guardrails and whether federal regulators move more quickly to scale the top stablecoins into a federally comprehensive regime. The balance between openness to innovation and rigorous risk controls will shape not only token issuers but also users seeking safer, more transparent access to digital assets.
What to watch next
Public comments on the Treasury’s NPRM must be submitted within 60 days, marking the start of a multi-stage rulemaking process. Investors and builders should monitor how state regulators translate the general principles into concrete requirements, and whether any state-level regimes carve out distinct treatment for particular subcategories of stablecoins. The dynamic between state flexibility and federal uniformity will likely influence the pace at which stablecoins with smaller market caps gain practical legitimacy, while the largest issuers navigate a centralized federal framework.
For broader context, keep an eye on ongoing regulatory discussions around yield-bearing stablecoins and the fate of related U.S. legislation, such as the CLARITY bill, which currently remains stalled in Congress. The evolving regulatory narrative—spanning state innovation, federal cohesion, and the risk-versus-reward calculus for yield-bearing structures—will shape how users, traders, and issuers approach stablecoins in the months ahead.

‘Love Island’ Stars Crash Beaches For Boozy Bash
Iran-US war latest: Oil prices spike after Trump vows to keep hitting Iran ‘extremely hard’ in address to nation

Hopes dim for swift end to Iran war after Trump speech, oil prices surge anew


-

 Business6 days ago
Instagram, YouTube Found Responsible for Teen’s Mental Health Struggle in Historic Ruling
-
 Tech7 days ago
Intercom’s new post-trained Fin Apex 1.0 beats GPT-5.4 and Claude Sonnet 4.6 at customer service resolutions
-

 NewsBeat5 days ago
The Story hosts event on Durham’s historic registers
-

 Sports5 days ago
Sweet Sixteen Game Thread: Tide vs Michigan
-
Entertainment3 days ago
Fans slam 'heartbreaking' Barbie Dream Fest convention debacle with 'cardboard cutout' experience
-
 Entertainment4 days ago
Lana Del Rey Celebrates Her Husband’s 51st Birthday In New Post
-
Crypto World2 days ago
Dems press CFTC, ethics board on prediction-market insider trades
-

 Crypto World8 hours ago
Gold Price Prediction: Worst Month in 17 Years fo Save Haven Rock
-

 Tech3 days ago
The Pixel 10a doesn’t have a camera bump, and it’s great
-

 Sports2 days ago
Tallest college basketball player ever, standing at 7-foot-9, entering transfer portal
-

 Tech2 days ago
EE TV is using AI to help you find something to watch
-

 Tech3 days ago
Apple will hide your email address from apps and websites, but not cops
-

 Tech2 days ago
Flipsnack and the shift toward motion-first business content with living visuals
-

 Tech2 days ago
How to back up your iPhone & iPad to your Mac before something goes wrong
-

 Fashion7 days ago
En Vogue in Brown Leather and Tailored Neutrals by Atelier Savoir, Styled by J Bolin
-

 Politics2 days ago
Should Trump Be Scared Strait?
-

 Crypto World2 days ago
U.S. rule change may open trillions in 401(k) funds to crypto
-

 Fashion7 days ago
What Are Your Favorite T-Shirts for the Weekend?
-

 Fashion6 days ago
Weekly News Update, 3.27.26 – Corporette.com
-

 Crypto World1 day ago
Bitcoin enters the public bond market as Moody’s gives a first-of-its-kind crypto deal a rating
You must be logged in to post a comment Login