
Crypto World
WhiteBIT Coin rallies 8% after FC Barcelona partnership, more gains incoming?
WhiteBIT Coin surged nearly 8% on Wednesday, emerging as one of the top-performing crypto assets as fresh momentum followed a major partnership announcement.
Summary
- WhiteBIT Coin rose nearly 8% after announcing a five-year partnership expansion with FC Barcelona, adding new utility via crypto-linked payment features.
- Deflationary tokenomics, including recent burns and a 33% fee-based buyback program, have supported price strength amid broader market weakness.
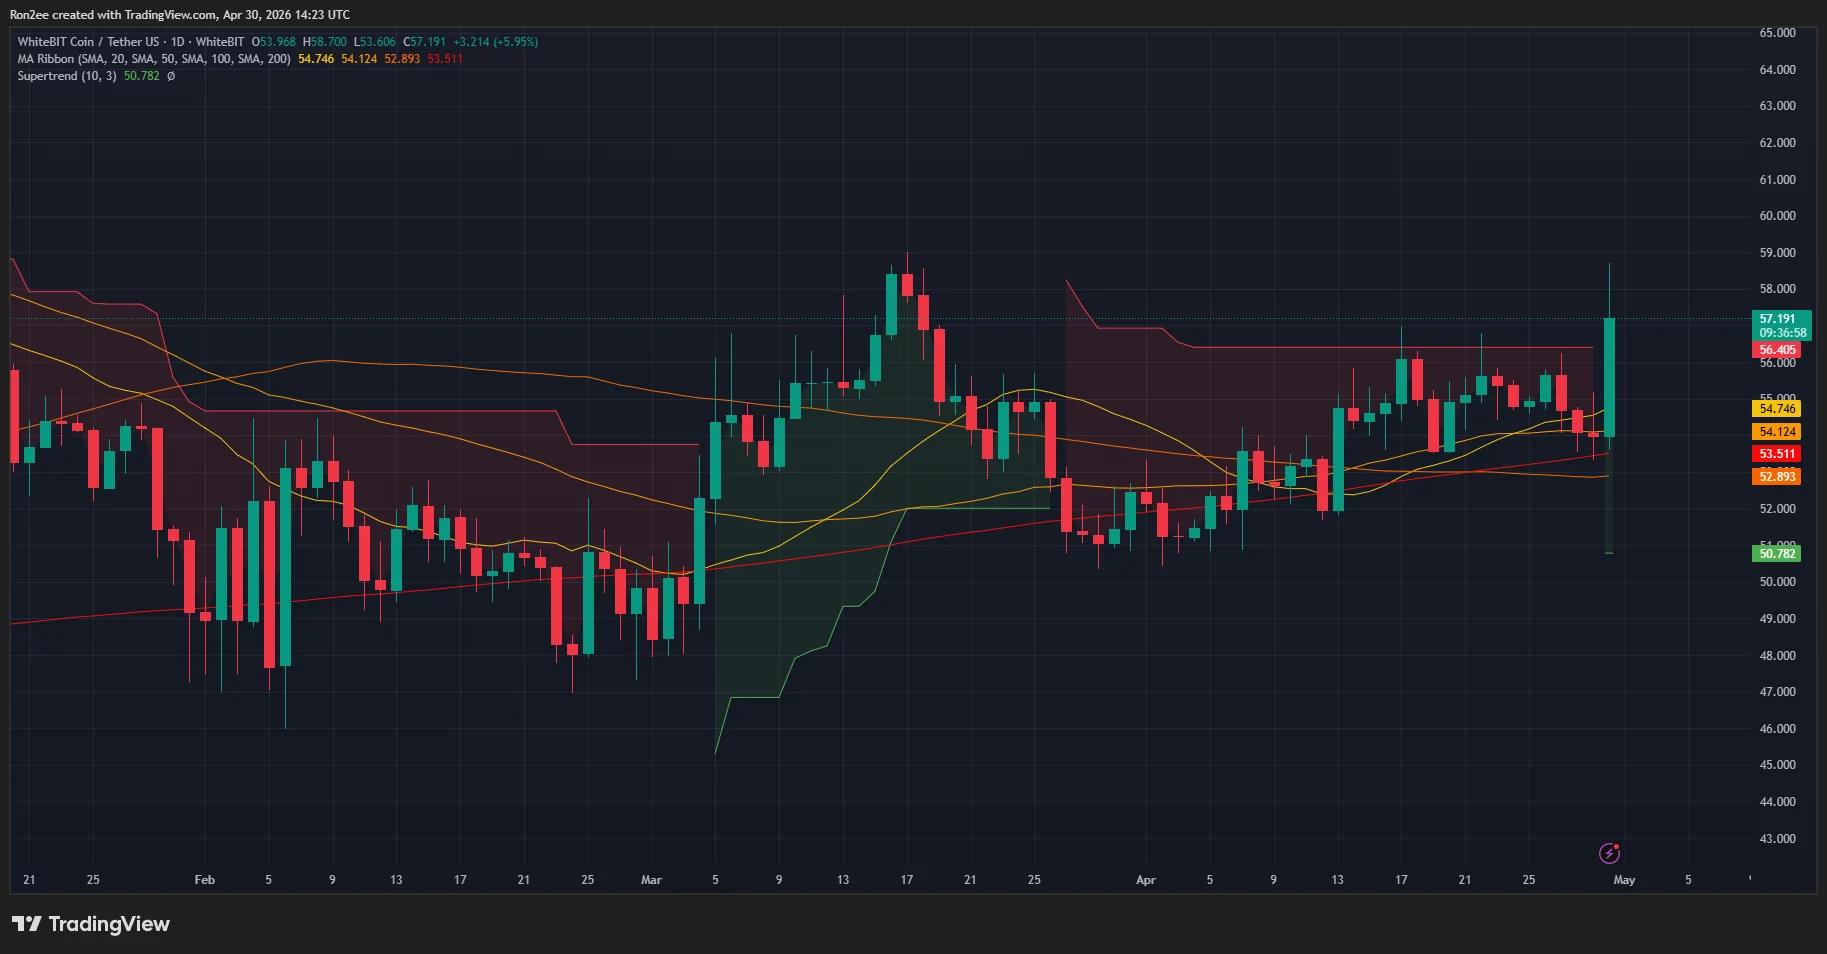
- WBT broke above the $55–$56 range and now eyes $58–$60 resistance, with $54–$55 acting as key support if momentum fades.
The token jumped after WhiteBIT confirmed an expanded five-year collaboration with FC Barcelona, strengthening its presence in the global sports ecosystem. The deal introduces new utility features, including a themed WhiteBIT Nova debit card, aimed at integrating crypto payments into the club’s fan experience.
WBT has also continued to benefit from its earlier partnership with Juventus, which has historically supported price growth by boosting brand visibility and user adoption.
At the same time, the rally has been reinforced by strong tokenomics. WhiteBIT maintains a deflationary structure, with regular token burns reducing circulating supply. More than 64,000 WBT, worth around $3.5 million, were removed from circulation in late April, following another burn earlier in the month.
The exchange also allocates roughly 33% of its trading fees toward buybacks, further limiting sell-side pressure and supporting price stability during broader market weakness.
Market expansion efforts have added to the bullish momentum. WBT’s inclusion in S&P crypto indices has improved its institutional visibility, while a recent listing on Kraken has expanded access through new USD and EUR trading pairs.
A strategic cooperation with Saudi-based Durrah AlFodah Holding is also expected to support blockchain adoption initiatives in line with the country’s Vision 2030, potentially opening new growth avenues for the ecosystem.
On the daily chart, WBT has broken out of a consolidation range that had capped price action near the $55–$56 region in recent sessions. The breakout pushed the token to an intraday high near $58 before slightly easing.

Price is now trading above key moving averages, including the 20-day and 50-day levels, indicating strengthening short-term momentum. The Supertrend indicator has also flipped bullish, further supporting the upside bias.
If the breakout sustains, the next resistance zone appears near the $58–$60 region, where prior rejection levels are visible. A successful move above this range could open the door for a continuation toward higher levels.
However, if buying momentum fades, WBT could retest support near the $54–$55 zone, which now acts as a key level to watch.
Disclosure: This article does not represent investment advice. The content and materials featured on this page are for educational purposes only.


Bitcoin’s April advance appears increasingly fragile from a sector-wide perspective, as a sharp rally driven by futures trading contrasts with cooling spot demand. CryptoQuant’s latest on-chain analysis shows a roughly 20% rise for Bitcoin in April, climbing from around $66,000 to a peak near $79,000, a move the firm attributes largely to growth in perpetual futures activity. At the same time, on-chain data indicate the market’s marginal buyer was more speculative than fundamental, a dynamic that raises questions about sustainability beyond the current cycle.
As of this writing, Bitcoin was hovering around $77,000, up about 2% on the prior 24 hours. CryptoQuant noted that the April price surge diverged from underlying spot demand, signaling that the momentum may not be supported by long-term buyers or real user adoption. In its assessment, the firm described the divergence between rising prices and contracting spot demand as one of the clearest on-chain signals that current gains are driven by speculative activity rather than a structural shift in demand fundamentals.
Key takeaways
- April’s roughly 20% Bitcoin rally was led by perpetual futures demand, with spot buying cooling during the move.
- The price surge coincided with a backdrop of contracting spot demand, signaling a speculative-driven rally rather than a broad-based fundamentals-led move.
- CryptoQuant warned that the divergence between price and on-chain demand has historically preceded further downside in Bitcoin’s price within bear-market regimes.
- CryptoQuant’s Bull Score Index slid to 40 in April, suggesting growing bearish sentiment despite the price uptick.
Futures-led momentum and the spot-demand paradox
The CryptoQuant report emphasizes a notable shift in market mechanics during April. While Bitcoin advanced toward the high 70s, on-chain activity that would indicate sustained interest from real-world buyers—such as steady spot purchases or rising exchange balances held by long-term holders—remained muted. The firm framed this as a classic indicator of speculative leverage: price gains propelled by futures demand, not by a broadened base of physical demand or treasury accumulation.
Such dynamics are not isolated incidents. The data point to a broader pattern in which a futures-dominated rally can inflate prices temporarily while underlying demand remains fragile. This distinction matters for traders and holders who weigh whether a rally represents a durable shift in the market’s risk-reward or a tactical move that could reverse under tightening liquidity or shifting sentiment.
Comparative context: past cycles and risk signals
CryptoQuant highlighted a historical resonance with the early phase of the 2022 bear market, when futures-driven strength outpaced the spot market before a sustained price decline took hold. In that frame, a rally built on speculative demand without corresponding fundamentals can intensify downside pressure once speculative incentives swing the other way or market liquidity tightens.
That risk assessment sits alongside other macro and market signals. Bitcoin’s current trajectory—price resilience paired with weakening on-chain fundamentals—creates a mixed backdrop for market participants. CryptoQuant stressed that the pattern observed in April remains a reminder of the bear-market regime’s potential to reassert itself, even as short-term momentum persists.
Dueling narratives on the drivers of the rally
The April move has drawn attention to differing interpretations of what’s fueling Bitcoin’s resilience. On one side, CryptoQuant’s analysis underscores the preponderance of futures-driven activity, warning that the rally may not reflect a durable shift in demand fundamentals. On the other side, commentary from market participants has highlighted substantial demand from other quarters. For instance, Bitwise’s chief investment officer Matt Hougan argued that bitcoin-related strategic purchases, including actions by an entity described as Strategy, have been a central driver of the recent rally. He pointed to strong ETF demand and renewed interest from long-term holders as reinforcing factors, while singling out Strategy as a particularly significant contributor to the rally’s momentum.
Both perspectives point to a broader theme: multiple drivers of price action can coexist, and disentangling them is essential for assessing whether the rally will endure. If futures-driven demand remains the dominant force, the market could face heightened volatility and potential downside if those funds retreat or if spot buyers do not step in to take their place.
Market sentiment and what to watch next
CryptoQuant’s Bulls Score, an index that combines market and network signals to gauge sentiment, dipped from 50 to 40 in April. The decline suggests a softening near-term outlook despite price gains, aligning with the idea that the market may be approaching a more cautious phase. The combination of price strength with weakening sentiment and spot demand has prompted observers to wonder whether the rally can translate into a more durable uptrend or if it will unwind as speculative liquidity tightens.
For investors, several questions loom: Will spot buyers eventually re-enter with conviction, supported by macro catalysts or institutional inflows? Or will futures-driven momentum fade, leaving prices to correct as speculative positions unwind? The answer may hinge on how other demand channels—such as ETFs, long-term Treasury-like holdings, and emerging institutional interest—respond in the coming weeks and months.
Closing perspective
As Bitcoin navigates a marketplace characterized by mixed signals, the split between price momentum and fundamental demand remains a critical watchpoint. The April episode reinforces a broader lesson for investors and builders: price action can diverge from on-chain health for extended periods, but sustained upside typically requires a genuine uptick in durable demand. Readers should monitor how spot demand evolves, how institutional and ETF-driven flows develop, and whether sentiment indices indicate a meaningful shift toward risk appetite or a cautiousism that could cap near-term gains.
EUR/USD started a fresh increase above 1.1700 and 1.1720. USD/CHF declined further and is now struggling below 0.7835.
Important Takeaways for EUR/USD and USD/CHF Analysis Today
· The Euro started a decent increase from 1.1650 against the US Dollar.
· There was a break above a bearish trend line with resistance at 1.1685 on the hourly chart of EUR/USD at FXOpen.
· USD/CHF declined below the 0.7865 and 0.7850 support levels.
· There was a break below a bullish trend line with support at 0.7910 on the hourly chart at FXOpen.
EUR/USD Technical Analysis

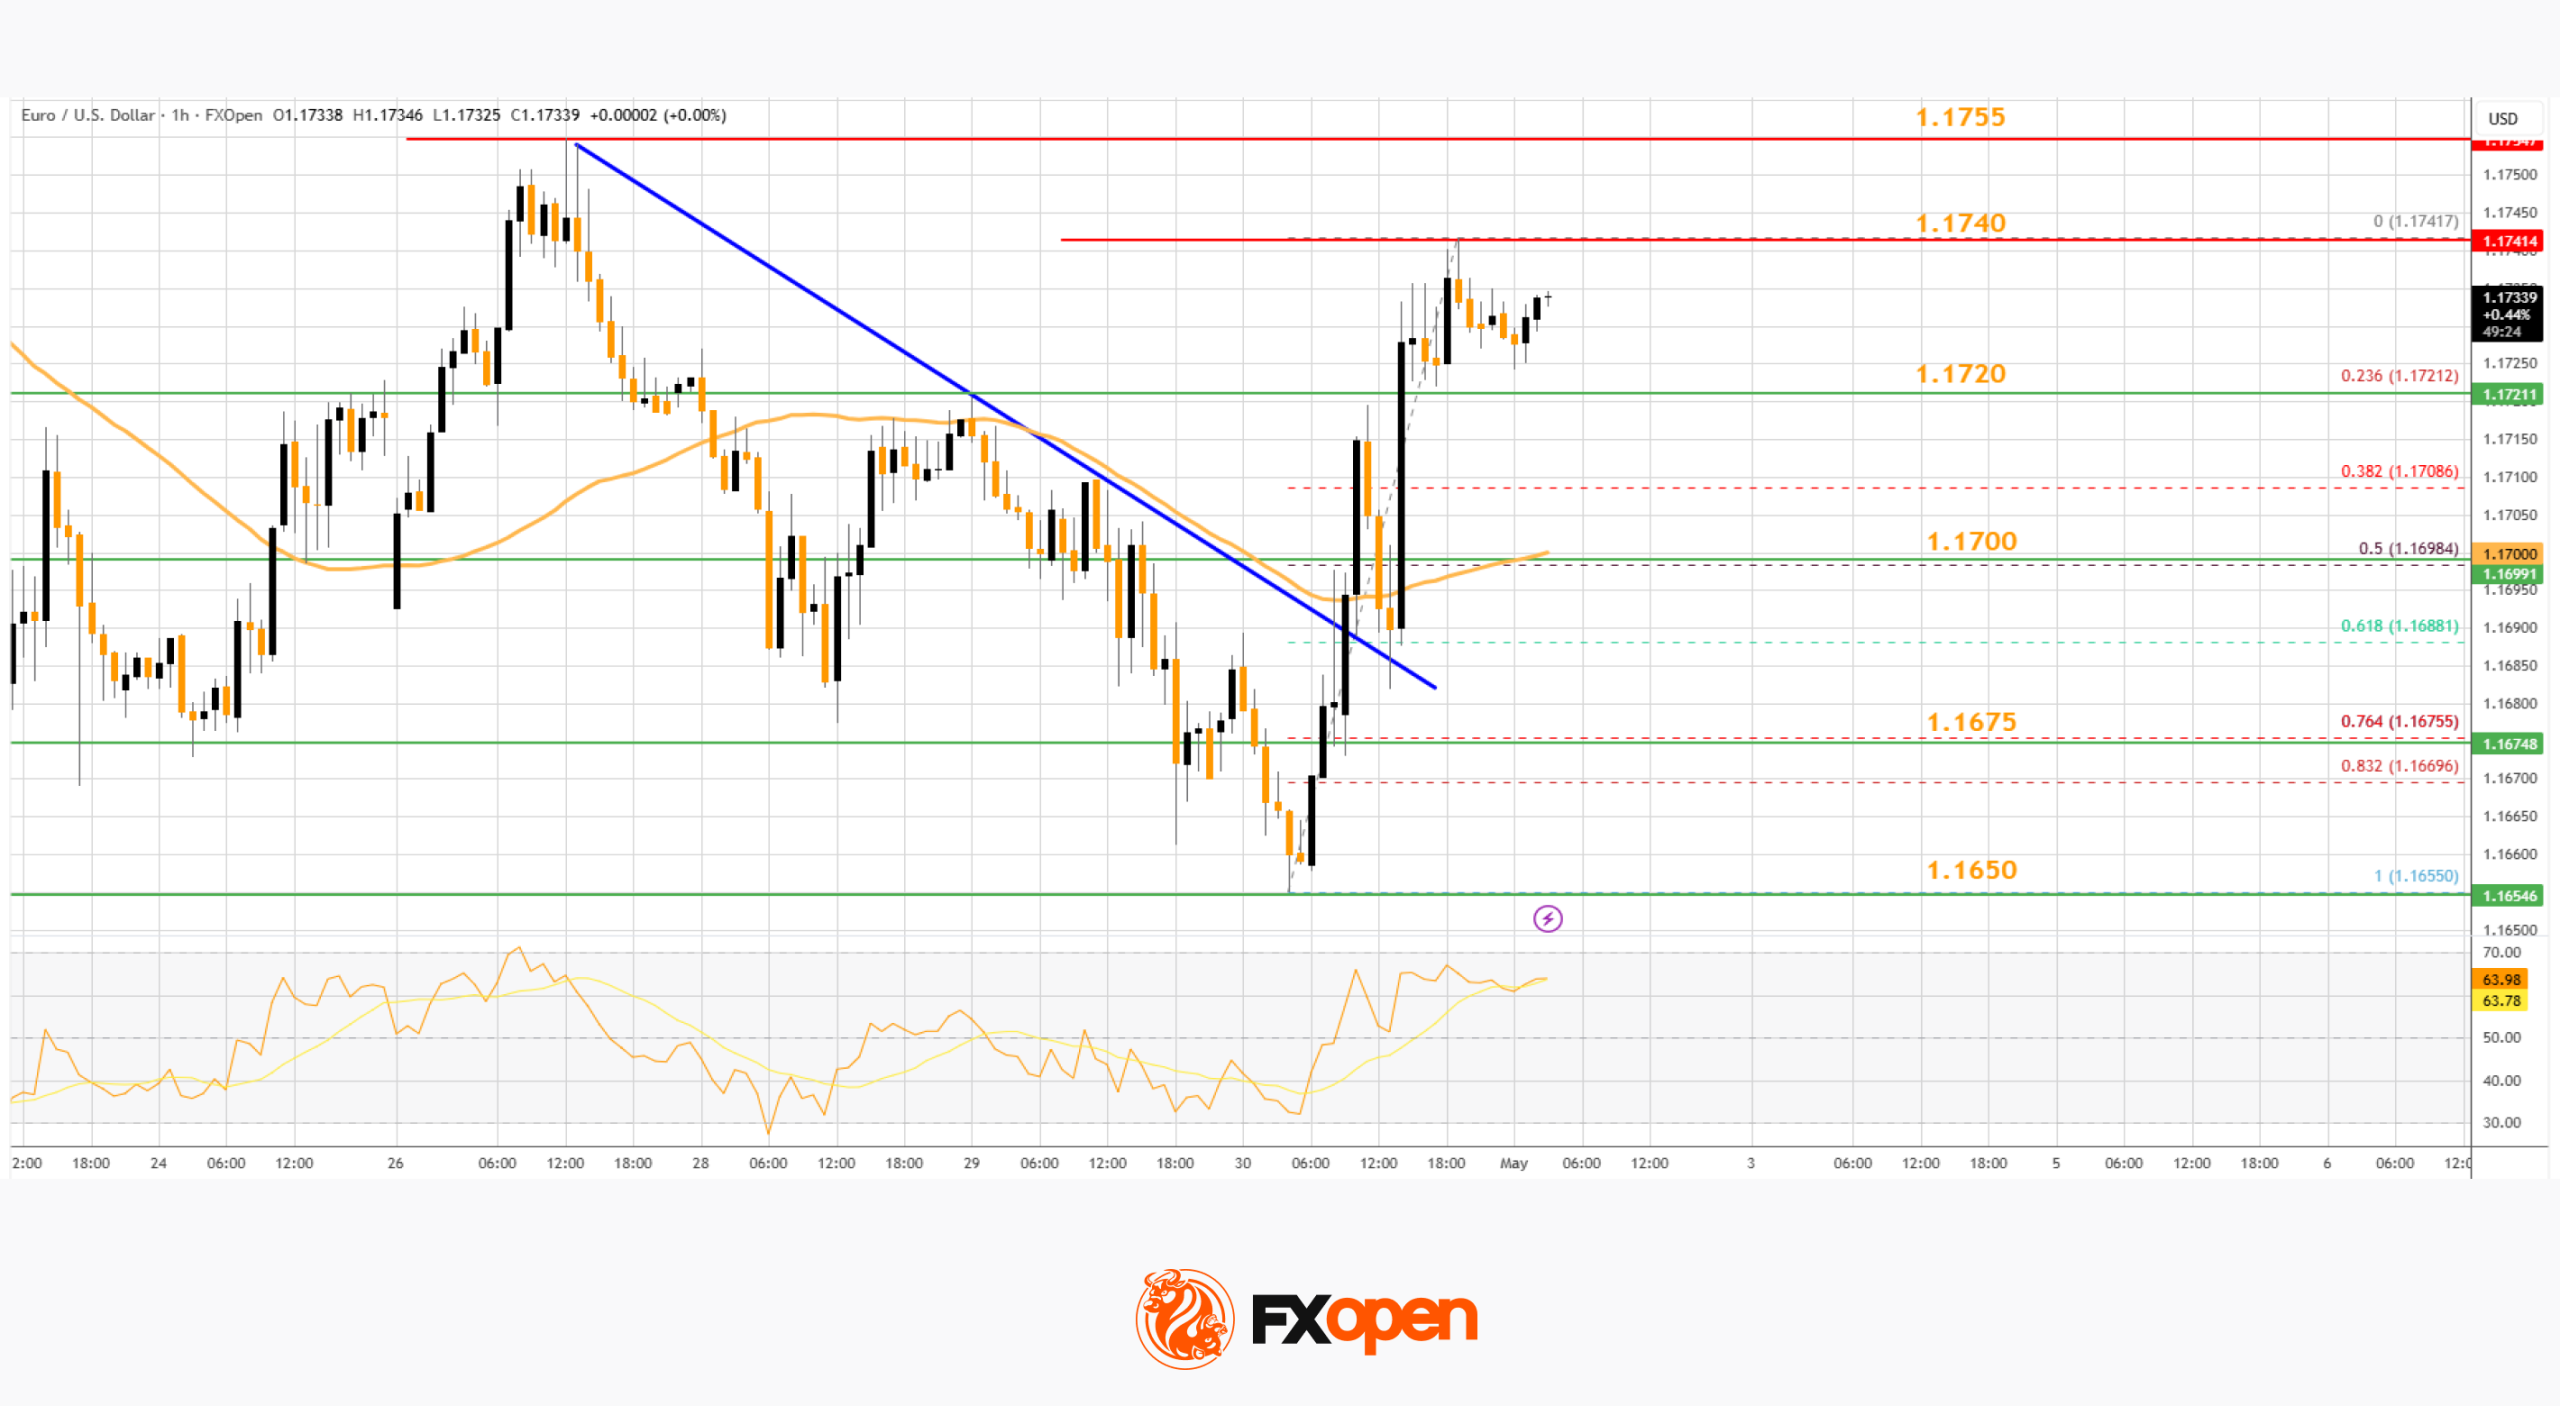
On the hourly chart of EUR/USD at FXOpen, the pair started a fresh increase from the 1.1650 zone. The Euro cleared the 1.1700 barrier to move into a bullish zone against the US Dollar.
There was a break above a bearish trend line with resistance at 1.1685. The bulls pushed the pair above the 50-hour simple moving average and 1.1720. Finally, the pair cleared 1.1735. A high was formed near 1.1740 and the pair is now consolidating gains.
An Immediate bid zone on the downside is near the 23.6% Fib retracement level of the upward wave from the 1.1655 swing low to the 1.1740 high at 1.1720.
The next area of interest could be near 1.1700, the 50% Fib retracement level, and the 50-hour simple moving average. A downside break below 1.1700 might send the pair toward 1.1675. Any more losses might send the pair into a bearish zone toward 1.1650.
If there is a fresh increase, an immediate hurdle on the EUR/USD chart is 1.1750. The first major pivot level for the bulls could be 1.1755. An upside break above 1.1755 might send the pair to 1.1800. The next selling zone could be 1.1850. Any more gains might open the doors for a move toward 1.1920.
USD/CHF Technical Analysis
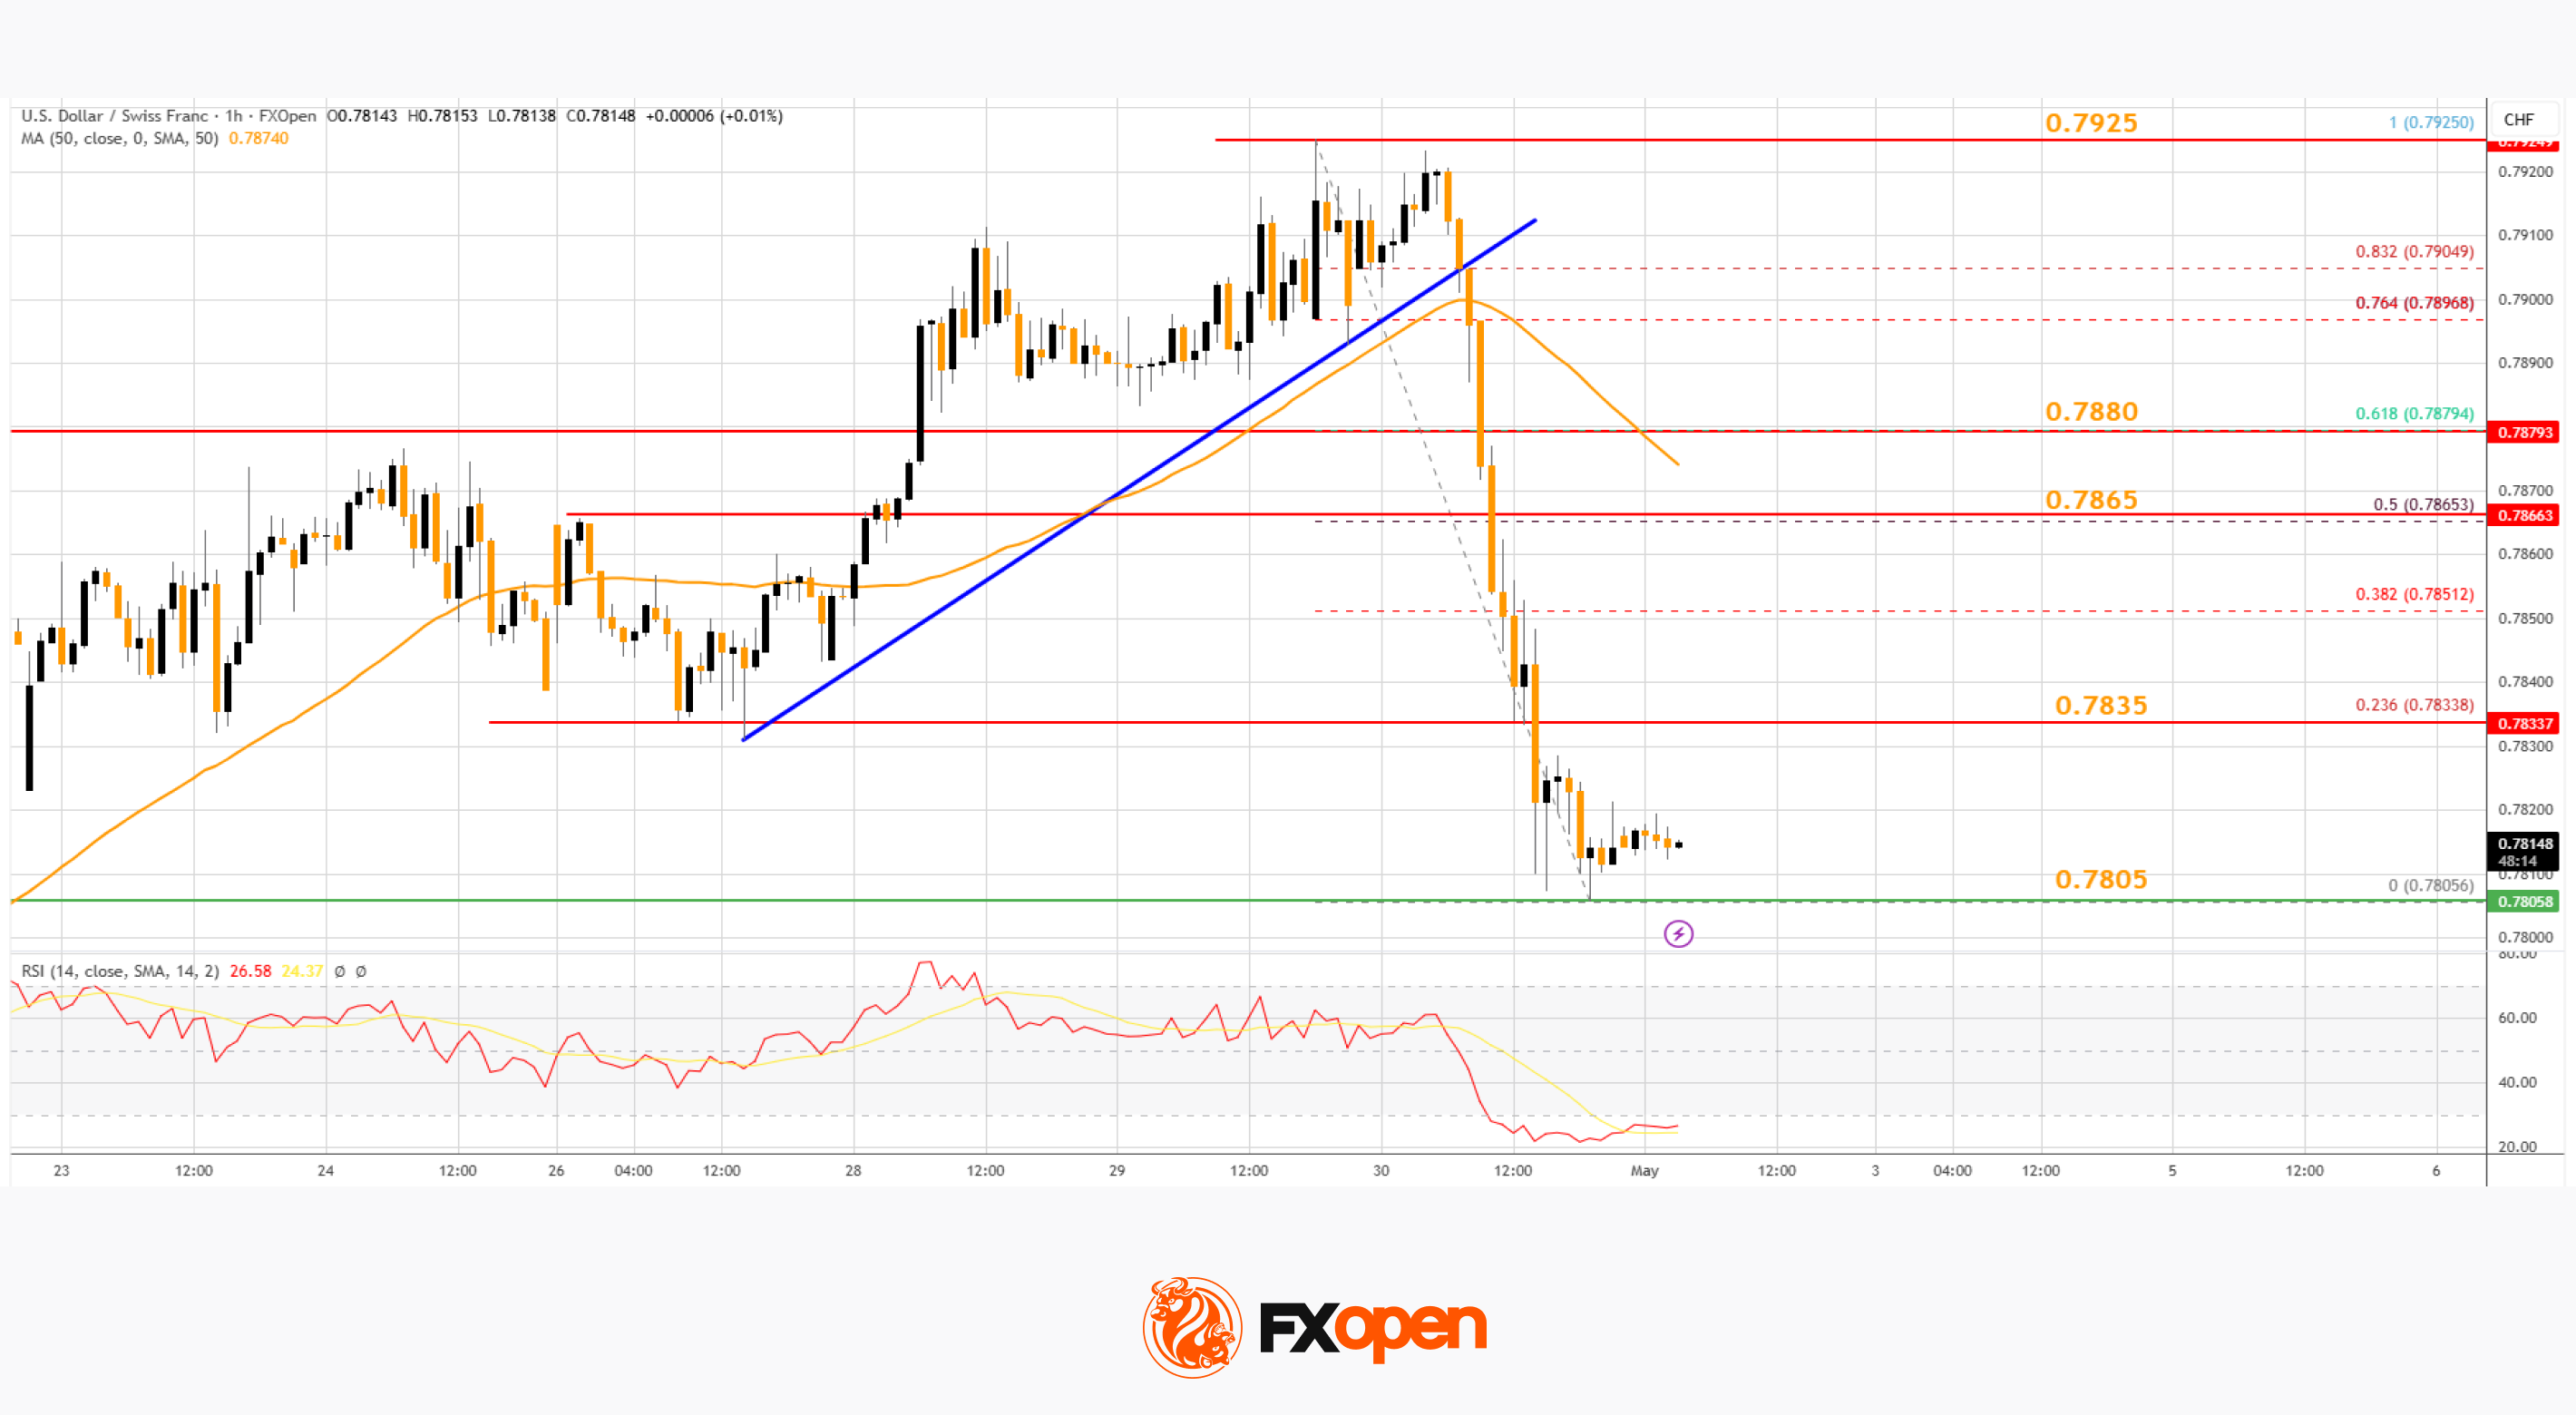
On the hourly chart of USD/CHF at FXOpen, the pair started a fresh decline from well above 0.7900. The US Dollar dropped below 0.7880 to move into a negative zone against the Swiss Franc.
There was a break below a bullish trend line with support at 0.7910. The bears pushed the pair below the 50-hour simple moving average and 0.7850. Finally, the bulls appeared near 0.7800. A low was formed near 0.7805, and the pair is now consolidating losses.
On the upside, the pair could face bears near the 23.6% Fib retracement level of the downward move from the 0.7925 swing high to the 0.7805 low at 0.7835.
The first major resistance sits near the 50% Fib retracement level at 0.7865. The main barrier for an upside break could be near the 50-hour simple moving average at 0.7880. A daily close above 0.7880 could start a fresh increase. In the stated case, the pair could rise toward 0.7925. The next stop for the bulls might be 0.7965.
On the downside, immediate support on the USD/CHF chart is 0.7805. The first major breakdown zone could be 0.7780. A close below 0.7780 might send the pair to 0.7750. Any more losses may possibly open the doors for a move toward 0.7700 in the coming days.
Trade over 50 forex markets 24 hours a day with FXOpen. Take advantage of low commissions, deep liquidity, and spreads from 0.0 pips (additional fees may apply). Open your FXOpen account now or learn more about trading forex with FXOpen.
This article represents the opinion of the Companies operating under the FXOpen brand only. It is not to be construed as an offer, solicitation, or recommendation with respect to products and services provided by the Companies operating under the FXOpen brand, nor is it to be considered financial advice.


Riot Platforms reported first-quarter 2026 revenue of $167.2 million. This compares with $161.4 million in the same quarter last year.
Summary
- Riot generated $167.2 million in Q1 revenue as data center income reached $33.2 million.
- AMD doubled its contracted Riot data center capacity to 50 megawatts after exercising an option.
- Riot sold 3,778 BTC in Q1 and later transferred another 500 BTC to NYDIG.
The company produced 1,473 Bitcoin during the quarter. That was lower than 1,530 Bitcoin produced in the first quarter of 2025.
Riot recorded its first quarter of data center revenue at $33.2 million. The amount included $0.9 million in operating lease revenue and $32.2 million from tenant fit-out services.
CEO Jason Les said the quarter marked a shift for Riot into a revenue-generating data center operator. He said, “The first quarter of 2026 marks a definitive inflection point for Riot.”
AMD doubles contracted capacity
Riot said AMD exercised an option for another 25 megawatts of capacity. This brings AMD’s total contracted capacity with Riot to 50 megawatts of critical IT capacity.
Les said AMD’s expansion “validates” Riot’s ability to deliver capacity for large tenants. The company said it now plans to use its approved power portfolio to grow the data center business.
Bitcoin sales continue amid mining pressure
Riot’s Bitcoin mining revenue fell to $111.9 million from $142.9 million a year earlier. The company linked the drop to lower average Bitcoin prices and a higher global network hash rate.
The average cost to mine Bitcoin, excluding depreciation, rose to $44,629. Riot said this was partly due to a 24% increase in the average global network hash rate.
Riot also disclosed that it sold 3,778 Bitcoin in Q1 2026. The sales generated $289.5 million in proceeds.
On-chain data cited by Lookonchain showed Riot later sent another 500 BTC to an NYDIG deposit address. The transfer was worth about $39 million at the time of reporting.
Riot stock rises after results
Riot ended the quarter with 15,679 Bitcoin. Of this amount, 5,802 Bitcoin were held as collateral. The total Bitcoin holdings were valued at about $1.1 billion based on a March 31 Bitcoin price of $68,222.
The company also held $282.5 million in cash, including $76.9 million in restricted cash. Riot shares closed at $17.24 on Thursday after gaining 7.9% during the session.

Key Takeaways
- Q3 revenue reached $5.95B, representing a year-over-year increase of 251% and exceeding analyst projections of $4.73B.
- Earnings per share (adjusted) landed at $23.41, crushing Wall Street’s $14.66 forecast by $8.75.
- Shares initially jumped following the announcement but retreated approximately 5% during Friday’s premarket session.
- Revenue from datacenter operations climbed 233% sequentially, propelled by a 137% increase in pricing throughout all business units.
- Fourth-quarter revenue guidance of $7.75B–$8.25B significantly surpassed the Street’s $6.65B expectation.
SanDisk delivered what many consider one of its most impressive quarterly performances on Thursday, handily surpassing both revenue and profit expectations set by Wall Street analysts. Yet shares experienced a roughly 5% decline in Friday’s premarket trading, despite management presenting an optimistic outlook for the quarters ahead.
Third-quarter revenue totaled $5.95 billion, marking a dramatic 251% climb compared to the same period last year. This figure easily eclipsed the analyst consensus estimate of $4.73 billion. On the earnings front, adjusted EPS registered at $23.41, demolishing the Street’s $14.66 projection by nearly $9 per share.
Prior to the pullback, the stock had reached approximately $1,096.51, hovering close to its 52-week peak of $1,115.
The datacenter division emerged as the undisputed growth driver. Datacenter revenue skyrocketed 233% on a sequential basis, buoyed by pricing increases of 137% spanning all product categories. While consumer and client segments experienced declines, the datacenter business more than compensated for these shortfalls.
CEO David Goeckeler characterized the quarter as representing “a fundamental inflection point” for the organization. He emphasized the company’s strategic pivot toward premium end markets, with datacenter operations spearheading this transformation.
Long-Term Agreements Strengthen Revenue Foundation
SanDisk executed five multi-year agreements during Q3 and early Q4. Three contracts were finalized within the third quarter, while two additional deals closed in the fourth quarter. The three Q3 agreements alone are projected to deliver a minimum of $42 billion in contracted revenue, recognized on a quarterly basis.
The company also secured downside protection. SanDisk has locked in $11 billion in guaranteed payments should customers withdraw from their capacity obligations — providing crucial insurance against potential market downturns.
Pricing strength has extended across the entire product portfolio. AI-driven supply constraints in the NAND memory sector have enabled SanDisk to implement higher pricing, and the forthcoming introduction of BiCS8-based QLC enterprise SSDs is anticipated to sustain this favorable trend.
Analyst Community Responds
Wall Street analysts moved quickly to revise their price objectives upward.
BofA Securities elevated its price target to $1,550 from $1,080, reaffirming its Buy rating. The firm highlighted valuation opportunities, underappreciated joint venture holdings, and anticipated enterprise SSD market share expansion through 2026.
Raymond James increased its target to $1,470 from $725, describing the datacenter inflection as “clear” and commending the company’s strengthening customer partnerships.
Mizuho boosted its target to $1,220 from $1,000 while maintaining an Outperform rating.
Notwithstanding the positive sentiment, InvestingPro noted the stock appears overvalued when measured against its Fair Value calculation — although analysts are projecting full-year earnings of $44.72 per share.
For the fourth quarter, SanDisk provided revenue guidance ranging from $7.75B to $8.25B, with non-GAAP diluted EPS anticipated between $30.00 and $33.00. This outlook implies approximately 35% sequential revenue expansion. Fourth-quarter gross margins are projected to reach around 80%, exceeding the 74% consensus and representing a year-over-year improvement of roughly 5,400 basis points.


Japan Exchange Group is preparing for the possible launch of cryptocurrency ETFs once legal reforms are completed.
Summary
- JPX may list crypto ETFs once Japan finalizes legal and tax treatment for digital assets.
- CEO Hiroki Yamamichi said asset managers are showing interest in creating crypto-linked ETFs.
- Bitcoin ETFs returned to inflows, while Ethereum ETFs extended their outflow streak.
JPX CEO Hiroki Yamamichi said many asset managers are interested in creating crypto-linked ETFs. He told Bloomberg that “it can be done anytime once the legal framework is in place and the tax treatment is clarified.” The timeline remains tied to the pace of legal and tax changes in Japan.
Yamamichi said a crypto ETF listing could happen as early as next year, depending on reform progress. However, the timing could also move to 2028 if legal changes take longer.
JPX has already listed “entering new asset classes” in its medium-term management plan. The exchange operator has been reviewing crypto-related products as part of its plan to expand market choices.
Japan targets wider investor access
A crypto ETF would give investors a regulated product linked to digital assets. It could also help JPX expand its product lineup beyond traditional securities and derivatives.
The exchange wants to attract more investors by adding new asset classes. Still, the product launch depends on clear rules for crypto treatment and tax handling.
Bitcoin ETFs return to inflows
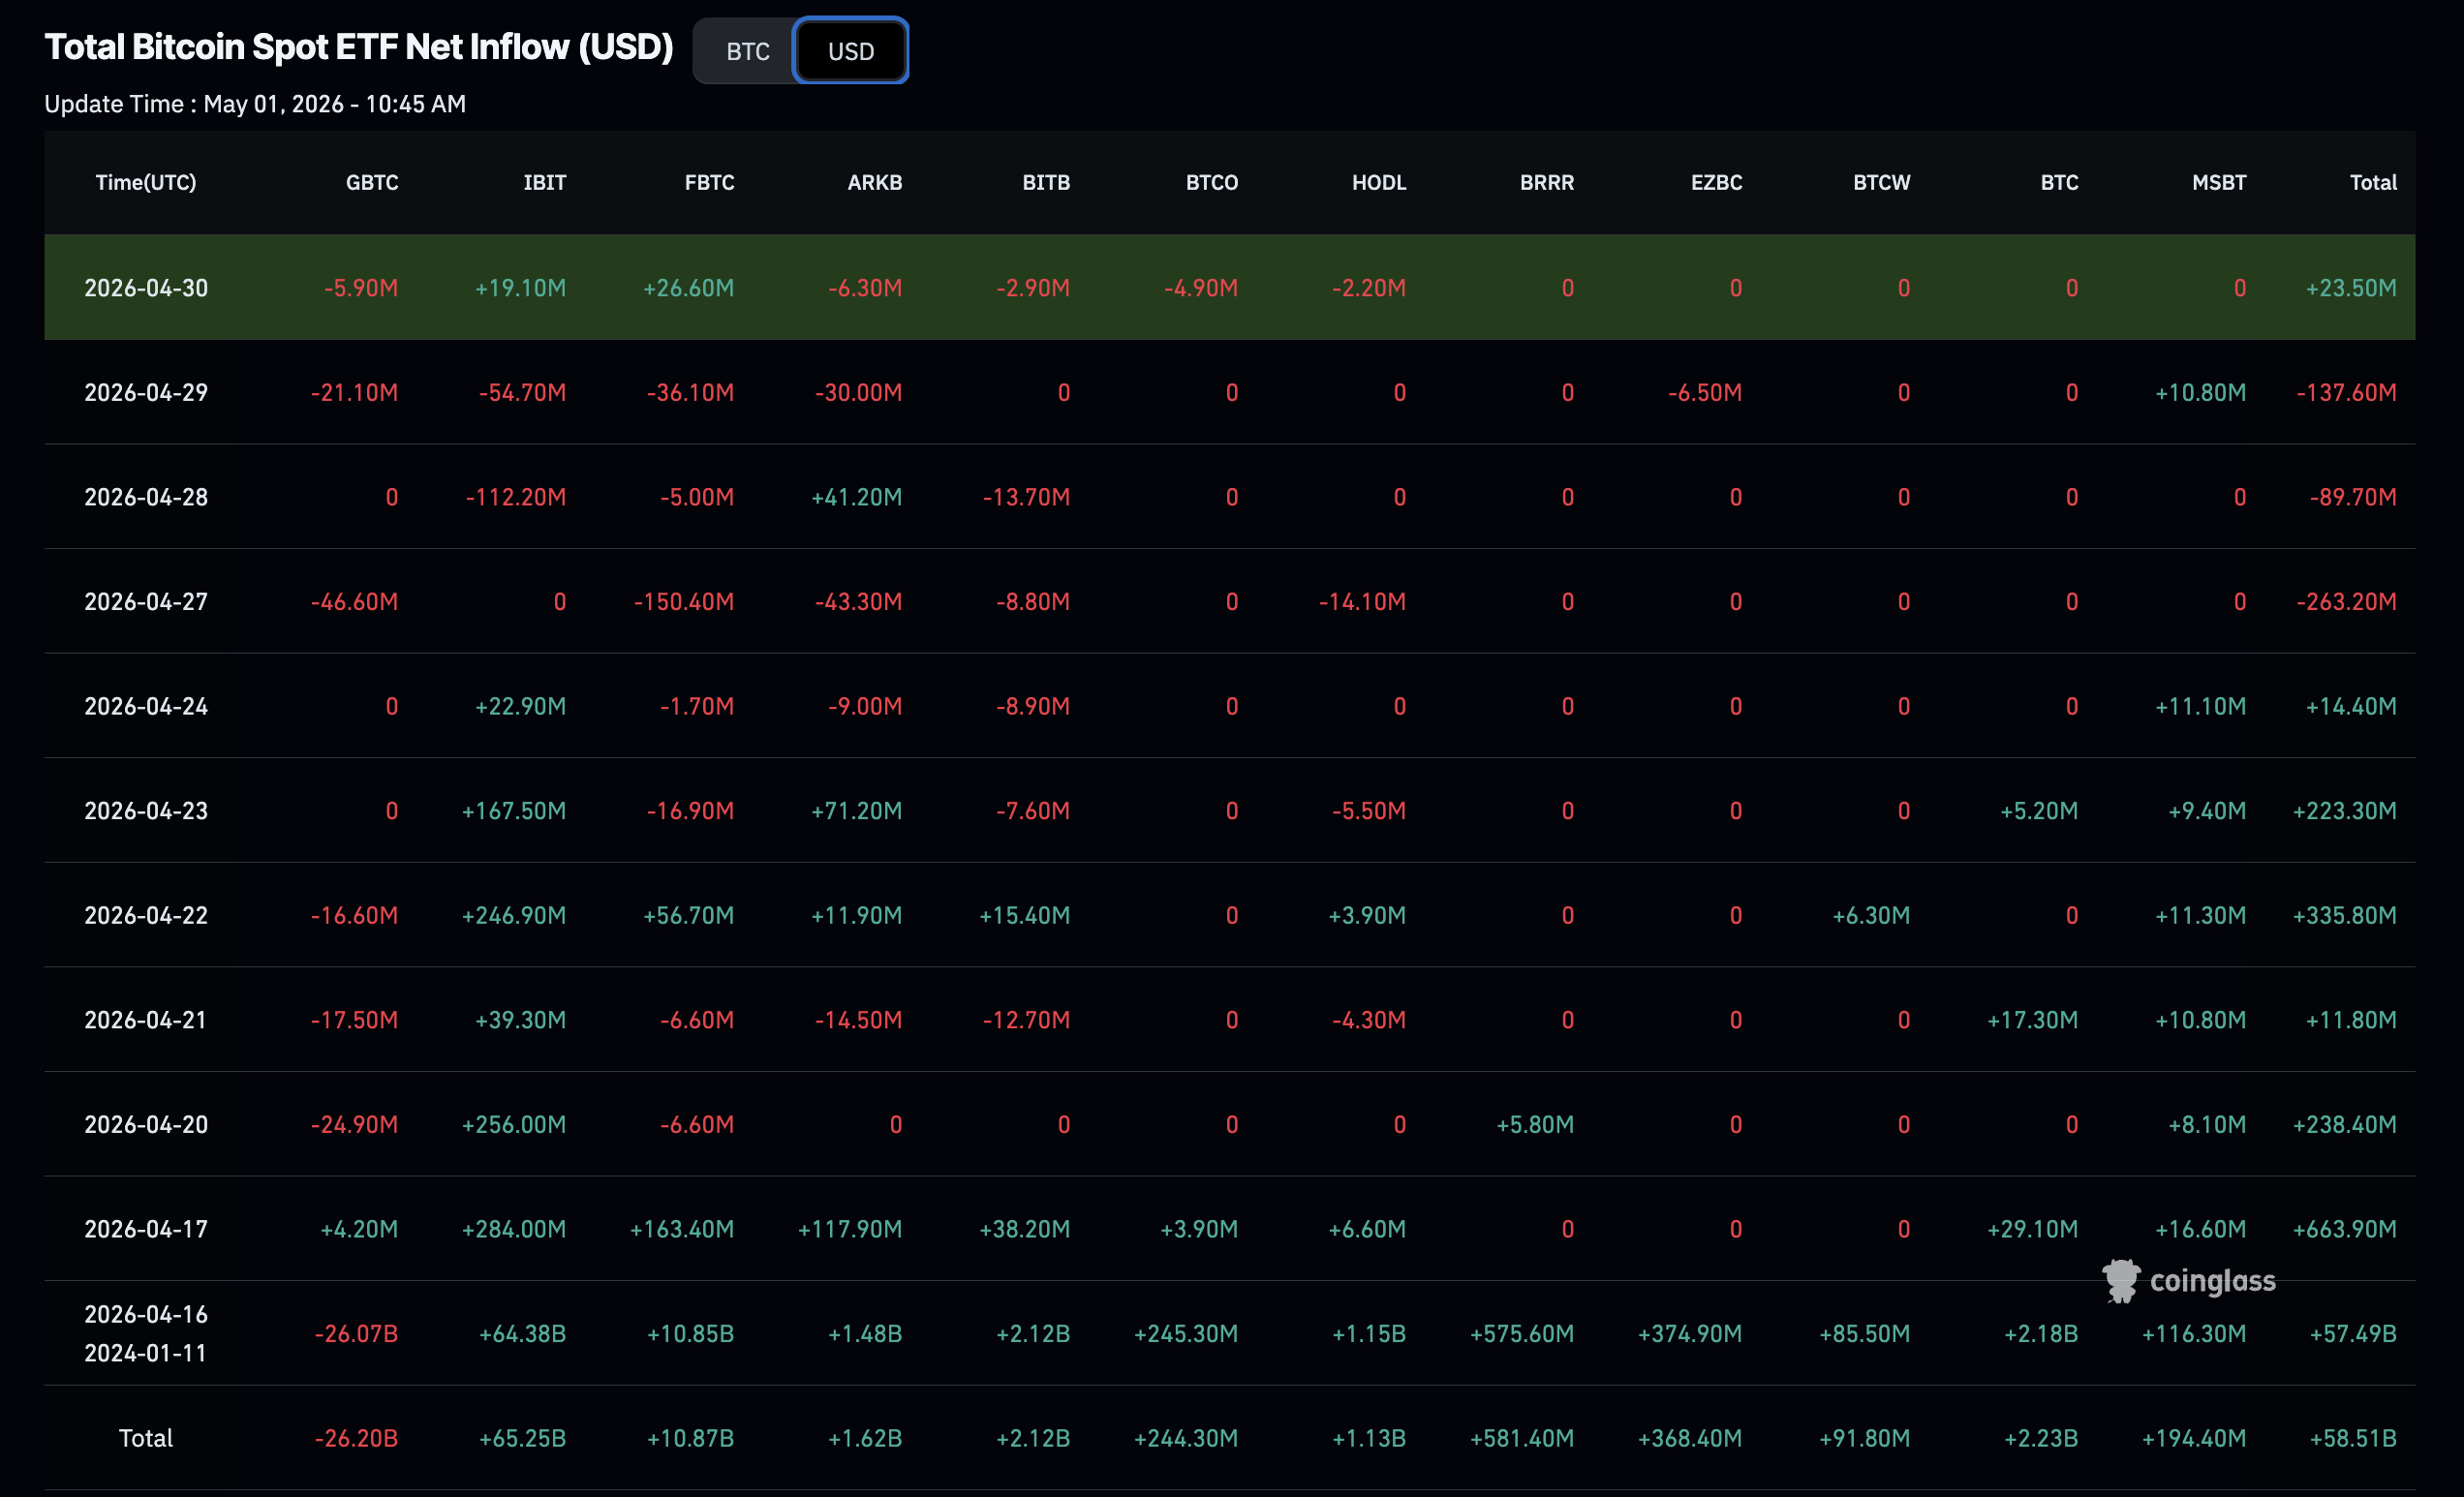
The comments came as global crypto ETF flows showed mixed movement. On April 30, Bitcoin spot ETFs recorded total net inflows of $14.75 million, according to SoSoValue data.
That marked the first positive day after three straight days of net outflows. Ethereum spot ETFs moved in the opposite direction, with $23.64 million in net outflows.
Ethereum funds have now posted four straight days of outflows. The split shows uneven demand across crypto investment products as Japan studies its own ETF framework.
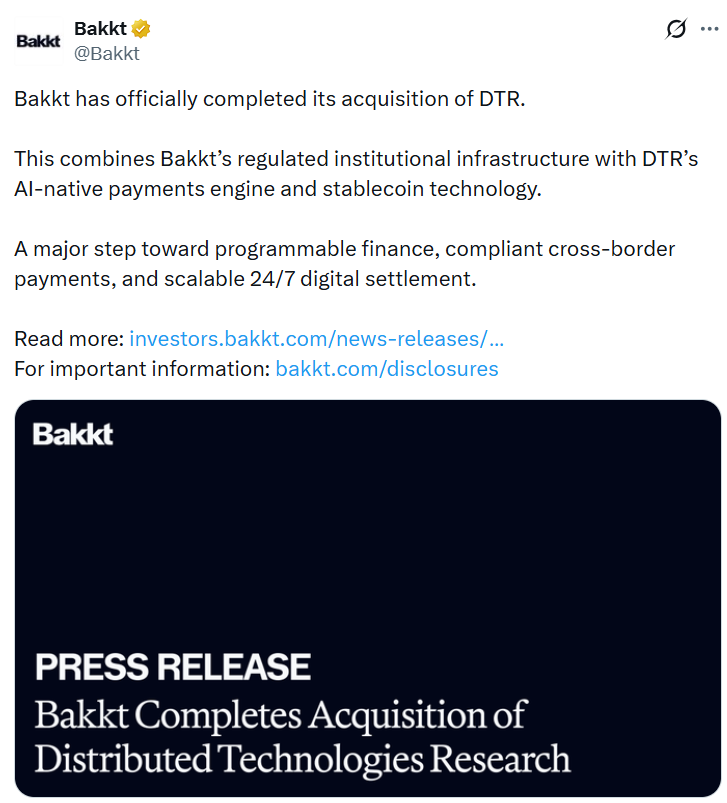
Digital asset company Bakkt completed its acquisition of stablecoin infrastructure firm Distributed Technologies Research (DTR) through an equity-based transaction as part of its bid to create a digital settlement layer.
Bakkt CEO Akshay Naheta said on Thursday that the deal aims to combine Bakkt’s institutional infrastructure with DTR’s native artificial intelligence payments engine and stablecoin technology to create a 24/7 digital settlement layer.
“The architecture of money movement rarely evolves at this level,” he said. “This transaction accelerates the re-platforming of global financial infrastructure. By fully integrating DTR’s technology, we are introducing stablecoin functionality as a critical bridge between legacy financial systems and the next generation of digital assets.”
The global stablecoin market has grown to roughly $320 billion, with adoption expanding across both developed and emerging economies as banks and institutions seek to leverage the technology for faster payments and other benefits.
Source: Bakkt
Acquisition deal completed through share issuance
As part of the deal, Bakkt issued more than 11.3 million shares to the beneficial holders of DTR, with the possibility of an additional 725,592 shares, according to the announcement.
The deal was initially revealed in January and originally involved 9.3 million shares. The company also announced a corporate name change to Bakkt Inc. at the same time.
Ahead of the deal’s completion, Bakkt’s share price (BKKT) fell roughly 8% to $7.86 by Wednesday’s close, but recovered to $8.62 by Thursday’s market close.
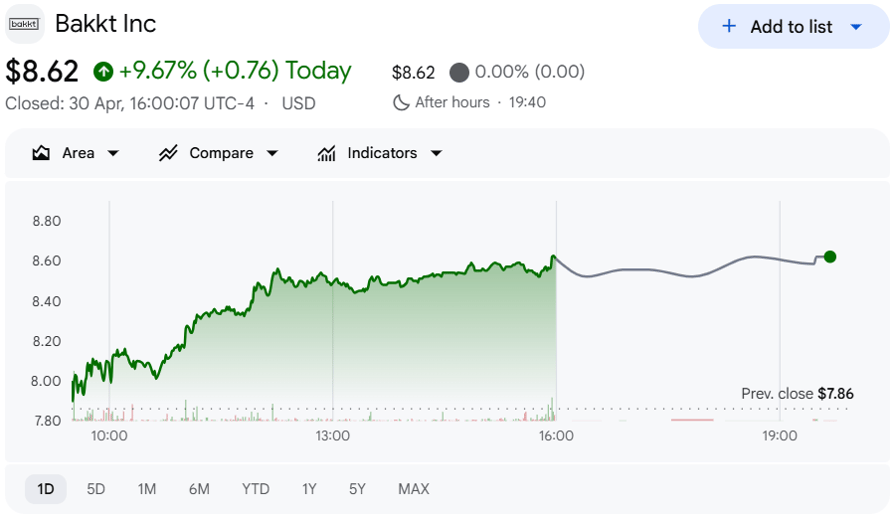
Bakkt’s share price fell Wednesday but has since risen 10%. Source: Google Finance
Bakkt threatened with delisting in 2024
Founded in 2018, Bakkt is 55% owned by Intercontinental Exchange (ICE), which also owns the New York Stock Exchange (NYSE), and has received backing from major partners such as Starbucks and Mastercard.
In March 2024, the NYSE threatened to delist Bakkt’s shares because the price had fallen below $1 and remained there for 30 days.
By May the company disclosed to regulators that there was “significant uncertainty associated with our expansion to new markets and the growth of our revenue base, given the uncertain and rapidly evolving environment associated with crypto assets.”
Related: Stablecoins overtake Bitcoin in Latin America crypto purchases — Bitso
Months later, reports said President Donald Trump’s media and tech group, Trump Media, was in advanced talks to acquire the company but the deal ultimately fell through.
The company has since launched multiple fundraising rounds through share sales, with the latest, in February, aiming to raise $48 million.
Magazine: Forget stablecoin yield, how does the CLARITY Act treat DeFi?

Grayscale Research has identified six blockchain protocols it sees as the biggest winners of the tokenization megatrend.
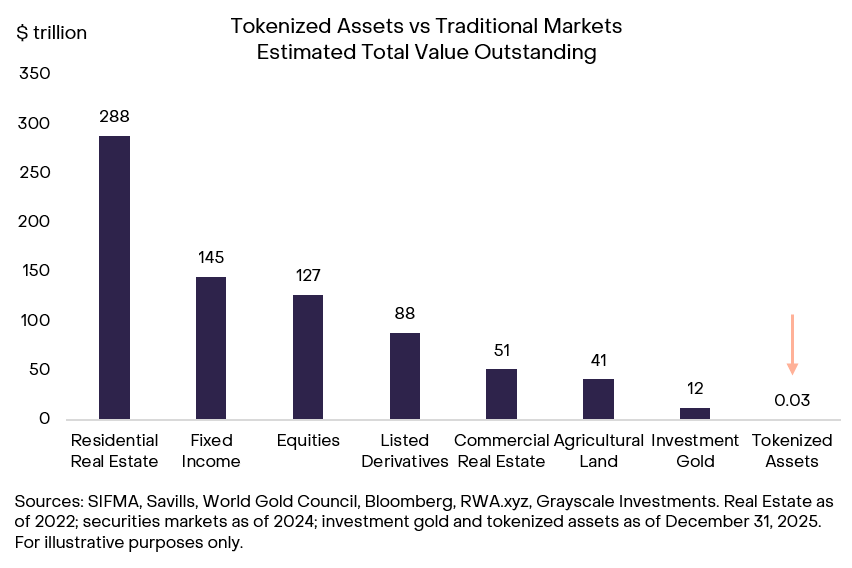
The asset manager highlighted that the tokenized asset market has expanded by 217% year-over-year. Yet it accounts for only roughly 0.01% of global equity and bond markets today, suggesting potential for further growth.
Why Grayscale Sees Tokenization as a Major Opportunity
Tokenized assets total around $30 billion, a fraction of the roughly $300 trillion securities market. US Treasuries lead the on-chain mix at about $15 billion, followed by tokenized commodities at about $5 billion. Smaller categories include private credit, funds, and equities.
In a recent report, Zach Pandl, Head of Research, and Will Ogden Moore frame the gap as an unfilled runway in the digital asset space.
“Over time, we believe much of the ~$300 trillion securities market — along with other types of assets like real estate — will migrate onchain,” the report read.
Follow us on X to get the latest news as it happens
Canton Leads Near-Term, Ethereum and Solana Take the Long Game
The report argued that tokenization is set to reshape capital markets as more assets and transactions migrate on-chain. The megatrend is still in its early innings and stands to drive significant value to the blockchains underpinning this shift.
“We believe the protocols best positioned to benefit from the tokenization megatrend include Ethereum, Solana, Canton, Avalanche, BNB Chain, and Chainlink,” the researchers wrote.
The report first pointed to Canton. According to data from RWA.xyz, the network commands a 93.8% share of the total on-chain represented RWA value and hosts more than $390 billion in tokenized asset value, by far the largest pool of capital in the sector.
Grayscale Research argues that institution-focused networks like Canton are likely to lead in the near term. Unlike public blockchains, these networks are built to mirror how traditional finance already operates, which could ease the transition for users and intermediaries. Canton also offers privacy by default, a feature that’s non-negotiable for most institutional use cases.
Next is Ethereum, which accounts for more than 54% of the distributed RWA market share. It hosts roughly $16 billion in tokenized assets and around $50 billion in Decentralized Finance (DeFi) total value locked.
Insights from BeInCrypto’s Expert Council also pointed to Ethereum as a key beneficiary of TradFi flows.
“I think Ethereum probably wins for the next little while on the back of TradFi getting involved. As banks and other build stuff on the blockchain space, it’s almost all going to happen on Ethereum for the next couple of years, I think,” said Geoff Kendrick from Standard Chartered.
Subscribe to our YouTube channel to watch leaders and journalists provide expert insights
Solana trails with over $2 billion in asset value. In addition, the blockchain offers a throughput above 1,000 transactions per second.
“Ethereum has the strongest ecosystem network effects, leading all others in market capitalization, developer activity, and number of applications,” the report noted. “Solana trails Ethereum in tokenized assets on-chain today, but it provides faster and lower-cost transactions. We believe these features enable broader retail accessibility and distribution and position Solana well for specific use cases like onchain consumer stock trading.”
Meanwhile, Chainlink, in Grayscale’s view, stands out as a top “picks and shovels” opportunity in the tokenization theme thanks to the critical middleware infrastructure it supplies at every stage of a tokenized asset’s lifecycle. The report also flagged Avalanche and BNB Chain as additional beneficiaries.
The post Grayscale Names Six Protocols Set to Win the Tokenization Megatrend appeared first on BeInCrypto.
Crypto World
SanDisk (SNDK) Shares Dip Despite Strong Q3 as Seagate (STX) and Western Digital (WDC) Ride AI Storage Wave

Key Takeaways
- SanDisk exceeded Q3 projections with $5.95 billion in revenue, representing a 97% year-over-year increase, yet shares declined over 6% after market close
- The company’s Datacenter division revenue soared more than 300% to reach $1.47 billion during Q3
- Over the past year, Seagate and Western Digital shares have climbed approximately 600% and 850% respectively
- Bank of America characterizes the hard disk drive industry as an “oligopoly,” providing Seagate and Western Digital substantial pricing leverage
- Artificial intelligence-powered data storage requirements continue exceeding available supply, enabling pricing increases across the sector
SanDisk delivered impressive third-quarter results, yet investors responded with skepticism rather than enthusiasm. The company generated $5.95 billion in quarterly revenue, representing a 97% jump from the prior year and substantially exceeding the $4.70 billion analyst projection. On an adjusted basis, earnings reached $23.41 per share, significantly outperforming the $14.54 Wall Street forecast.
Despite previously climbing approximately 350% throughout the current year, shares tumbled more than 6% during Thursday’s extended trading session.
Management’s Q4 revenue outlook of $7.75 billion to $8.25 billion substantially surpassed the $6.49 billion analyst consensus estimate. Similarly, adjusted earnings guidance ranging from $30 to $33 per share exceeded the $22.70 Wall Street expectation by a considerable margin.
What triggered the selloff? Cerity Partners analyst Michael Ashley Schulman offered a straightforward explanation — the forward guidance lacked the compelling “wow factor” necessary to sustain the stock’s upward trajectory. Western Digital experienced a similar fate, declining nearly 8% during the same trading session despite also exceeding estimates and issuing above-consensus guidance.
Chief Executive David Goeckeler characterized the period as transformational. “This quarter marks a fundamental inflection point for Sandisk — where our technology leadership is enabling a deliberate shift in our mix toward the highest-value end markets, led by Datacenter,” he stated.
The Datacenter division emerged as the clear performance leader, generating revenue that increased more than threefold during Q3 to $1.47 billion. Artificial intelligence applications require massive volumes of flash storage capacity, and current demand significantly outstrips available supply — allowing SanDisk to implement premium pricing strategies.
Artificial Intelligence Sparks Storage Infrastructure Race
The storage industry has emerged as one of the most obvious beneficiaries of the artificial intelligence infrastructure expansion. Data centers require high-capacity storage solutions to archive, train, and manage extensive AI datasets. While graphics processing units provide computational power, hard disk drives and flash memory handle data management — and this requirement shows no signs of moderating.
Seagate announced fiscal 2025 annual revenue totaling $9.10 billion, reflecting a 39% year-over-year expansion. The company’s most recent quarterly performance reached $3.11 billion, up 44% and surpassing the $2.95 billion analyst estimate. Adjusted earnings per share of $4.10 exceeded the $3.50 consensus projection.
Western Digital reported fiscal 2025 revenue of $9.52 billion, representing a 51% year-over-year increase. Second-quarter revenue of $3.02 billion topped the $2.98 billion Wall Street forecast. Adjusted earnings per share of $2.13 surpassed the $1.95 expectation.
Bank of America analyst Wamsi Mohan characterized the hard disk drive sector as an “oligopoly,” featuring minimal competition and virtually no threat from new market entrants. This market structure provides Seagate and Western Digital considerable pricing authority as major technology companies compete for storage capacity.
Strategic Contracts and Innovative Technologies
Mohan also highlighted long-term supply contracts as representing a transition toward more stable, predictable revenue streams. Both Seagate and Western Digital are progressively securing customer commitments rather than depending exclusively on transactional hardware sales.
Heat-assisted magnetic recording (HAMR) technology represents another positive development. This innovation enables manufacturers to increase data density on existing drive platforms, reducing material expenses while expanding storage capacity.
Mohan’s optimistic scenario projects Seagate earnings approaching $45 per share by 2028, supporting a $700 price objective. For Western Digital, his analysis suggests potential earnings of $33 per share with a corresponding $495 price target.
SanDisk shares had appreciated roughly 350% during 2025 prior to Thursday’s after-hours decline.


A Nordic Bitcoin education group has released an open-source AI database designed to generate evidence-backed responses to common criticisms about Bitcoin’s environmental impact and energy use.
Summary
- Bitcoin Beyond 66 has launched an AI database that generates evidence-based responses to claims about Bitcoin’s environmental impact and energy use.
- The tool draws on more than 22 peer-reviewed studies and cites Cambridge research showing over 52% of Bitcoin mining uses renewable energy.
- Users can input criticism and receive structured replies, with response tones ranging from direct to balanced or soft depending on context.
According to Bitcoin Beyond 66, the tool, called “The Bitcoin Evidence Base,” has been built in response to what it describes as a growing volume of peer-reviewed research on Bitcoin mining, while public narratives continue to rely on outdated or incomplete data.
The group said misinformation often spreads faster than research, leaving users without quick access to credible counterpoints during online discussions.
Developed as a searchable response engine, the database allows users to input claims or links and receive structured replies grounded in published research, industry reports, and energy data. Bitcoin Beyond 66 said the system regularly references studies, such as an April 2025 report from the University of Cambridge, which found that more than 52% of Bitcoin mining is powered by renewable energy sources.
Data cited within the platform also compares Bitcoin’s energy mix with other sectors, stating that its renewable share exceeds that of the traditional banking system. The group added that over 22 peer-reviewed studies have documented potential environmental benefits tied to Bitcoin mining, including its role in utilising stranded or excess energy.
Explaining the motivation behind the project, Bitcoin Beyond 66 said most users do not have the time to review dozens of academic papers or datasets before responding to claims online.
“The problem is that most people don’t have time to read 22+ peer-reviewed papers, Cambridge reports and ERCOT data. When someone posts criticism on social media, you need a credible response — fast,” the group stated.
How the tool approaches Bitcoin criticism
The database incorporates a communication framework attributed to Bitcoin environmental advocate Daniel Batten, which combines factual rebuttals with a tone designed to avoid confrontation. Bitcoin Beyond 66 said the system encourages users to acknowledge earlier concerns about Bitcoin’s energy use before addressing newer data that may challenge those views.
Users can choose between direct, balanced, or softer response styles, depending on the context of the discussion. Bitcoin Beyond 66 said this approach is intended to keep conversations constructive, noting that attempts to win arguments often lead to defensive reactions rather than engagement.
“If you’re trying to ‘own’ someone, you’ll trigger their defenses and accomplish nothing,” the group said.
Ongoing debate around Bitcoin’s environmental footprint has drawn scrutiny from institutions including the United Nations and several governments, which have raised concerns over energy consumption and its link to climate change.
Daniel Batten has argued in separate research that a growing share of Bitcoin mining now relies on lower-carbon and renewable sources, challenging earlier assumptions about its environmental cost.
To expand its dataset, Bitcoin Beyond 66 said contributors can submit research papers and verified sources for review before inclusion, allowing the database to evolve alongside new findings and industry data.

Bitcoin BTC Spot CVD, or Cumulative Volume Delta, exploded 199.1% over the prior week, climbing from $18.3 million to $54.8 million, a signal of aggressive spot-market buying. Parallel perpetual CVD rose 174.7% to $315.1 million, confirming the same directional pressure across both markets. ETF inflows are re-accelerating again after weeks of stagnation, providing the absorption layer and holding Bitcoin above $78,000.
BlackRock’s IBIT gained 1.33% in yesterday’s session as institutional crypto demand showed renewed aggression following a 3-day period of net outflow pressure. The re-acceleration follows a stretch in which ETF outflows had weighed on spot liquidity.
Open interest recovered to $25 billion, which Bernstein analysts flagged as a sign of returning leverage. Spot-led nature of this move, confirmed by CVD composition, shows that the rally has a different foundation than January’s futures-driven spike.
Explore: Bitcoin price prediction – key support and resistance levels to watch
Can Bitcoin Finally Breach $80K This May?
Bitcoin is sitting at $77,000 intraday after reclaiming the same support level. CVD lines are holding above their moving averages, which is the minimum confirmation for bullish conviction. RSI is elevated but not yet at overbought extremes, leaving room for continuation.
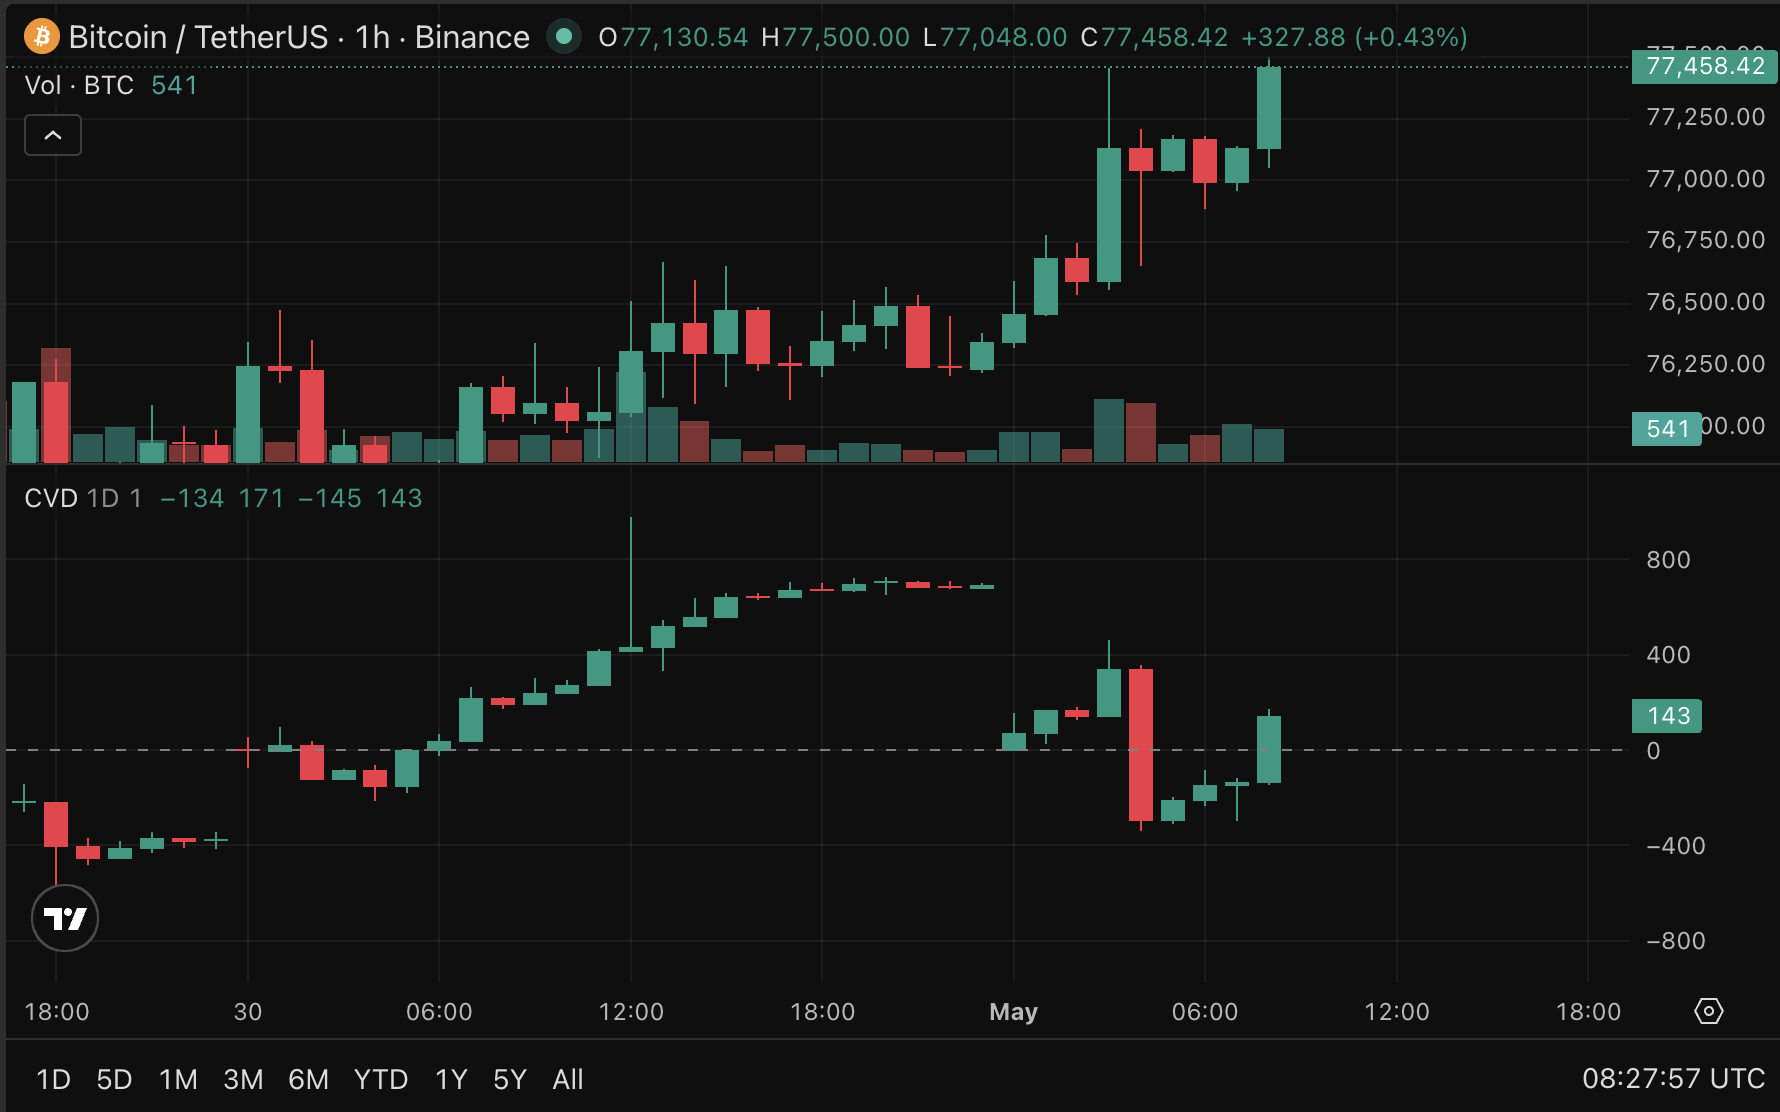
If $75,000 holds on a weekly close, the structure opens a move toward $80,000 and, beyond that, the $82,000 zone identified by on-chain resistance clustering. If $75,000 breaks, the real floor is closer to $72,000. The risk case is an open interest flush, $25 billion in OI with rising leverage could create a liquidation cascade.
The honest read: structure is bullish as long as spot CVD stays positive and ETF inflows don’t reverse. Watch the weekly close.
Discover: The best pre-launch token sales
Wall Street Backdrop: Market Structure Flips Bullish
The macro context is supportive. The Wall Street rally, driven by strong Alphabet and Caterpillar earnings, sent U.S. equities into April’s close with positive momentum, and Bitcoin followed, rising 1.17% in direct correlation with NASDAQ risk-on sentiment.
As we know, traditional fund managers are increasingly treating BTC as a high-velocity proxy for high-beta tech exposure, tightening its correlation with equities in trending macro environments.
BREAKING: — Bull Theory (@BullTheoryio) April 30, 2026
 Nasdaq and S&P 500 just hit a NEW ALL TIME HIGH.
US stocks have now added over $10 trillion in market cap in the last 30 days. pic.twitter.com/ipimnCw4S5
Bitcoin is now printing higher lows, has reclaimed $77,000 as support, and is holding a bullish market structure. If equities sustain their recovery through the next FOMC decision, BTC’s macro tailwind stays intact and amplifies the spot demand signal.
The combined read from CVD, ETF inflows, and on-chain transfer volume points to one conclusion: this is a structurally supported move, not a leverage blip.
Discover: The best crypto to diversify your portfolio with
The post Bitcoin Spot CVD Surges 199% as Institutional Inflows Re-Accelerate appeared first on Cryptonews.

(VIDEO) Unusually Shallow Earthquakes Strike Near Area 51 Sparking Nuclear Test Speculation

Bitcoin Faces Retreat After April Rally Fueled by Futures CryptoQuant
I don’t really want that for a young player
Manchester United reach agreement with Casemiro over contract clause amid transfer speculation

US brings back mandatory military draft registration

Steven Gerrard disagrees with Gary Neville over ‘shock’ Chelsea and Arsenal claim | Football


-
 Tech4 days ago
Register Renaming | Hackaday
-

 Fashion7 days ago
Weekend Open Thread – Corporette.com
-
 Crypto World6 days ago
Hyperliquid $HYPE Rally Builds Momentum as AI Sector Enters Prove-It Phase
-

 Politics3 days ago
Drax board avoid their own AGM, accused of greenwashing & environmental racism
-

 Tech4 days ago
Images of Samsung’s rumored smart glasses have leaked
-
 Sports5 days ago
IPL 2026: Ruturaj Gaikwad registers slowest fifty of the season, enters all-time unwanted list | Cricket News
-

 Tech4 days ago
Why Blue Badges Disappeared From Toyota Hybrids
-

 NewsBeat5 days ago
LK Bennett closes all stores after entering administration
-

 Fashion2 days ago
Kylie Jenner’s KHY Enters a New Era with ‘Born in LA’
-

 Crypto World7 days ago
Michael Saylor says BTC winter is over. Market analyst disagrees, says bitcoin was in a pullback
-
 Entertainment6 days ago
Mariah Carey Slams Deposition Claims In Brother’s Lawsuit
-

 Business2 days ago
Most Commercial Energy Audits Miss the Real Losses
-

 Business4 days ago
(VIDEO) Charlize Theron Climbs Times Square Billboard to Promote New Netflix Thriller ‘Apex’
-

 Business7 days ago
Jeanine Pirro announces closure of Federal Reserve building cost probe
-
 Crypto World7 days ago
Nvidia (NVDA) Stock Jumps 5% as Intel Earnings Ignite Semiconductor Rally
-

 Tech5 days ago
Microsoft to roll out Entra passkeys on Windows in late April
-

 Tech5 days ago
OpenAI’s Sam Altman apologizes for not reporting ChatGPT account of Tumbler Ridge suspect to police
-

 Crypto World3 days ago
CFTC’s AI will review U.S. crypto registration applications, chairman tells CoinDesk
-

 Business2 days ago
Barclay Brothers Avoid Bankruptcy: HSBC Drops High Court Petitions After IVA Deal
-

 Tech7 days ago
Apple’s Next CEO Has a Different Battle Ahead
You must be logged in to post a comment Login