

Crypto World
Why the price keeps falling


Spot Solana ETFs crossed $1.06 billion in total assets under management as of mid-May 2026. Goldman Sachs is a confirmed holder.
Summary
- Solana ETFs crossed $1.06B in AUM, but SOL remains 77% below its January 2025 all-time high.
- ETF inflows are being absorbed by venture unlock supply, limiting the price impact of institutional buying.
- BSOL’s staking structure gives institutions yield while they wait for Solana’s major catalysts to mature.
- Western Union’s USDPT launch may be Solana’s biggest institutional signal if payment volume scales.
Fidelity runs its own validator. Morgan Stanley’s Solana Trust filing adds a third institutional channel. Forward Industries (NASDAQ: FORD) holds 6.9 million SOL on its corporate treasury. The catalyst stack is the cleanest of any top-five major: $1B+ in institutional AUM, Firedancer hitting 1M TPS in load tests, the Alpenglow upgrade coming in Q2 2026, 700+ days of continuous network uptime. And yet SOL is down 77 percent from its January 2025 high of $295. Daily active users have dropped from 6.4 million to 2.8 million.
Bank of America trimmed its Solana ETF exposure on May 23, 2026. The institutional money is flowing in. The price keeps falling. This is the paradox most coverage refuses to engage with honestly.
The numbers that should be moving the price
The institutional story for Solana in 2026 is, on paper, as strong as any altcoin has ever produced.
Spot Solana ETFs from Bitwise (BSOL), Fidelity (FSOL), and Grayscale launched in late 2025 and have accumulated $1.06 billion in combined assets under management by mid-May 2026. The Bitwise Solana Staking ETF (BSOL) leads with approximately $861 million, representing 81 percent of the total inflows. Fidelity’s FSOL has captured roughly $160 million. The remaining capital is spread across smaller products including Grayscale’s converted Solana Trust.
The pace of accumulation has been notable. BSOL crossed $500 million in AUM within its first 18 days of trading, which is faster than most prior altcoin ETF launches. The May 12, 2026 weekly inflow print of $39.23 million was the strongest since February, suggesting the institutional appetite is not just real but still building. Goldman Sachs has been confirmed as a holder. Fidelity has gone beyond passive exposure to actively run a Solana validator node, signaling deeper institutional commitment than most ETF issuers show.
Beyond ETFs, the corporate treasury adoption story is also significant. Forward Industries (NASDAQ: FORD) has transitioned into a Solana-focused treasury company, holding over 6.9 million SOL valued at roughly $1 billion. The firm launched a $1 billion share repurchase program and runs its own Solana validator. This is the kind of corporate treasury adoption that, with Bitcoin specifically, produced substantial price appreciation through the Strategy (formerly MicroStrategy) accumulation playbook.
The infrastructure story matches. Firedancer, the independent Solana validator client built by Jump Crypto, has recorded over 1 million transactions per second in public load tests. This is the first time any Layer-1 blockchain has matched centralized exchange throughput in a verified environment. The Alpenglow consensus upgrade arriving in Q2 2026 will cut block finality from 12 seconds to roughly 150 milliseconds. Solana now has over 700 days of continuous network uptime, addressing the historical outage concerns that previously hurt institutional confidence.
The regulatory environment is also favorable. Kevin Warsh was sworn in as Federal Reserve Chair on May 23, 2026. Warsh personally holds SOL, which while not a direct policy signal is at least an indication the highest levels of US monetary leadership are personally familiar with the asset. The broader regulatory shift under the current administration has made altcoin ETFs commercially viable in a way they were not under the Gensler-era SEC.
Standard Chartered’s year-end SOL price target is $250. Doo Prime’s upside case is $336. Other models from Changelly project $140 base case. The institutional research consensus is broadly bullish on SOL based on the catalyst stack.
And yet SOL trades at $82 to $96, depending on the day. The token is 77 percent below its January 2025 all-time high of $295. The price has been range-bound for six months between $118 and $165 on the weekly chart, then broke down to the lower trading range in 2026. The institutional buying has not translated into the kind of price appreciation the catalyst stack would predict.
This is the paradox. The fundamentals say one thing. The price says another. Most coverage either celebrates the fundamentals while ignoring the price, or dismisses the fundamentals because the price is weak. The honest analysis requires engaging with both.
The supply absorption problem
The single most important factor most coverage fails to engage with properly is the venture token unlock schedule running through Q3 2026.
When Solana launched in 2020, a substantial portion of the initial token supply was allocated to venture investors, the Solana Labs team, and the Solana Foundation. These allocations vest gradually over multi-year schedules. The vesting cliffs and gradual unlocks create persistent supply pressure as locked tokens enter circulation and venture investors take profits on their early-stage positions.
The unlocks have been ongoing for years, but the pace through 2026 is particularly heavy. Multiple major unlock events scheduled through Q3 2026 will release substantial new SOL supply to the market. A representative example: deBridge’s $8.88 million SOL release was one of several venture unlock events in April 2026. Larger unlocks from the Solana Labs allocation, the Solana Foundation reserve, and various early venture investors continue throughout the year.
The math of supply absorption matters. If the ETF inflows are running at, say, $40 million per week (the May 12 weekly print), and the venture unlocks are releasing $50 to $100 million per week in new supply that vested holders are selling, the ETF buying is being absorbed by the unlock supply rather than producing net upward price pressure. The institutional money is real. It just is not enough yet to overwhelm the structural sell pressure.
This is why Bitcoin’s path is the relevant comparison. Bitcoin’s spot ETFs accumulated approximately $4.6 billion in AUM before BTC broke its previous all-time high. Solana’s ETFs at $1.06 billion are roughly 23 percent of the threshold that produced the Bitcoin breakthrough. The absolute amount of institutional money flowing into SOL is not yet sufficient to absorb the venture unlock pressure AND drive net price appreciation. Both are required for the price to move materially upward, and only one is happening right now.
The timing matters for when this could change. The venture unlock schedule winds down through Q3 2026. As the unlock supply tapers, the same ETF inflow rate would translate into more net buying pressure. If ETF inflows scale up at the same time the unlock supply winds down, the dynamic could flip favorably and produce the price appreciation the catalyst stack would predict. This is the path Standard Chartered’s $250 year-end target implicitly assumes.
The alternative outcome is ETF inflows stall or reverse before the unlock supply clears. If institutional appetite slows (as the May 23 Bank of America move suggests is possible), the supply pressure keeps going without the offsetting institutional demand. In that scenario, SOL could stay range-bound or break lower toward the $72 to $80 support levels that several technical analysts have identified.
Either outcome is plausible. The variable that determines which way the market goes is the interaction between ETF inflows and unlock supply through Q3 2026. This is the analytical work most coverage skips.
What BSOL’s structure actually does
One specific feature of the BSOL ETF deserves more attention than it gets in most coverage. BSOL is not a pure spot Solana ETF. It is a staking ETF, which means the assets held by the fund are staked on the Solana network and earn staking rewards on behalf of fund holders.
The embedded staking yield is approximately 7 percent annually. This is a meaningful number for institutional holders. A pension fund holding $50 million in BSOL is earning $3.5 million per year in staking yield while waiting for the price to move. The carry is real cash flow that exists independent of whether the price appreciates or declines.
This changes the institutional calculus around BSOL holdings in important ways. Pure spot ETFs like the Bitcoin products require price appreciation to generate returns for holders. BSOL produces returns from both potential price appreciation AND ongoing staking yield. This makes the position more defensible during periods of price weakness, because the holder is still earning carry.
The implication is BSOL holders are more likely to keep positions through unlock-driven price weakness than pure spot ETF holders would. They are not waiting for an immediate price catalyst. They are earning yield while waiting. This patience matters for the supply absorption dynamic. If BSOL holders do not panic-sell when price weakness persists, the institutional capital stays in the system and gradually compounds through the staking rewards.
The 7 percent staking yield also reframes the discussion about Solana’s “inflation” problem that bearish commentary often raises. Solana’s current annual issuance rate is approximately 4.7 percent, declining gradually toward a terminal rate around 1.5 percent. For staked SOL holders, the staking rewards more than offset the inflation rate. For non-staked holders, the inflation dilutes their position. BSOL automatically stakes its holdings, so the inflation concern does not apply to ETF holders in the same way it applies to holders who keep SOL on exchanges or in self-custody wallets without staking.
This is the technical detail most retail-focused coverage misses entirely. BSOL is structurally different from spot Bitcoin ETFs in ways that make institutional patience more rational. The fund is generating real yield while waiting for the price recovery the catalyst stack would predict.
The Western Union signal nobody is properly weighting
The most consequential institutional development for Solana in 2026 may not be the ETFs at all. It may be Western Union’s USDPT launch on the Solana network on May 4, 2026.
Western Union is 175 years old. The company processes more than 100 million customer transactions across over 200 countries and territories through a network of 360,000+ agent locations. The remittance market it serves is approximately $700 billion globally. The company chose Solana as the blockchain infrastructure for its USDPT stablecoin and broader Digital Asset Network strategy.
The choice of Solana over Ethereum, Tron (the dominant USDT network for cross-border transfers), or other Layer-1 alternatives is significant. Western Union is not a crypto-native company looking to ride a speculative wave. The company is a regulated financial institution selecting blockchain infrastructure for production payment rails serving 100 million users. The choice reflects a technical and operational assessment about which network can actually support that scale of activity.
USDPT is issued by Anchorage Digital Bank, the only federally chartered crypto bank in the United States that has reached fully operational status (most others, including Ripple, are still in the conditional approval phase). The combination of Anchorage as issuer and Solana as the underlying blockchain creates an institutional-grade stablecoin stack that competes directly with USDC, USDT, and RLUSD.
The product rollout extends beyond the initial settlement use case. Stable by Western Union, a consumer-facing spending product, is launching in over 40 countries in 2026. The USD Stable Card targets high-inflation regions where people need access to dollar-denominated payment infrastructure. The Digital Asset Network connects external crypto wallets to Western Union’s 360,000-agent cash-out network, enabling crypto-to-cash transactions through existing physical infrastructure.
What this means for SOL specifically is Solana is being positioned as the underlying blockchain infrastructure for one of the largest payment networks in the world. The transaction volume that flows through USDPT will generate SOL fees, support validator economics, and create persistent demand for SOL as a gas token. This is fundamentally different from the speculative trading volume that has driven much of Solana’s historical fee generation.
The Western Union story has not been adequately reflected in SOL’s price. The launch was treated as a routine product announcement by most coverage. The structural implication is one of the largest financial institutions in the world has bet on Solana as its blockchain infrastructure for a global payments product. If USDPT achieves even modest adoption (say, 10 percent of Western Union’s existing transaction volume migrating to the stablecoin rail), the impact on SOL fee generation and demand would be material.
The market has not priced this in. The opportunity, if you believe the Western Union deployment will succeed, is in the gap between the structural significance and the current price.
The memecoin question that nobody wants to address
A complete analysis of Solana’s situation has to engage with the question that sophisticated observers are asking quietly but that most public coverage avoids.
Solana’s transaction volume is heavily dominated by memecoin trading and speculative activity. The network’s daily active user count has dropped from 6.4 million at peak to approximately 2.8 million currently. dApp revenue has declined materially as the 2024-2025 memecoin trading cycle has cooled. The DAU drop is real, the dApp revenue compression is real, and the question is whether Solana’s underlying transaction economics are sustainable if the speculative activity keeps unwinding.
The honest answer is mixed. On one hand, memecoin-driven transaction volume is genuinely speculative and could decline substantially if the broader memecoin cycle reverses. If that happens, Solana’s fee generation, validator economics, and network revenue would all face pressure. The bears who point to “Solana is a casino” framing are not entirely wrong. A meaningful portion of historical Solana activity has been speculative.
On the other hand, the institutional adoption pipeline (Western Union, Anchorage, Forward Industries, the ETF complex, AAVE’s recent deployment) represents a structurally different category of activity. If this pipeline scales, it replaces speculative transaction volume with utility-driven transaction volume, which would be more sustainable and less correlated with crypto market sentiment cycles.
The transition is the variable. If the institutional pipeline scales faster than the speculative volume declines, Solana’s network economics improve over time and the price eventually reflects the structural improvement. If the speculative volume declines faster than the institutional pipeline scales, Solana faces a period of weak network economics and continued price pressure.
Neither outcome is guaranteed. The realistic case is probably somewhere between: gradual institutional adoption, gradual speculative volume decline, and a period of network economic transition that takes 18 to 36 months to fully play out. The current price weakness may reflect the market pricing in this transition uncertainty rather than rejecting Solana’s long-term positioning.
This is the analysis crypto media generally avoids because it requires holding two contradictory truths simultaneously. Solana’s institutional adoption is genuinely speeding up. Solana’s speculative transaction volume is genuinely declining. Both are happening at the same time. The net effect depends on how the transition plays out, and reasonable analysts can disagree about the trajectory.
What the recent ETF flow patterns actually show
Looking at the ETF flow data more carefully reveals patterns that complicate the simple “institutional buying” narrative.
The cumulative inflow story is unambiguously positive. $1.06 billion in AUM across spot Solana ETFs by mid-May 2026. BSOL leading with $861 million. Consistent net inflows during most weeks. The directional trajectory is clearly upward.
But the week-to-week pattern shows the institutional flow is not uniform. The April 1, 2026 trading session recorded net inflows of zero across spot Solana ETFs. The April flows totaled approximately $222.49 million, which is meaningful but not the kind of sustained momentum that would absorb venture unlock supply. The May 12 weekly print of $39.23 million was the strongest since February, but it represented a recovery rather than a continuation of an established trend.
The Bank of America move on May 23, 2026 is the most concerning recent signal. The bank increased its Bitcoin ETF stake while cutting Solana-linked holdings, signaling measured institutional risk appetite. This is the kind of selective rebalancing that suggests some institutions are concluding that the SOL ETF pipeline is not delivering returns at the pace they expected.
The honest read on the flow patterns is the institutional commitment is real but not yet sustained at a level that overwhelms the structural sell pressure. The capital is flowing in. It is also flowing out, periodically, when institutions reassess their allocations. The net inflow is positive but the volatility is meaningful.
For the price to move materially upward, the flow pattern needs to shift from the current “inflows with occasional outflows” to “sustained inflows with rising momentum.” That shift requires either a clear positive catalyst (Firedancer mainnet, Alpenglow launch, Western Union scaling) or the broader crypto market entering a risk-on environment that pulls altcoin ETFs along with it.
Neither is guaranteed in the near term. The base case is probably more weeks of $20-40 million in net inflows, partially offset by unlock supply, with the price oscillating in the $80-100 range until either the unlock schedule clears or a new catalyst emerges.
What could change the dynamic
Three specific catalysts could shift Solana’s price trajectory upward in the next 6-12 months, and each is worth understanding.
The first is Firedancer mainnet deployment reaching meaningful adoption. The validator client currently runs on 207 validators in production. If Firedancer adoption scales to 30 to 50 percent of total stake, the network’s throughput and reliability improve substantially, which strengthens the institutional case for Solana as settlement infrastructure. The full mainnet rollout is scheduled for H2 2026. If it ships on schedule and adoption follows, this is one of the strongest potential price catalysts.
The second is the Alpenglow consensus upgrade. Cutting block finality from 12 seconds to 150 milliseconds is genuinely transformative for institutional settlement applications. The 150ms finality matches what traditional finance infrastructure delivers, which removes one of the main technical objections institutional buyers have raised about crypto settlement. Anatoly Yakovenko called Alpenglow “the missing piece for institutional settlement.” The Q2 2026 launch window is the next major catalyst on the calendar.
The third is Western Union scaling USDPT volume. If Stable by Western Union launches in the 40+ countries on schedule and captures even modest adoption, the resulting transaction volume on Solana would be material. The 100 million existing Western Union users represent a customer base larger than most crypto platforms have. Even 5 to 10 percent adoption of USDPT for existing Western Union flows would produce SOL transaction volume that exceeds most current DeFi protocols on the network.
If all three catalysts deliver in the second half of 2026 and the venture unlock schedule winds down on the expected timeline, the conditions exist for Standard Chartered’s $250 year-end target to be achievable. If one or more catalysts disappoint or delay, the price could stay in the current consolidation range or move lower.
The risk-adjusted case is probably one or two of the catalysts deliver while the third disappoints or delays. In that scenario, SOL likely moves into the $120-180 range, which would represent meaningful appreciation from current levels without reaching the bullish case targets.
What this means for SOL holders right now
For readers holding SOL or considering positions, the practical implications of the paradox analysis are straightforward.
The institutional adoption story is real and keeps developing. ETFs are accumulating. Western Union is deploying. Firedancer is shipping. The structural improvements in Solana’s positioning are not narrative fluff. They are operational realities that will, over time, support SOL’s price if the catalysts deliver and the unlock supply clears.
The price weakness is also real and reflects specific structural factors (venture unlock supply absorption) not yet fully resolved. The current $82-96 trading range is not random. It reflects the balance between institutional demand and unlock-driven selling pressure. Until that balance shifts, the price has limited room to move materially upward.
For long-term holders, this is consistent with the kind of accumulation phase that has preceded major crypto bull runs historically. Bitcoin spent extended periods range-bound while ETF inflows accumulated before breaking out. Ethereum had similar patterns. Solana’s current consolidation could follow a similar trajectory if the catalysts deliver and ETF flows keep coming.
For traders, the technical levels matter. The $72-80 support has held through multiple retests, and a break below that level would suggest the supply pressure is overwhelming the institutional demand. The $92-96 resistance has been the immediate test for upside momentum. A clean break above $96 with rising ETF flows would suggest the dynamic is shifting in SOL’s favor. A break below $72 would suggest the bears are right that institutional demand cannot absorb the supply pressure.
For institutional investors specifically, BSOL’s 7 percent staking yield provides ongoing carry while waiting for the price recovery. This is structurally more attractive than holding pure spot Bitcoin or Ethereum positions during similar consolidation periods, because the yield generates returns independent of price action.
The bottom line
Solana’s situation in mid-2026 is genuinely complicated and most coverage simplifies it in ways that are not useful.
The bullish narrative is real. $1.06 billion in spot ETF AUM. Goldman Sachs as a confirmed BSOL holder. Fidelity running its own validator. Forward Industries holding $1 billion in SOL on corporate treasury. Western Union launching USDPT on Solana with 100 million users. Firedancer hitting 1M TPS. Alpenglow arriving in Q2 2026 with 150ms finality. 700+ days of continuous uptime. The catalyst stack is the cleanest of any top-five major cryptocurrency.
The bearish reality is also real. 77 percent drawdown from the January 2025 all-time high. Range-bound between $80 and $100 for months. Daily active users down from 6.4 million to 2.8 million. dApp revenue declining as speculative volume cools. Venture token unlock supply absorbing institutional demand. Bank of America trimming SOL ETF exposure on May 23, 2026.
Both can be true at the same time. The structural improvements are happening. The supply absorption problem is also happening. The net effect depends on which dynamic wins over the next 12 to 18 months.
The honest read is SOL is in an accumulation phase where institutional capital is gradually flowing in while structural supply pressure keeps the price range-bound. If the catalysts deliver (Firedancer, Alpenglow, Western Union scaling), the supply pressure clears (Q3 2026 unlock schedule), and ETF inflows keep scaling, the conditions exist for the price to move materially upward toward the $140-250 range that institutional research targets.
If any of those conditions fail to materialize, SOL could stay range-bound for an extended period or move lower toward the $72 support level. The bearish case is not unreasonable. The bullish case is not unreasonable. The honest case is uncertainty, with the resolution likely coming over the next 12 months.
For SOL holders, the paradox analysis suggests patience rather than panic. The fundamentals are improving. The price is reflecting structural sell pressure that has a defined timeline. The institutional adoption pipeline is real. The question is whether the timeline of institutional buying meets or exceeds the timeline of unlock-driven selling.
For SOL skeptics, the paradox analysis suggests caution rather than dismissal. The institutional adoption is not fake. The catalyst stack is real. The price weakness reflects specific structural factors rather than fundamental rejection of the network. Dismissing Solana because the price is weak ignores the institutional pipeline genuinely developing.
The honest framing is Solana is in a transition period where the old speculative model (memecoin-driven transaction volume) is partially giving way to a new institutional model (ETFs, Western Union, corporate treasuries, regulated stablecoins). The transition is not yet complete. The price reflects the uncertainty about how it resolves.
That is the paradox. $1 billion in ETF AUM. 77 percent drawdown. Real institutional adoption. Real structural sell pressure. Two genuine truths producing one frustrating price chart.
The resolution will come. The question is when, and which side wins when it does.
This article is for informational purposes and does not constitute financial or investment advice. Cryptocurrency markets evolve quickly; the figures and milestones described reflect reporting available as of late May 2026. Always do your own research.

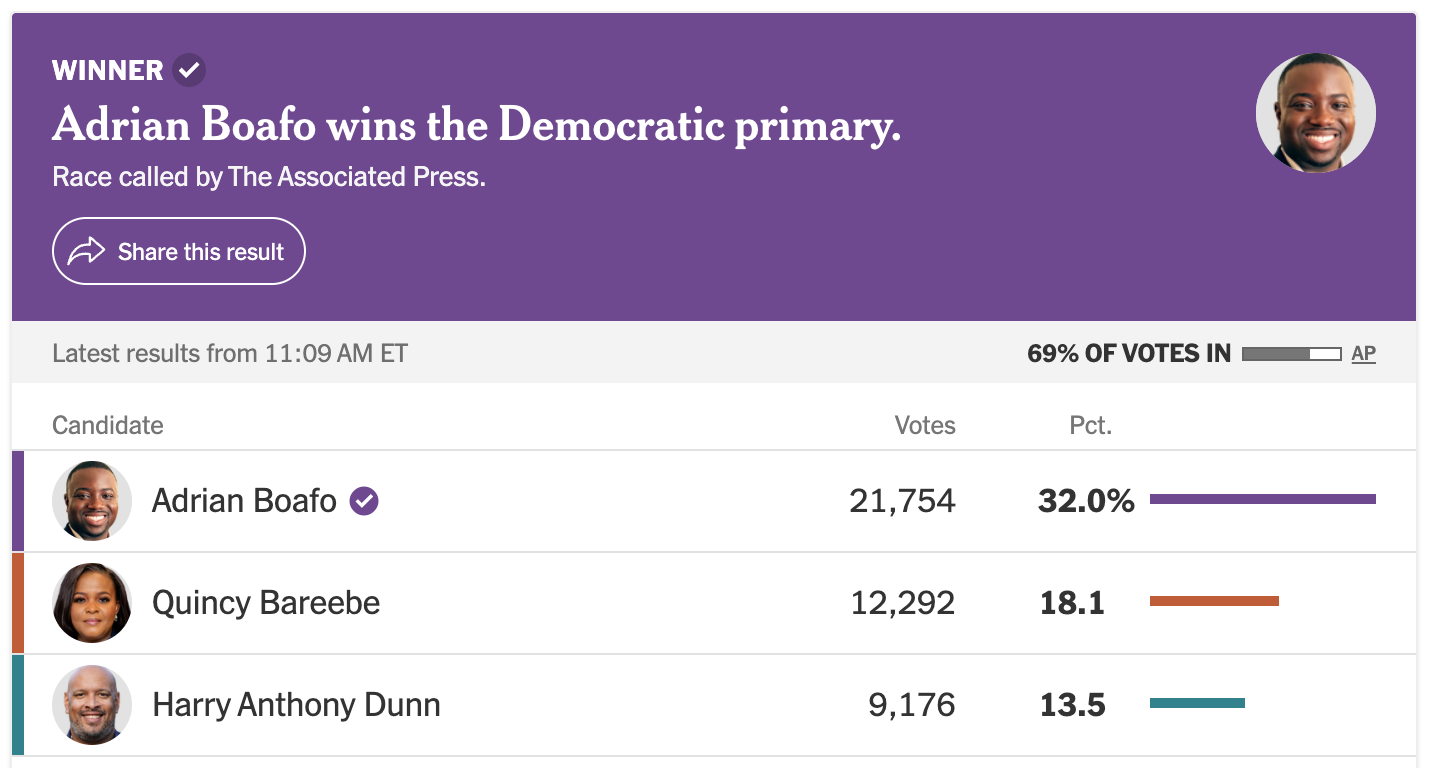
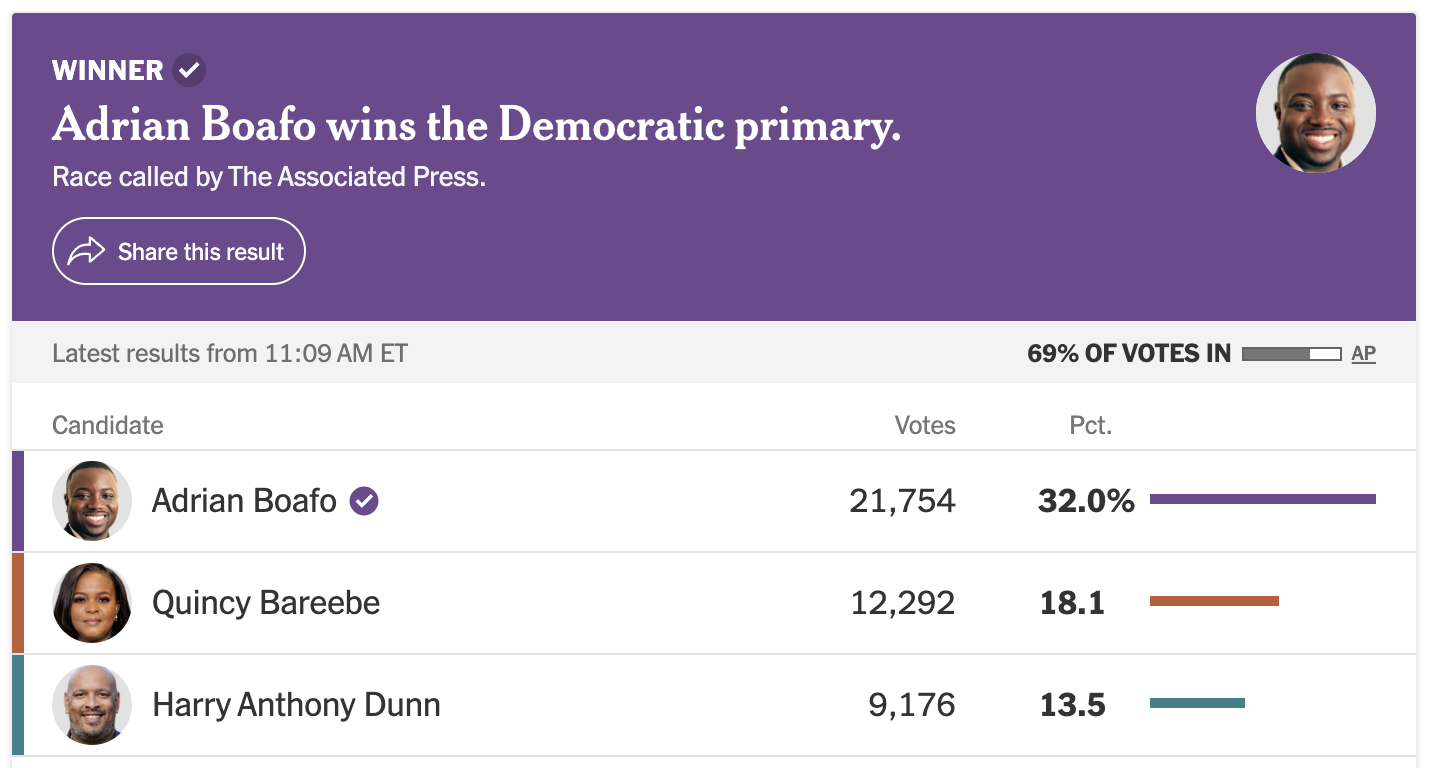
Several Democrats and one Republican who were supported by more than $8 million worth of ads funded by cryptocurrency-aligned political action committees (PACs) won their respective US primaries on Tuesday, setting up their candidacies for the November election.
Party primaries for US House of Representatives and Senate candidates in Utah, Maryland and New York resulted in wins for many aligned with crypto industry interests. PACs like Fairshake and its affiliates, largely backed by crypto companies Coinbase and Ripple Labs, spent a combined $8 million on media to support the candidates it considered likely in favor of digital asset policies for the next session of Congress.
In New York, Democrat Ritchie Torres won a primary for the state’s 15th congressional district with 71.9% of the vote, while in Utah, Republican Blake Moore won in the 2nd district with 57.5% of the vote. Fairshake affiliate Protect Progress reported $5.5 million in expenditures to support Adrian Boafo, who won the Democratic primary for Maryland’s 5th district with 32% against other candidates who opposed “spending from crypto billionaires.”
“We went big and we went early,” said Fairshake spokesperson Geoff Vetter. “We did our part to move Adrian Boafo from fifth place to the halls of Congress.”
Source: The New York Times
Fairshake, which reported having “$150 million cash on hand” in June after its spending in several US state primaries, may have already influenced voters in key elections in its attempts to send candidates to Congress it considers to be “pro-crypto.” Other PACs aligned with crypto interests that have reported spending on 2026 candidates included Fellowship, backed by Cantor Fitzgerald and Anchorage Digital, and the Blockchain Leadership Fund, a hybrid PAC backed by Anchorage and Chainlink Labs.
Related: Trump cancels signing of housing bill with CBDC ban
Not every pro-crypto candidate emerged a winner on Tuesday. Alex Bores, a Democrat running in New York’s 12th District, lost to Micah Lasher. He criticized Bores in a June debate, saying that he potentially benefitted from Ripple Labs co-founder Chris Larsen spending $3.5 million to support his campaign.
Next primaries in Colorado and Arizona, but no reports of spending yet
Many expect Fairshake and other crypto-aligned PACs to turn their attention to candidates in Colorado and Arizona next. The two states are scheduled to hold primaries on June 30 and July 21, respectively, but Fairshake affiliates had not disclosed significant spending in any of the races as of Wednesday.
In 2024, the PAC and its affiliates poured more than $10 million into media to support Ruben Gallego’s Senate race in Arizona and $2.1 million for Democratic Representative Yadira Caraveo in Colorado’s 8th district. Gallego won his race, while Caraveo lost in the November 2024 election to Republican Gabe Evans.
Magazine: AI is banking the unbanked in Africa… faster than crypto
Crypto World
Bitcoin Price Prediction: CryptoQuant Believes Strategy Ought to Pause Its Bitcoin Purchases

Bitcoin price is trading around $62,000, with relatively no movement, but it’s doing little to mask a deeper structural prediction that is playing out publicly. CryptoQuant has issued a pointed recommendation. According to CryptoQuant analyst, Strategy, the Michael Saylor-led corporate Bitcoin buyer should stop accumulating BTC and focus on rebuilding cash reserves before its preferred stock situation turns into a full credibility crisis.
CryptoQuant’s head of research, Julio Moreno, outlined the pressure points in a Tuesday report. Strategy’s preferred stock STRC hit a record 17.5% discount to par value last week, closing at $82.50 against its $100 par. Cash reserves have dropped 38% since January 2026, partly because Strategy retired $1.5 billion in convertible notes, shrinking its dividend buffer at exactly the wrong moment.
Not just the above, Strategy’s dividend obligations have ballooned from $300 million annualized at the start of the year to $1.2 billion today, a nearly fourfold increase in under six months. STRC’s dividend coverage has collapsed from over seven years to just 14 months.
Now, for Strategy, selling Bitcoin to close the gap isn’t going to be straightforward either. It currently carries an aggregate unrealized BTC loss of roughly $10.6 billion, with every coin purchased in 2024, 2025, and 2026 underwater at current prices.
Strategy’s bind matters to the market because it removes one of the most consistent marginal buyers from the demand side, at a moment when on-chain data already points to significant weakness across the board. Can Bitcoin survive this?
Discover: The Best Crypto to Diversify Your Portfolio
Bitcoin Price Prediction: Recover to $81,000, or a Drop to $55,000?
Bitcoin’s current setup reads bearish on most metrics that matter. CryptoQuant’s cycle framework also classifies this as a bear phase, with 30-day apparent demand down approximately ‑63,000 BTC, a level consistent with distribution. The Coinbase premium remains negative, signaling U.S. spot buyers are not stepping in to absorb sell-side pressure. Bitcoin is already down 50% from its October all-time high near $126,080.
On the downside, CryptoQuant’s base case targets $55,000 as the structural bear-market bottom, or 20% below current levels. Standard Chartered has flagged a similar downside risk toward $50,000 before any sustained push toward $100,000. The $55,000–$56,000 zone represents the confluence of prior accumulation levels, and where realized-loss exhaustion has historically resolved prior cycles.

Don’t Miss Out on Our $1,000 USDT Airdrop on ByBit
The bull case is conditional, not dismissed. CryptoQuant’s own scenario analysis allows for a relief rally into the $71,500–$81,200 band if geopolitical and macro tensions ease materially. The “Trader Realized Price” near $81,200 capped the last bear-market rally in January 2026 and would likely act as resistance again. Current long positioning data suggests the market is not pricing a clean breakout, and it’s pricing uncertainty.
The most likely scenario is a consolidation between $60,000 and $66,000 near-term, with the $55,000 target in play if demand metrics deteriorate further. Invalidation of the bearish thesis requires a sustained close above $81,200 on volume.
Discover: The Best Token Presales
Bitcoin Hyper Eyes Early-Stage Upside as BTC Buyers Wait on the Sidelines
With Bitcoin price prediction tumbling and its large institutional buyers potentially sidelined and spot demand contracting, the near-term upside on BTC itself looks capped, at least until macro conditions shift. That dynamic is pushing some traders to look earlier in the risk curve, specifically at infrastructure plays building on top of Bitcoin rather than trading it outright.
Bitcoin Hyper ($HYPER) is positioning directly in that gap. It’s a Bitcoin Layer 2 protocol integrating the Solana Virtual Machine, making it, by design, the first BTC L2 capable of delivering SVM-powered smart contracts while settling on Bitcoin’s security layer.
The pitch addresses Bitcoin’s core bottlenecks: slow finality, high fees, and the absence of programmable execution. The presale has raised $33 million at a current token price of $0.0136821, with staking available during the presale phase.
Early participants also access a Decentralized Canonical Bridge for BTC transfers, the infrastructure layer that makes the SVM integration usable in practice, not just on paper.
The post Bitcoin Price Prediction: CryptoQuant Believes Strategy Ought to Pause Its Bitcoin Purchases appeared first on Cryptonews.
Crypto World
White House Denies Trump Crypto Link to UAE AI Deal After Senate Democrats Demand Hearings
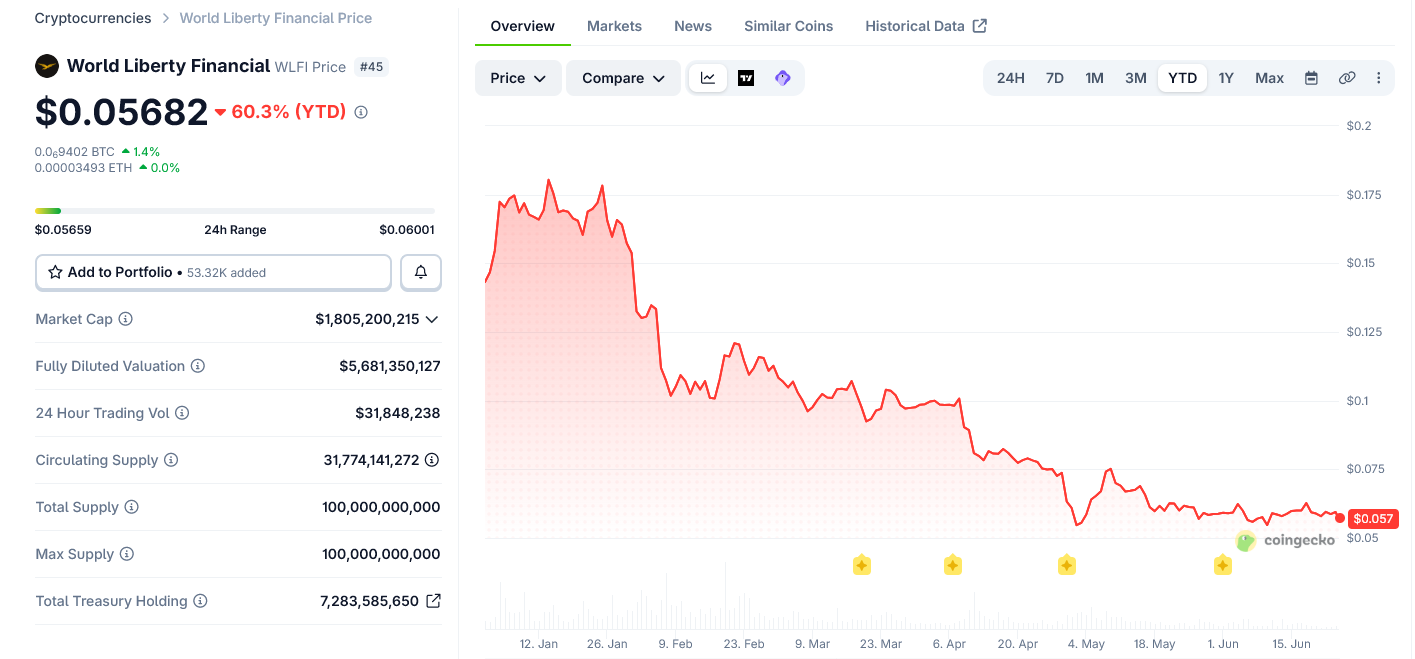
The White House has denied that the Trump administration’s AI agreement with the United Arab Emirates had any connection to World Liberty Financial.
This comes after Senate Democrats called for hearings into the Trump family-backed crypto firm’s reported ties to Abu Dhabi.
In comments provided to BeInCrypto, White House spokeswoman Anna Kelly said the UAE AI agreement was designed to deepen a strategic technology partnership between Washington and Abu Dhabi.
“The Trump administration’s historic agreement to enhance the partnership between the United States and the United Arab Emirates on artificial intelligence was designed to ensure the global AI ecosystem will be built with American chips and use American models, all while guaranteeing significant UAE investments into the United States,” Kelly said.
Democrats Press for Hearings
Five Senate Democrats asked Republican committee chairs this week to hold hearings into World Liberty Financial and foreign crypto deals linked to Trump, his family, and Special Envoy Steve Witkoff.
The request followed reports that a UAE-linked investment vehicle agreed to buy a 49% stake in World Liberty Financial for roughly $500 million shortly before Trump returned to office.
The lawmakers said the timing raised questions about whether foreign-linked money flowing into a Trump family crypto venture overlapped with later US policy decisions involving the UAE.
The White House rejected that connection directly.
“This has everything to do with what is best for the United States and nothing to do with World Liberty Financial – President Trump’s assets are in a trust managed by his children, and Special Envoy Witkoff has completely divested from the company,” said White House spokeswoman Anna Kelly.
White House Says AI Deal Serves US Interests
The White House framed the UAE agreement as a national security and industrial policy move, rather than a private business matter.
Kelly said the agreement “contains historic commitments by the UAE to further align their national security regulations with the United States, including strong protections to prevent the diversion of US-origin technology.”
That point goes to the center of the dispute.
Democrats argue that the UAE’s role in World Liberty Financial deserves scrutiny because the administration later approved sensitive technology and policy benefits involving Abu Dhabi.
The White House says the AI agreement advanced US strategic interests and included safeguards for American technology.

Ethics Questions Remain at the Center
White House Counsel David Warrington also rejected the suggestion that Trump’s private business interests affected official policy.
“The President has no involvement in business deals that would implicate his constitutional responsibilities. President Trump performs his constitutional duties in an ethically sound manner and to suggest so otherwise is either ill-informed or malicious,” Warrington said.
World Liberty Financial has become a political flashpoint because it sits at the intersection of crypto, foreign capital, and Trump family business interests.
The reported UAE-linked investment has drawn attention because Abu Dhabi has also played a growing role in AI, semiconductors, and digital assets. UAE-backed MGX was separately linked to a $2 billion Binance deal that used World Liberty Financial’s USD1 stablecoin.
Democrats have used those connections to argue that Congress should examine whether foreign actors gained influence through crypto-linked transactions.
The White House says that the argument is politically motivated.
“These Democrats are hellbent on pushing the same, tired narrative that they have used to attack President Trump, his family, and his administration for a decade, even after Americans rejected their lies by re-electing the President to office,” Kelly said.
Witkoff Denies Role in G42 Talks
The senators have also focused on Steve Witkoff, Trump’s Special Envoy for Peace Missions, because of his family’s connection to World Liberty Financial.
Warrington said Witkoff complied with ethics rules and had stepped away from the company.
“Mr. Witkoff, like all Administration officials, takes seriously his compliance with the government ethics rules. As Special Envoy for Peace Missions, he has not and does not participate in any official matters that could impact his financial interests. He has also divested from World Liberty Financial, notwithstanding his ability and willingness to recuse,” Warrington said.
A source close to Witkoff, speaking on background, said his children run World Liberty Financial and that he had no role in the company.
“Steve’s children run World Liberty Financial. Steve has nothing to do with it. The business was started one year before the presidential election. As we have said numerous times, Steve was not involved in negotiations related to G42. He was only briefed on these discussions, which is totally appropriate given his role at the time as Special Envoy to the Middle East. Like President Trump, all of Special Envoy Witkoff’s actions have been for the benefit of the American people,” the source said.
The comments leave the core dispute unresolved.
Democrats want sworn testimony and committee hearings into whether World Liberty Financial’s foreign-linked deals created conflicts inside the administration.
The White House says the UAE AI agreement had no connection to the firm and that both Trump and Witkoff were separated from relevant business interests.
For now, the fight has moved from crypto markets into congressional oversight.
The post White House Denies Trump Crypto Link to UAE AI Deal After Senate Democrats Demand Hearings appeared first on BeInCrypto.


Binance has withdrawn its application for a Markets in Crypto-Assets (MiCA) license in Greece and will seek authorization in another European Union country, the crypto exchange said Wednesday via several X posts.
While Binance did not immediately respond to CoinDesk’s request for comment, Gillian Lynch, head of Europe and the United Kingdom, told Reuters that “Binance is not leaving Europe.” Her comment follows her firm’s bid to secure a licence in Greece to offer crypto services in the EU went sour.
Last week, Binance said its European regulatory MiCA application was compliant despite reports of Greek rejection. “Our understanding is that the HCMC (Hellenic Capital Market Commission) completed its review of the application and considered it compliant with MiCA requirements, and that the application was also reviewed at ESMA level,” a Binance spokesman told CoinDesk via email on June 16.
The decision comes days before a June 30 deadline. Under MiCA rules, crypto firms must obtain a license from at least one EU member state by July 1 to serve clients across the 27-nation trading bloc. Unlicensed firms must wind down their EU activities.

A Wendy’s restaurant is seen on November 10, 2025 in Austin, Texas.
Brandon Bell | Getty Images News | Getty Images
Wendy’s shares surged on Wednesday, fueled by a burst of retail investor enthusiasm that appears disconnected from the fast-food chain’s latest executive appointment.
The stock climbed more than 42% on heavy volume at one point after Wendy’s disclosed the appointment of former Potbelly executive Steven Cirulis as chief financial officer and chief strategy officer. While management changes can influence investor sentiment, the magnitude of the move suggests other forces may be at play.
Trading was briefly halted by the New York Stock Exchange for volatility shortly after the open. When it resumed, it shot to a high of $8.89 a share. The stock was last up 30%.
Retail traders have increasingly turned their attention to the burger chain after the shares lost roughly half their value over the past 12 months. Wendy’s ranked as the second-most mentioned stock across Reddit trading forums over the past 24 hours, according to data tracked by Swaggy Stocks.
Posts circulating on social media have framed Wendy’s as a turnaround and recovery play. On WallStreetBets, one post titled “We need to save Wendy’s” garnered significant engagement. “We need to save Wendy’s before it’s too late,” the user wrote. Other posts framed the fast-food chain as a beaten-down consumer brand that retail investors could rally behind.
The surge in online attention echoes previous meme stock episodes like GameStop where retail traders piled into struggling companies with elevated bearish bets against them.
That dynamic could be particularly relevant for Wendy’s. Roughly 23% of the company’s free float is currently sold short, according to S3 Partners, leaving the stock vulnerable to a squeeze if rising prices force bearish investors to cover positions.
Wendy’s didn’t immediately respond to CNBC’s request for comment.
— CNBC’s Nick Wells contributed reporting.

ChatGPT AI just put a fresh shocking predicts on Bitcoin price prediction that paints a very different picture from where price sits right now. The model sees a climb toward $140,000 to $180,000 by the end of 2026, nearly triple current levels.
The bull case leans on timing as much as fundamentals. Bitcoin is trading near $62,640 today, and if the market follows a typical post halving rhythm, the next major leg higher could kick off around November as liquidity improves and risk appetite returns.
A handful of catalysts are stacked up behind that thesis. The CLARITY Act could finally deliver long awaited regulatory certainty for digital assets. Continued support from the Trump administration adds another layer, given its stated goal of making the United States a global leader in crypto.
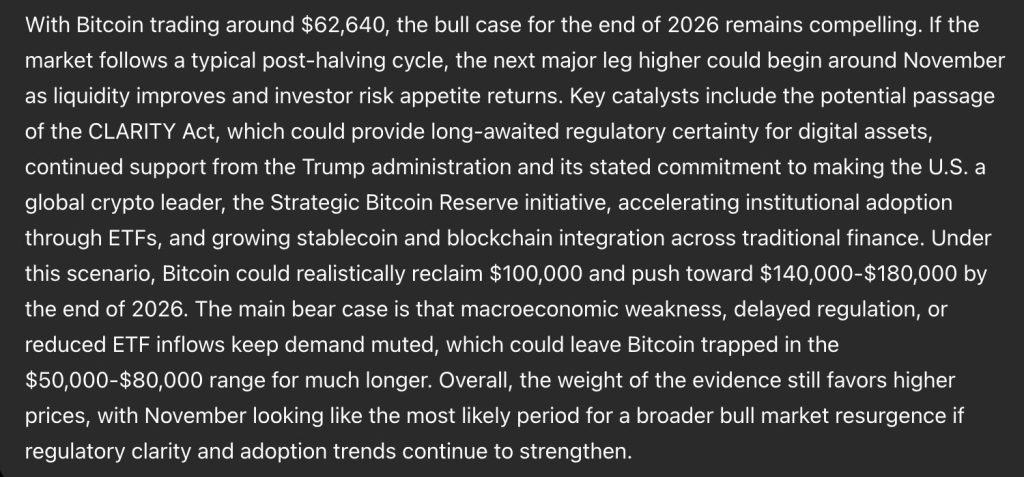
The Strategic Bitcoin Reserve initiative is another piece worth watching, alongside accelerating institutional adoption through ETFs and deeper stablecoin integration across traditional finance.
If those forces line up the way the model expects, bitcoin could reclaim $100,000 first before pushing into that $140,000 to $180,000 zone.
The bear case keeps the door open for a much slower outcome. Macroeconomic weakness, delayed regulation, or weaker ETF inflows could keep demand muted for longer than bulls want.
Under that scenario, bitcoin stays trapped somewhere between $50,000 and $80,000 for an extended stretch instead of breaking out. Even so, the model still leans toward higher prices overall, with November standing out as the most likely window for a broader resurgence.
Bitcoin Price Prediction: BTC Grinds Toward Its November Reckoning
The daily chart shows bitcoin at $62,769 after sliding from a high near $124,000 set last fall. That entire move down has been one long, grinding downtrend with a brief relief rally into May that topped out near $82,000 before rolling over again.
Price recently bottomed near $60,000 in early June and has spent the last few weeks stabilizing in the low $60,000s. That kind of basing action after a sharp drop often signals sellers losing steam rather than a trend reversal just yet.
Immediate resistance sits near $68,000, then a tougher wall around $76,000 where the May rally stalled out. Support holds at $60,000, with that recent low acting as the line bulls need to defend.
RSI is reading 37.84 against a signal line of 38.27, so momentum is sitting just under its own average, essentially flat after months of weakness. That tiny gap shows neither buyers nor sellers have firm control right now.
Overall momentum looks like it is leveling off rather than trending hard in either direction. If bitcoin can clear $76,000 and turn it into support, the runway toward six figures and that bigger 2026 target starts to look a lot more believable.
Don’t Miss Out on Our $1,000 USDT Airdrop on ByBit
LiquidChain Is Catching the Attention of Bitcoin holders: ChatGPT AI Predicts It’s the Next 100x
Most rotations are only obvious after they’re done. This one is still happening.
Bitcoin, Ethereum, and XRP have stalled against the same resistance for weeks, waiting on macro catalysts that keep sliding to next quarter. Holding and hoping isn’t a strategy. It’s a queue.
Smart capital doesn’t wait in that queue. It moves before the trade is obvious to everyone else.
Here’s why early-stage infrastructure plays differently: a small market cap means a modest rotation can move price by multiples. The gap between what a project is worth and what the market currently prices it at is where the return lives, and that gap only exists before the crowd finds it.
DeFi loses real money to fragmentation every day. Bitcoin, Ethereum, and Solana run on separate liquidity systems with no native bridge between them, so every cross-chain move costs fees, slippage, and failed transactions.
LiquidChain merges all three into a single execution layer. One deployment, full access, no cross-chain tax.
The market hasn’t found it yet.
Presale: $0.01454, with $860,000 raised.
Worth saying plainly: execution is unproven and adoption is unknown. This isn’t a safe bet, it’s an early one. Established coins offer a calmer ride to a ceiling you can already see. This is a bet on a ceiling that doesn’t exist yet.
Explore the LiquidChain Presale
The post Sam Altman ChatGPT AI Predicts Shocking Bitcoin Price By The End of 2026 appeared first on Cryptonews.

Dogecoin is trading near $0.078 in a depressing week that saw it lost 9% of its value. Eleven years after launching as a Shiba Inu joke, DOGE still carries a $12 billion market cap and a place in the top 11. But is it still the king of memecoins?
No major DOGE-specific catalyst, like a protocol upgrade or institutional announcement, has emerged in the past few years for DOGE, yet it still has a huge following. If you are in crypto or ever trade crypto, there’s 99% chance you heard DOGE.
Beyond DOGE, meme coins remain approximately 1% of the total crypto market value. It’s a niche that rotates fast when sentiment shifts. With the launch of SpaceX and Elon Musk’s backing, can Dogecoin run once again? Or has it become an old dog now?
Discover: The Best Crypto to Diversify Your Portfolio
Can Dogecoin Price Hold $0.078 Support or Is a Deeper Flush Coming?
DOGE is consolidating between $0.078 support and $0.082–$0.084 resistance. Neither level has broken cleanly, which is exactly what indecision looks like on a chart.
The setup carries a downside bias. A weekly loss in the 8–9% range without a bounce catalyst means sellers are absorbing any intraday recovery attempts rather than stepping back. Volume is not confirming accumulation. Elon Musk’s connection to DOGE narrative has historically acted as an ignition switch, absent a fresh Musk-driven social catalyst, that fuel isn’t in play.

Don’t Miss Out on Our $1,000 USDT Airdrop on ByBit
Dogecoin’s 15,000%+ return since 2013 is a real number. The uncomfortable counterpoint is that most of those gains were compacted into two parabolic windows, both tied to social momentum rather than protocol development. Until DOGE demonstrates utility beyond community speculation, the price remains a sentiment thermometer. Right now, Dogecoin is useful for reading the room, harder to trade on fundamentals.
Discover: The Best Token Presales
Maxi Doge Targets Early-Stage Upside as DOGE Consolidates at Key Levels
Traders watching DOGE grind sideways with an 8% weekly loss already know the calculus: late-cycle meme exposure at a $12 billion market cap means you need enormous capital inflows just to move the needle. The asymmetry simply isn’t there at this size. That’s where early-stage presales draw attention, not as a replacement thesis, but as a different risk profile entirely.
Maxi Doge ($MAXI) is positioning directly inside the meme coin category but built around a trading-community identity. The “240-lb canine juggernaut” framing is deliberately absurd, but the mechanics underneath it are concrete.
The presale has raised $4.8 million at a current price of $0.0002825 per token on Ethereum (ERC-20). Features include holder-only trading competitions with leaderboard rewards, a Maxi Fund treasury allocated to liquidity and partnerships, and dynamic staking APY for holders.
The “never skip leg day, never skip a pump” ethos is corny, yes, but viral-ready, as it targets exactly the retail energy that drove DOGE’s early cycles.
Research Maxi Doge and size accordingly. But if the meme cycle rotates and DOGE’s ceiling is capped by its own mass, early-stage exposure with genuine community mechanics is worth understanding.
The post Dogecoin Case: Is DOGE Still the King of Memes? appeared first on Cryptonews.
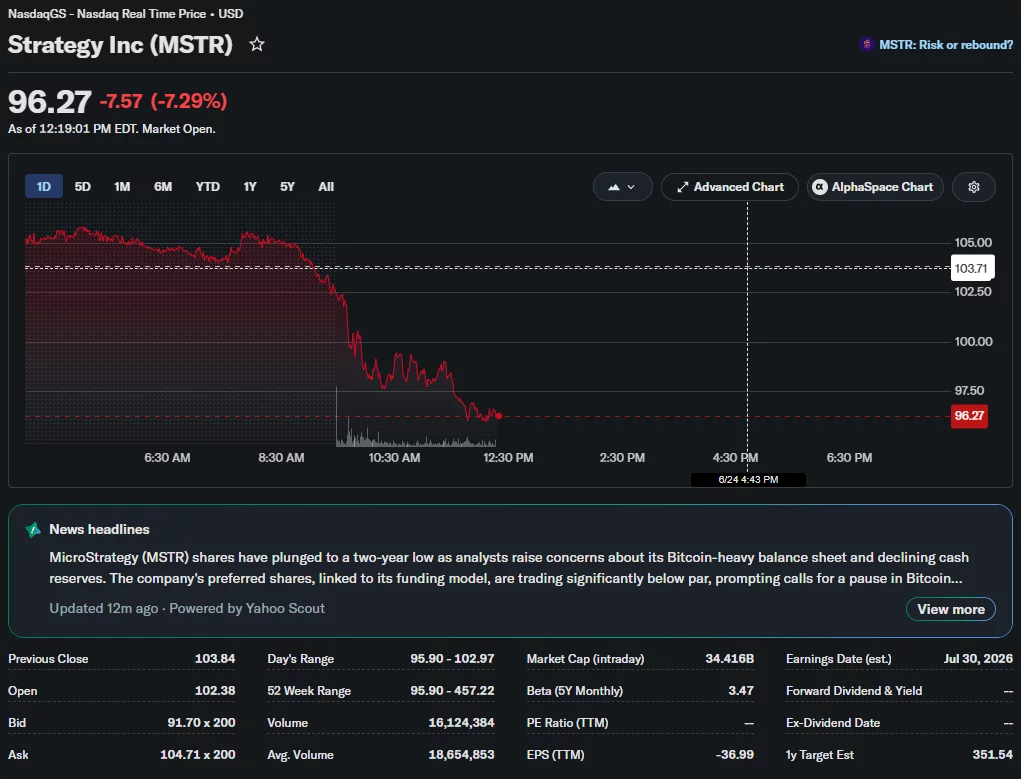
Strategy’s common stock has fallen below $100, prompting renewed criticism from Bitcoin skeptic Peter Schiff, who argues that further declines could leave the company facing difficult decisions over its Bitcoin treasury strategy.
Summary
- Peter Schiff warned that a deeper MSTR stock decline could eventually force Strategy to sell Bitcoin.
- Strategy raised $335.5 million through stock sales, allocating $35 million to buy 520 BTC.
- CryptoQuant urged Strategy to pause Bitcoin purchases and rebuild cash reserves as dividend obligations rise.
According to comments posted by Schiff on X, sustained pressure from short sellers could push Strategy into a situation where repurchasing its own shares becomes more attractive than continuing to accumulate Bitcoin.
He suggested that selling some Bitcoin to fund stock buybacks could help narrow the discount between the company’s market value and its underlying assets, though he questioned whether such a move would restore investor confidence.
Schiff also claimed that any forced sale of Bitcoin by Strategy could have consequences for the broader market, arguing that liquidating part of its holdings would likely weigh on Bitcoin prices.
The warning comes as Strategy shares continue to slide. MSTR traded at $96.27 on June 24, down 7.2% during the session and near its lowest level in two years. Regulatory filings show the stock has lost nearly 20% over the past five trading days and more than 38% over the last six months.

Cash reserves face growing scrutiny
Recent capital allocation decisions have added to the debate surrounding Strategy’s balance sheet. Company disclosures show that Strategy sold approximately 2.71 million MSTR shares last week, generating about $335.5 million in proceeds.
Executive Chairman Michael Saylor later disclosed that the company used roughly $35 million of that capital to purchase 520 Bitcoin. At the same time, Strategy increased its U.S. dollar reserves by about $300 million, bringing its cash balance to approximately $1.4 billion.
Saylor stated that the larger cash position is intended to support the credit quality of Strategy’s Digital Credit securities, a group of products that has become increasingly important to the company’s financing structure.
Separate concerns have emerged from on-chain analytics firm CryptoQuant, which recently urged Strategy to slow its Bitcoin purchases and focus on rebuilding liquidity. According to CryptoQuant, annualized dividend obligations tied to the company’s preferred stock products have climbed to roughly $1.2 billion.
Preferred stock obligations draw attention
CryptoQuant’s concerns center on STRC, Strategy’s perpetual preferred stock product. The firm reported that the company’s cash reserves have fallen 38% in 2026, while dividend coverage has dropped from more than seven years to about 14 months.
According to CryptoQuant, restoring coverage to 24 months would require roughly $2.8 billion in cash, nearly double Strategy’s current reserves.
CryptoQuant CEO Ki Young Ju also argued that Strategy’s Bitcoin purchases are no longer a major price catalyst. He said buying during periods of strong selling pressure may help defend Bitcoin’s range but is unlikely to spark a new rally.
Given those conditions, Ju recommended pausing additional Bitcoin purchases, rebuilding cash reserves, and adopting a more structured buying strategy.
In a follow-up X post on June 24, Schiff expanded his criticism to Strategy’s STRC preferred stock. He argued that the security had been marketed to risk-averse retirees as a lower-volatility way to gain exposure to the company’s Bitcoin strategy, despite falling more than 5% on the day and over 17% below levels where many investors reportedly purchased shares the previous month.
Schiff further claimed that the decline had erased nearly two years of dividend income and accused Saylor of making “material misrepresentations” when describing the preferred stock.

If congressional Republicans pivot toward further work on the elections-focused legislation, that may squeeze their bandwidth for other legislation. GOP lawmakers were already pushing again for Senate action on Trump’s favored bill on Wednesday.
“There is no path for the SAVE Act becoming law,” said Jaret Seiberg, a policy analyst at TD Cowen, in a Wednesday research note. “Senate GOP would need to eliminate the filibuster, a step they already have rejected. Even absent the filibuster, it is not clear the bill has the support of 50 senators, given worries about have to prove citizenship.”
Before his cancellation of the housing bill signing, Trump had posted on his social-media platform that the housing bill is of “minor importance compared to lower interest rates” and other congressional priorities, and he criticized the involvement of Democratic Senator Elizabeth Warren.
The president has a constitutionally designated 10-day window to weigh approved bills for signature once they land on his desk. If he were to veto it, the bill did pass with enough of a margin to reject that veto, though Republican allies of the president would have to agree to override his sentiment.
UPDATE (June 24, 2026, 16:01 UTC): Adds comment from TD Cowen.
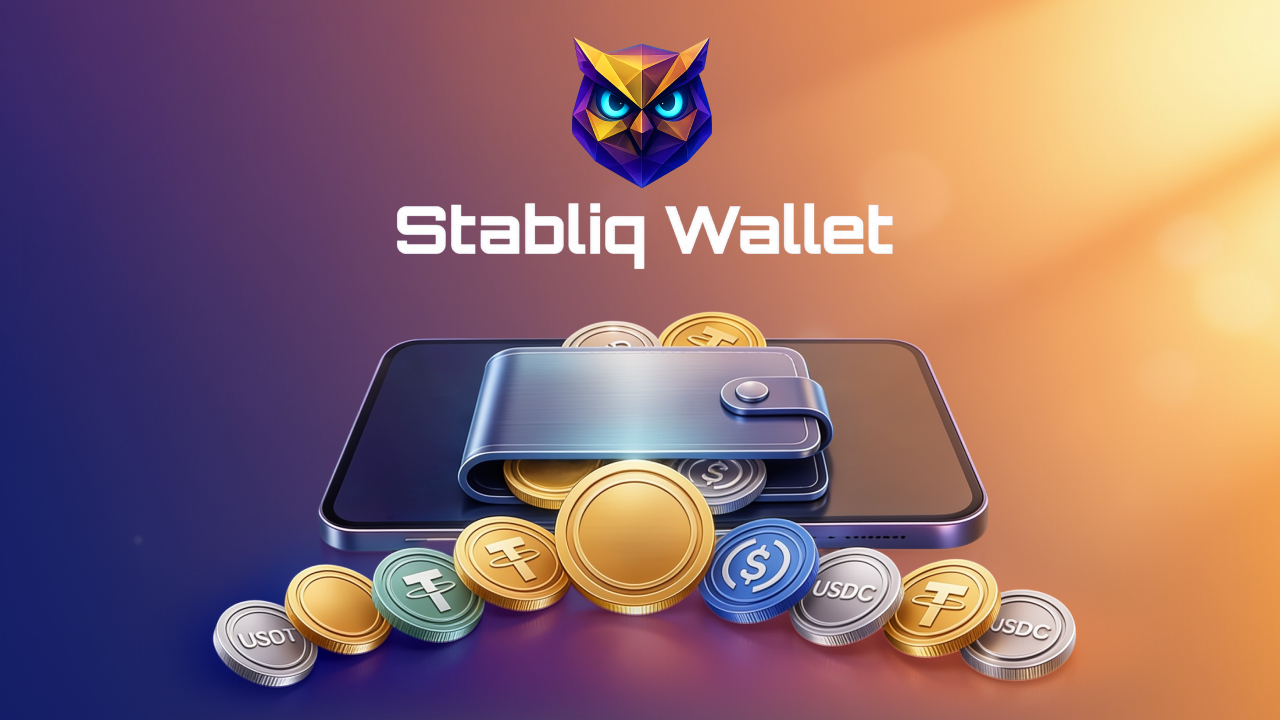
[PRESS RELEASE – Ras Al Khaimah, UAE, June 24th, 2026]
Fintech developer Virell Trade has officially announced the launch of Stabliq Wallet, a secure, non-custodial cryptocurrency wallet engineered specifically for the management of stablecoins across the Ethereum and TRON networks. Designed to enhance digital asset security and accessibility, the application provides comprehensive storage, transfer, and exchange capabilities for major stablecoins, including USDT and USDC.
To mitigate the complexities typically associated with decentralized finance (DeFi), Stabliq Wallet introduces a specialized architectural design that appeals to both institutional digital asset managers and retail users entering the Web3 ecosystem.
Key Infrastructure and Technical Features Include:
- Gasless Ethereum Token Swaps: The wallet features native in-app token exchange capabilities on the Ethereum network, incorporating advanced transaction routing that eliminates the standard requirement for users to hold native Ether (ETH) to cover network gas fees.
- Non-Custodial Security Framework: Built on a strict zero-trust, non-custodial architecture, the platform ensures users retain exclusive ownership of their private keys. Local security protocols are reinforced by biometrics (Face ID), password protection, and standardized seed phrase recovery mechanisms.
- Multi-Account and Multi-Network Integration: Users can manage multiple distinct accounts, import existing wallets via standard seed phrases, and track cross-network digital assets seamlessly within a unified interface.
- Operational Workflow Optimization: The application streamlines daily transactions through an integrated address book, comprehensive transaction historical ledgers, custom token import support, and quick-response (QR) code transfer protocols.
By focusing on the dual infrastructure of Ethereum and TRON — the two largest networks for stablecoin volume — Stabliq Wallet directly addresses the market’s demand for high-throughput, secure, and cost-effective digital asset management.
“Stabliq Wallet uses a non-custodial architecture, meaning users have full control over their private keys. Security features include Face ID, password protection, and seed phrase backup”, said the company.
About Virell Trade
Virell Trade is a digital asset technology company based in Ras Al Khaimah, UAE. The firm specializes in developing secure Web3 infrastructure, decentralized financial applications, and consumer-focused blockchain tools designed to enhance efficiency and security in the global digital economy. For more information, users can visit the official Stabliq Wallet platform.
The post Virell Trade Launches Stabliq Wallet for Stablecoin Management on Ethereum and TRON appeared first on CryptoPotato.
Shankill business burnt down in arson attack targeted with racist graffiti

Baroness Mone among individuals sued to recover PPE Medpro millions

Crypto-Backed Candidates Notch Wins in Three US State Primaries


-

 Fashion5 days ago
Weekend Open Thread: Miami – Corporette.com
-

 Entertainment4 days ago
Renter of Home in Anne Heche Crash Denies Settlement With Son
-

 Tech2 days ago
Microsoft accidentally kills epic Outlook email threads
-
 Sports23 hours ago
Two goals and an assist by sheer aura: Cristiano Ronaldo just entered the World Cup chat
-

 Business4 days ago
Soccer-U.S. defends Iran World Cup travel restrictions, says discussions ongoing
-
Crypto World14 hours ago
Bitcoin (BTC) Dips Below $62K, Ethereum (ETH) Plunges 6% Daily: Market Watch
-

 Politics6 days ago
BBC Reporter Discusses Cross Party Criticism Of Trumps Iran Deal
-

 Crypto World11 hours ago
Securitize Wraps Roubini's SEC-Registered ETF as Dubai VARA Digital Security
-
Business17 hours ago
Entergy settles forward sale agreements, raises $672 million in cash proceeds
-
 Business5 days ago
Wall Street Week Ahead: Investors see Micron earnings as pulse check of AI rally momentum
-

 Politics4 days ago
Andy Burnham and the meaning of Makerfield
-

 Tech6 days ago
AWS enters the context layer race with a graph that learns from agents, not manual curation
-
 Crypto World4 days ago
Can Charles Hoskinson Really Rescue Cardano?
-

 NewsBeat5 days ago
Keir Starmer Allies Question His Chances For No 10
-

 Crypto World5 days ago
HIVE shares jump as $220M AI deal speeds Bitcoin mining pivot
-

 Crypto World4 days ago
Jake Chervinsky accuses CME of protecting derivatives monopoly
-

 Tech2 days ago
Nearly 7,000 fake Amazon domains registered ahead of Prime Day 2026, researchers warn
-
 Tech3 days ago
Signal’s Meredith Whittaker says AI chatbots ‘are not your friends’ and calls Copilot agents a backdoor
-

 Entertainment5 days ago
Jose Alvarado Wants Taylor Swift at More Knicks Games
-

 Business6 days ago
Brexit cost 6% of UK economy, Bank of England company data suggests
You must be logged in to post a comment Login