

Crypto World
Worldcoin price jumps 8% as human-only tickets spark WLD rally

Worldcoin rallied after World Network partnered with Thirty Seconds to Mars to offer human-only ticket access for selected concerts.
Summary
- WLD climbed after World ID partnered with Thirty Seconds to Mars for human-only ticket access.
- Price hit $0.3779 before cooling, leaving $0.30 to $0.32 as key support.
- MACD remains bullish, but RSI shows the rally has slowed after the latest rejection.
Worldcoin moved higher after the Sam Altman-linked identity project gained attention for a new ticketing use case. The partnership allows verified World ID users to access special Thirty Seconds to Mars tickets.
The offer gives verified fans 2-for-1 ticket access, with one free extra ticket excluding VIP packages. It also gives users limited-edition merchandise vouchers for selected shows.
The campaign targets a common live-event problem: bots buying tickets before real fans can access them. World Network says World ID can prove that a user is human without giving ticket sellers a normal account-based identity check.
That real-world use case helped WLD stand out in a mixed altcoin market. The token rose strongly earlier in the session before cooling from its intraday high.
Worldcoin Price cools after strong intraday move
Worldcoin traded near $0.33 after earlier climbing as high as $0.38. The move followed a sharp daily rally, although the latest update showed the token had eased from its strongest level.
WLD’s 24-hour trading volume stood above $328 million, showing active market participation during the move. The token held a market cap of about $1.09 billion and ranked near the top 70 crypto assets by market value.
The price remains well below its all-time high of $11.74, reached in March 2024. It also remains down more than 70% over the past year, even after gaining more than 35% over the last 30 days.
That wider backdrop matters because the current move is still a recovery rally inside a larger downtrend. Buyers have returned in the short term, but WLD must hold key support to keep the rebound alive.
Indicators show buyers still have momentum
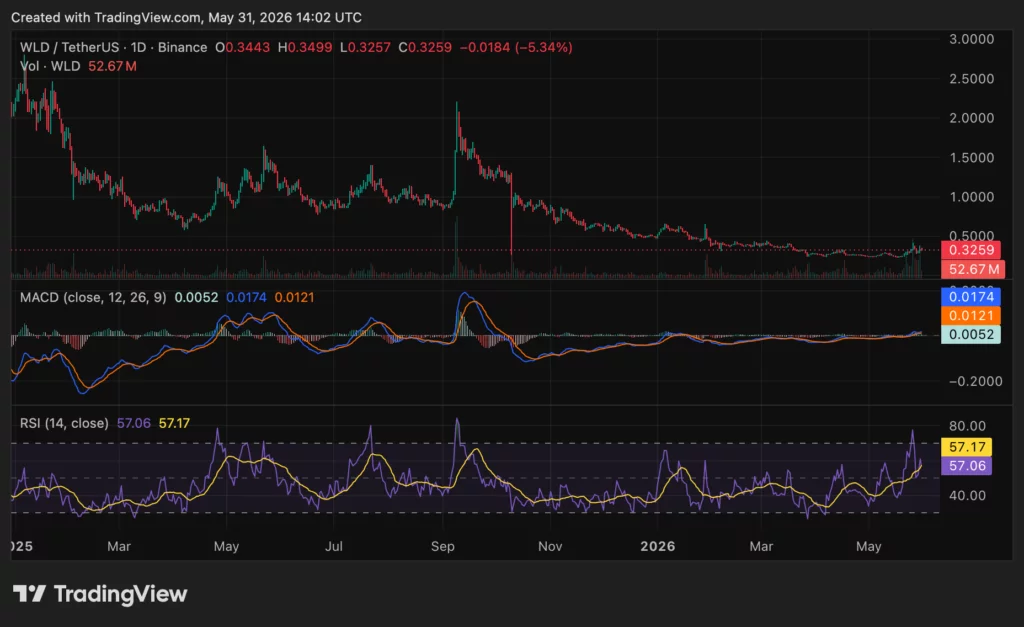
The latest chart shows WLD trying to hold above the $0.30 to $0.32 area after bouncing from the lower range. That zone now acts as the first support area for short-term traders.
Volume on the chart stood near 52.67 million WLD, showing that trading activity increased during the latest move. However, sellers stepped in after WLD approached the $0.40 to $0.45 zone.
That range now acts as near-term resistance. A stronger breakout would likely need WLD to reclaim $0.45 and then hold above $0.50.
The MACD remains bullish. The MACD line stands at 0.0174, above the signal line at 0.0121, while the histogram sits at 0.0052.
This shows that upside momentum remains active. However, the latest red candle shows that the rally has cooled after the recent surge.
Meanwhile, the RSI is at 57.06, close to its signal line at 57.17. That keeps WLD above the neutral 50 level, meaning buyers still have some control.
However, the RSI has pulled back from its recent high near overbought levels. This shows that the rally has slowed after strong early buying.
The World ID ticketing deal gives WLD a fresh real-world story. It also raises familiar questions around biometric identity, data safety and user trust.
Some traders asked whether this could be proof that crypto identity matters as bots take up more internet activity. Others focused on what could happen if biometric data or identity systems face security issues.
As previously reported by crypto.news, Worldcoin has already seen sharp narrative-driven rallies this year, including moves tied to AI, identity tools and broader interest in proof-of-human technology. Earlier reports also showed that WLD has faced criticism over token design and privacy concerns.
For now, the technical setup remains simple. WLD needs to defend $0.30 to $0.32 to keep the recovery intact. A move back above $0.40 would bring $0.45 into focus, while a clean break above $0.50 would show stronger buyer control.


TLDR:
- XRP trades at $1.13 after a steep 68% drop from its prior $3.66 cycle peak.
- 24-hour trading volume rose 4.83%, reaching a total of $868.27 million in activity.
- Trader Diana points to $1.10–$1.30 as a key accumulation zone on the weekly chart.
- Cryptollica says this XRP washout has only occurred twice before in 13 years.
XRP changed hands at $1.13, down 1.06% over 24 hours. Trading volume hit $868.27 million, a jump of 4.83%.
The token has now fallen 68% from its cycle high of $3.66. That high was set during a previous rally phase. The pullback has reset trader expectations across social media.
XRP Price Holds Support Zone After Steep Correction
The $1.10 to $1.30 range has become a focal point for traders. Crypto commentator Diana, who posts as @InvestWithD on X, said this zone represents an accumulation area. She argued the broader weekly chart structure still points upward despite the drop.
Diana outlined several upside levels in her post. She cited $2.00 to $2.50 as first resistance, and $3.66 as a retest of the previous cycle high. In addition, she highlighted the $5.00 to $6.00 price zone as a possible range for price discovery.
She also flagged $8.17 as a Fibonacci extension target. A further level near $17.15 appeared in her post as a long-term channel projection. Diana described $0.40 to $0.60 as a deeper macro support zone if the current range fails.
Separately, an account posting as @Cryptollica framed the current setup differently. The post claimed XRP has only seen this level of washout three times in 13 years. It suggested past instances of heavy pessimism preceded later rallies.
Trading Activity Reflects Mixed Sentiment Among Holders
Circulating supply for XRP sits at 62.05 billion tokens, against a max supply of 100 billion. Total supply stands at 99.98 billion. The token’s fully diluted valuation reached $113.44 billion based on current pricing.
Holder count data places active addresses at 536,410. That figure offers a snapshot of distribution across the network. Volume relative to market value sat at 1.23% over the past day.
Neither Diana nor Cryptollica cited specific on-chain metrics to support their projections. Their posts relied on chart pattern interpretation rather than fundamental data. Social sentiment around XRP has fluctuated through the corrective phase.
Price action over coming sessions may test whether the $1.10 floor holds. Traders following the accumulation thesis are watching that range closely. Others remain cautious given the scale of the recent pullback.

Global hedge fund leverage sits near multi-year highs. JPMorgan estimates that quarter-end rebalancing could trigger a $165 billion stock selloff before June ends, raising the risk of sharp moves in crowded technology trades.
The warnings come from Goldman Sachs and JPMorgan, two of the biggest forces in equity markets. Both point to the same risk, that leveraged and concentrated positions could amplify any pullback once mechanical selling begins.
Leverage Builds Inside a Crowded AI Trade
Goldman Sachs prime brokerage data has tracked leverage rising for over a year. Gross hedge fund leverage reached about 294% in June 2025, a five-year high, Reuters reported.
A note from Goldman trader Lee Coppersmith, circulated this month, said net leverage has since pushed to four-year highs.
JPMorgan strategist Nikolaos Panigirtzoglou sharpened the concern. He warned that stretched positioning in semiconductors is raising the risk of more frequent selloffs.
These value-at-risk shocks strike when volatility breaches funds’ internal limits and forces selling.
His team calculates that semiconductors’ share of global equity value is now more than six times their share of revenue. That is over double the comparable figure for the Magnificent Seven.
The concentration leaves the rally in AI stocks exposed if sentiment turns.
Why the $165 Billion Stock Selloff Matters
The near-term trigger is mechanical. JPMorgan estimates that quarter-end rebalancing could drive up to $165 billion in equity sales as June closes. Big investors are trimming stocks after a strong run.
Japan’s $1.9 trillion Government Pension Investment Fund is the single largest seller at about $60 billion.
US pension funds account for another $55 billion. Norway’s and Switzerland’s funds add tens of billions more, while balanced mutual funds offset roughly $15 billion of buying.
The selling meets a market already on edge. Under new Chair Kevin Warsh, the Federal Reserve held rates this month and signaled a possible hike this year.
That hawkish Federal Reserve stance has repriced rate-cut bets and lifted volatility.
What it Means for Bitcoin
The fragility reaches into Bitcoin (BTC). JPMorgan flagged that the network’s hash rate has grown more sensitive to price.
That signals more miners are operating near breakeven, an added pocket of fragility for crypto.
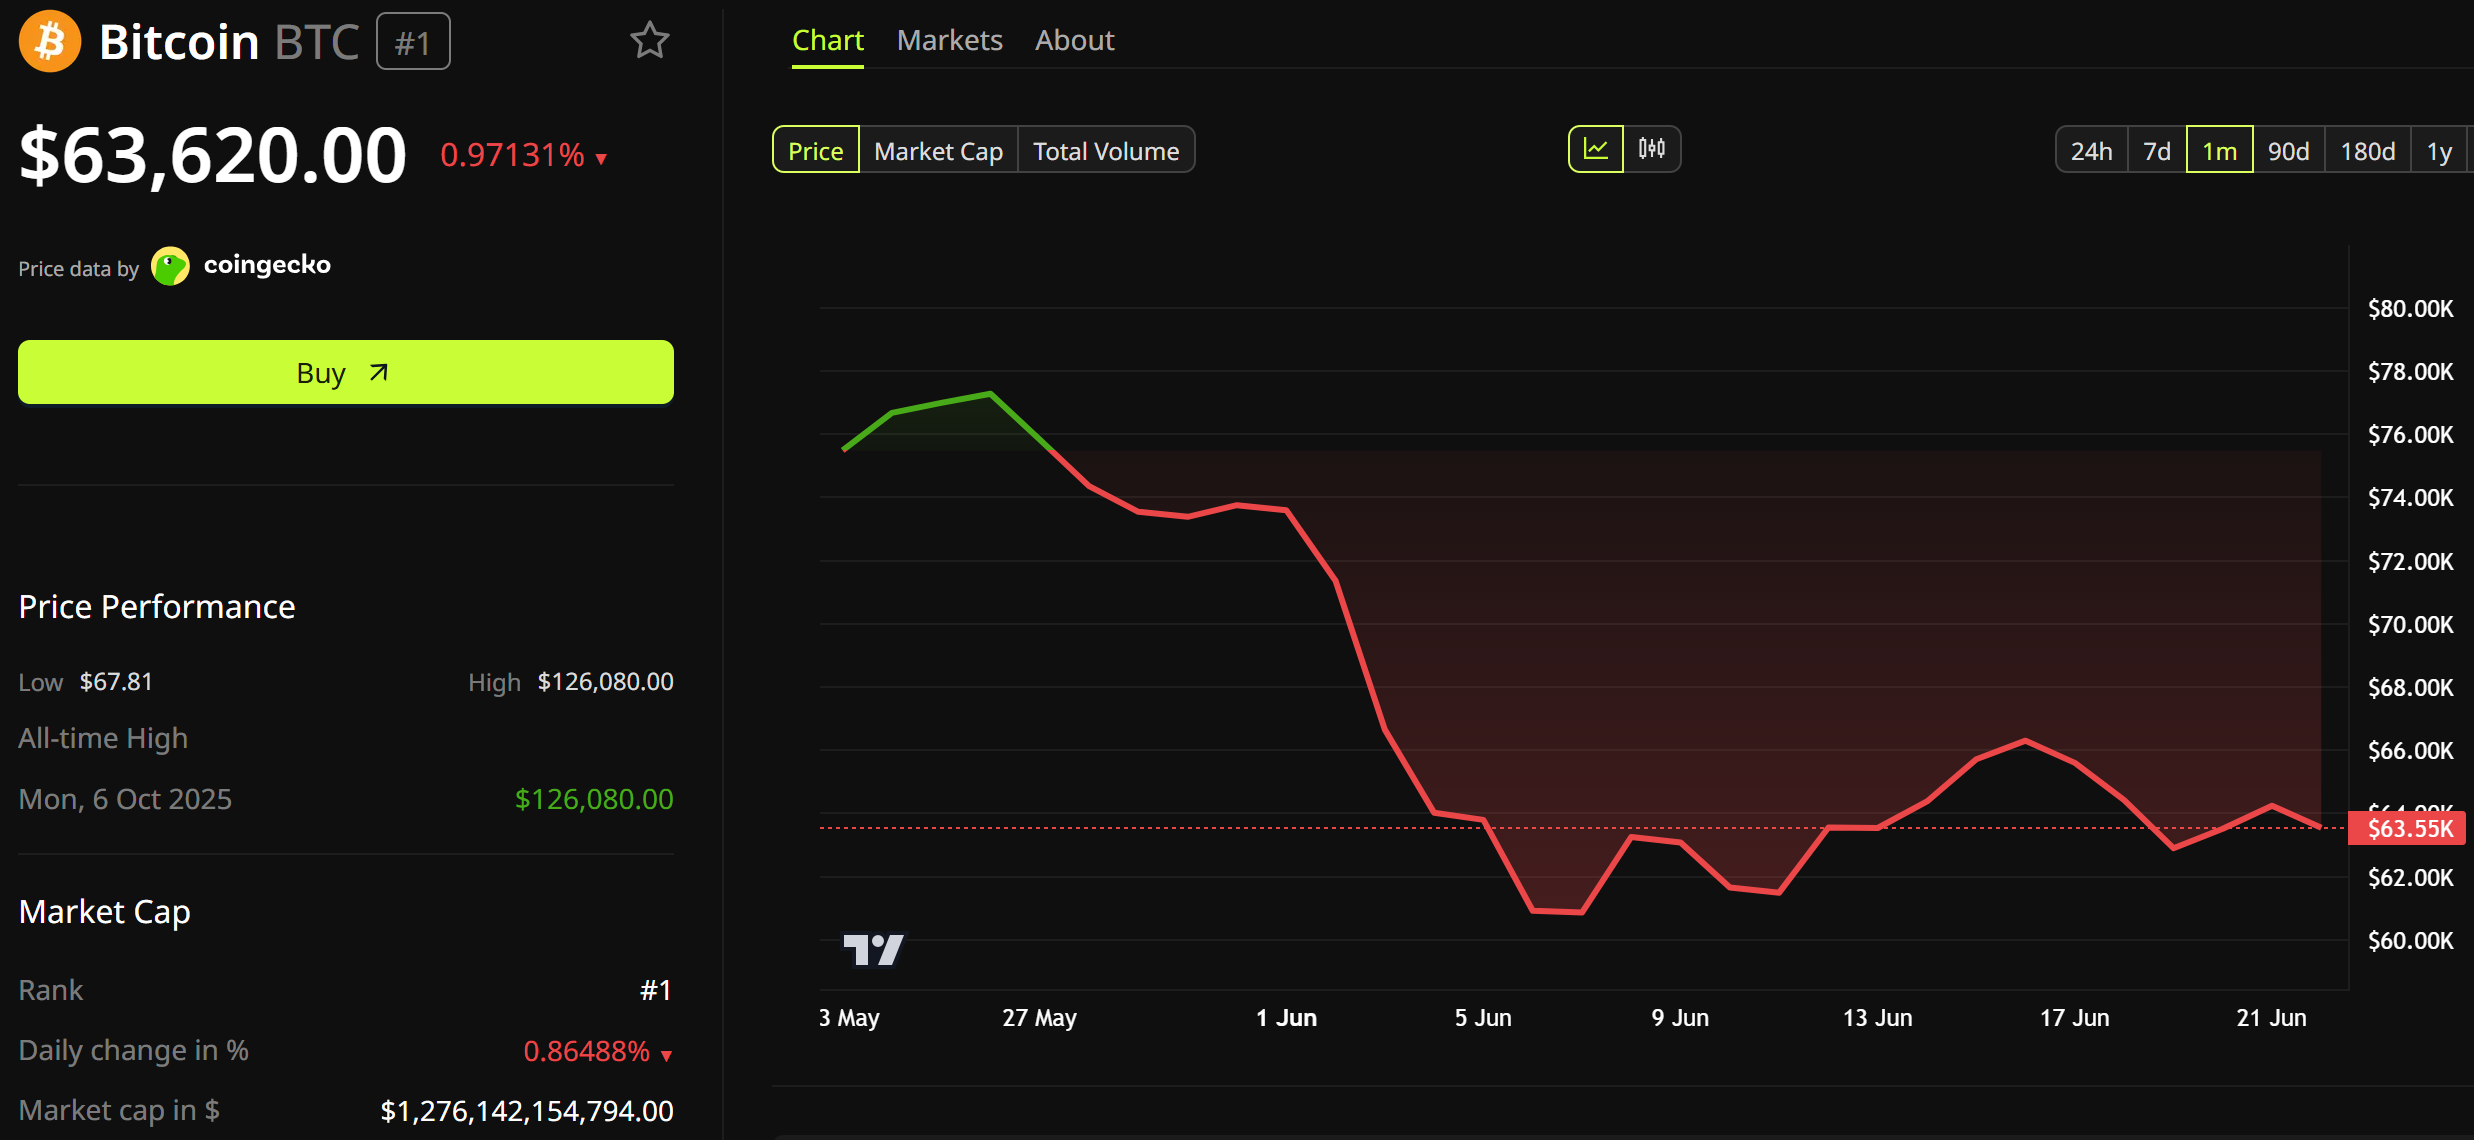
Bitcoin traded near $63,620, with a market value of about $1.28 trillion. It has slid toward the low $60,000s in recent weeks.

The token now trades more like a tech stock than a safe haven. It weakened as FOMC and AI earnings rattled markets.
If forced equity selling collides with high leverage and crowded AI bets, cross-asset volatility could climb into month-end.
The market absorbing the flows or amplifies them may set the tone for stocks and crypto this week.
The post $165 Billion Stock Selloff Looms as Goldman Flags Rising Leverage appeared first on BeInCrypto.
The Proof-of-Stake (PoS) blockchain network, Algorand, has revealed that it is pushing toward becoming quantum-resistant by the end of 2027. The announcement comes as concerns about the post-quantum threat rise in the crypto space.
According to a blog post by the network’s team, the quantum threat has been deemed a serious risk to the security of blockchain technology. Hence, Algorand has outlined a roadmap detailing its efforts, plans, progress, milestones, and ongoing research in the area of post-quantum cryptography (PQC).
Algorand Pushes for Quantum Resistance
Google Quantum AI recently identified Algorand among a set of smart-contract platforms that can achieve PQC. The blockchain already executed its first PQC-secured transaction in 2025 and intends to complete the full PQC transition in less than two years.
“Post-quantum migration is a balancing act. Moving too slowly leaves systems exposed to future quantum attacks, but moving too quickly can mean relying on algorithms and implementations that have not yet been sufficiently battle-tested,” Algorand’s team explained.
The first step in the roadmap is introducing support for native post-quantum accounts in the protocol release scheduled for the third quarter of 2026. Previously enabled Falcon accounts via the Algorand Virtual Machine (AVM) currently demonstrate the viability of post-quantum signatures on the Algorand protocol, but these are not natively supported by the ledger. The introduction of native post-quantum account support will give room for network-level support for multiple concurrent signature schemes.
After the Algorand team establishes a clear direction for standardizing a new derivation scheme for lattice-based post-quantum keys, the network will implement PQC updates to its tools. These include legacy software development kits (SDKs), hardware wallets, and the AlgoKit. Eventually, the network will introduce support for additional signature schemes on traditional Ed25519 accounts.
Exploring Post-Quantum Multisignatures
While implementing these upgrades, Algorand intends to create an environment that enables the integration of future advances with minimal protocol disruption.
“Building on our robust history of native multisig, the arrival of cryptographic agility and native post-quantum accounts enables us to deploy native multisig support for multi-cryptography schemes by the end of 2026. We view this as an essential advancement for institutional operations, treasury management, and high-stakes financial applications,” the team explained.
One of the final steps in the roadmap explores post-quantum multisignatures as a generic policy layer over independently verifiable signatures. This will allow for weighted approvals, hybrid combinations of classical and post-quantum signers, and future PQC signature algorithms as standards develop. This step will ensure protection against both classical and quantum-era threats.
Meanwhile, Algorand is not the only blockchain network pushing for quantum resistance in the coming years; Ethereum and Ripple are working towards the milestone as well.
The post Algorand Reveals Plans to Become Quantum Resistant by 2027 appeared first on CryptoPotato.
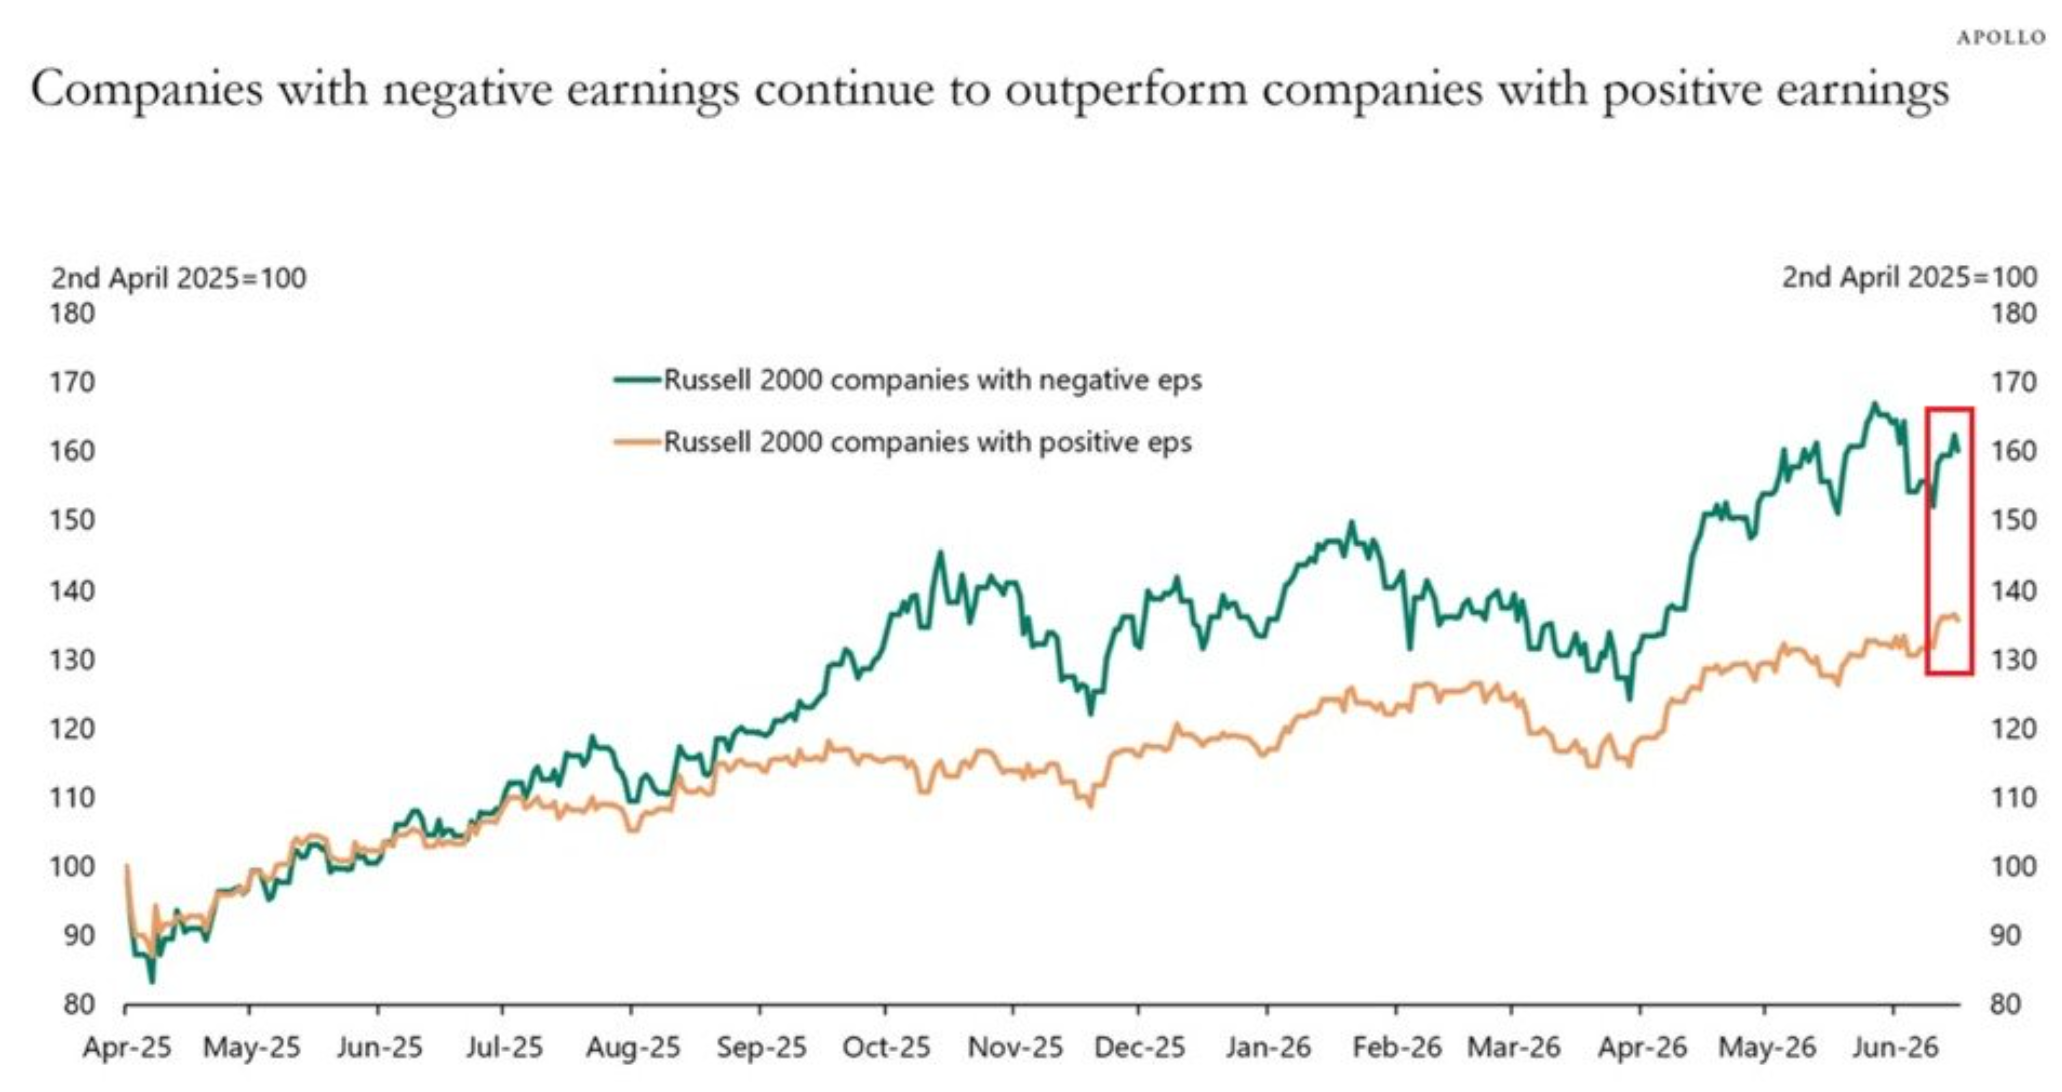
Unprofitable Russell 2000 stocks have climbed about 60% since April 2025, far outpacing the 38% gain for profitable small-cap firms, according to Apollo Global Management.
The divergence has widened through mid-2026, prompting Apollo chief economist Torsten Slok to warn that the market has stopped pricing risk the way it once did.
Unprofitable Russell 2000 Stocks Lead the Rally
The split is stark. Of the index’s roughly 2,000 members, 806 carried negative trailing earnings late last year. Another 1,120 were profitable, Apollo data showed.
That 40% share is not new. Slok first flagged it in November 2023, warning the loss-making firms would be vulnerable to high rates and slowing growth.
Now those same names lead the market. The reversal is the puzzle Slok keeps returning to.
The rally itself traces to early April 2025. Stocks bottomed after the Liberation Day tariff shock. The Russell 2000 has since gained nearly 44% off that low, Royce Investment Partners said.
Micro-caps did even better, up about 66%. Traders watched the rebound through the Russell 2000 breakout signal that pointed to rising risk appetite.
Small caps have since pushed to fresh record highs across the index.

AI Bets Are Fueling the Speculative Bid
Most of the loss-makers are tech firms, Slok told Fortune. Many sit in software, semiconductors, and biotech, sectors riding the AI stocks driving gains across the broader market.
Semiconductor makers led the micro-cap leg of the advance, Royce noted.
Investors are paying up for the promise of future growth rather than current profit. That reach has fed growing AI bubble fears among strategists eyeing stretched valuations.
“Something is broken in price discovery when companies with negative earnings keep outperforming companies with positive earnings.” Slok wrote in a June 20 note.
Not everyone reads it as froth. Morgan Stanley’s Lisa Shalett notes that small-cap firms carry a cost of capital above their return on assets.
Royce’s Francis Gannon counters that many small caps are genuine suppliers to the AI buildout. He also expects stronger small-cap earnings growth in 2026.
The gap keeps widening, with cheap money and AI enthusiasm holding it open.
Slok has returned to the divergence since October, and it has yet to close. Profitable names closing the distance may hinge on interest rates and how long the AI trade lasts.
The post Unprofitable Russell 2000 Stocks Surge 60%, Outpacing Firms That Actually Earn Money appeared first on BeInCrypto.
TLDR:
- HYPE ETFs drew $31.4M inflows equal to 0.208% of market cap, leading relative ETF demand.
- HYPE outpaced SOL on relative inflow rate while BTC and ETH recorded net ETF outflows in period.
- Smaller market cap magnified HYPE ETF impact compared with BTC and ETH capital flows data view.
- ETF flow divergence highlights uneven capital rotation across major crypto assets weekly shift.
HYPE ETFs recorded stronger relative inflows than Bitcoin and Ethereum over the past week, according to reported market data. The token attracted $31.4 million in net ETF inflows, equal to 0.208% of its market capitalization.
Bitcoin and Ethereum both registered negative readings over the same period, while Solana posted weaker positive inflows.
The divergence has placed HYPE ETF activity under closer attention as capital flows shift unevenly across major crypto assets.
HYPE ETF vs BTC & ETH Inflows Show Market Cap Divergence
Data from Hyperliquid Hub and Henry Vo TTT showed HYPE ETF inflows reached $31.4 million over seven days. The figure represented 0.208% of total market capitalization, positioning HYPE ahead on a relative inflow basis.
Solana recorded 0.016% inflows, significantly below HYPE’s absorption rate across the same reporting window. The gap highlighted uneven ETF demand intensity across mid-cap and large-cap crypto assets.
Bitcoin posted a negative 0.011% reading during the same period, based on reported ETF flow data. Ethereum followed with a negative 0.007% figure, signaling net outflows across its ETF exposure.
Both assets faced weaker capital participation compared to smaller-cap tokens in the same cycle. This divergence pointed to shifting allocation behavior across crypto-linked investment products.
Relative comparisons showed how ETF flows scale differently across market capitalizations.
Smaller assets like HYPE reflect sharper percentage movements even with lower absolute inflows.
Larger assets require significantly higher capital to shift their ETF flow percentages meaningfully. The structure of ETF exposure continues to amplify differences between major crypto assets.
HYPE Market Cap Impact and ETF Flow Pressure Across Crypto
HYPE’s smaller market capitalization amplified the effect of ETF inflows on circulating supply dynamics. A $31.4 million inflow represented a larger proportional absorption compared with BTC and ETH flows.
This structural difference explains why relative inflow metrics often favor mid-cap crypto assets.
ETF demand therefore appears more visible in tokens with lower overall market value.
Market participants have tracked whether the inflow trend continues beyond a single weekly cycle. Sustained ETF demand typically signals more consistent capital allocation across crypto investment products.
Short-term spikes remain common, but continuity determines long-term market interpretation.
The latest figures place renewed focus on comparative ETF activity across major tokens.
Future reporting periods will determine whether HYPE maintains its inflow advantage over larger assets. Bitcoin and Ethereum flows will also remain key benchmarks for market-wide ETF sentiment.
Solana’s relative positioning adds another layer to ongoing capital rotation patterns. ETF flow divergence continues to shape how traders interpret crypto market strength.

LUNC price forecast is getting more interesting amid stability in terms of technology and a number of developments within the ecosystem. Short-term dynamics are highly volatile, but market participants keep an eye on the possibility for upgrades and protocol launches to help form a rebound pattern.
Judging from the comments of the analyst terra_army on social media, LUNC is possibly reaching an important stage of its market cycle. The analysis of the weekly chart reveals a period of consolidation accompanied by a decrease in volatility and development of the price base.
Starting from 2022, the majority of the price moves of Terra Classic have occurred in a defined range without any breakdown during bearish trends. Support kept forming in the $0.00006-$0.00007 area, allowing for a long-term accumulation setup.
Technical Indicators Indicate Positive Change
There are a number of technical indicators that have started showing signs of improving conditions in higher time frames. Short-term moving averages have started to flatten out after a long period of decline, whereas momentum oscillators have moved from extremely bearish levels.
Furthermore, the Bollinger Bands, which had been quite tight for a longer duration, have started to widen. This usually indicates a return of volatility following a period of consolidation. It is being watched to see whether there will be any sign of strong directional movement. The overall technical picture remains positive despite a recent downtrend, and traders have their eyes set on a possible breakout in the coming days.
Short-Term Selling Pressure Is An Obstacle
Despite the positive long-term scenario, there was some short-term selling pressure seen in LUNC. The price was seen at $0.00006803 following a daily decline of over five percent. Market capitalization also decreased amid the session due to traders’ cautiousness.
From intraday charts, it could be observed that the asset formed a lower highs and lower lows formation. A couple of bounces were witnessed within the day as well; however, they all met selling pressure.
The drop was fueled further when support at $0.0000690 broke down, causing the asset to move towards $0.0000670 before it found a floor. Even though a slight bounce was seen, resistance zones still keep the upward momentum limited. There was also a decrease in trading activity, with daily volume declining over 20%.
Community Ecosystem Development Continues To Fuel Optimism
In addition to technical developments, developments in the ecosystem of Terra Classic continue to drive optimism among the members of the community. Among the highly anticipated events is the impending mainnet launch of the Juris Protocol, which could act as a catalyst for boosting network activity.
More efforts are being directed towards infrastructure improvements, including upgrades to the station platform in order to improve accessibility and user experience.
The Market Module 2 has also garnered a lot of attention in the community. It aims to link the various Terra Classic projects under one ecosystem while providing USTC staking abilities to the network.
On the other hand, the burning program of Binance is continuing to reduce the amount of supply in circulation. Investors have also cited increasing visibility from HTX and the likelihood of more exchanges joining in future burn programs.
The above developments by Terra Classic will see investors keep their eye on whether the growth of the ecosystem, supply reduction programs, and improved technical conditions can enhance the prospects of LUNC in the future.


Anthropic has reportedly finished training a more capable Mythos successor, according to AI watcher Andrew Curran. The company has not confirmed the model’s existence, name, or capabilities.
Curran said the system could ship as Mythos 5.1 or Mythos 6, or stay internal. His report came nine days after US export controls forced Anthropic to suspend Mythos 5 and Fable 5.
Mythos Successor Emerges from Training
Curran describes the supposed new system as stronger than Mythos 5. However, he stressed uncertainty over its name and whether Anthropic would release it at all.
“A new, more capable version of Mythos has emerged from training. I don’t know whether it will be called Mythos 5.1 or Mythos 6, or if Anthropic will keep it internal to accelerate further development…” Curran wrote.
Anthropic released Mythos 5 and Fable 5 on June 9 and lost them to the directive three days later. Several still expect an iterative upgrade, partly because the model suspension order limits today’s lineup.
Fable 5 ships with heavy safeguards for public use. Mythos 5 runs with fewer security restrictions through Project Glasswing, the firm’s vetted cybersecurity program.
Anthropic says about 50 partners have used early Mythos models to find more than 10,000 high- or critical-severity software flaws.
Why the Suspension Does Not Stop Development
Commerce Secretary Howard Lutnick sent the directive to Anthropic chief Dario Amodei on June 12, citing national security.
It barred every foreign national, including Anthropic’s own foreign-born staff, so the firm disabled both models worldwide.
The government flagged a method for bypassing Fable 5’s safeguards. Anthropic reviewed the demonstration, called it narrow, and warned the same standard would halt new model launches industrywide.
It is still working to reverse the export controls.
Subscribe to our YouTube channel to watch leaders and journalists provide expert insights
The order followed a reported Amazon warning to officials. Amazon has committed up to $25 billion to Anthropic.
Even so, it reportedly told the administration its researchers used Fable 5 to surface attack-ready information.
The clash later drew comments from Donald Trump and a public defense from Amodei.
Curran argued that halting deployment does little to slow progress and may even speed it up by freeing resources.
He pointed to open-weights rivals such as Z.ai’s GLM-5.2, which matches far larger closed models on coding tasks at a fraction of the cost.
The successor’s path stays uncertain. Anthropic shipping it publicly, restricting it to Glasswing, or keeping it internal could reshape the AI race.
The company continues to seek restored access for both suspended models and has not addressed latest developments publicly.
The post Anthropic Reportedly Finishes Training Successor to Suspended Mythos 5 Model appeared first on BeInCrypto.
TLDR:
- Bitcoin traders increasingly identify the $40K-$50K range as a preferred accumulation zone.
- Michaël van de Poppe warned that heavily crowded market expectations often fail to play out.
- Michael Saylor’s latest tracker post renewed attention on Strategy’s Bitcoin acquisition plans.
- Strategy reportedly holds 846,842 BTC, making it one of the largest corporate holders.
Bitcoin traders are increasingly focused on the possibility of a deeper market pullback, with many pointing to the $40,000 to $50,000 range as a preferred entry zone.
At the same time, fresh attention has turned to Strategy after Michael Saylor shared another update tied to the company’s Bitcoin holdings. The developments surfaced across crypto social media as investors weighed future market direction.
Together, they highlight the ongoing debate between waiting for lower prices and accumulating Bitcoin at current levels.
Bitcoin $40K-$50K Buy Zone Debate Gains Attention
Discussion around Bitcoin price expectations intensified after comments from crypto analyst Michaël van de Poppe circulated across social media. He argued that increasingly popular downside targets often fail to materialize once they become widely expected.
The $40,000-$50,000 range is an attractive area for traders to enter Bitcoin, according to Van de Poppe. He said that was similar to the times when investors were anticipating that Bitcoin would go back to $60,000, and it was trading at around $85,000.
The broader message centered on how crowded expectations can influence trader positioning.
Bitcoin’s recent market behavior has kept traders divided between waiting for a larger correction and maintaining exposure at current levels. The debate has become a recurring theme across crypto trading communities.
Social media discussions showed strong engagement around the proposed buy zone. The comments did not contain any predictions on prices, but they were about the psychology of the market.
A number of participants were interested in the possibility of widespread expectations lowering the chances of a substantial drop.
As market participants kept their eyes on macroeconomic trends and institutional movement, the conversation developed as they did. Bitcoin continues to be the biggest digital asset on the market by market cap and can influence the overall crypto trading market.
Michael Saylor Post Sparks Fresh Bitcoin Purchase Expectations
Attention also shifted to Strategy and its Bitcoin accumulation strategy. Michael Saylor posted a chart featuring the company’s Bitcoin tracker alongside the message that it looked better with more dots.
The post quickly attracted attention because similar tracker updates have often preceded announcements of new Bitcoin purchases. Crypto Patel highlighted the development while sharing updated figures related to Strategy’s holdings.
According to the data shared, Strategy currently holds approximately 846,842 Bitcoin. The position was reported to be worth roughly $54.3 billion based on current market values.
Crypto Patel stated that the company’s average acquisition price stands near $75,658 per Bitcoin. The reported total investment reached approximately $64.07 billion.
The figures indicate an unrealized loss of about $9.7 billion, or roughly 15%, based on the data provided. Despite that position, Strategy remains one of the largest corporate holders of Bitcoin globally.
The latest tracker update has renewed focus on the company’s accumulation strategy. Market participants now await any official disclosure regarding additional Bitcoin purchases.

Sumsub integrates Model Context Protocol to connect AI agents with compliance configuration
Sumsub, a verification and anti-fraud platform used by companies to support identity checks and compliance workflows, has launched a Model Context Protocol (MCP) integration and new AI agent skills. The announcement centers on a practical shift for regulated onboarding and fraud prevention teams, by allowing AI agents to help translate anti-money laundering (AML) policies and related compliance documents into configuration changes inside Sumsub.
In many compliance stacks, the work does not end at document review. Teams still need to configure verification levels, risk questionnaires, and onboarding or applicant routing workflows for each jurisdiction and product. Sumsub’s stated goal is to move part of that configuration effort from manual interpretation to a more automated “policy-to-setup” process, mediated by AI agents.
What the MCP integration changes
Model Context Protocol is designed to standardize how AI tools connect to external systems. According to Sumsub, its MCP integration is model-agnostic, intended to work with leading AI agents including ChatGPT and Claude. That is notable because compliance use cases often require consistent auditability and controlled access, even when the AI model behind the assistant varies.
From policy documents to live workflow settings
Sumsub says teams can upload AML policies or other compliance requirements and have an AI agent build a corresponding Sumsub environment. The configuration described includes verification levels, risk questionnaires, and onboarding workflows that can reflect jurisdiction-specific risk logic. Sumsub frames the change as reducing configuration timelines from days to minutes, though the company does not provide independent benchmarks in the material shared.
Handling operational tasks through agent skills
The launch also includes agent capabilities intended to support day-to-day compliance work. Sumsub lists use cases such as reviewing applicants, running analytics, generating verification links, and responding to regulatory changes. In practice, this approach positions AI agents not only as assistants for drafting or analysis, but as tools that can execute operational steps inside a compliance platform, subject to permissions.
Why this matters for identity verification and AML operations
Identity verification and AML compliance have become key layers of customer onboarding, especially in digital-first industries such as financial services, crypto platforms, and other regulated online businesses. Even when organizations have policy documents and internal compliance guidance, there is often a gap between text-based requirements and the configuration logic used by verification vendors.
That gap tends to create manual bottlenecks. Solution architects or compliance operations teams may need to interpret policy text, translate requirements into platform settings, and then rebuild or adjust workflows when regulations or internal risk tolerances change. If the “translation” step can be accelerated safely, it could reduce cycle time for onboarding updates and help teams respond faster to evolving compliance requirements.
At the same time, automating compliance configuration introduces governance questions. AML controls are not simply workflow automation, they are risk controls that must be aligned with regulations, internal policy, and operational evidence. Sumsub’s approach, as described in the announcement, emphasizes controlled execution rather than fully autonomous configuration.
Permissioning, sandboxing, and human approval
Sumsub says access to the MCP integration is restricted by separate permissions to allow granular control over what an AI agent can do. The company also states that sensitive actions are performed in isolated sandbox environments, and that configuration changes are reviewed and approved by humans.
This matters because agentic systems can increase throughput but also expand the potential surface area for mistakes. For compliance workflows, oversight and traceability are typically non-negotiable, particularly when configurations affect verification requirements, risk scoring, or customer onboarding outcomes.
Developer availability and integration pathway
Sumsub indicates the MCP integration is supported via an open-source set of agent skills published on GitHub, installable with a single terminal command. Documentation for the MCP server and for building with Sumsub’s AI features is described as publicly available via Sumsub’s developer resources.
Additionally, Sumsub says it is now officially listed on the ChatGPT Apps platform, and that discussions are ongoing with additional large language model providers. The practical implication is that teams building compliance or onboarding workflows may be able to access the integration through AI application ecosystems, rather than implementing everything from scratch.
Industry context: agentic AI meets regulated workflows
The compliance and identity verification market has been experimenting with AI for multiple years, including document analysis, fraud signals, and investigative assistance. However, the latest push in the industry is moving toward “agentic” workflows, where AI systems can take structured actions in software tools, not just generate text or summaries.
Agentic compliance workflows are attractive because they promise to reduce operational friction, particularly for tasks like policy interpretation and workflow setup. But adoption tends to depend on how well vendors manage governance, permissioning, and audit trails, as well as how reliably they can map policy language to operational controls.
Sumsub’s announcement suggests the company is targeting the configuration layer, positioning MCP integration as a way to standardize how AI agents interact with compliance platforms while keeping human review in the loop.
What to watch next
For teams evaluating this type of capability, several practical questions often determine whether it can move from pilots to production: how permissions are scoped across roles, what evidence is stored for configuration approvals, and how quickly organizations can validate that AI-generated setups match their compliance requirements.
Sumsub says the integration is available now, with additional documentation and agent skills provided for developers. The next phase will likely involve how quickly existing compliance operations teams can test policy-to-configuration accuracy and integrate the workflow into their onboarding processes without adding new governance overhead.
After Bitcoin’s decisive breakdown from a multi-month rising channel, the largest crypto is still under immense pressure. While buyers managed to defend the $60K support region and trigger a short-term rebound, the broader structure still favors the sellers unless BTC can reclaim several important resistance levels overhead.
Bitcoin Price Analysis: The Daily Chart
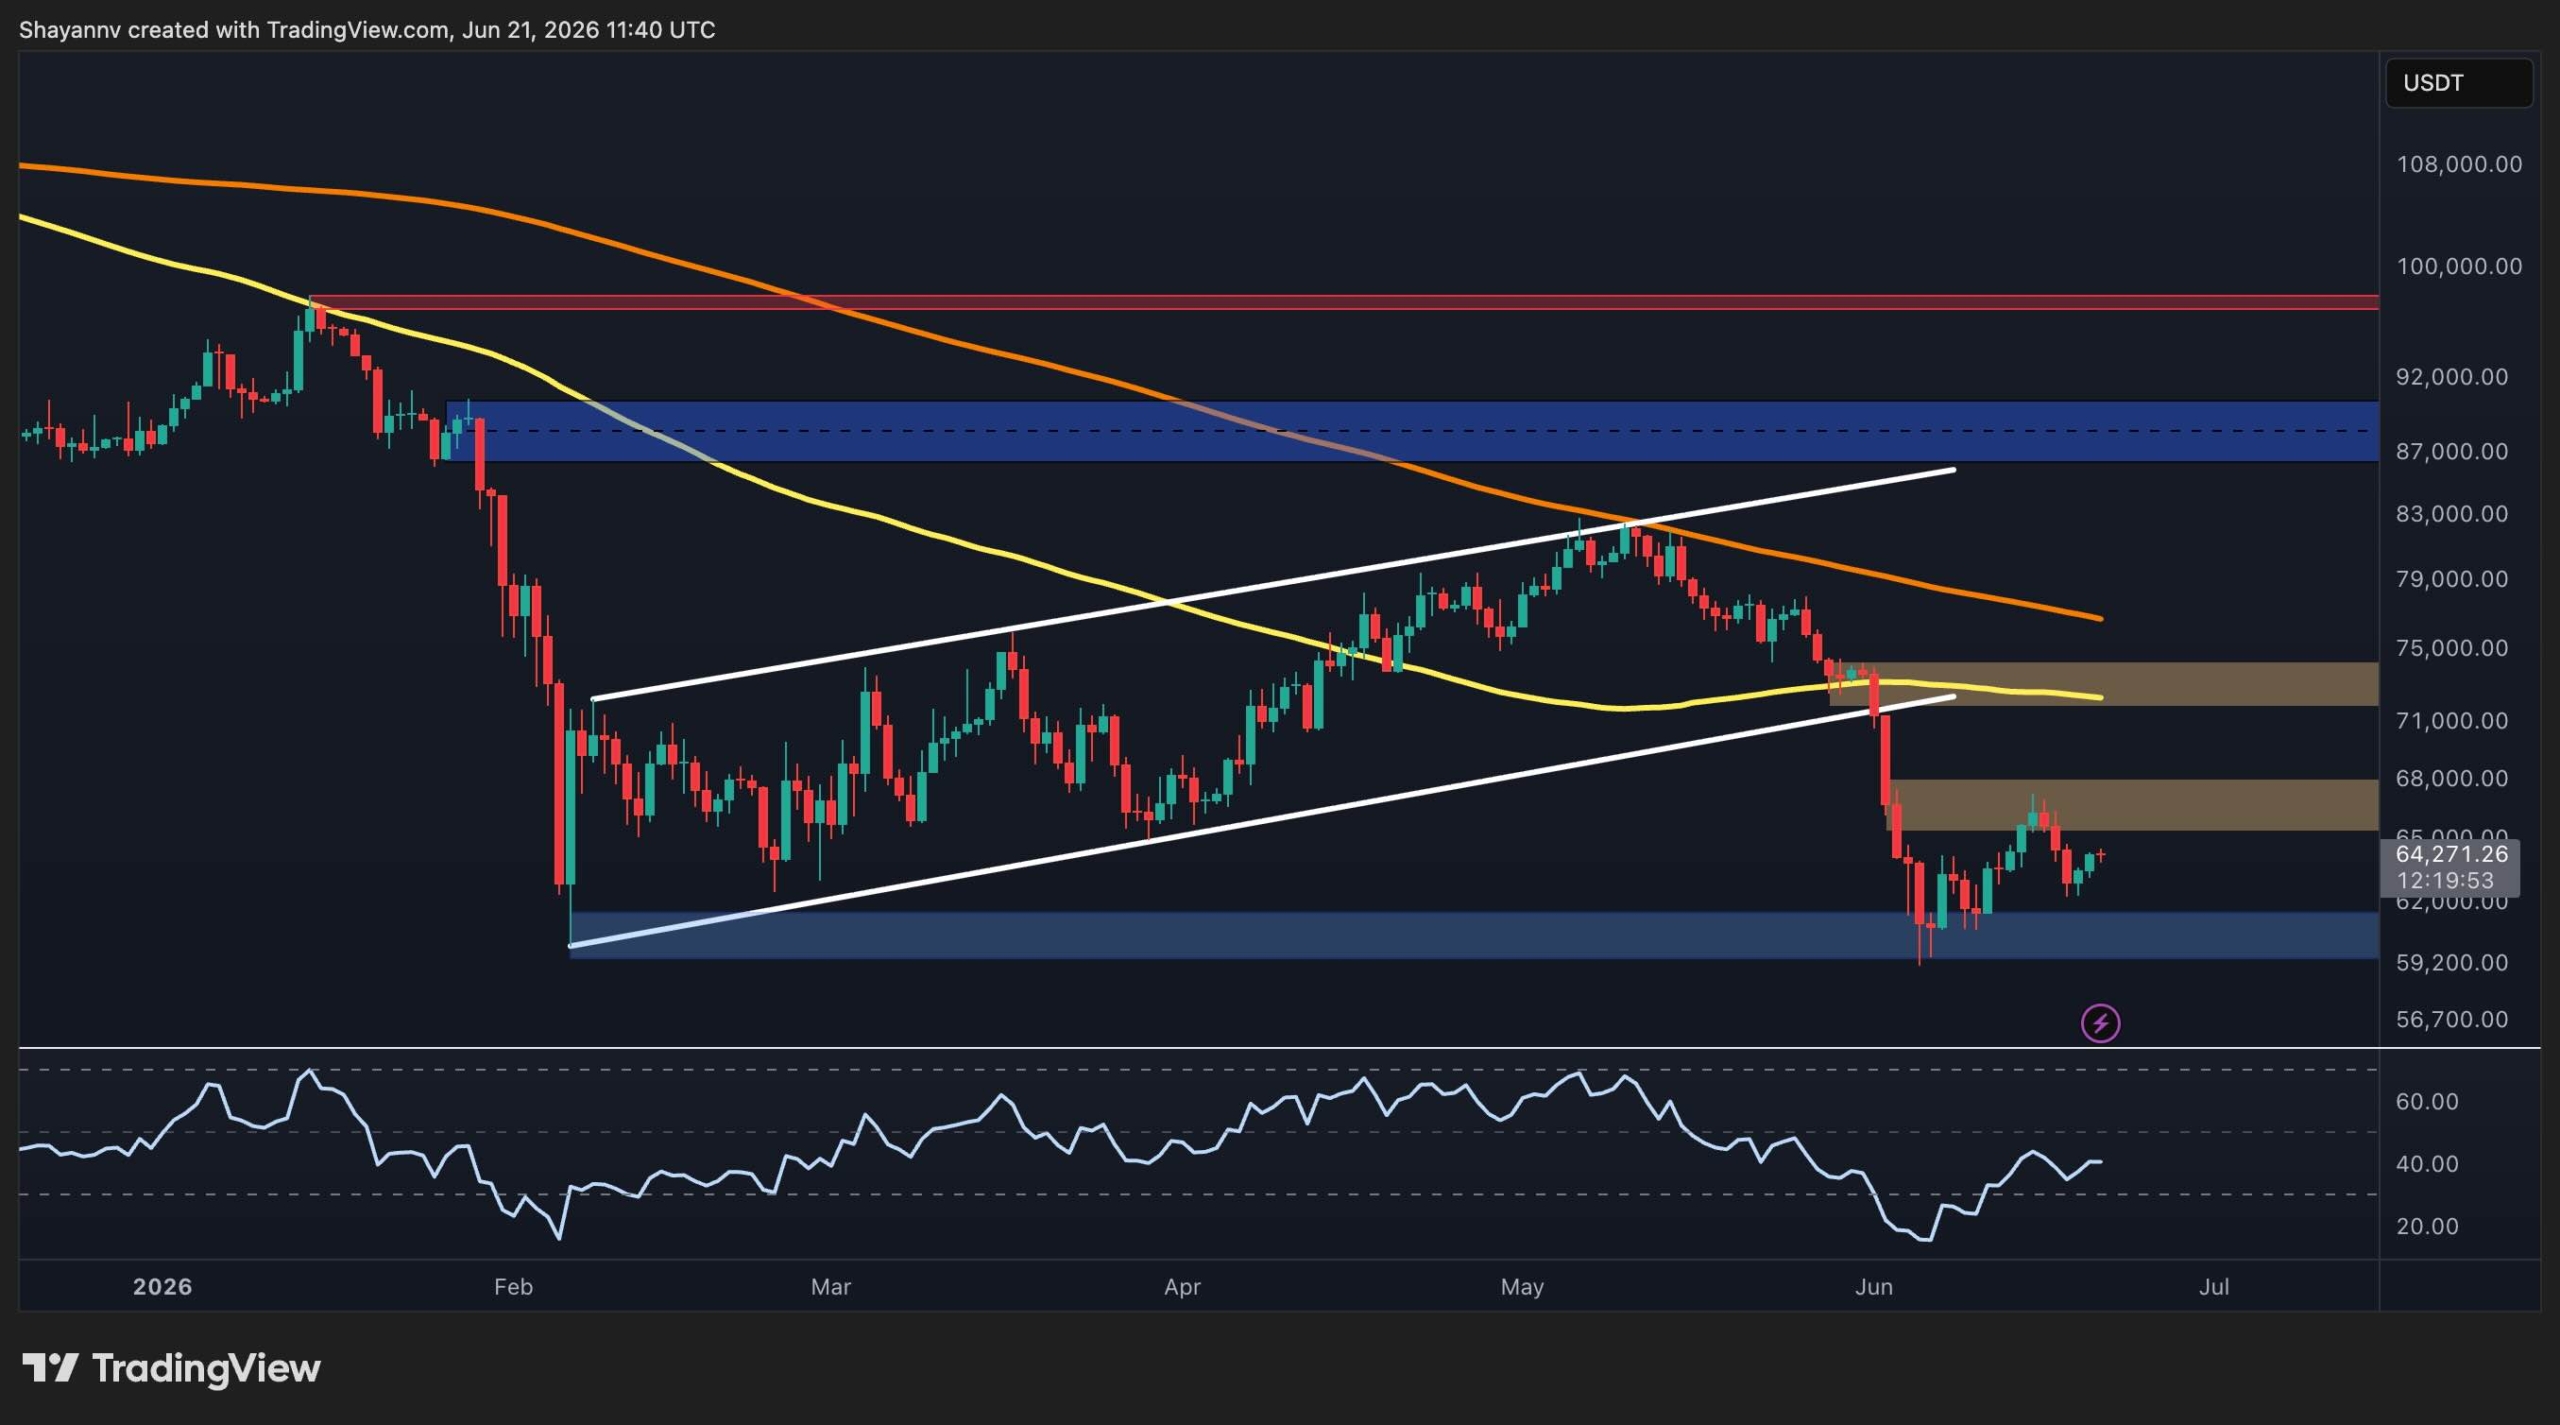
On the daily timeframe, BTC recently confirmed a bearish breakdown below a large ascending channel, accelerating selling pressure and pushing the asset toward the major support zone around $60K, where buyers stepped in and halted the downtrend.
The selloff also drove Bitcoin well below both the 100-day and 200-day moving averages. These MAs are currently positioned around $72K and $76K, respectively. The loss of the 100-day moving average, which was supposed to act as a dynamic support level, signals a significant deterioration in the broader market structure and suggests that sellers continue to control the trend.
Following the sharp decline, BTC found demand near $60K and staged a modest recovery toward the $64K region. However, the rebound remains relatively weak compared to the magnitude of the preceding drop.
The first major resistance now sits between $65K and $68K, where a previous support area has turned into supply. Above that, the more critical resistance zone is located around $72K to $75K, which coincides with the 100-day moving average and the lower boundary of the broken ascending channel. A successful reclaim of this area would be the first indication that the recent breakdown may have been a bear trap.
On the downside, the $60K region remains the most important support level. Losing this zone could expose Bitcoin to a deeper correction toward lower liquidity clusters and potentially trigger another wave of capitulation.
BTC/USDT 4-Hour Chart
The 4-hour timeframe provides a clearer view of the recent breakdown and subsequent consolidation phase. After losing the $72K to $74K support zone, BTC experienced an aggressive selloff toward the $60K demand area. Since then, the price has formed a short-term ascending channel, indicating a corrective recovery rather than a confirmed trend reversal.
However, the recent rejection from the upper boundary of this channel and the subsequent breakdown suggest that bullish momentum remains limited. Although BTC managed to stabilize and reclaim the mid-$64K area, it continues to trade beneath the key resistance block between $65K and $68K.
As long as the price remains below this supply zone, the current rebound appears corrective in nature. A successful breakout above $68K could open the door for a move toward the larger resistance cluster at $72K to $74K. Conversely, another rejection from current levels would increase the probability of a retest of the $60K support zone.
The RSI on the 4-hour chart has recovered into neutral territory, reflecting improving short-term momentum. However, it has not yet entered strongly bullish conditions, which supports the view that the ongoing move remains a relief rally within a broader bearish structure.

Sentiment Analysis
The funding rate chart offers an important insight into current derivatives positioning. Funding rates remained predominantly negative throughout much of the recent decline, indicating that short positions dominated the market during the selloff. This persistent negative funding reflected bearish sentiment and aggressive short exposure as BTC traded lower.
More recently, funding rates have shifted back into positive territory, currently hovering around 0.004. This transition suggests that market participants are gradually rebuilding long exposure following the bounce from the $60K support area.
From a contrarian perspective, the normalization of funding after an extended period of negative readings can be viewed as a constructive development. The market has already undergone a substantial deleveraging event, and the recovery in funding suggests improving confidence among futures traders.
However, the current funding levels remain far below the overheated conditions seen during previous bullish phases. This indicates that while sentiment is improving, leverage remains relatively contained and does not yet confirm the beginning of a sustained uptrend.
Overall, the derivatives data suggest that bearish pressure has eased following the recent liquidation event, but Bitcoin still needs to reclaim the $68K and $72K-$74K resistance zones before a broader bullish recovery can be confirmed. Until then, the rebound from $60K appears more consistent with a relief rally within a weakened market structure.

The post Bitcoin Price Analysis: Here’s BTC’s Most Likely Path This Week appeared first on CryptoPotato.

Daily horoscope June 22, 2026: Predictions for your star sign

Happy Joe’s Pizza launches patriotic menu, sweepstakes for America 250
XRP Holds Key Support After 68% Drop, Traders Eye Next Move


-
Crypto World7 days ago
Zimbabwe Requires Crypto Businesses to Register Annually Under New FIU Regulations
-

 Fashion2 days ago
Weekend Open Thread: Miami – Corporette.com
-
 Crypto World7 days ago
Crude Oil Plunges Over 4% as US-Iran Agreement Reopens Hormuz Strait
-
 Business2 days ago
Wall Street Week Ahead: Investors see Micron earnings as pulse check of AI rally momentum
-

 Crypto World2 days ago
HIVE shares jump as $220M AI deal speeds Bitcoin mining pivot
-

 Tech7 days ago
Over 400 Arch Linux packages compromised to push rootkit, infostealer
-
 Tech5 days ago
The Adder At The Heart Of Intel’s 8087 FPU
-
 Tech7 days ago
Microsoft Updates Six Windows’ Apps. ‘Photos’ Gets Watermarks for Copilot Images (Off by Default)
-

 Sports3 days ago
FIFA World Cup 2026: Canada beat 9-men Qatar 6-0 to register first ever win | FIFA World Cup 2026
-

 Business3 days ago
Brexit cost 6% of UK economy, Bank of England company data suggests
-

 Business1 day ago
Soccer-U.S. defends Iran World Cup travel restrictions, says discussions ongoing
-

 Tech7 days ago
Etzioni on AI: Backlash against AI-generated text mirrors the anti-GMO movement
-
 Tech7 days ago
Chinese AI models are learning to detect safety tests and adjust their behaviour accordingly
-

 Crypto World2 days ago
Jake Chervinsky accuses CME of protecting derivatives monopoly
-

 Tech7 days ago
Today’s NYT Connections Hints, Answers for June 15 #1100
-

 Crypto World4 days ago
Anthropic’s Dario Amodei Urged AI Unity at G7, Even as US Banned His Models
-

 Tech4 days ago
Weeks Of In-The-Field Testing And A Verdict
-

 Tech3 days ago
Adobe adds its AI assistant to Premiere, Illustrator and InDesign
-

 Politics2 days ago
Andy Burnham and the meaning of Makerfield
-

 Entertainment1 day ago
Renter of Home in Anne Heche Crash Denies Settlement With Son
You must be logged in to post a comment Login